Submitted:
12 June 2023
Posted:
12 June 2023
You are already at the latest version
Abstract

Keywords:
1. Introduction
2. Materials and Methods
2.1. Chemicals and Reagents
2.2. Collection of Sample Material
2.3. Preparation of Extract from the Flesh of Tamarind
2.4. Standardization of the Extraction Procedure
2.5. Screening for Phytochemical Content of Prepared Aqueous Extracts
2.5.1. Determinations of total flavonoid content (TFC), total phenolic content (TPC), total proanthocyanidin content (TPrAC), and total antioxidant capacity (TAC) of FRiST, SRiST, FRaST, and FSwT
2.6. GC-MS Analysis of FRiST and FSwT
2.7. Qualitative Identification of Carbohydrates, Proteins, Alkaloids, Glycosides, Tannins, Saponins, Phenolic Compounds, Steroids, Triterpenoids, and Flavonoids
2.8. Experimental Animals and Their Maintenance
2.9. Induction of Hypertension Using Cholesterol
2.9.1. Recording the Animal’S Body Weights and Collection of Blood and Organs
2.9.2. Biochemical Analyses of Serum
2.9.3. Liver Glycogen Estimation
2.9.4. Histopathological Analyses
2.10. Statistical Analysis
2.11. In silico approaches
2.11.1. Molecular Docking Analysis
2.11.2. Evaluation of Pharmacokinetic Parameters
2.11.3. Determination of Toxicological Properties
2.12. Building the Bioactive Compound-Target Protein Network
2.13. Development of the Anticipated Genes' Protein-Protein Interaction (PPI) Networks
2.14. Pathway Enrichment Analysis of the Target Proteins Using Gene Ontology (GO) and the Kyoto Encyclopedia of Genes and Genomes (KEGG)
2.15. Molecular Dynamics (MD) Simulations
3. Results
3.1. Phytochemical Screening
3.2. TFC, TPC, TPrAC, TAC of FRaST, First, FSwT, and SRiST Extracts
3.3. Effect of the Tamarind Products on the Body and Organ Weights of Experimental Animals
3.4. Effects of Tamarind Products on Biochemical Parameters
3.4.1. Effect of the Extracts on Serum Lipid Profile
3.4.2. Effect of the Extracts on Serum Enzyme Activities
3.4.3. Effects of the Extracts on the CRP, Troponin I (cTnI), and Liver Glycogen Levels
3.5. Effect of Tamarind Products on Heart Tissue Architecture of Cholesterol-Induced Rat
3.6. Phytochemical Contents of the Tamarind Extracts
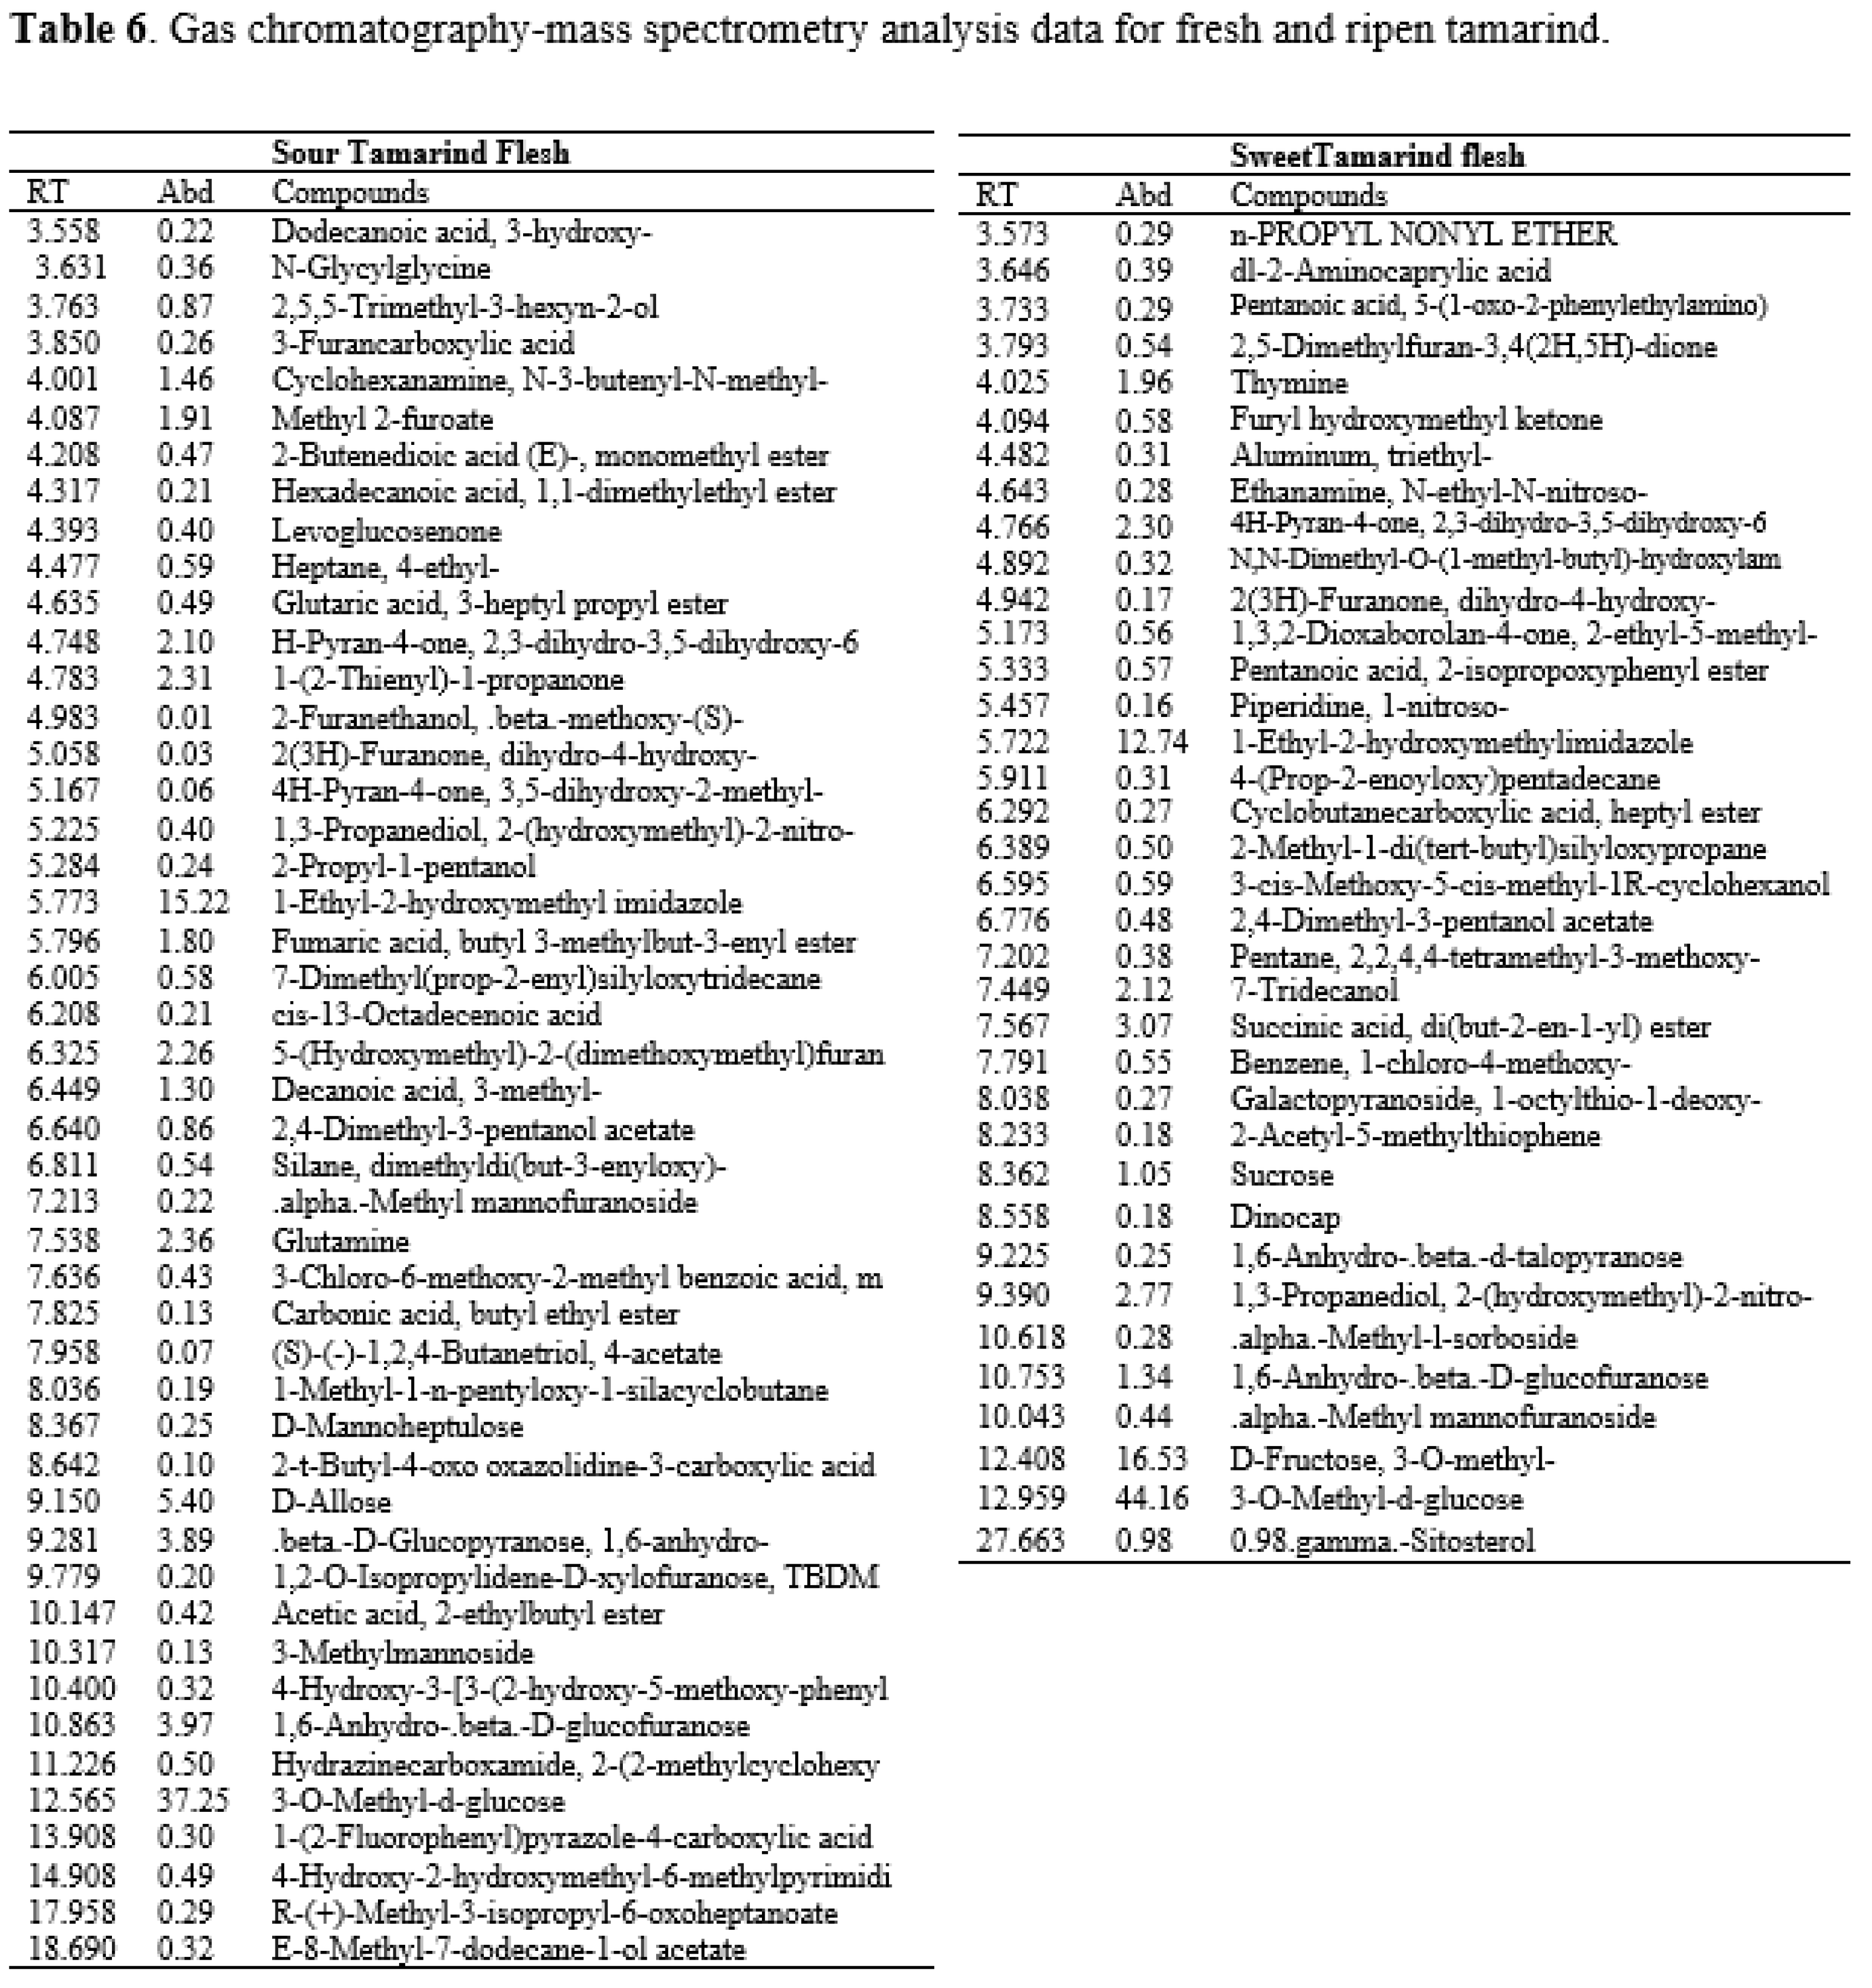
3.7. Impacts of Ligand-Receptor Interactions in In Silico Molecular Docking Analysis
3.7.1. Impacts on Pharmacokinetic and Toxicological Properties
| Tamarind Compounds | Lipinski Rules | Lipinski's Violations (≤ 1) |
Veber Rules | ||||
|---|---|---|---|---|---|---|---|
| MW (< 500) |
HBA (< 10) |
HBD (< 5) |
Log P (≤ 5) |
Nrb (≤ 10) |
TPSA (≤ 140 Å2) |
||
| (1-Ethyl-1H-imidazol-2-yl)methanol | 126.16 | 2 | 1 | 0.21 | 0 | 2 | 38.05 |
| 4H-Pyran-4-one | 144.13 | 4 | 2 | -0.22 | 0 | 0 | 66.76 |
| 2-Furanmethanol,5-(dimethoxymethyl)- | 172.18 | 4 | 1 | 0.60 | 0 | 4 | 51.83 |
| 7-Tridecanol | 200.36 | 1 | 1 | 4.28 | 0 | 10 | 20.23 |
| D-Mannoheptulose | 210.18 | 7 | 6 | -2.65 | 1 | 7 | 107.22 |
| Gamma-sitosterol | 414.71 | 1 | 1 | 7.19 | 1 | 6 | 20.23 |
| Glutamine | 146.14 | 4 | 3 | -1.81 | 0 | 4 | 106.41 |
| 1-(2-Thienyl)-1-propanone | 140.20 | 1 | 0 | 2.03 | 0 | 2 | 45.31 |
| Succinic acid, di(but-2-en-1-yl) ester | 226.27 | 4 | 0 | 2.26 | 0 | 9 | 52.60 |
| 2-(Hydroxymethyl)-2-nitro-1,3-propanediol | 151.12 | 5 | 3 | -1.84 | 0 | 4 | 106.51 |
| Compounds | Parameters | |||
|---|---|---|---|---|
| Ames toxicity | Carcinogens | Acute oral toxicity | Rat Acute Toxicity | |
| (1-Ethyl-1H-imidazole-2-yl)methanol | NAT | NC | III | 2.2439 |
| 4H-Pyran-4-one | AT | NC | III | 1.7885 |
| 2-Furanmethanol,5-(dimethoxymethyl)- | NAT | NC | III | 2.0967 |
| 7-Tridecanol | NAT | C | III | 1.7615 |
| D-Mannoheptulose | NAT | NC | IV | 1.4430 |
| Gamma-sitosterol Glutamine 1-(2-Thienyl)-1-propanone Succinic acid, di(but-2-en-1-yl) ester 2-(Hydroxymethyl)-2-nitro-1,3-propanediol |
NAT NAT NAT NAT NAT |
NC NC NC NC NC |
I IV III III III |
2.6561 1.2587 2.1210 1.8106 2.0756 |
| Binding Affinity | |
|---|---|
| Protein Name | Gamma-sitosterol (Compound ID:457801) |
| Tyrosine Hydroxylase (PDB ID: 1TOH) | -7.6 |
| BETA-1 subunit of the soluble guanylyl cyclase(PDB ID: 3HLS) | -7.6 |
| Human High-conductance Ca2+ gated K+ Channel (BK Channel)(PDB ID: 3NAF) | -7.7 |
| Nuclear hormone receptor PPAR-gamma (PDB ID: 3R8A) | -7.6 |
| Human Angiotensin Receptor (PDB ID: 4YAY) | -9.3 |
| Thermolysin (PDB ID: 5DPF) | -9.6 |
| Macrocyclic IL-17A antagonists (PDB ID: 5HI3) | -9.1 |
| Human soluble guanylate cyclase (PDB ID: 6JT0) | -7 |
3.7.2. Impacts on Drug Candidates Filtering
3.7.3. Common Intersected Targets of Compounds Within GeneCard and SwissTargetPrediction Database
3.8. Impact on PPI Network Analysis of 14 Common Targets
3.8.1. Impact on the Enrichment Analysis of 14 Common Targets
3.8.2. Glucocorticoid Biosynthetic Process
3.9. Molecular Dynamics Simulations

3.9.1. Protein Root Mean Square Deviation (P-RMSD)
3.9.2. Ligand Root Mean Square Deviation (L-RMSD)
3.9.3. Protein-Ligand Contacts
3.9.4. Position of a Ligand Inside the Pocket Side
4. Discussion
Conclusions
Data availability
Funding
Author Contributions:
Acknowledgment
Conflicts of Interest
List of Abbreviations
| C-reactive protein-CRP |
| White blood cell-WBC |
| Lactate Dehydrogenase-LDL |
| High-density lipoprotein-HDL |
| Normal control group-NC |
| Positive control group-PC |
| Total cholesterol-TC |
| Triglyceride-TG |
| Low-density lipoprotein-LDL |
| Very low-density lipoprotein-VLDL |
| Serum Aspartate Aminotransferase-AST |
| Alanine Aminotransferase-ALT |
| Alkaline phosphatase-ALP |
| Gallic acid equivalents-GAE |
| Hypertension-HTN |
| Total Phenolic Content-TPC |
| Total Flavonoid Content-TFC |
| Flesh of Ripen Sour Tamarind = FRiST |
| Seed of Ripen Sour Tamarind = SRiST |
| Flesh of Raw Sour Tamarind = FRaST |
| Flesh of Sweet Tamarind = FSwT |
References
- Cotran, K.C. Cellular Pathology. Robbins Pathologic basis of disease, 1999. [Google Scholar]
- Corless, J.K.; Middleton, H.M. Normal liver function: A basis for understanding hepatic disease. Arch. Intern. Med. 1983, 143, 2291–2294. [Google Scholar] [CrossRef]
- Rahman, S.; Islam, S.; Haque, T. Association between serum liver enzymes and hypertension: A cross-sectional study in Bangladeshi adults. BMC Cardiovasc. Disord. 2020, 20, 128. [Google Scholar] [CrossRef] [PubMed]
- Ernesto, L.; Schifrin, R.M.T. Heart and Circulatory Physiology. Am. J. Physiol. 2004, 287. [Google Scholar] [CrossRef]
- Nandave, M. Protective role of flavonoids in cardiovascular disease. Rev. Artic. Nat. Prod. Radiance 2005, 4, 166–176. [Google Scholar]
- Sies, H. Oxidative stress: Oxidants and antioxidant. Exp. Physiol. 1997, 82, 291–295. [Google Scholar] [CrossRef] [PubMed]
- Prieto, P.; Pineda, M.; Aguilar, M. Spectrophotometric quantitation of antioxidant capacity through the formation of a phosphomolybdenum complex: Specific application to the determination of Vitamin E 1999.
- Kala, C.P. Indigenous uses, population density, and conservation of threatened medicinal plants in protected areas of the Indian Himalayas. Conserv. Biol. 2005, 19, 368–378. [Google Scholar] [CrossRef]
- Kumaran, A.; Karunakaran, R.J. In vitro antioxidant activities of methanol extracts of five Phyllanthus species from India. LWT-Food Sci. Technol. 2007, 40, 344–352. [Google Scholar] [CrossRef]
- Akter, H.; Rashid, M.M.; Islam, M.S.; Hossen, M.A.; Rahman, M.A.; Algheshairy, R.M.; et al. Biometabolites of Tamarindus indica play a remarkable cardioprotective role as a functional food in doxorubicin-induced cardiotoxicity models. J. Funct. Foods 2022, 96, 105212. [Google Scholar] [CrossRef]
- Rincón, C.; Montoya, J.; Gómez, G. Optimizing the extraction of phenolic compounds from Bixa orellana L. and effect of physicochemical conditions on its antioxidant activity. J. Med. Plant Res. 2014, 8, 1333–1339. [Google Scholar]
- Singleton, V.L.; Rossi, J.A. Colorimetry of total phenolics with phosphomolybdic-phosphotungstic acid reagents. Am. J. Enol. Viticult 1965, 16, 144–158. [Google Scholar] [CrossRef]
- Abdelseed, B.H.; Abdalla, A.H. Some Nutritional Attributes of Selected Newly Developed Lines of Sorghum (Sorghum bicolor) after Fermentation. J. Agr. Sci. Tech. 2011, 13, 399–409. [Google Scholar]
- Lo, S.; Russell, J.C.; Taylor, A.W. Determination of glycogen in small tissue samples. J. Appl. Phys. 1970, 28, 234–236. [Google Scholar] [CrossRef]
- Alam, S.; Nasreen, S.; Ahmad, A.; Darokar, M.P.; Khan, F. Detection of natural inhibitors against human liver cancer cell lines through QSAR, molecular docking and ADMET studies. Curr. Top. Med. Chem. 2021, 21, 686–695. [Google Scholar] [CrossRef]
- Aksoydan, B.; Kantarcioglu, I.; Erol, I.; Salmas, R.E.; Durdagi, S. Structure-based design of hERG-neutral antihypertensive oxazalone and imidazolone derivatives. J. Mol. Graph. Model. 2018, 79, 103–117. [Google Scholar] [CrossRef]
- Casimiro-Garcia, A.; Filzen, G.F.; Flynn, D.; Bigge, C.F.; Chen, J.; Davis, J.A.; et al. Discovery of a series of imidazo [4, 5-b] pyridines with dual activity at angiotensin II type 1 receptor and peroxisome proliferator-activated receptor-γ. J. Med. Chem. 2011, 54, 4219–4233. [Google Scholar] [CrossRef]
- Hussein, H.A.; Borrel, A.; Geneix, C.; Petitjean, M.; Regad, L.; Camproux, A.-C. PockDrug-Server: A new web server for predicting pocket druggability on holo and apo proteins. Nucleic Acids Res. 2015, 43, W436–W442. [Google Scholar] [CrossRef]
- Hussain, J.; Rehman, N.; Al-Harrasi, A.; Ali, L.; Ullah, R.; Mabood, F. Nutritional prospects and mineral compositions of selected vegetables from Dhoda sharif – Kohat. J. Med. Plant Res. 2011. [Google Scholar] [CrossRef]
- Lipinski, C.A.; Lombardo, F.; Dominy, B.W.; Feeney, P.J. Experimental and computational approaches to estimate solubility and permeability in drug discovery and development settings. Adv. Drug Deliv. Rev. 1997, 23, 3–25. [Google Scholar] [CrossRef]
- Veber, D.F.; Johnson, S.R.; Cheng, H.-Y.; Smith, B.R.; Ward, K.W.; Kopple, K.D. Molecular properties that influence the oral bioavailability of drug candidates. J. Med. Chem. 2002, 45, 2615–2623. [Google Scholar] [CrossRef] [PubMed]
- Yang, H.; Lou, C.; Sun, L.; Li, J.; Cai, Y.; Wang, Z.; et al. admetSAR 2.0, web-service for prediction and optimization of chemical ADMET properties. Bioinformatics 2019, 35, 1067–1069. [Google Scholar] [CrossRef] [PubMed]
- Shaw, D.E.; Adams, P.J.; Azaria, A.; Bank, J.A.; Batson, B.; Bell, A.; et al. Anton 3, twenty microseconds of molecular dynamics simulation before lunch. Proc. Int. Conf. High Perform. Comput. Netw. Storage Anal., 2021, p. 1–11.
- Thangavel, N.; Al Bratty, M.; Al Hazmi, H.A.; Najmi, A.; Ali Alaqi, R.O. Molecular docking and molecular dynamics aided virtual search of OliveNetTM directory for secoiridoids to combat SARS-CoV-2 infection and associated hyperinflammatory responses. Front. Mol. Biosci. 2021, 7, 627767. [Google Scholar] [CrossRef]
- Sukati, S.; Sama-ae, I.; Katzenmeier, G.; Wisessombat, S. Evaluation of Susceptibility of the Human Pathogen Helicobacter pylori to the Antibiotic Capreomycin. Sci. World J. 2022, 2022, 8924023. [Google Scholar] [CrossRef]
- Aier, I.; Varadwaj, P.K.; Raj, U. Structural insights into conformational stability of both wild-type and mutant EZH2 receptor. Sci. Rep. 2016, 6, 1–10. [Google Scholar] [CrossRef]
- Das, M.; Devi, K.P.; Belwal, T.; Devkota, H.P.; Tewari, D.; Sahebnasagh, A.; et al. Harnessing polyphenol power by targeting eNOS for vascular diseases. Crit. Rev. Food Sci. Nutr. 2023, 63, 2093–2118. [Google Scholar] [CrossRef]
- Curin, Y.; Andriantsitohaina, R. Polyphenols as potential therapeutical agents against cardiovascular diseases. Pharmacol. Rep. 2005, 57, 97. [Google Scholar] [PubMed]
- Singh, R.; Singh, S.; Kumar, S.; Arora, S. Evaluation of antioxidant potential of ethyl acetate extract/fractions of Acacia auriculiformis A. Cunn Food Chem. Toxicol. 2007, 45, 1216–1223. [Google Scholar] [CrossRef] [PubMed]
- Graf, B.L.; Raskin, I.; Cefalu, W.T.; Ribnicky, D.M. Plant-derived therapeutics for the treatment of metabolic syndrome. Curr. Opin. Investig. Drugs 2010, 11, 1107–1115. [Google Scholar] [PubMed]
- Feringa, H.H.H.; Laskey, D.A.; Dickson, J.E. Coleman The effect of grape seed extract on cardiovascular risk markers: A meta-analysis of randomized controlled trials. Am Diet Assoc 2011, 111, 1173–1181. [Google Scholar] [CrossRef] [PubMed]
- Fisher, N.D.L.; Hughes, M.; Gerhard-Herman, M. Hollenberg Flavanol-rich cocoa induces nitric-oxide-dependent vasodilation in healthy humans. Hypertens 2003, 21, 2281–2286. [Google Scholar] [CrossRef] [PubMed]
- Fernández, K.J. Labra Simulated digestion of proanthocyanidins in grape skin and seed extracts and the effects of digestion on the angiotensin I-converting enzyme (ACE. Inhib. Act. Food Chem. 2013, 139, 196–202. [Google Scholar] [CrossRef]
- Ottaviani, J.I.; Actis-Goretta, L.; Villordo, J.J.; CG. Fraga Procyanidin structure defines the extent and specificity of angiotensin I converting enzyme inhibition. Biochimie 2006, 88, 3–4. [Google Scholar] [CrossRef]
- Pons, Z.; Guerrero, L.; Margalef, M.; Arola, L.; Arola-Arnal, A.B. Muguerza Effect of low molecular grape seed proanthocyanidins on blood pressure and lipid homeostasis in cafeteria diet-fed rats. J. Physiol. Biochem. 2014, 70, 629–637. [Google Scholar] [CrossRef]
- Terra, X.; Palozza, P.; Fernandez, J.; Larrea, A.; Ardevol, C.; Blade, G.; et al. Blay Procyanidin dimer B1 and trimer C1 impair inflammatory response signalling in human monocytes. Free Radic. Res. 2011, 45, 611–619. [Google Scholar] [CrossRef]
- Bourvellec, C.L.; Boas, P.B.V.; Lepercq, P.; Comtet, S.; Marre, P.A.; Ruiz, P.; et al. Mosoni Procyanidin-Cell Wall Interactions within Apple Matrices Decrease the Metabolization of Procyanidins by the Human Gut Microbiota and the Anti-Inflammatory Effect of the Resulting Microbial Metabolome In Vitro. Nutrients 2019, 11, 664. [Google Scholar] [CrossRef]
- Kanamoto, Y.; Yamashita, Y.; Nanba, F.; Yoshida, T.; Tsuda, T.; Fukuda, I.; et al. Ashida A black soybean seed coat extract prevents obesity and glucose intolerance by up-regulating uncoupling proteins and down-regulating inflammatory cytokines in high-fat diet-fed mice. J. Agric. Food Chem. 2011, 59, 8985–8993. [Google Scholar] [CrossRef] [PubMed]
- Ren, J.; An, J.; Chen, M.; Yang, H.; Ma, Y. Effect of proanthocyanidins on blood pressure: A systematic review and meta-analysis of randomized controlled trials. Pharmacol. Res. 2021, 165, 105329. [Google Scholar] [CrossRef] [PubMed]
- Duarte, J.; Pérez-Vizcaíno, F.; Utrilla, M.P.; Jiménez, J.; Tamargo, J.; Zarzuelo, A. Vasodilatory effects of flavonoids in rat aortic smooth muscle. Struct-Act. Relatsh. Gen. Pharmacol. 1993, 24, 857–864. [Google Scholar] [CrossRef] [PubMed]
- Hollman, P.C.H.; Trijp, J.M.P.; Buysman, M.N.C.P.; Gaag, M.S.; Mengelers, M.J.B.; Vries, J.H.M.; et al. Relative bioavalability of the antioxidant flavonoid quercetin from various foods in man. FEBS Lett. 1997, 418, 152–156. [Google Scholar] [CrossRef] [PubMed]
- Stanley, J. Dietary cholesterol, blood cholesterol and cardiovascular disease. Lipid Technol. 2010, 22, 110–112. [Google Scholar] [CrossRef]
- Vinué, Á.; Herrero-Cervera, A.; González-Navarro, H. Understanding the impact of dietary cholesterol on chronic metabolic diseases through studies in rodent models. Nutrients 2018, 10, 939. [Google Scholar] [CrossRef]
- Shivshankar, P.; Shyamala Devi, C.S. Evaluation of costimulatory effects of Tamarindus indica L. on MNU-induced colonic cell proliferation. Food Chem. Toxicol. 2004, 42, 1237–1244. [Google Scholar] [CrossRef]
- Martinello, F.; Soares, S.M.; Franco, J.J.; Santos, A.C.; Sugohara, A.; Garcia, S.B.; et al. Hypolipemic and antioxidant activities from Tamarindus indica L. pulp fruit extract in hypercholesterolemic hamsters. Food Chem. Toxicol. 2006, 44, 810–818. [Google Scholar] [CrossRef]
- Assmann, G.; Gotto, A.M. HDL cholesterol and protective factors in atherosclerosis. Circulation 2004, 109, 8–14. [Google Scholar] [CrossRef]
- Kolawole, O.T.; Kolawole, S.O.; Ayankunle, A.A.; Olaniran, O.I. Methanol leaf extract of Persea americana protects rats against cholesterol-induced hyperlipidemia. Br. J. Med. Med. Res. 2012, 2, 235–242. [Google Scholar] [CrossRef]
- Yokozawa, T.; Cho, E.J.; Sasaki, S.; Satoh, A.; Okamoto, T.; Sei, Y. The protective role of Chinese prescription Kangen-karyu extract on diet-induced hypercholesterolemia in rats. Biol. Pharm. Bull. 2006, 29, 760–765. [Google Scholar] [CrossRef] [PubMed]
- Music, M.; Dervisevic, A.; Pepic, E.; Lepara, O.; Fajkic, A.; Ascic-Buturovic, B. Metabolic syndrome and serum liver enzymes level at patients with type 2 diabetes mellitus. Med. Arch. 2015, 69, 251–255. [Google Scholar] [CrossRef] [PubMed]
- Vernon, G.; Baranova, A.; Younossi, Z. Systematic review: The epidemiology and natural history of non-alcoholic fatty liver disease and non-alcoholic steatohepatitis in adults. Aliment. Pharmacol. Ther. 2011, 34, 274–285. [Google Scholar] [CrossRef] [PubMed]
- Han, S.H.; Nicholls, S.J.; Sakuma, I.; Zhao, D.; Koh, K.K. Hypertriglyceridemia and Cardiovascular Diseases: Revisited. Korean Circ. J. 2016, 46, 135–144. [Google Scholar] [CrossRef] [PubMed]
- Hong, Z.F.; Zhao, W.X.; Yin, Z.Y.; Xie, C.R.; Xu, Y.P.; Chi, X.Q. Capsaicin Enhances the Drug Sensitivity of Cholangiocarcinoma through the Inhibition of Chemotherapeutic-Induced Autophagy. PLoS ONE 2015, 10, e0121538. [Google Scholar] [CrossRef] [PubMed]
- López-Suárez, A.; Guerrero, J.M.R.; Elvira-González, J.; Beltrán-Robles, M.; Cañas-Hormigo, F.; Bascuñana-Quirell, A. Nonalcoholic fatty liver disease is associated with blood pressure in hypertensive and nonhypertensive individuals from the general population with normal levels of alanine aminotransferase. Eur. J. Gastroenterol. Hepatol. 2011, 23, 1011–1017. [Google Scholar] [CrossRef] [PubMed]
- Eslami, S.; Sahebkar, A. Glutathione-S-transferase M1 and T1 null genotypes are associated with hypertension risk: A systematic review and meta-analysis of 12 studies. Curr. Hypertens. Rep. 2014, 16, 432. [Google Scholar] [CrossRef]
- Musso, G.; Gambino, R.; Michieli, F.; Durazzo, M.; Pagano, G.; Cassader, M. Adiponectin gene polymorphisms modulate acute adiponectin response to dietary fat: Possible pathogenetic role in NASH. Hepatol. Balt. Md. 2008, 47, 1167–1177. [Google Scholar] [CrossRef]
- Touyz, R.M. Reactive oxygen species, vascular oxidative stress, and redox signaling in hypertension: What is the clinical significance? Hypertension 2004, 44, 248–252. [Google Scholar] [CrossRef]
- Mansego, M.L.; Solar, G.D.M.; Alonso, M.P.; Martínez, F.; Sáez, G.T.; Escudero, J.C.M. Polymorphisms of antioxidant enzymes, blood pressure and risk of hypertension. J. Hypertens. 2011, 29, 492–500. [Google Scholar] [CrossRef]
- Sachdewa, A.; Khemani, L.D. Effect of Hibiscus rosasinensis L ethanol flower extract on blood glucose and lipid profile in streptozotocin- induced diabetes in rats. J. Ethnopharmacol. 2003, 89, 61–66. [Google Scholar] [CrossRef]
- SB, K. Histological structure of pancreas in normal control, diabetic control and extract treated Albino rats. Int. J. Life Sci. 2016, 4, 78–82. [Google Scholar]
- Hage, F.G. C-reactive protein and hypertension. J. Hum. Hypertens 2014, 28, 410–415. [Google Scholar] [CrossRef] [PubMed]
- Lemos, J.A.; Drazner, M.H.; Omland, T.; Ayers, C.R.; Khera, A.; Rohatgi, A.; et al. Association of troponin T detected with a highly sensitive assay and cardiac structure and mortality risk in the general population. JAMA 2010, 304, 2503–2512. [Google Scholar] [CrossRef] [PubMed]
- Yokohama, S.; Yoneda, M.; Haneda, M.; Okamoto, S.; Okada, M.K.A. Therapeutic efficacy of an angiotensin II receptor antagonist in patients with nonalcoholic steatohepatitis. Hepatology 2004, 40, 1222–1225. [Google Scholar] [CrossRef] [PubMed]
- Azab, H.A.; El-Nady, A.M.; Hamed, M.A.; Ahmed, I.T. Potentiometric determination of the dissociation constants of glycylglycine in various aquo-organic media. J. Chin. Chem. Soc. 1995, 42, 769–777. [Google Scholar] [CrossRef]
- Usa, K.; Liu, Y.; Geurts, A.M.; Cheng, Y.; Lazar, J.; Baker, M.A.; et al. The antihyperlipidemic effect of N. sativa seed extract may be attributed to the synergistic effect of its different constituents, soluble fiber, sterols, flavenoids and high content of polyunsaturated fatty acids n.d.
- Milara, J.; Ballester, B.; Morell, A.; Ortiz, J.L.; Escrivá, J.; Fernández, E.; et al. JAK2 mediates lung fibrosis, pulmonary vascular remodelling and hypertension in idiopathic pulmonary fibrosis: An experimental study. Thorax 2018, 73, 519–529. [Google Scholar] [CrossRef] [PubMed]
- Ross, S.; Eikelboom, J.; Anand, S.S.; Eriksson, N.; Gerstein, H.C.; Mehta, S.; et al. Association of cyclooxygenase-2 genetic variant with cardiovascular disease. Eur. Heart J. 2014, 35, 2242–2248. [Google Scholar] [CrossRef] [PubMed]
- Smyth, L.J.; Cañadas-Garre, M.; Cappa, R.C.; Maxwell, A.P.; McKnight, A.J. Genetic associations between genes in the renin-angiotensin-aldosterone system and renal disease: A systematic review and meta-analysis. BMJ Open 2019, 9, e026777. [Google Scholar] [CrossRef]
- Mukherjee, S.; Banerjee, S.K.; Maulik, M.; Dinda, A.K.; Talwar, K.K.; Maulik, S.K. Protection against acute adriamycin-induced cardiotoxicity by garlic: Role of endogenous antioxidants and inhibition of TNF-α expression. BMC Pharmacol. 2003, 3, 1–9. [Google Scholar] [CrossRef]
- Berg, A.H.; Drechsler, C.; Wenger, J.; Buccafusca, R.; Hod, T.; Kalim, S.; et al. Carbamylation of serum albumin as a risk factor for mortality in patients with kidney failure. Sci. Transl. Med. 2013, 6, 175ra29. [Google Scholar] [CrossRef] [PubMed]
- Lindberg, U.H.A.; Akerman, S.B.A. Novel glycylglycine amides. Google Patents;
- Yoshiji, H.; Kuriyama, S.; Yoshii, J.; Ikenaka, Y.; Noguchi, R.T.N. Angiotensin-II type 1 receptor interaction is a major regulator for liver fibrosis development in rats. Hepatology 2001, 34, 745–750. [Google Scholar] [CrossRef]
- Ramsay, L.E. Liver dysfunction in hypertension. Lancet 1977, 2, 111–114. [Google Scholar] [CrossRef]
- Pinzi, L.; Rastelli, G. Molecular docking: Shifting paradigms in drug discovery. Int. J. Mol. Sci. 2019, 20, 4331. [Google Scholar] [CrossRef]
- Derbyshire, E.R.; Marletta, M.A. Structure and regulation of soluble guanylate cyclase. Annu. Rev. Biochem. 2012, 81, 533–559. [Google Scholar] [CrossRef]
- Buys, E.S.; Potter, L.R.; Pasquale, L.R.; Ksander, B.R. Regulation of intraocular pressure by soluble and membrane guanylate cyclases and their role in glaucoma. Front. Mol. Neurosci. 2014, 7, 38. [Google Scholar] [CrossRef]
- Andrade, E.L.; Bento, A.F.; Cavalli, J.; Oliveira, S.K.; Schwanke, R.C.; Siqueira, J.M.; et al. Non-clinical studies in the process of new drug development-Part II: Good laboratory practice, metabolism, pharmacokinetics, safety and dose translation to clinical studies. Braz. J. Med. Biol. Res. 2016, 49, e5646. [Google Scholar] [CrossRef] [PubMed]
- Hopkins, A.L. Network pharmacology: The next paradigm in drug discovery. Nat. Chem. Biol. 2008, 4, 682–690. [Google Scholar] [CrossRef] [PubMed]
- Li, Q.; Gao, T.; Yuan, Y.; Wu, Y.; Huang, Q.; Xie, F.; et al. Association of CYP17A1 genetic polymorphisms and susceptibility to essential hypertension in the southwest Han Chinese population. Med. Sci. Monit. Int. Med. J. Exp. Clin. Res. 2017, 23, 2488. [Google Scholar] [CrossRef] [PubMed]
- van Dijk, E.H.; Schellevis, R.L.; van Bergen, M.G.; Breukink, M.B.; Altay, L.; Scholz, P.; et al. Association of a haplotype in the NR3C2 gene, encoding the mineralocorticoid receptor, with chronic central serous chorioretinopathy. JAMA Ophthalmol. 2017, 135, 446–451. [Google Scholar] [CrossRef] [PubMed]
- Wang, Y.; Zheng, Y.; Zhang, W.; Yu, H.; Lou, K.; Zhang, Y.; et al. Polymorphisms of KDR gene are associated with coronary heart disease. J. Am. Coll. Cardiol. 2007, 50, 760–767. [Google Scholar] [CrossRef] [PubMed]
- Xie, X.; Shi, X.; Xun, X.; Rao, L. Endothelial nitric oxide synthase gene single nucleotide polymorphisms and the risk of hypertension: A meta-analysis involving 63,258 subjects. Clin. Exp. Hypertens. 2017, 39, 175–182. [Google Scholar] [CrossRef] [PubMed]
- Chistiakov, D.A.; Voronova, N.V.; Chistiakova, E.I. Identification of new susceptibility genes for type 1 diabetes: An update. Curr. Immunol. Rev. 2008, 4, 116–133. [Google Scholar] [CrossRef]
- Rahman, T.; Avery, P.J.; Mayosi, B.M.; Watkins, H.; Keavney, B. Association between HSD11B1 polymorphism and left ventricular mass in families with hypertension. BMJ Publishing Group. Ltd. and British Cardiovascular Society;
- Li, W.; Liu, C. The− 344C/T polymorphism in the CYP11B2 gene is associated with essential hypertension in the Chinese. J. Renin Angiotensin Aldosterone Syst. 2014, 15, 150–155. [Google Scholar] [CrossRef]
- Zhang, M.; Zhang, J.; Li, L.; Wang, Q.; Feng, L. Association between peroxisome proliferator-activated receptor γ-2 gene Pro12Ala polymorphisms and risk of hypertension: An updated meta-analysis. Biosci. Rep. 2019, 39, BSR20190022. [Google Scholar] [CrossRef]
- Smith, K.A.; Waypa, G.B.; Dudley, V.J.; Budinger, G.S.; Abdala-Valencia, H.; Bartom, E.; et al. Role of hypoxia-inducible factors in regulating right ventricular function and remodeling during chronic hypoxia–induced pulmonary hypertension. Am. J. Respir. Cell Mol. Biol. 2020, 63, 652–664. [Google Scholar] [CrossRef]
- Kosicka, K.; Siemiątkowska, A.; Szpera-Goździewicz, A.; Krzyścin, M.; Bręborowicz, G.H.; Główka, F.K. Increased cortisol metabolism in women with pregnancy-related hypertension. Endocrine 2018, 61, 125–133. [Google Scholar] [CrossRef]
- Patel, G.C.; Liu, Y.; Millar, J.C.; Clark, A.F. Glucocorticoid receptor GRβ regulates glucocorticoid-induced ocular hypertension in mice. Sci. Rep. 2018, 8, 1–13. [Google Scholar]
- Hakhoe, T.S.; Hakhoe, T.Y.; Health, N.I. The Korean journal of physiology & pharmacology: Official journal of the Korean Physiological Society and the Korean Society of Pharmacology. 1997.
- Prasad, R.; Singh, U.K.; Mishra, O.P.; Jaiswal, B.P.; Muthusami, S. Portal hypertension with visceral leishmaniasis. Indian. Pediatr. 2010, 47, 965–967. [Google Scholar] [CrossRef]
- Yu, Y.-D.; Hou, W.-J.; Zhang, J.; Xue, Y.-T.; Li, Y. Network pharmacology and molecular docking-based analysis on bioactive anticoronary heart disease compounds in Trichosanthes kirilowii maxim and bulbus allii macrostemi. Evid. Based Complement. Alternat Med. 2021, 2021, 6704798. [Google Scholar] [CrossRef] [PubMed]
- Bentley-Lewis, R.; Seely, E.; Dunaif, A. Ovarian hypertension: Polycystic ovary syndrome. Endocrinol. Metab. Clin. 2011, 40, 433–449. [Google Scholar] [CrossRef]
- Lankhorst, S.; Saleh, L.; Danser, A.J.; van den Meiracker, A.H. Etiology of angiogenesis inhibition-related hypertension. Curr. Opin. Pharmacol. 2015, 21, 7–13. [Google Scholar] [CrossRef] [PubMed]
- Brooks, K.; Burns, G.; Spencer, T.E. Biological roles of hydroxysteroid (11-beta) dehydrogenase 1 (HSD11B1), HSD11B2, and glucocorticoid receptor (NR3C1) in sheep conceptus elongation. Biol. Reprod. 2015, 93, 1–12. [Google Scholar] [CrossRef]
- Yadegari, M.; Sellami, M.; Riahy, S.; Mirdar, S.; Hamidian, G.; Saeidi, A.; et al. Supplementation of Adiantum capillus-veneris modulates alveolar apoptosis under hypoxia condition in Wistar rats exposed to exercise. Medicina (Mex) 2019, 55, 401. [Google Scholar] [CrossRef]
- Reguengo, L.M.; Salgaço, M.K.; Sivieri, K.; Júnior, M.R.M. Agro-industrial by-products: Valuable sources of bioactive compounds. Food Res. Int. 2022, 152, 110871. [Google Scholar] [CrossRef]
- Karplus, M.; Petsko, G.A. Molecular dynamics simulations in biology. Nature 1990, 347, 631–639. [Google Scholar] [CrossRef] [PubMed]
- Selvaraj, C.; Sakkiah, S.; Tong, W.; Hong, H. Molecular dynamics simulations and applications in computational toxicology and nanotoxicology. Food Chem. Toxicol. 2018, 112, 495–506. [Google Scholar] [CrossRef] [PubMed]
- Elhady, S.S.; Abdelhameed, R.F.; Malatani, R.T.; Alahdal, A.M.; Bogari, H.A.; Almalki, A.J.; et al. Molecular docking and dynamics simulation study of hyrtios erectus isolated scalarane sesterterpenes as potential SARS-CoV-2 dual target inhibitors. Biology 2021, 10, 389. [Google Scholar] [CrossRef] [PubMed]
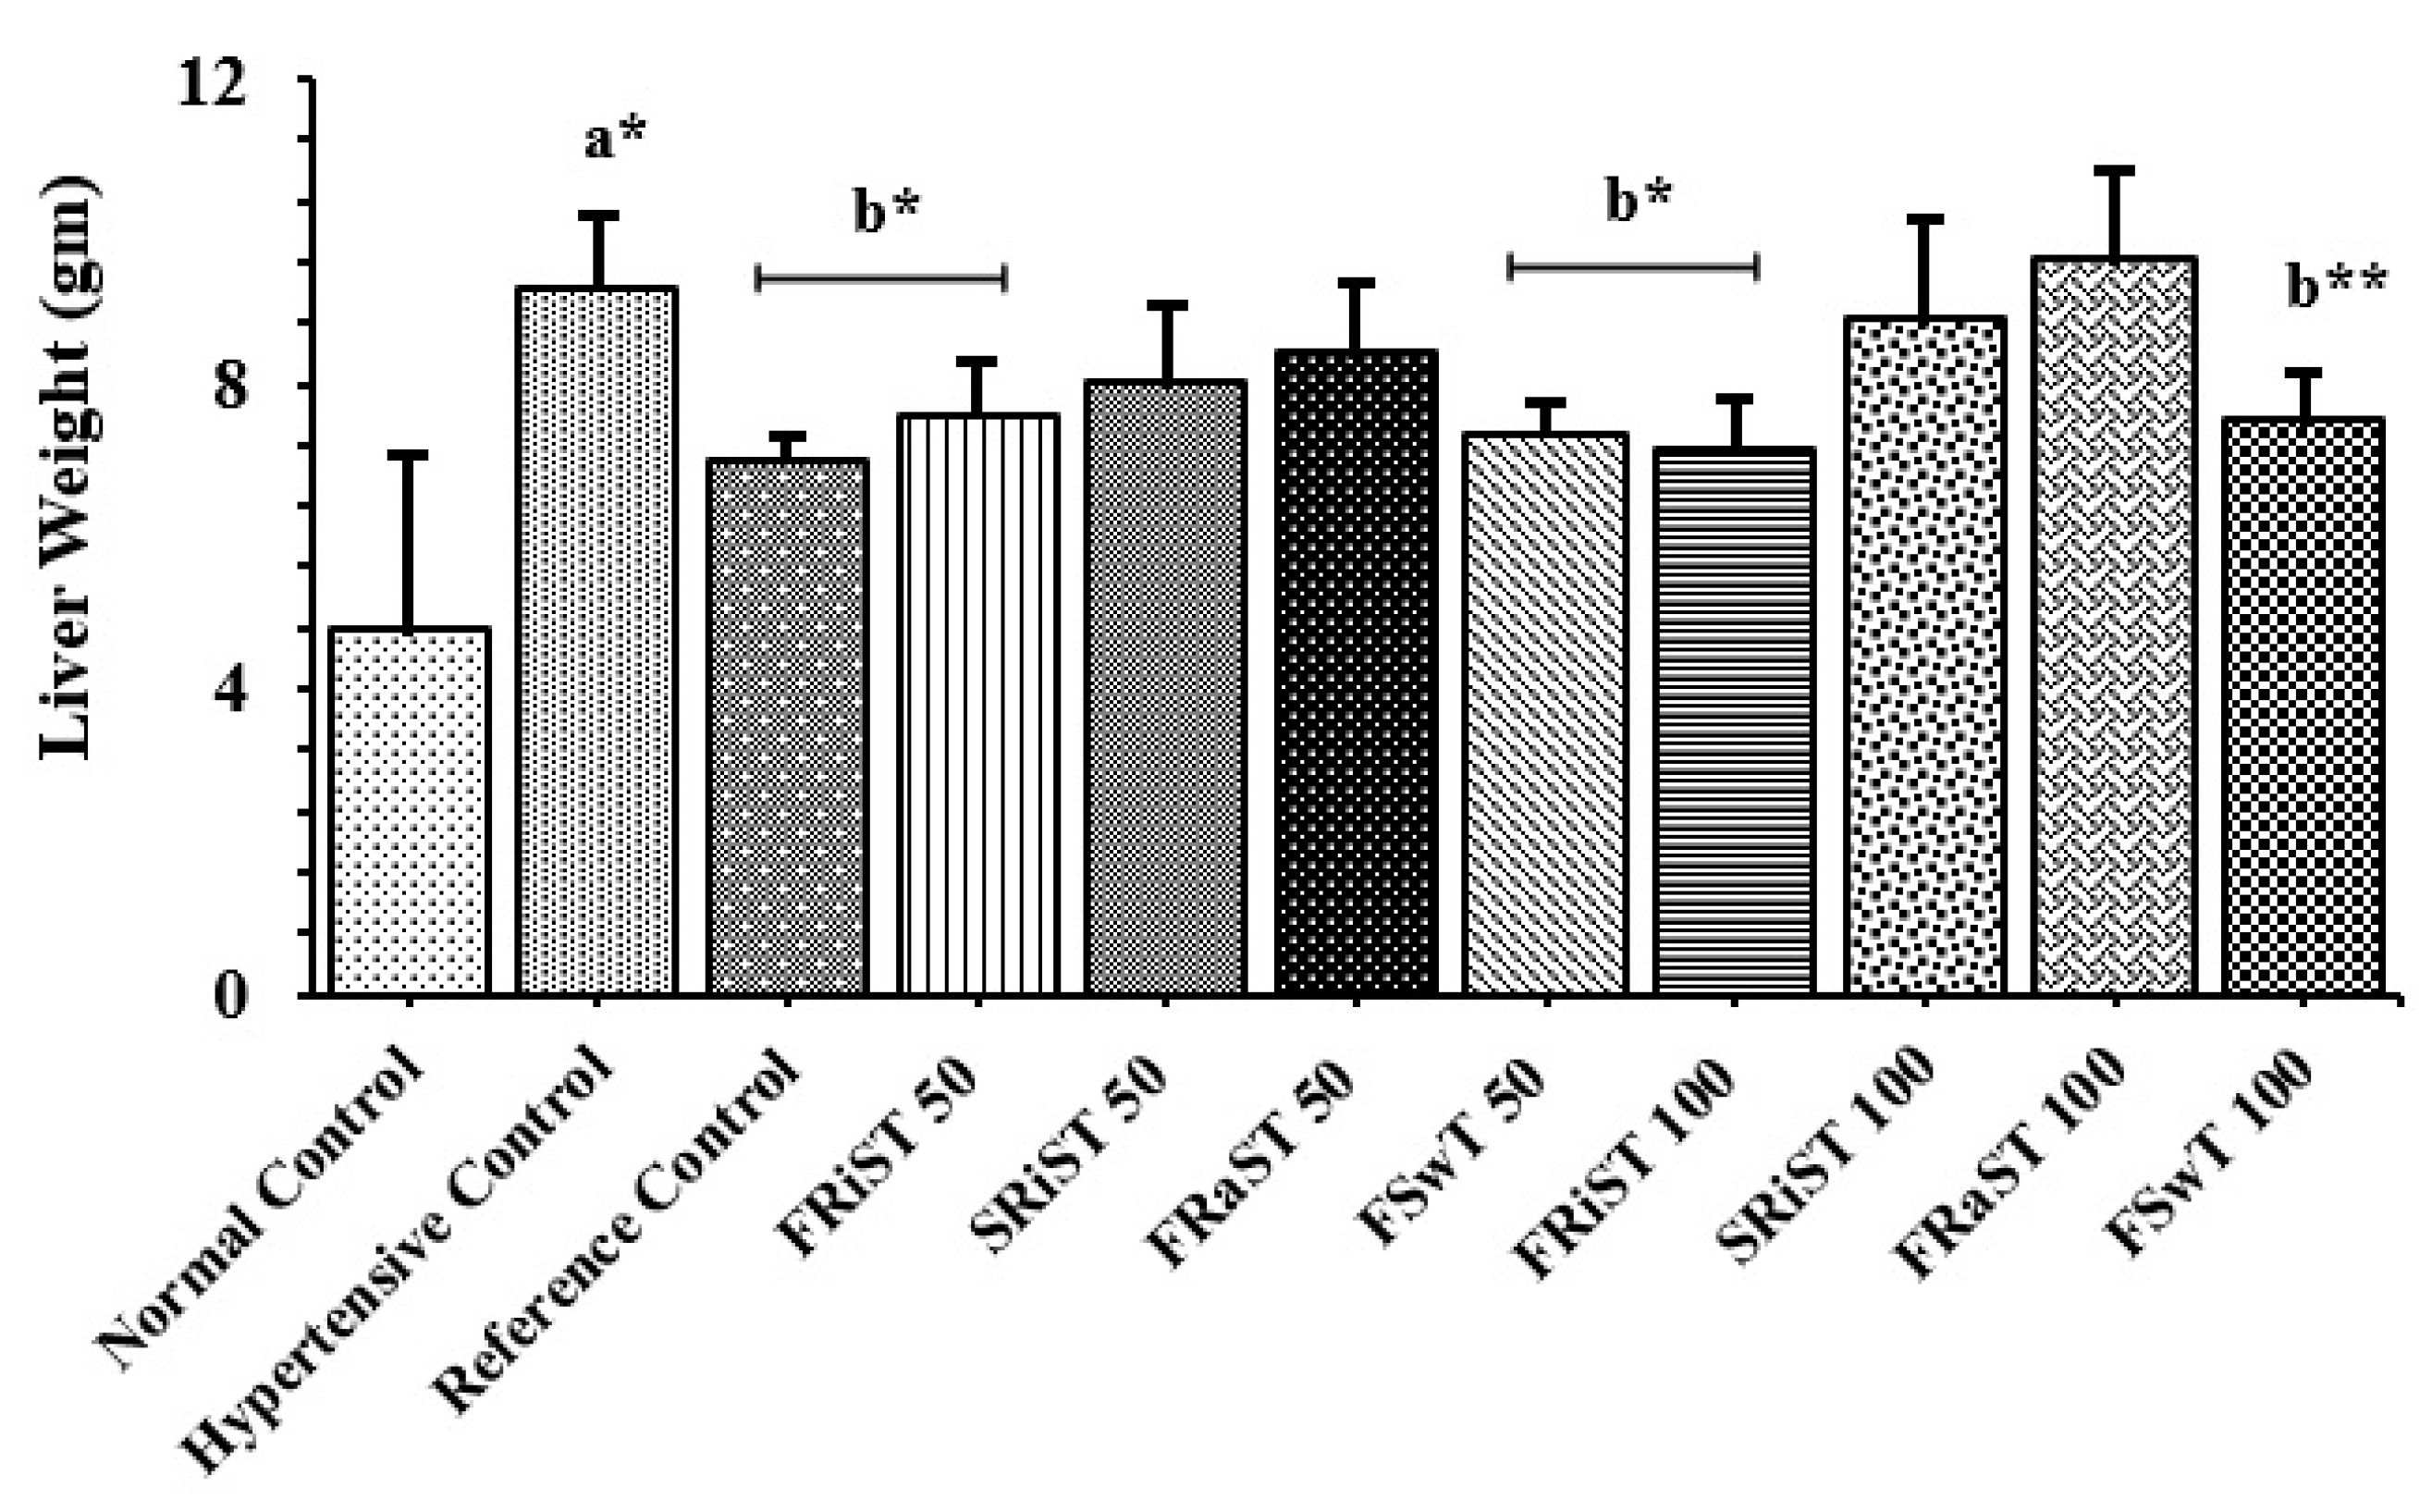
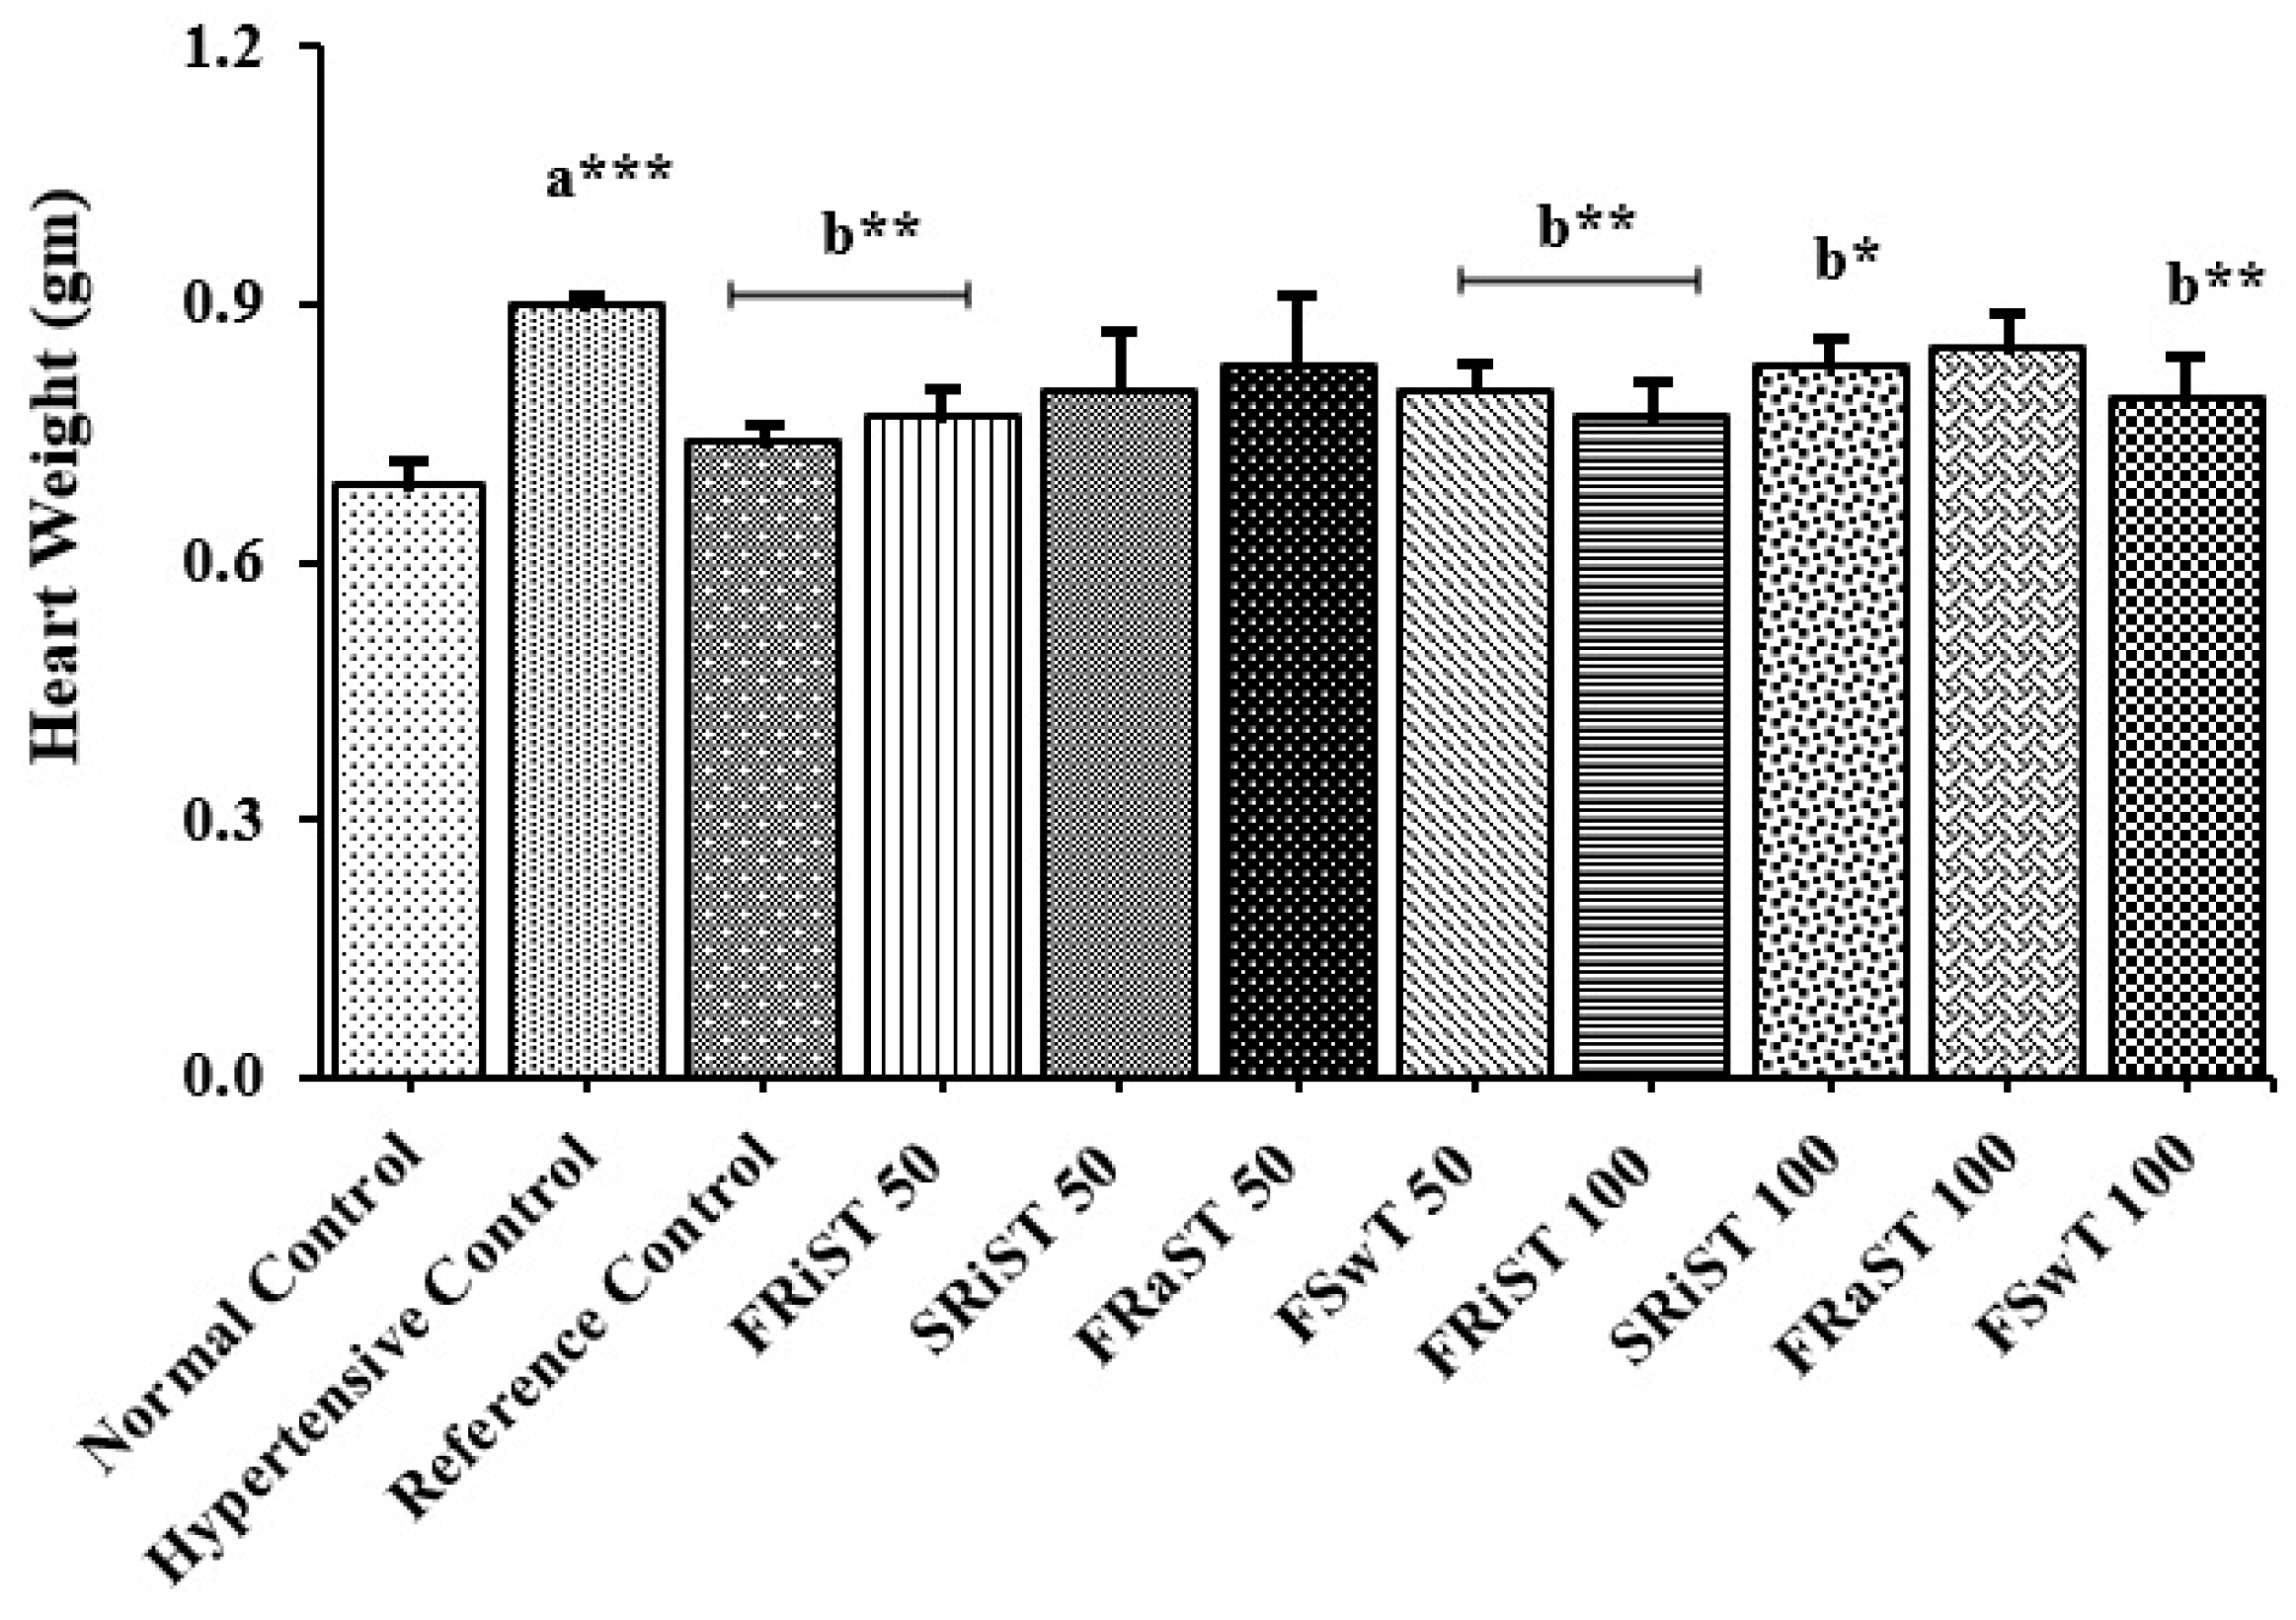
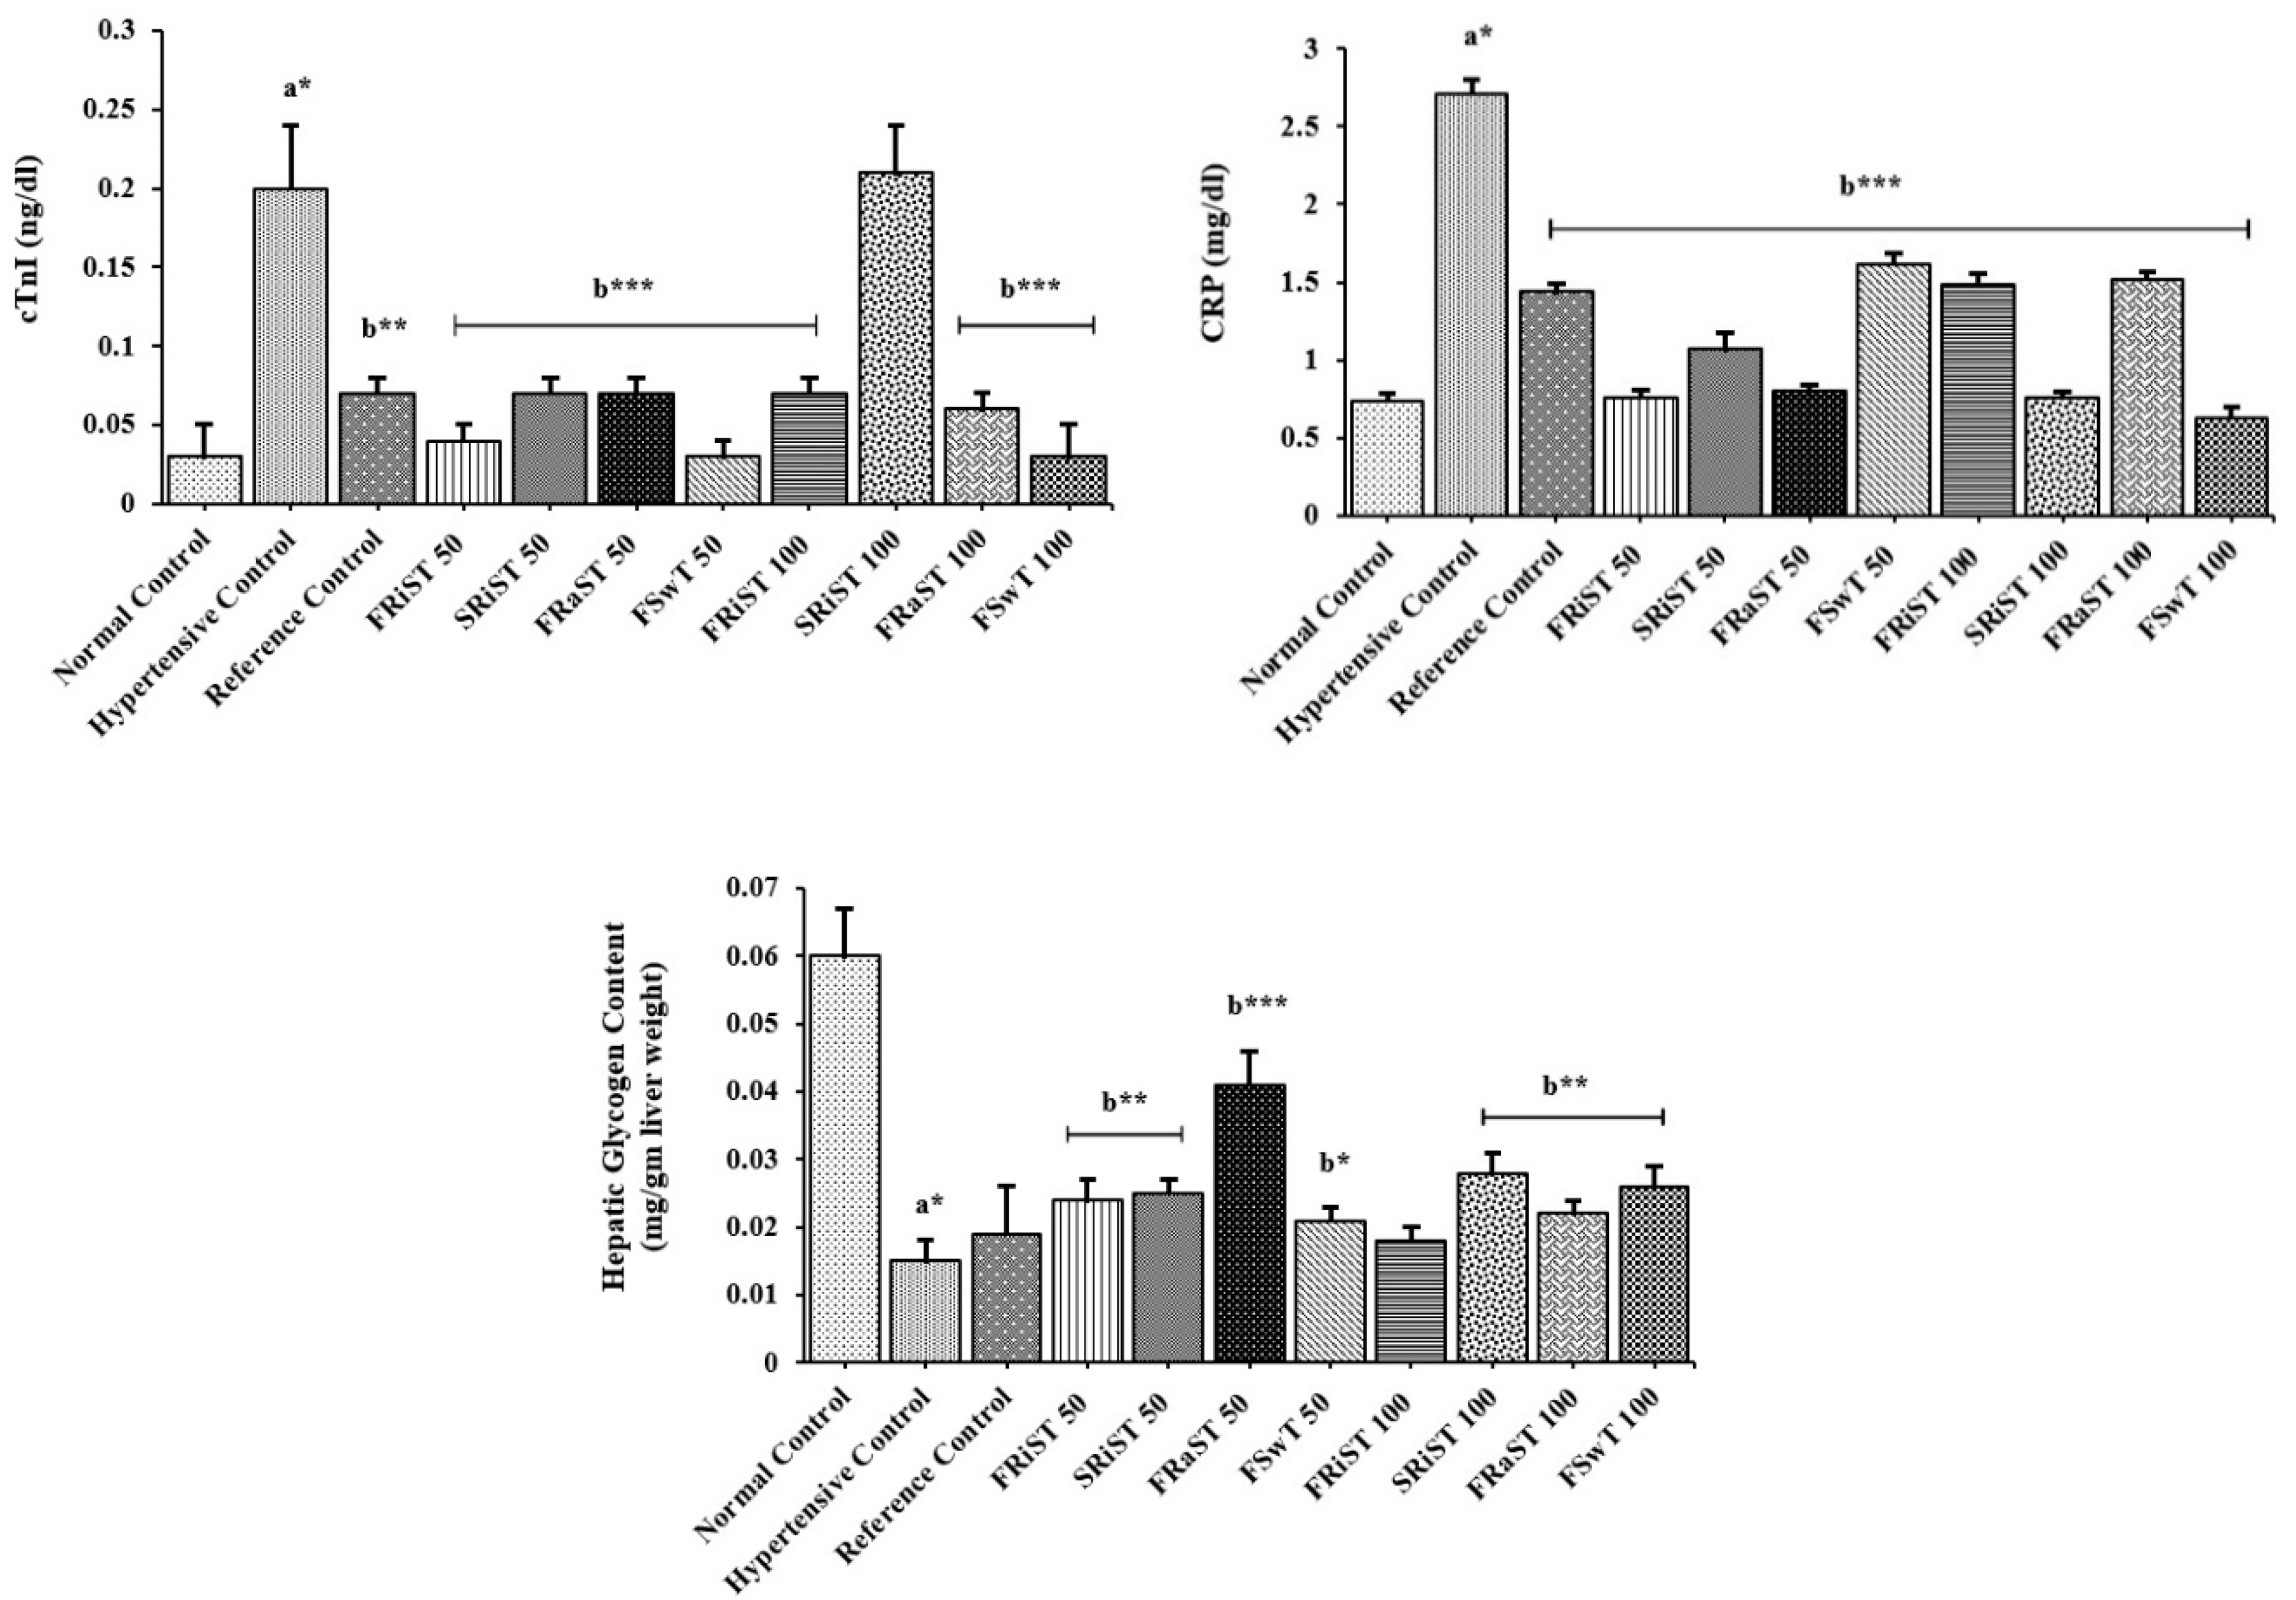
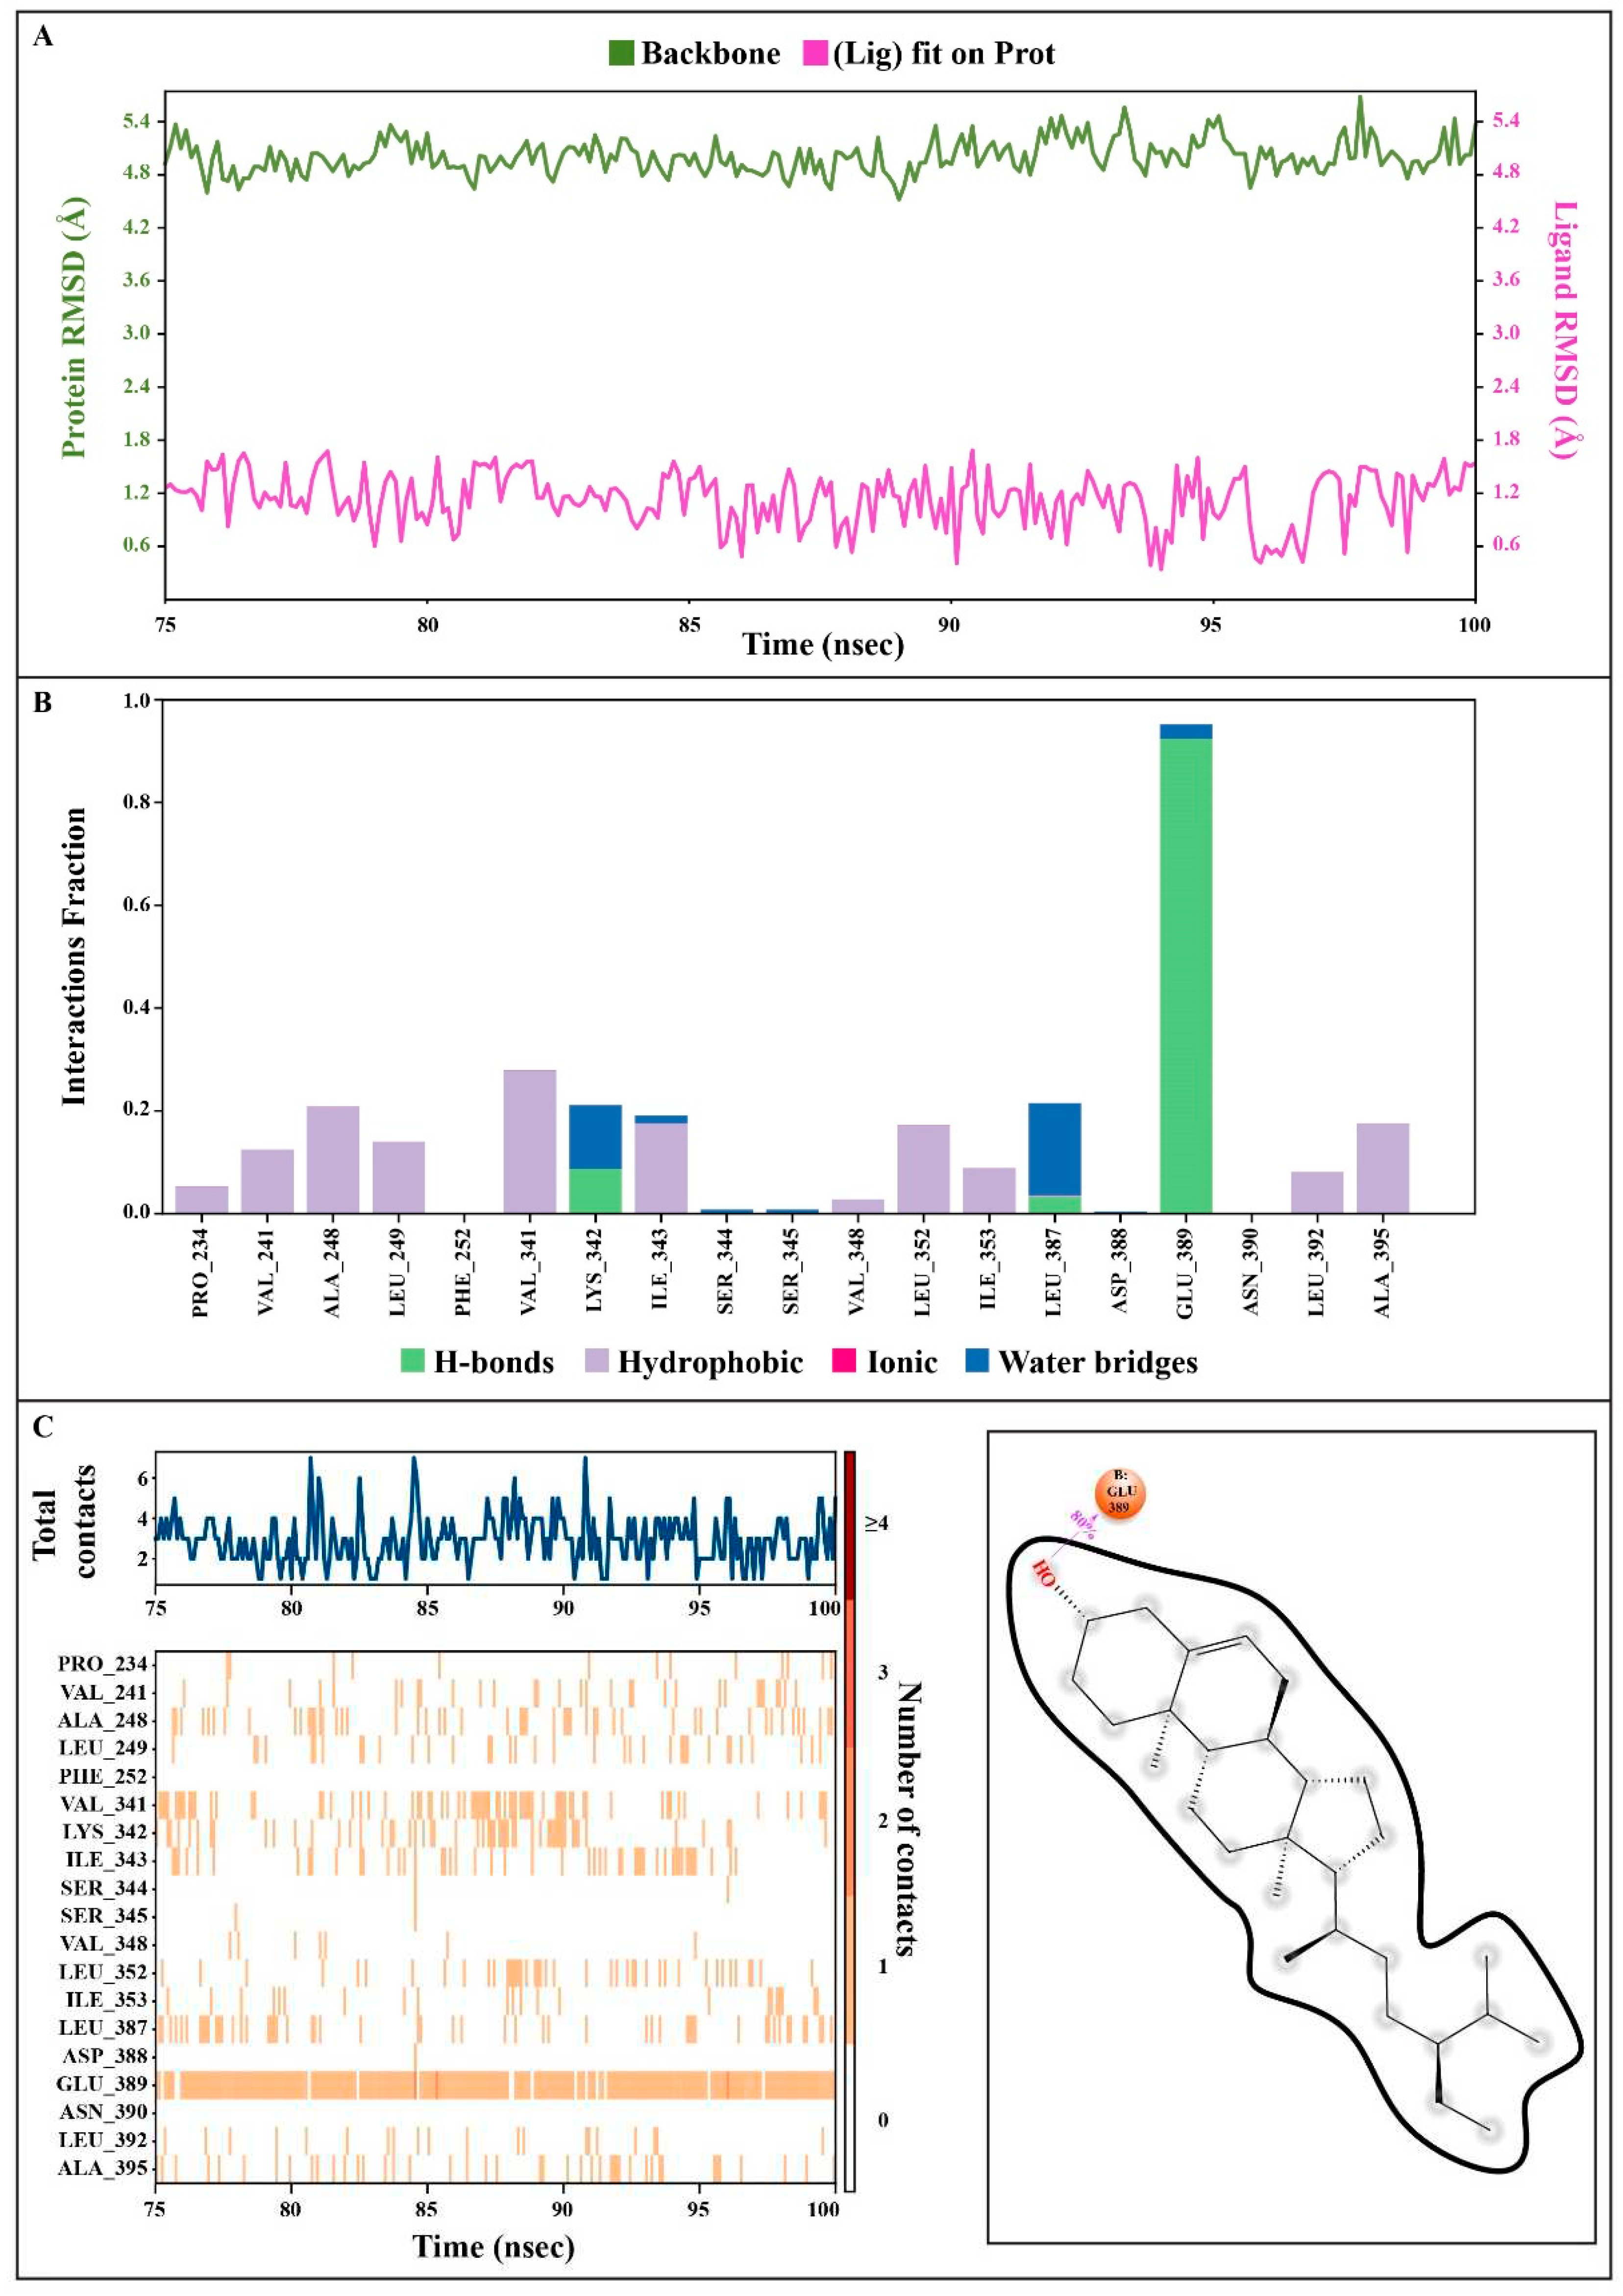
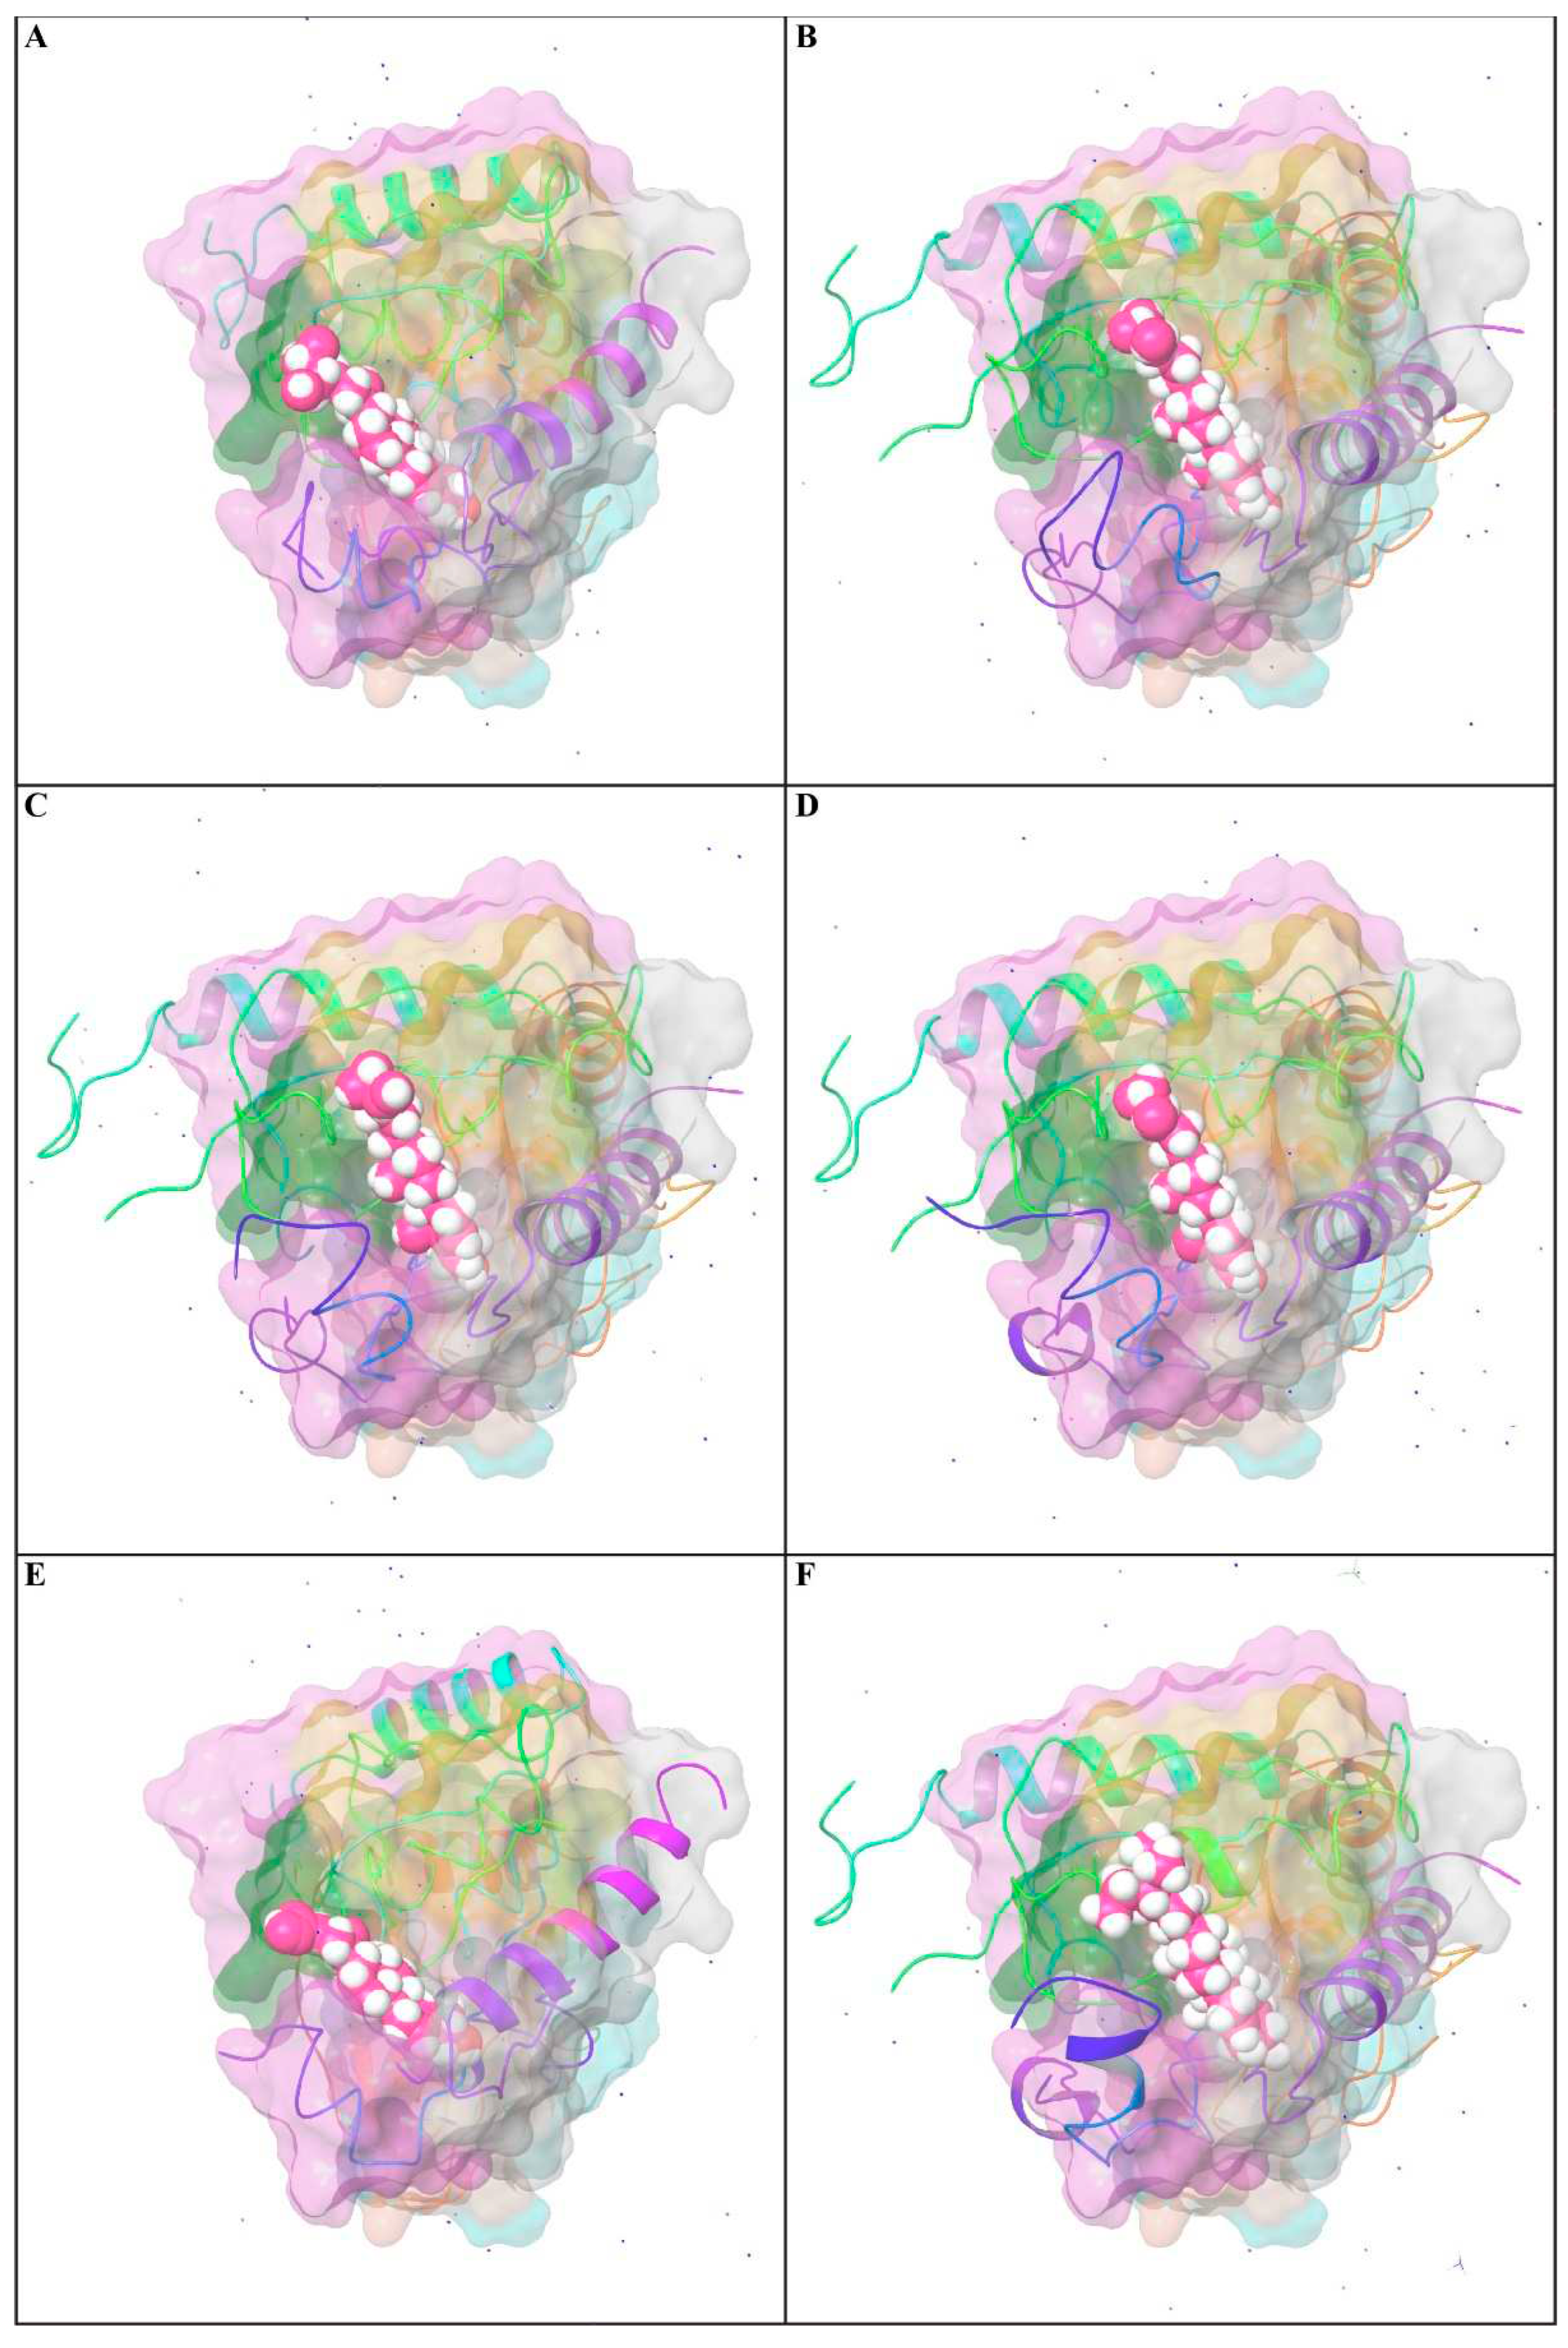
| Tests | Biochemical test | Observation | Result |
|---|---|---|---|
| Carbohydrate | Fehling’s test | Brick-red PPT | + |
| Protein | Biuret test (Piotrowski's test) | A purple color | + |
| Alkaloid | Wagner’s test | Reddish-brown PPT | + |
| Glycoside | Keller-Kiliani Test | No color formation | - |
| Tannins | Lead acetate test | White PPT | + |
| Phenols | Lead acetate test | White PPT | + |
| Saponins | Froth test | Froth formation | + |
| Steroids | Salkowski’s test | Red color | + |
| Terpenoids | Salkowski’s test | Reddish brown color | + |
| Flavonoids | Alkaline Reagent Test | Light Yellow color | + |
| Sterol test | - |
| Parts of TIFAE | TFC, RE (mg/g) | TPC, GAE (mg/g) |
TPrAC, Catechin (mg/g) | TAC, Catechin (mg/g) |
|---|---|---|---|---|
| FRiST | 95.33 ± 1.39 | 185.81 ± 0.55 | 26.63 ± 0.09 | 62.91 ± 2.46 |
| SRiST | 173.76 ± 0.74 | 63.54 ± 0.22 | 84.41 ± 4.98 | 56.66 ± 1.46 |
| FRaST | 133.50 ± 1.17 | 236.16 ± 0.60 | 153.86 ± 1.97 | 62.91 ± 0.97 |
| FSwT | 115.47 ± 0.56 | 240.94 ± 0.52 | 45.52 ± 1.48 | 181.63 ± 1.78 |
| Groups | Week 1 (g) | (%) of Change | Week 2 (g) | (%) of Change |
|---|---|---|---|---|
| Normal Control | 209.60 ± 1.91 | - | 210.64 ± 2.14 | 1.64 ± 0.87 |
| Hypertensive Control | 244.61 ± 3.24a*** | 16.72 ± 2.48 | 265.15 ± 3.58a*** | 26.51 ± 1.92 |
| Reference Control | 221.69 ± 2.82b*** | 5.78 ± 1.58 | 228.15 ± 2.76b*** | 8.86 ± 1.48 |
| FRiST 50 | 229.63 ± 1.93b*** | 9.56 ± 1.20 | 232.96 ± 2.60b*** | 11.15 ± 1.57 |
| SRiST 50 | 236.54 ± 1.12b* | 12.86 ± 0.63 | 248.43 ± 2.59b*** | 18.53 ± 0.54 |
| FRaST 50 | 241.12 ± 2.34 | 15.05 ± 1.92 | 246.93 ± 2.18b** | 17.83 ± 1.91 |
| FSwT 50 | 234.74 ± 1.62b* | 12.00 ± 0.46 | 243.13 ± 2.16b*** | 16.00 ± 0.48 |
| FRiST 100 | 230.61 ± 4.94b* | 10.04 ± 2.78 | 238.94 ± 4.77b*** | 14.00 ± 2.26 |
| SRiST 100 | 237.57 ± 2.07b* | 13.35 ± 1.18 | 251.63 ± 3.92b** | 20.05 ± 1.38 |
| FRaST 100 | 243.08 ± 2.19b* | 15.99 ± 1.88 | 256.33 ± 3.40b* | 22.31 ± 2.52 |
| FSwT 100 | 235.68 ± 3.48b* | 12.45 ± 1.55 | 246.13 ± 2.50b*** | 17.43 ± 0.92 |
| Groups | Cholesterol (mg/dL) |
Triglycerides (mg/dL) | LDL (mg/dL) |
HDL (mg/dL) |
VLDL (mg/dL) |
|---|---|---|---|---|---|
| Normal Control | 38.17 ± 4.17 | 51.57 ± 2.59 | 6.76 ± 0.39 | 47.14 ± 0.57 | 14.91 ± 0.76 |
| Hypertensive Control | 81.59 ± 5.13a*** | 86.38 ± 2.49a*** | 33.56 ± 3.10a*** | 31.24 ± 0.68a** | 21.27 ± 0.61a*** |
| Reference Control | 58.19 ± 6.18b** | 55.16 ± 2.65b*** | 15.77 ± 1.55b*** | 48.42 ± 0.74b*** | 17.73 ± 0.55b*** |
| FRiST 50 | 39.64 ± 6.71b** | 75.87 ± 1.56b** | 8.22 ± 0.36b*** | 50.48 ± 0.80b*** | 13.92 ± 0.56b*** |
| FRiST 100 | 46.12 ± 5.30b*** | 73.35 ± 3.27b*** | 10.53 ± 1.14b*** | 51.28 ± 0.68b*** | 18.63 ± 1.45b* |
| SRiST 50 | 45.58 ± 5.72b** | 62.11 ± 2.97b*** | 8.68 ± 0.30b*** | 46.60 ± 0.72b*** | 11.34 ± 0.71b*** |
| SRiST 100 | 41.23 ± 4.17b*** | 62.19 ± 5.75b** | 9.22 ± 0.71b*** | 50.42 ± 0.88b*** | 10.73 ± 0.53b*** |
| FRaST 50 | 52.43 ± 9.60b** | 58.84 ± 3.71b*** | 9.01 ± 0.41b*** | 44.33 ± 0.80b*** | 10.79 ± 0.89b*** |
| FRaST 100 | 65.51 ± 6.22b*** | 95.48 ± 15.30 | 10.72 ± 1.52b*** | 51.50 ± 0.94b*** | 21.44 ± 2.47 |
| FSwT 50 | 68.34 ± 3.28b* | 62.28 ± 4.64b*** | 11.89 ± 1.27b*** | 49.27 ± 2.16b*** | 12.37 ± 0.93b*** |
| FSwT 100 | 42.83 ± 9.40b** | 59.75 ± 4.53b*** | 6.43 ± 0.46b*** | 52.47 ± 2.24b*** | 15.37 ± 0.70b*** |
| Groups | ALT (IU/L) | AST (IU/L) | ALP (IU/L) |
|---|---|---|---|
| Normal Control | 56.26 + 1.73 | 48.29 + 8.35 | 361.33 + 4.36 |
| Hypertensive Control | 297.59 + 12.06a*** | 166.77 + 5.78a*** | 582.93 + 8.06a*** |
| Reference Control | 128.94 + 4.65b*** | 60.06 + 3.24b*** | 466.73 + 4.13b*** |
| FRiST50 | 120.44 + 5.01b*** | 54.98 + 3.44b*** | 451.53 + 6.31b*** |
| FRiST100 | 187.84 + 4.46b*** | 98.97 + 3.37b*** | 291.85 + 5.33b*** |
| SRiST50 | 129.22 + 5.94b*** | 64.58 + 3.94b*** | 222.83 + 5.18b*** |
| SRiST100 | 147.86 + 3.20b*** | 70.01 + 3.03b*** | 273.86 + 4.13b*** |
| FRaST50 | 145.14 + 4.32b*** | 69.26 + 2.84b*** | 385.07 + 5.45b*** |
| FRaST100 | 133.00 + 2.42b*** | 73.44 + 3.67b*** | 382.18 + 6.18b*** |
| FSwT50 | 161.73 + 5.56b*** | 58.02 + 0.82b*** | 365.65 + 7.19b*** |
| FSwT100 | 99.88 + 3.15b*** | 62.57 + 1.95b*** | 310.88 + 12.81b*** |
Disclaimer/Publisher’s Note: The statements, opinions and data contained in all publications are solely those of the individual author(s) and contributor(s) and not of MDPI and/or the editor(s). MDPI and/or the editor(s) disclaim responsibility for any injury to people or property resulting from any ideas, methods, instructions or products referred to in the content. |
© 2023 by the authors. Licensee MDPI, Basel, Switzerland. This article is an open access article distributed under the terms and conditions of the Creative Commons Attribution (CC BY) license (http://creativecommons.org/licenses/by/4.0/).


