Preprint
Article

Mucosal Metabolomic Signatures in Chronic Colitis: Novel Insights into the Pathophysiology of Inflammatory Bowel Disease

Altmetrics

Downloads

148

Views

118

Comments

0

A peer-reviewed article of this preprint also exists.

Submitted:

12 June 2023

Posted:

13 June 2023

You are already at the latest version

Alerts
Abstract
(1) Background: Inflammatory bowel diseases (IBD) involve complex interactions between genetic factors, aberrant immune activation, and gut microbial dysbiosis. While metabolomic studies have focused on feces and serum, fewer investigations have examined the intestinal mucosa despite its crucial role in metabolite absorption and transport. The current study aimed to identify novel mucosal metabolic pathways that are altered during chronic colitis and to determine microbial contributions to such changes. (2) Methods: The chronic Dextran sulfate sodium (DSS) colitis was induced for five weeks in 7-9-week-old wild-type C57BL/6J male mice followed by microbial profiling with targeted 16srRNA sequencing service. Mucosal metabolite measurements were performed by Metabolon (Morrisville, NC). The data were analyzed using the bioinformatic tools Pathview, MetOrigin, and Metaboanalyst. (3) Results: Our novel findings demonstrated increases in several host- and mi-crobe-derived purine, pyrimidine, endocannabinoid, and ceramide metabolites in colitis. Origin analysis revealed microbial-related tryptophan metabolites kynurenine, anthranilate, 5-hydroxyindoleacetate, and C-glycosyltryptophan were significantly increased in colon mucosa during chronic inflammation and strongly correlated with disease activity. (4) Conclusions: These findings offer new insights into the pathophysiology of IBD and provide novel potential targets for microbial-based therapeutics.
Keywords: 
Subject: Medicine and Pharmacology  -   Gastroenterology and Hepatology

1. Introduction

Inflammatory bowel diseases are chronic, debilitating illnesses with two major subtypes: ulcerative colitis and Crohn’s disease. Between 1990 and 2017, the number of affected individuals rose from 3.7 million to 6.8 million, with the highest prevalence rates in North America [1]. In addition to diarrhea, abdominal pain, ulcers, and rectal bleeding, IBD carries an increased risk of colon cancer along with several extraintestinal manifestations [2]. While there are many therapeutic options, treatment is complex, not curative, and carries significant side effects [3]. Moreover, patients with refractory disease often require surgery and possibly parenteral nutrition. Further complicating the clinical picture are the various factors in the pathophysiology of IBD, including host genetic factors, intestinal barrier disruption, immune dysregulation, gut microbial dysbiosis, and altered metabolite pools [4]. This has led to several groups utilizing metabolomic and integrated-omic tools to better understand the pathophysiology and progression of IBD.
Several studies have performed microbiota profiling and metabolomics in the serum and feces of IBD patients [5,6]. Furthermore, human studies provide tremendous value in their translational potential, but due to the myriad of confounding variables in clinical studies, it is much more difficult to reach mechanistic conclusions. Therefore, animal models of IBD are often used to mimic human disease and supplement human studies [7]. Additionally, animal models allow for more uniformity and the ability to capture a disease process at a specific time point. For instance, one such study performed untargeted mucosal and serum metabolomics in a model of acute DSS colitis and found that alterations in tryptophan metabolism affected AhR mediated IL-10 signaling [8]. However, there is a need for such studies in additional models that are more reflective of the chronic relapsing and remitting nature of IBD.
Here we performed untargeted colonic mucosal metabolomic profiling in a murine model of chronic DSS colitis that resembles IBD. The objectives of this study were to understand gut microbial changes during chronic colitis, identify differentially altered microbial metabolites, and uncover altered pathways during chronic intestinal inflammation for future study.

2. Materials and Methods

2.1. Animals

Wild-type C57/BL6 mice were purchased from Jackson Laboratory. Autoclaved polypropylene cages with corncob bedding were used to house the mice. The mice were given free access to food and water (Teklad Irradiated LM-485 Mouse/Rat Diet 7912, Envigo), under a 12-hour light/dark cycle. Male mice aged (7-9 weeks) were given either water alone (control group) or water supplemented with 2.5% w/v DSS (colitis group) for 5 weeks to induce chronic colitis. DSS was administered to mice for three cycles (one week/cycle), alternating with water only between the cycles (DSS was administered during weeks 1, 3, and 5, while water was administered during weeks 2 and 4).

2.2. Metabolomic Analysis

2.2.1. Sample Preparation

Hamilton Company's automated MicroLab STAR® system was used to prepare samples. For quality control purposes, several recovery standards were added prior to the first step in the extraction process. Proteins were precipitated with methanol for 2 minutes with vigorous shaking, followed by centrifugation, to dissociate small molecules bound to protein or trapped in the precipitated protein matrix, and recover chemically diverse metabolites (Glen Mills GenoGrinder 2000). The resulting extract was divided into five fractions: two for analysis using two separate reverse phases (RP)/UPLC-MS/MS methods with positive ion mode electrospray ionization (ESI), one for analysis using RP/UPLC-MS/MS with negative ion mode ESI, one for analysis using HILIC/UPLC-MS/MS with negative ion mode ESI, and one for backup. To remove the organic solvent, samples were briefly placed on a TurboVap® (Zymark). Before preparing for analysis, the sample extracts were dried overnight under nitrogen gas.

2.2.2. Ultrahigh Performance Liquid Chromatography-Tandem Mass Spectroscopy (UPLC-MS/MS)

Waters ACQUITY ultra-performance liquid chromatography (UPLC) and a Thermo Scientific Q-Exactive high resolution/accurate mass spectrometer interfaced with a heated electrospray ionization (HESI-II) source and Orbitrap mass analyzer operated at 35,000 mass resolution were used in all methods. The sample extract was dried before being reconstituted in solvents suitable for each of the four methods. To ensure injection and chromatographic consistency, each reconstitution solvent contained a series of standards at fixed concentrations. One aliquot was analyzed under acidic positive ion conditions, which were chromatographically tailored for more hydrophilic substances. In this procedure, the extract was gradient eluted from a C18 column (Waters UPLC BEH C18-2.1x100 mm, 1.7 m) using water and methanol containing 0.05% perfluoropentanoic acid (PFPA) and 0.1% formic acid (FA). Another aliquot was examined under acidic positive ion conditions that had been chromatographically tuned for more hydrophobic substances. The extract was gradient eluted from the same aforementioned C18 column using methanol, acetonitrile, water, 0.05% PFPA, and 0.01% FA and was operated at a higher total organic content in this method. A separate dedicated C18 column was used to evaluate another aliquot under basic negative ion optimized conditions. The basic extracts were gradient eluted from the column with methanol and water containing 6.5mM Ammonium Bicarbonate at pH 8. After being eluted from an HILIC column (Waters UPLC BEH Amide 2.1x150 mm, 1.7 m) using a gradient of water and acetonitrile with 10mM ammonium formate, pH 10.8, the fourth aliquot was subjected to negative ionization analysis. Dynamic exclusion was used to alternate between the MS analysis and data-dependent MSn scans. The scan range varied slightly between methods, but it was between 70 and 1000 m/z. The raw data files were archived and extracted in the manner described below.

2.2.3. Compound Identification and Metabolite Quantification

Using Metabolon's equipment and software, raw data was retrieved, peaks were found, and Quality control was performed. Compounds were discovered by comparing them to purified standards in the library. The library was built on authenticated standards and included retention time/index (RI), mass-to-charge ratio (m/z), and chromatographic data (including MS/MS spectrum data). Compound identification was based on the retention index within a limited RI window of the proposed identification, an accurate mass match to the library within 10 ppm, and the MS/MS forward and reverse scores between experimental data and authenticated standards. Peaks were measured using the area-under-the-curve method and normalized to total protein as determined by the Bradford assay.

2.3. Bioinformatic analysis

Heatmaps were generated for statistically significant differential metabolites using ComplexHeatMap in R [9,10]. Origin analysis was performed utilizing the online Met-Origin interface [11]. Briefly, a list of significantly altered metabolites with KEGG and HMBDID IDs were uploaded, and we proceeded with simple analysis. Enrichment analysis and sPLSDA analysis was performed using Metaboanalyst [12].

2.4. Myeloperoxidase Activity

With some minor modifications, the Krawisz [13] method was used to measure myeloperoxidase activity (MPO) in the distal colon. MPO activity is expressed as units per milligram of tissue after being normalized to the amount of tissue.

2.5. Hematoxylin and Eosin Staining

The intestines were sampled, and they were quickly rinsed in PBS. The tissues were immediately snap frozen in liquid nitrogen after being embedded in OCT media. Hematoxylin and eosin (H&E) staining was performed according to the manufacturer’s protocol (ScyTek Laboratories, Logan, UT) on longitudinal sections that were 5 µm thick.

2.6. Microbial Sampling and 16S rRNA sequencing

Cecal contents were collected and immediately snap frozen in liquid nitrogen. Samples were sent to Zymo Research for 16S rRNA sequencing. Amplicon Sequence Variant (ASV) analysis was performed with DADA2. Linear discriminant analysis (LDA) was performed with bioBakery [14,15].

2.7. Statistical Analysis

For metabolite abundances, Welch’s two-sample t-test was used to assess the significance and set at a level of p < 0.05. A false discovery rate (FDR) method was also applied with a set q < 0.1. Welch’s two-sample t-test was used to assess significance for all other comparisons.

3. Results

3.1. Gut Microbial Dysbiosis is Associated with Chronic DSS Treatment.

Mucosal inflammation is a key feature in inflammatory bowel diseases (IBD) [16]. Optimal treatment options focusing on complete healing of the mucosa are warranted. To understand the key mucosal alterations occurring during chronic intestinal inflammation, we utilized the chronic DSS colitis to model the relapsing and remitting nature of human IBD. Wild-type mice were administered alternating cycles of 2.5% DSS in drinking water and water alone for five weeks to induce chronic colitis (Figure 1A). We first assessed the severity of experimentally induced inflammation. As shown in Figure 1B, and Supplementary Figure 1, colon length was significantly decreased in the group treated with DSS, suggestive of intestinal inflammation. The average colon length decreased from 6.3 cm to 5.0 cm during chronic DSS treatment (p < 0.0001). Given that another key aspect of colitis is neutrophil infiltration [17], we further determined the severity of inflammation by measuring myeloperoxidase (MPO) activity in colonic mucosa from the distal colon. Figure 1C showed that the average MPO activity increased from 0.495 units/mg of tissue to 6.163 units/mg of tissue (p = 0.0333). Further, qPCR demonstrated increases in the mRNA expression of pro-inflammatory cytokines IL-1β (p = 0.0067) (Figure 1D) and CXCL1 (p = 0.0224) (Figure 1E).
Gut microbial dysbiosis, another hallmark of chronic colitis, was further examined [18]. We performed 16S rRNA sequencing on the cecal contents, followed by LEfSe analysis to identify differentially altered microbes. The Cladogram depicted in Figure 2A shows the various taxonomic levels of microbes associated with chronic colitis and control groups and their taxonomic relationship to each other from LEfSe (linear discriminant analysis effect size) analysis. Figure 2B depicts the top 20 taxa associated with the control and DSS groups, and Supplemental Figures S2 and S3 depict all taxa. Of note, the phyla Verrucomicrobia, Bacteroidetes, and Actinobacteria were significantly associated with chronic DSS colitis. Furthermore, we assessed alpha diversity through several indices, including the total number of observed species, Chao1, Fisher, Shannon Diversity, and Simpson index. Overall, the data demonstrated a loss of alpha diversity within samples of mice with chronic colitis (Figure 2D). Specifically, the overall species observed dropped from 226.7 in the control group to 189.5 in the colitis group (p = 0.0001). Additionally, the Chao1, Fisher, Simpson, and Shannon diversity indices which consider both the number of species and the abundance of each species, decreased from 226.8 in the control group to 189.5 during chronic colitis (p = 0.0001), 35.84 to 29.03 (p = 0.0001), 0.9819 to 0.9696 (p = 0.0002), and 6.629 to 6.117 (p < 0.0001) respectively. As expected, chronic colitis led to both a decrease in the overall number of species and the distribution of species. Furthermore, we assessed beta diversity using the Weighted Unifrac method [19], which accounts for the presence of organisms, their abundance, and their taxonomic relationship to each other. Our data showed that each sample's microbial communities clustered according to their treatment group (Figure 2E). Furthermore, a hallmark of microbial changes in IBD is a loss of short-chain fatty acid-producing bacteria [20]. We observed a decrease in the relative abundance of the genus Roseburia (p < 0.001) (Figure 2C) and several Roseburia species (Supplemental Figure S4) which were identified as biomarkers for the control groups through LEfSe analysis. There have also been reported increases in the genus Lactobacillus in IBD cohorts [21], which we also found in our chronic DSS samples (Figure 2C, p = 0.0070). Further, we found increases in Turicibacter sanguinins (p < 0.001) and Erysipelatoclostridium species (p < 0.001) which also correspond well with previous reports on human cohorts with IBD (Figure 2C) [22]. Overall, our findings showed that chronic DSS treatment in mice resulted in chronic colitis phenotype with associated dysbiosis, providing an adequate model to explore further the mucosal changes that occur in the colon during on-again, off-again inflammatory insults.

3.2. Chronic Colitis Leads to Distinct Metabolomic Profile in the Colonic Mucosa.

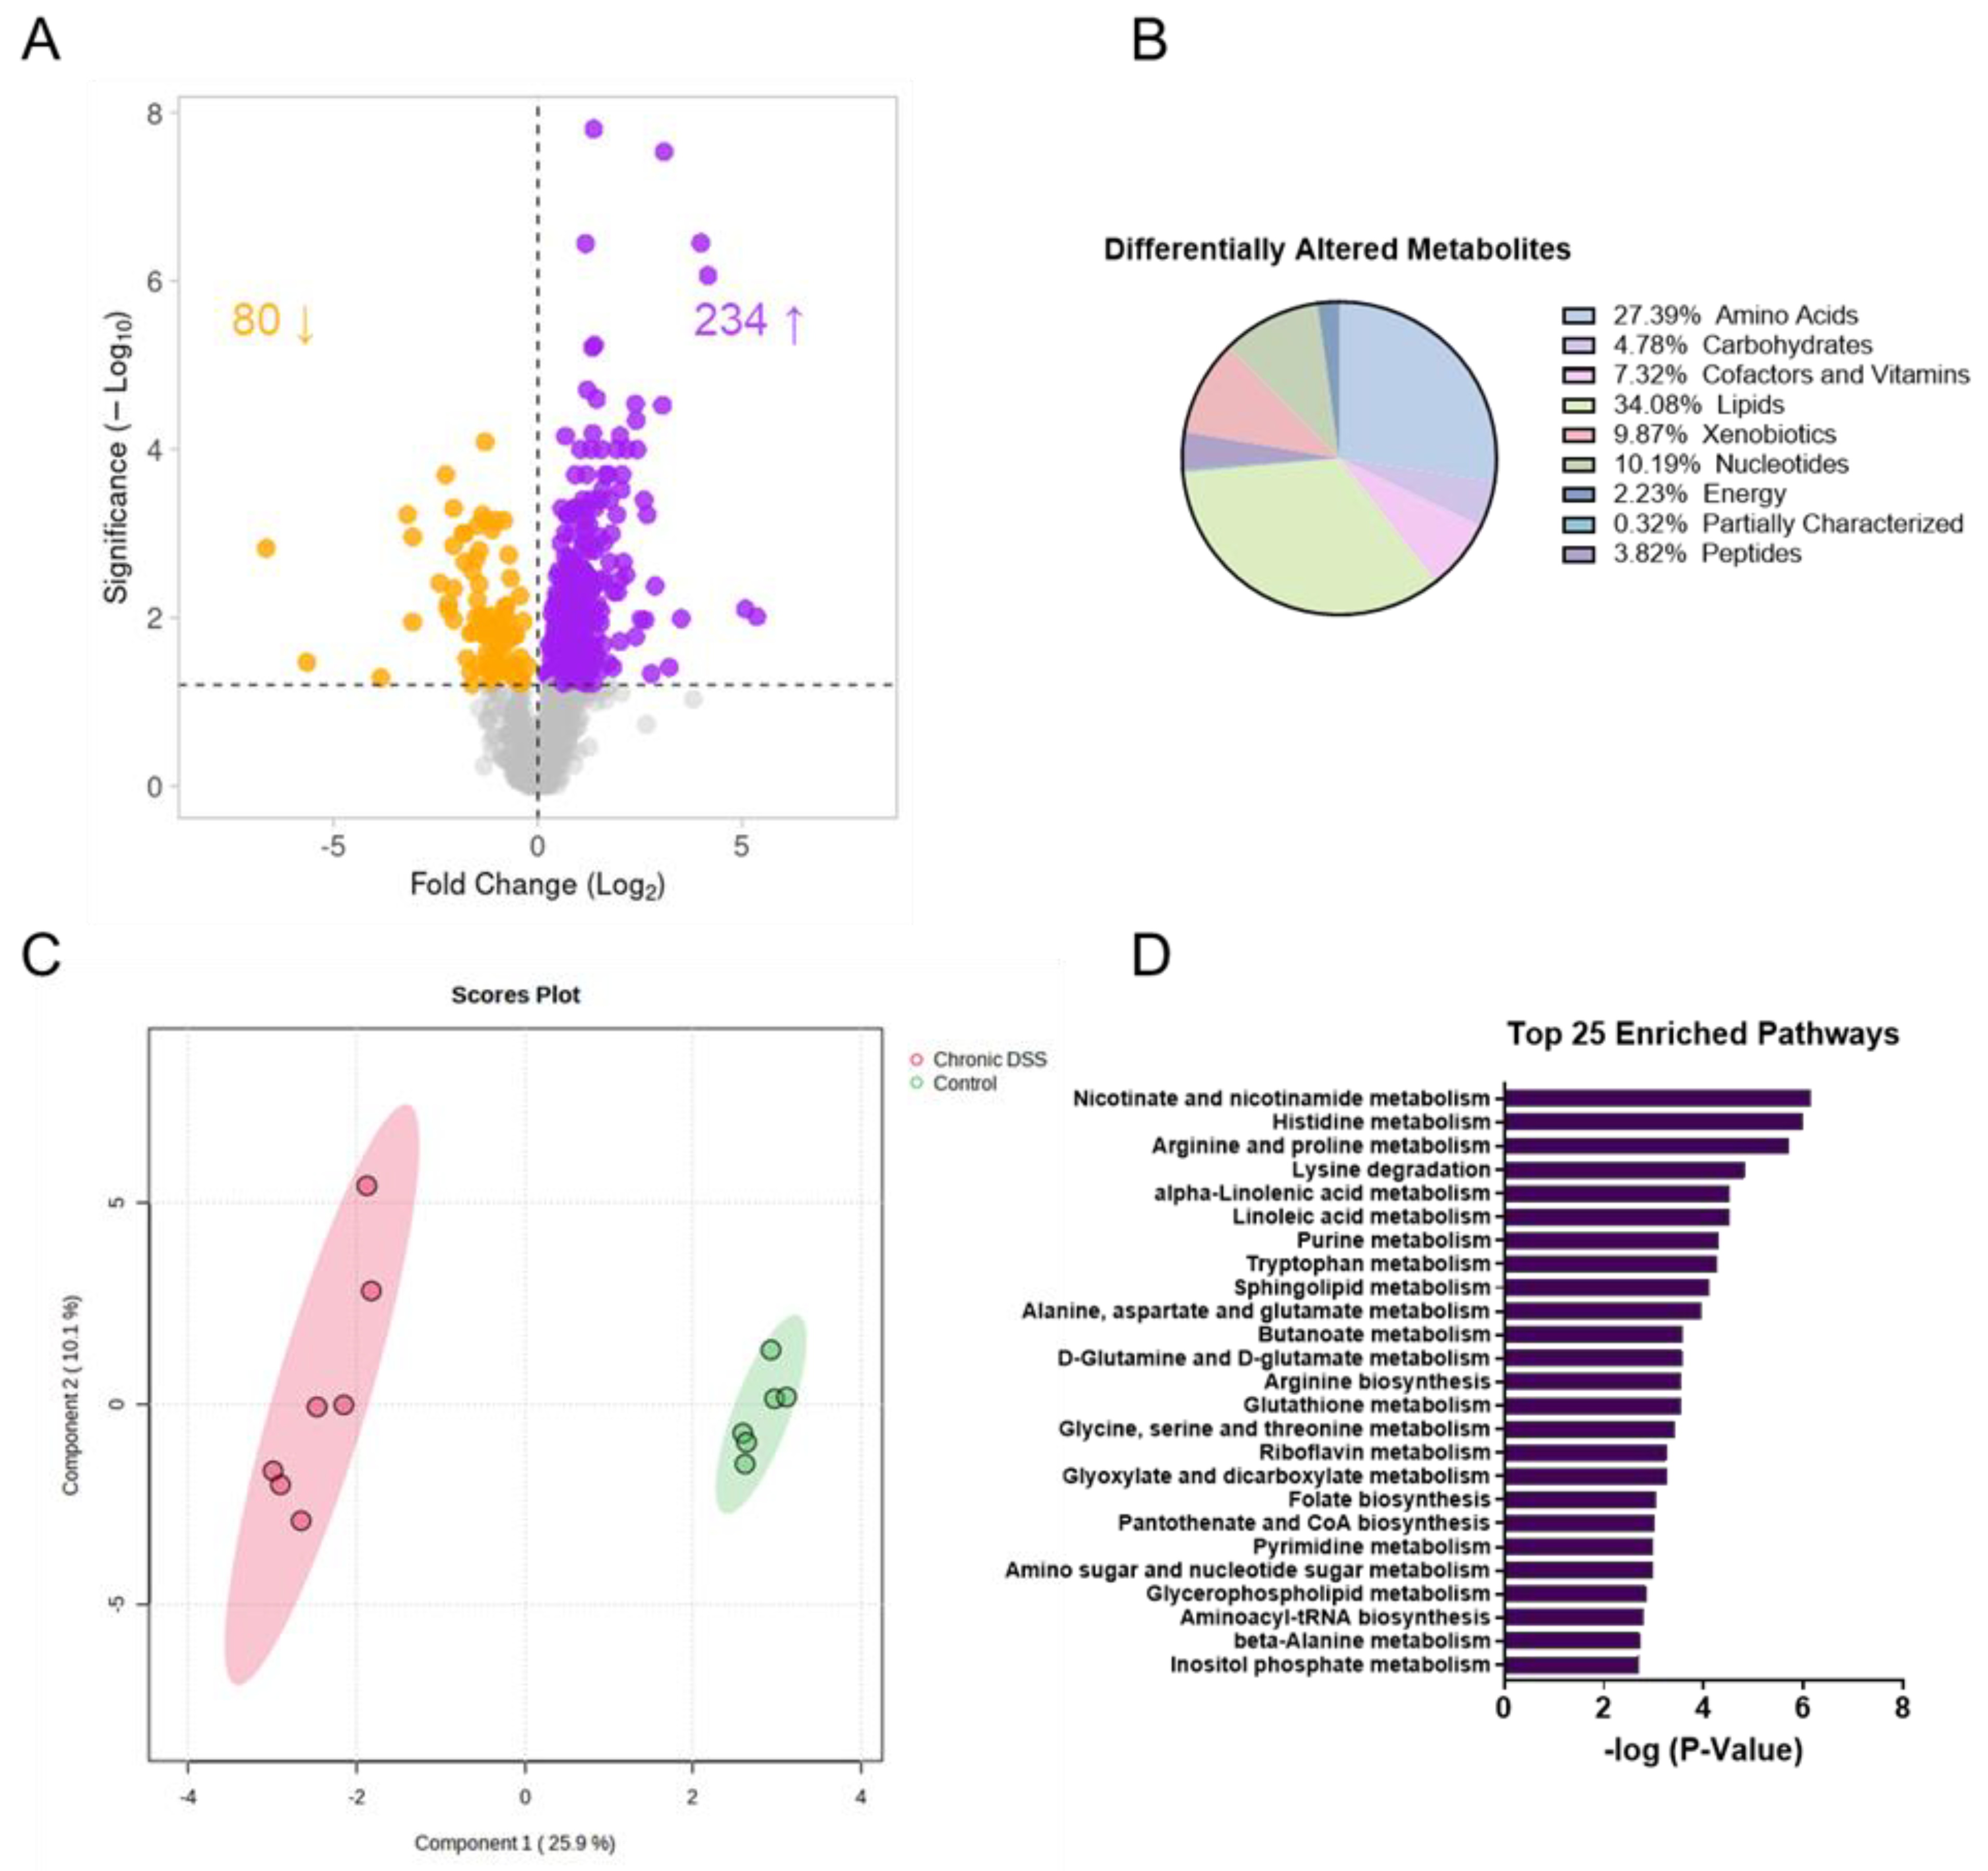
Given that functional changes in the gut microbiome are manifested through metabolic alterations, we next performed untargeted metabolomic analysis to take an unbiased approach to discover novel changes in the intestinal mucosa during chronic inflammation. Our analysis revealed a unique metabolic signature in the colon mucosa after chronic colitis. Overall, there were 314 differentially altered metabolites (p < 0.05, q < 0.1), with 80 being decreased and 234 metabolites increased in the colonic mucosa of mice with chronic colitis (Figure 3A, Supplemental Figure S5). Of the 314, the largest proportion of altered metabolites was involved in lipid metabolism, with the next largest group involved in amino acid metabolism. The same trend was observed for both the increased and decreased metabolites when compared to the control (Figure 3B). Additionally, sPLSDA analysis revealed two distinct clusters when comparing the colon mucosa metabolome of control mice to those with chronic colitis (Figure 3C). We followed up our assessment with enrichment analysis, which considers how many metabolites are altered within a given KEGG pathway (Figure 3D). Of note, several nucleotide and amino acid metabolism pathways were among the most enriched.

3.3. Chronic Colitis Leads to Increased Mucosal Localization of Inflammatory Metabolites and Impaired Enterohepatic Circulation.

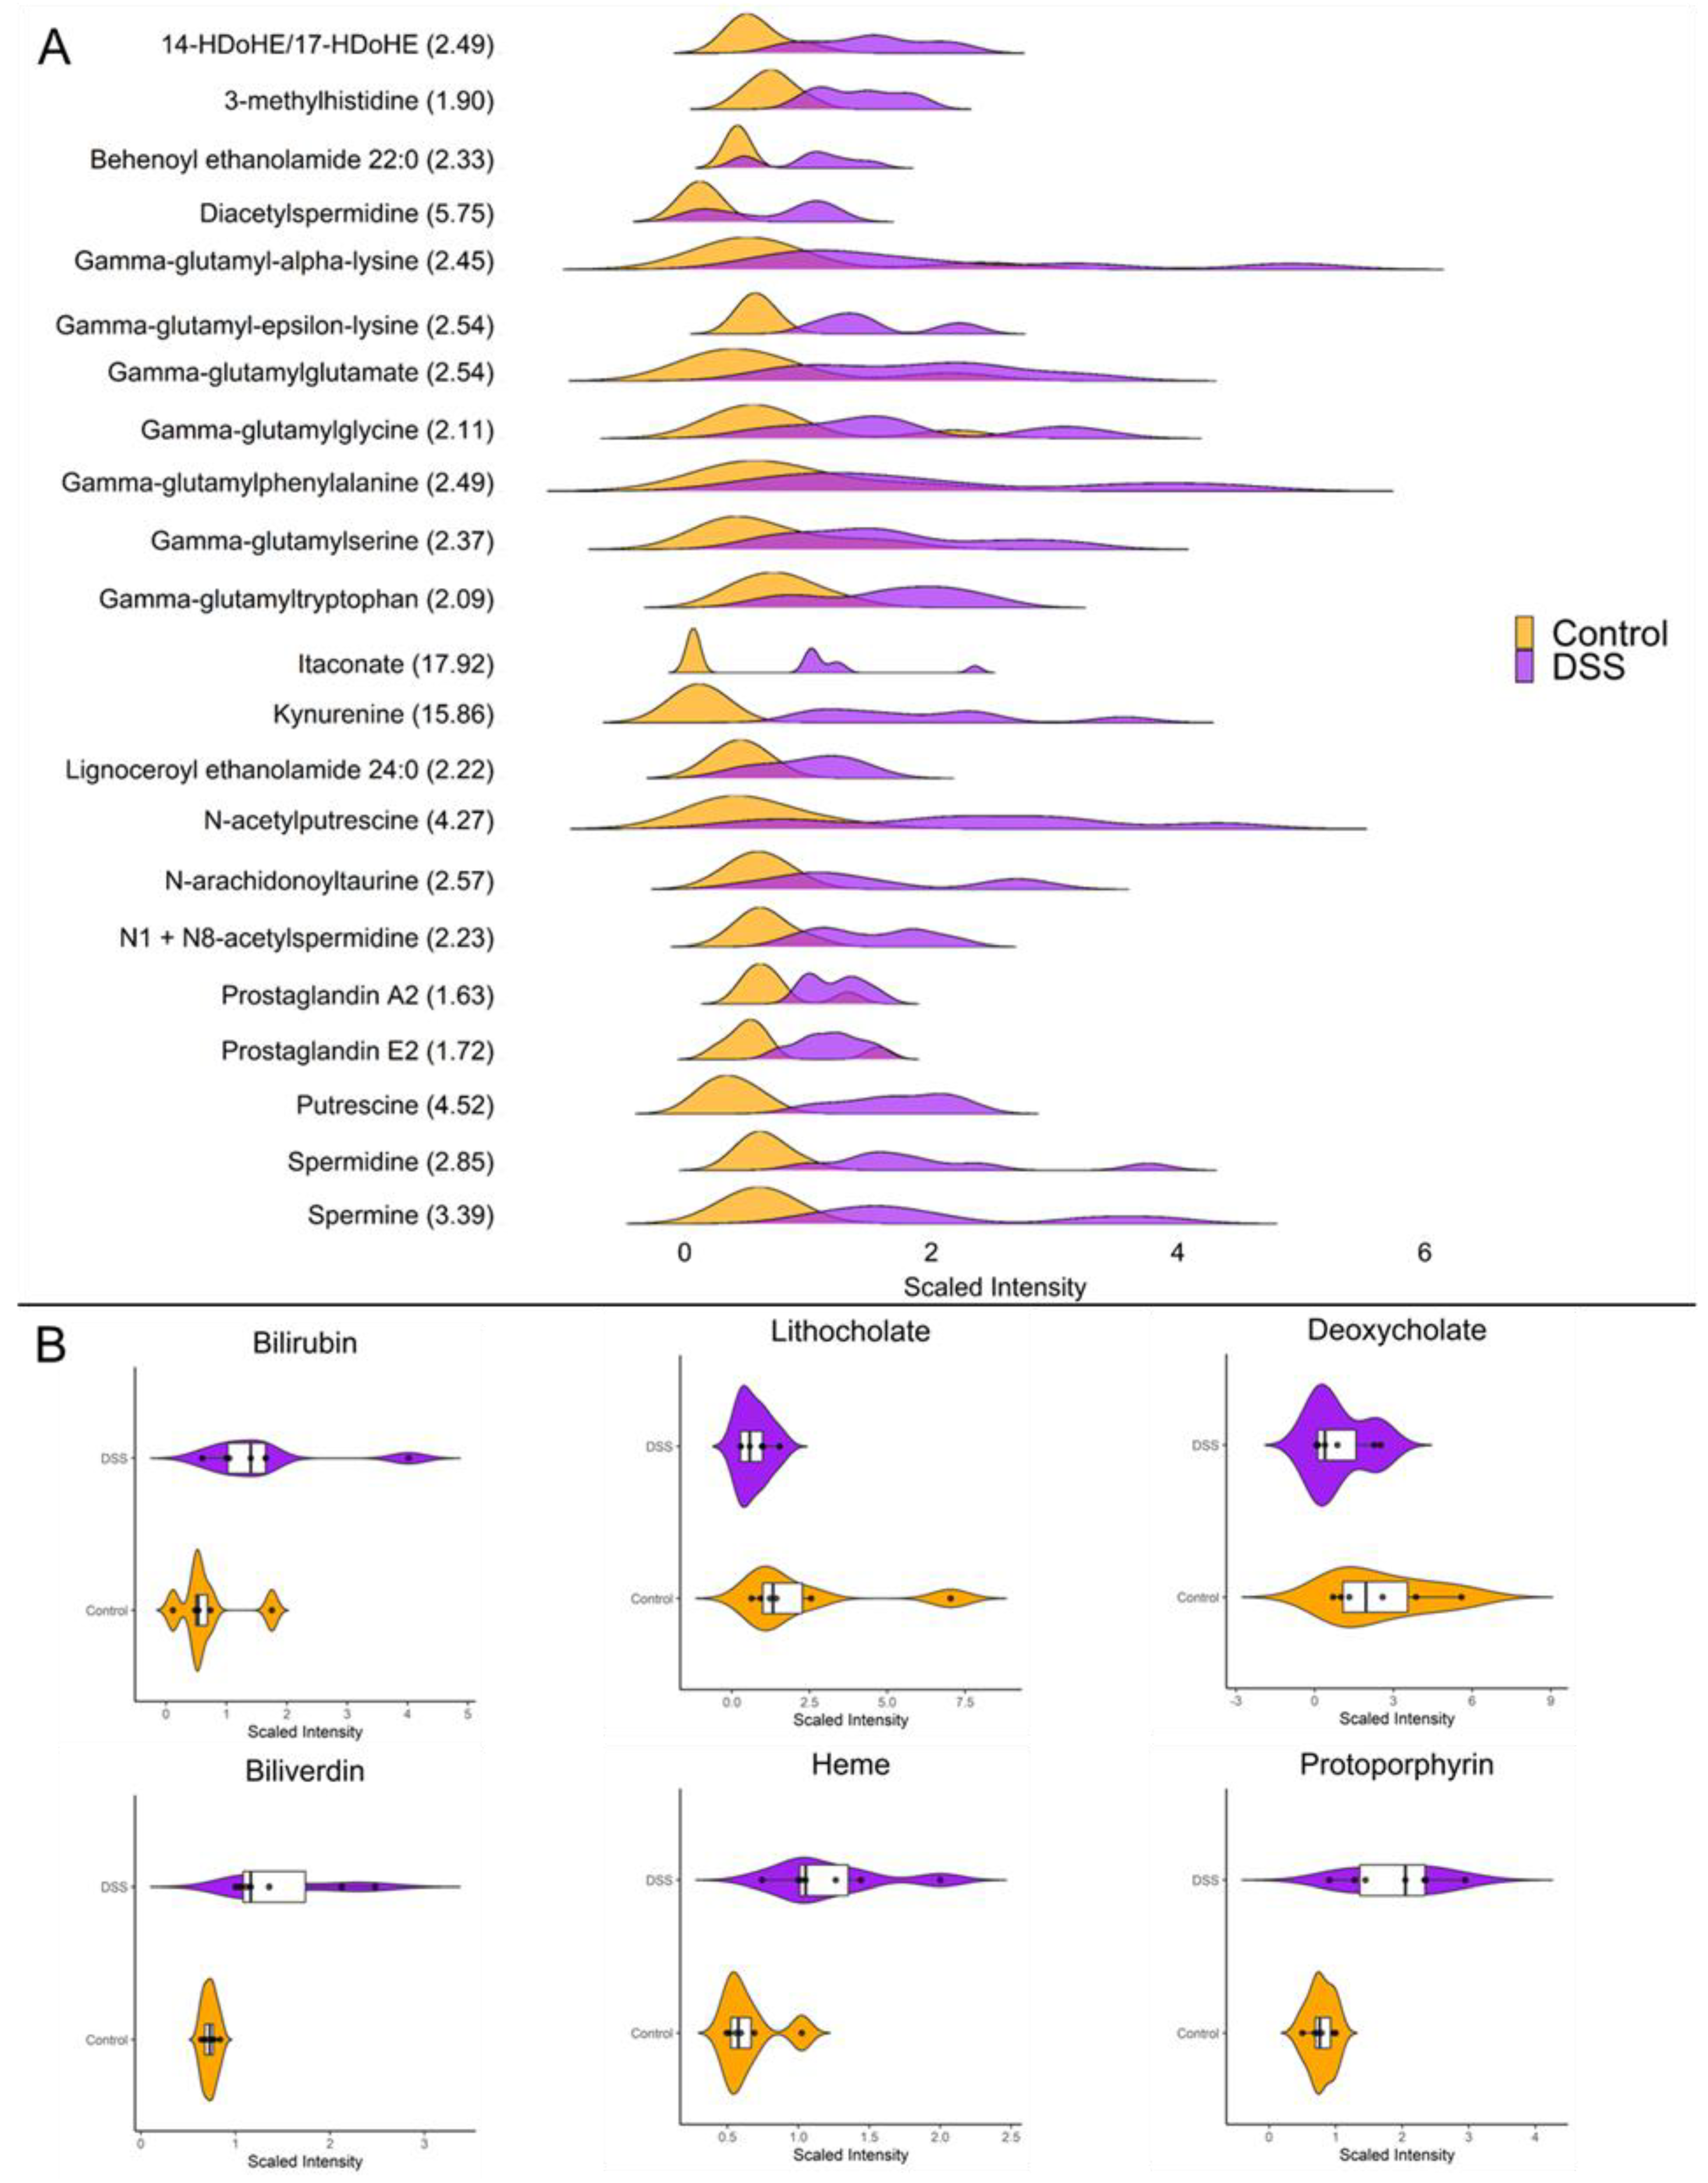
Our investigations revealed striking differences in the mucosal abundances of several metabolites that are implicated in inflammatory processes such as polyamines, amino acid metabolites, eicosanoids, and TCA cycle intermediates. Figure 4A highlights the distributions of the significantly altered inflammatory mediators in the mucosa during chronic DSS colitis. It is worth highlighting the vast increase in mucosal itaconate levels of nearly 18-fold (p < 0.001) during chronic inflammation as it has been shown to have anti-inflammatory properties in models for sepsis, autoimmune disease, and reperfusion injury [23]. Furthermore kynurenine, a tryptophan metabolite known to be upregulated during inflammation, was increased nearly 16-fold (p < 0.001) in the mucosa after chronic DSS treatment. Additionally, our data revealed several interesting changes in metabolites involved in enterohepatic circulation (Figure 4B). For instance, the secondary bile acids deoxycholate and lithocholate which are directly influenced by gut microbiota, are significantly decreased during chronic colitis (p < 0.05). Moreover, heme and its degradation products bilirubin, biliverdin, and protoporphyrin IX were significantly increased in the chronically inflamed mucosa suggesting increased synthesis and/or absorption of erythrocyte byproducts.

3.4. Contribution of Microbial Mucosal Metabolomic Profile During Chronic Colitis

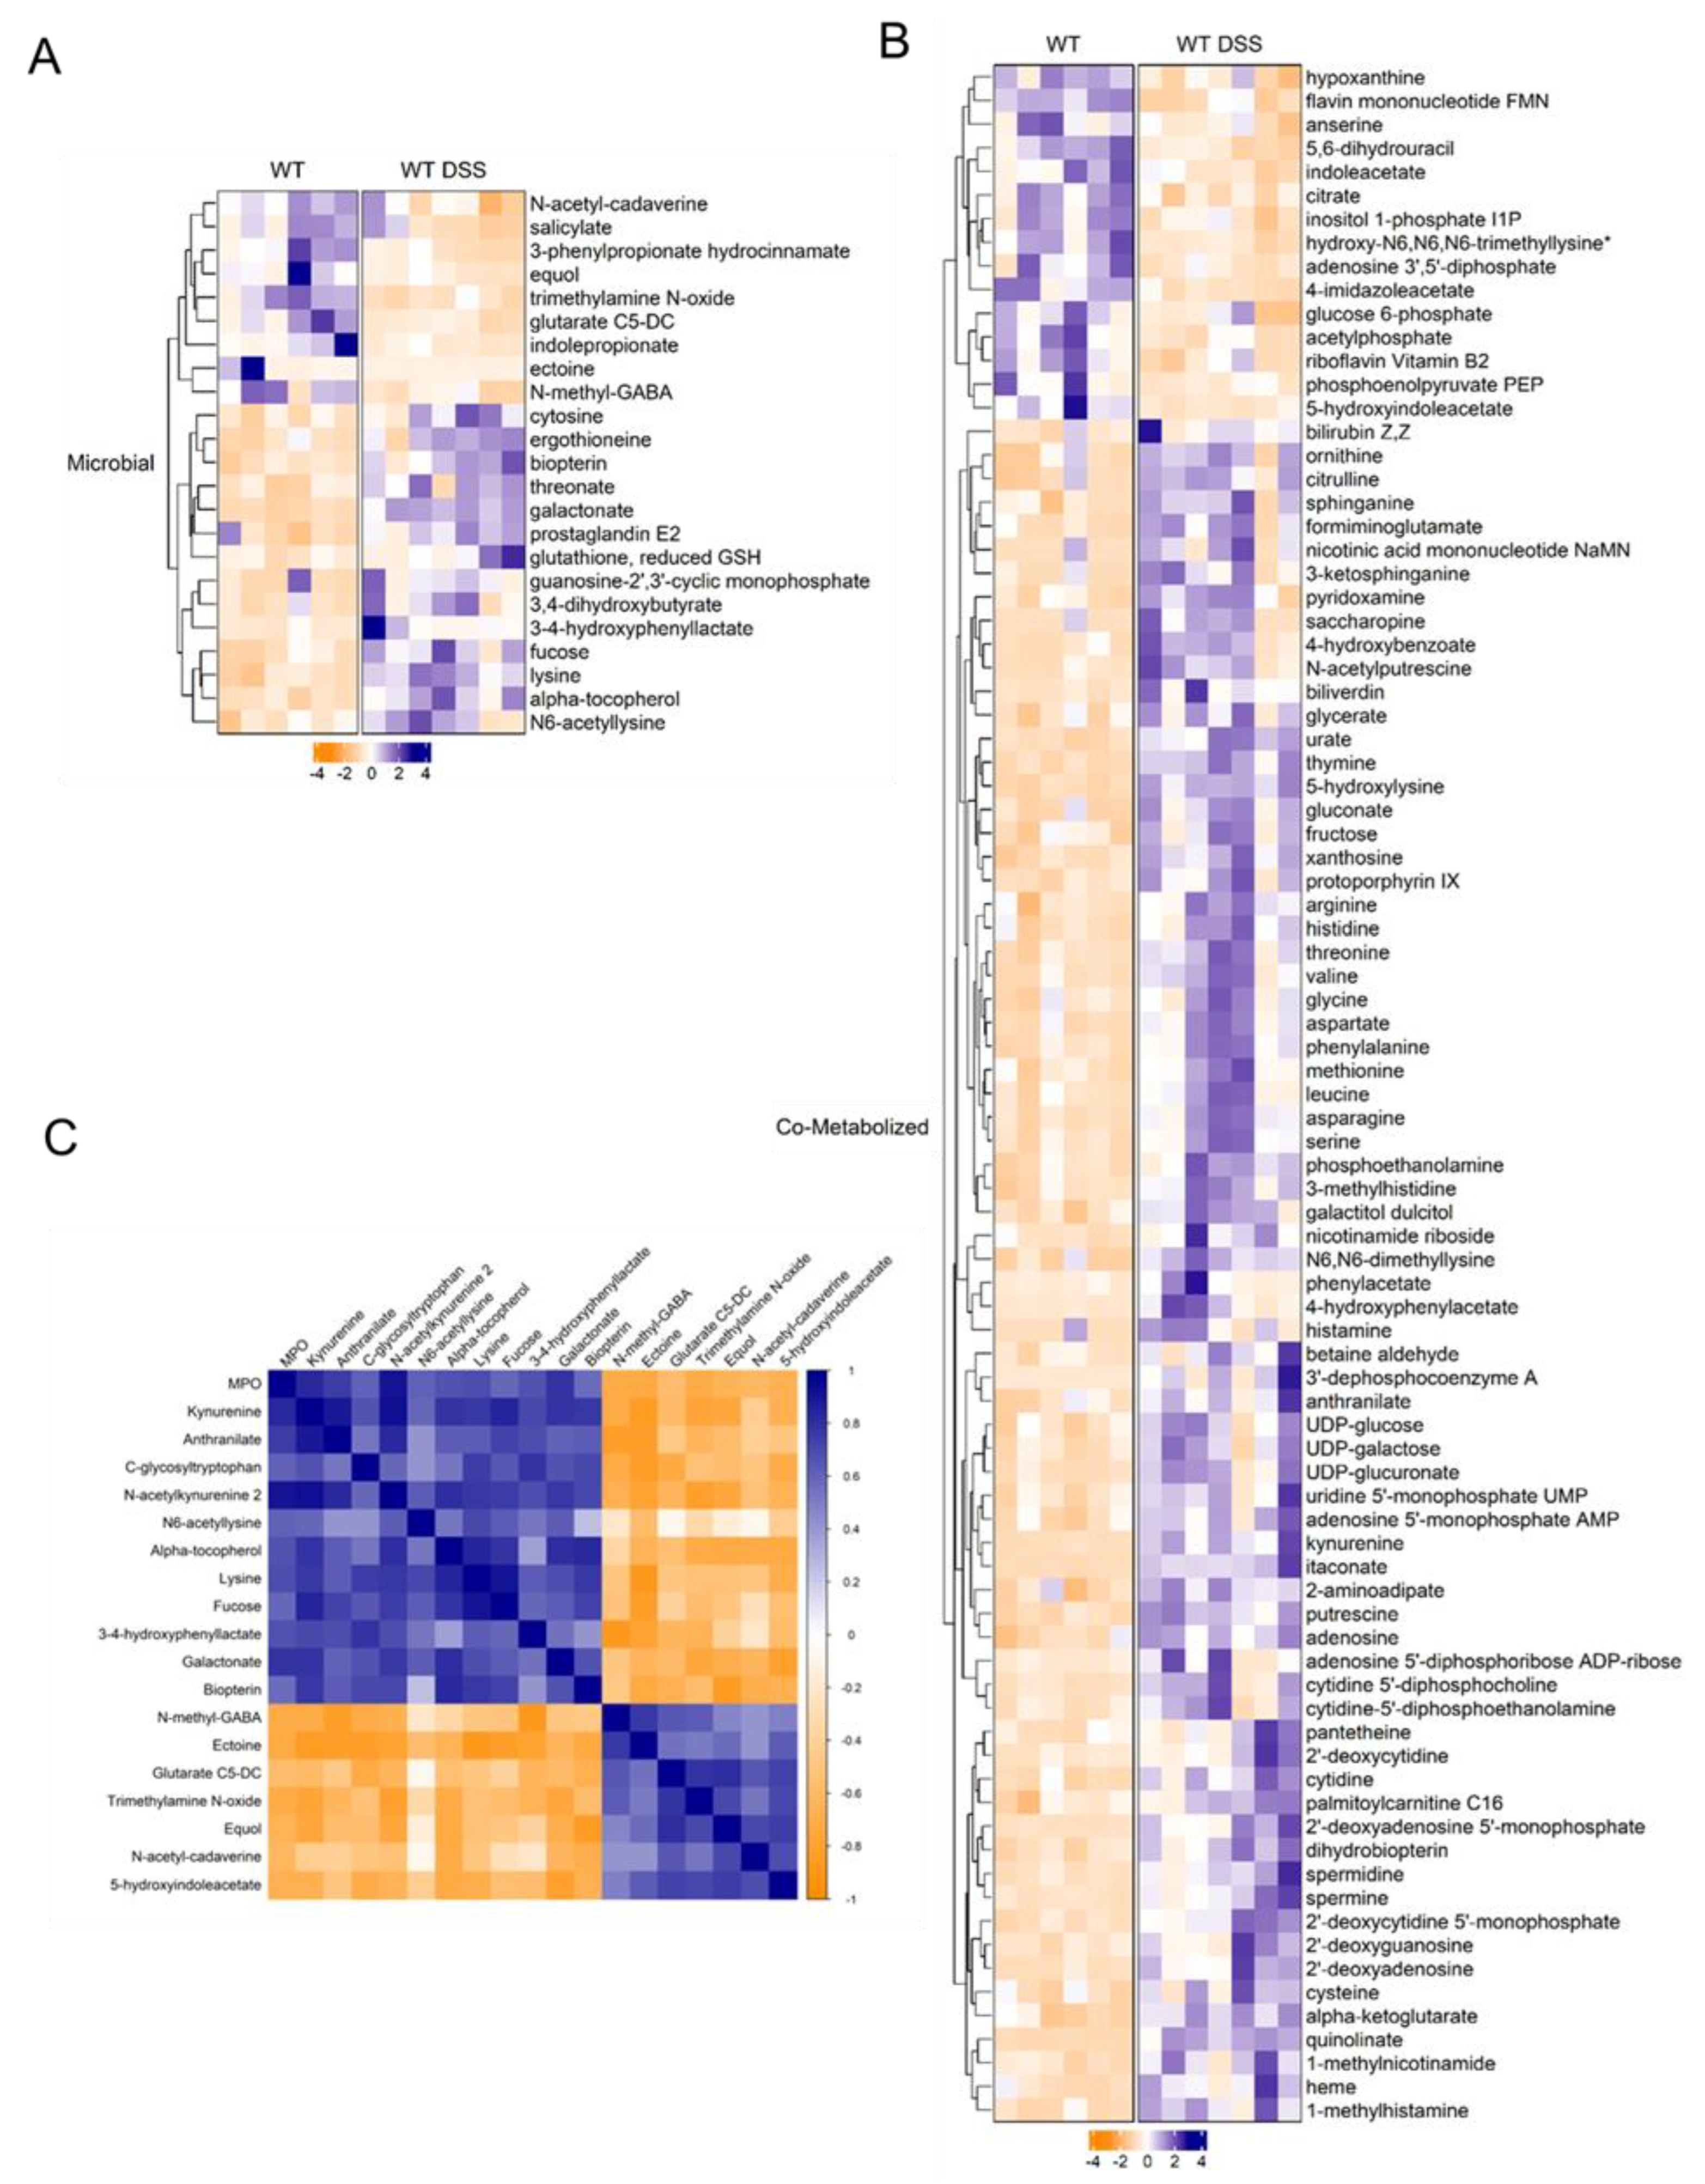
We then took an unbiased approach to examine the potential link between gut microbial dysbiosis and the altered metabolic profile in the colonic mucosa. We utilized the bioinformatic tool Met-Origin to aid in classifying metabolites as related to microbes or co-metabolized by both the host and microbes. This analysis revealed a multitude of metabolites that were altered, at least in part, through changes in gut microbial composition (Figure 5). Our analysis showed 23 microbial-related metabolites differentially altered in chronic colitis (Figure 5A). Interestingly, fucose was increased in the colon mucosa of mice with chronic colitis. Additionally, several differentially altered metabolites were significantly associated with disease severity assessed by MPO levels (Figure 5B, Supplemental Figure S6). Our analysis revealed that in addition to several co-metabolized nucleotides highlighted in Figure 5, there were increases in heme-related metabolites protoporphyrin IX and biliverdin in the colonic mucosa of mice with chronic colitis (Figure 5C) that were also highlighted in Figure 4B in more detail. This may suggest increased heme breakdown and compensatory synthesis in response to chronic intestinal inflammation. Ultimately, this analysis allows for a better understanding of the contribution of gut microbial dysbiosis to the metabolomic alterations in the mucosa of mice with chronic colitis.

3.5. Chronic Colitis Alters Mucosal Dietary, Nucleotide, Amino Acid, and Lipid Metabolism

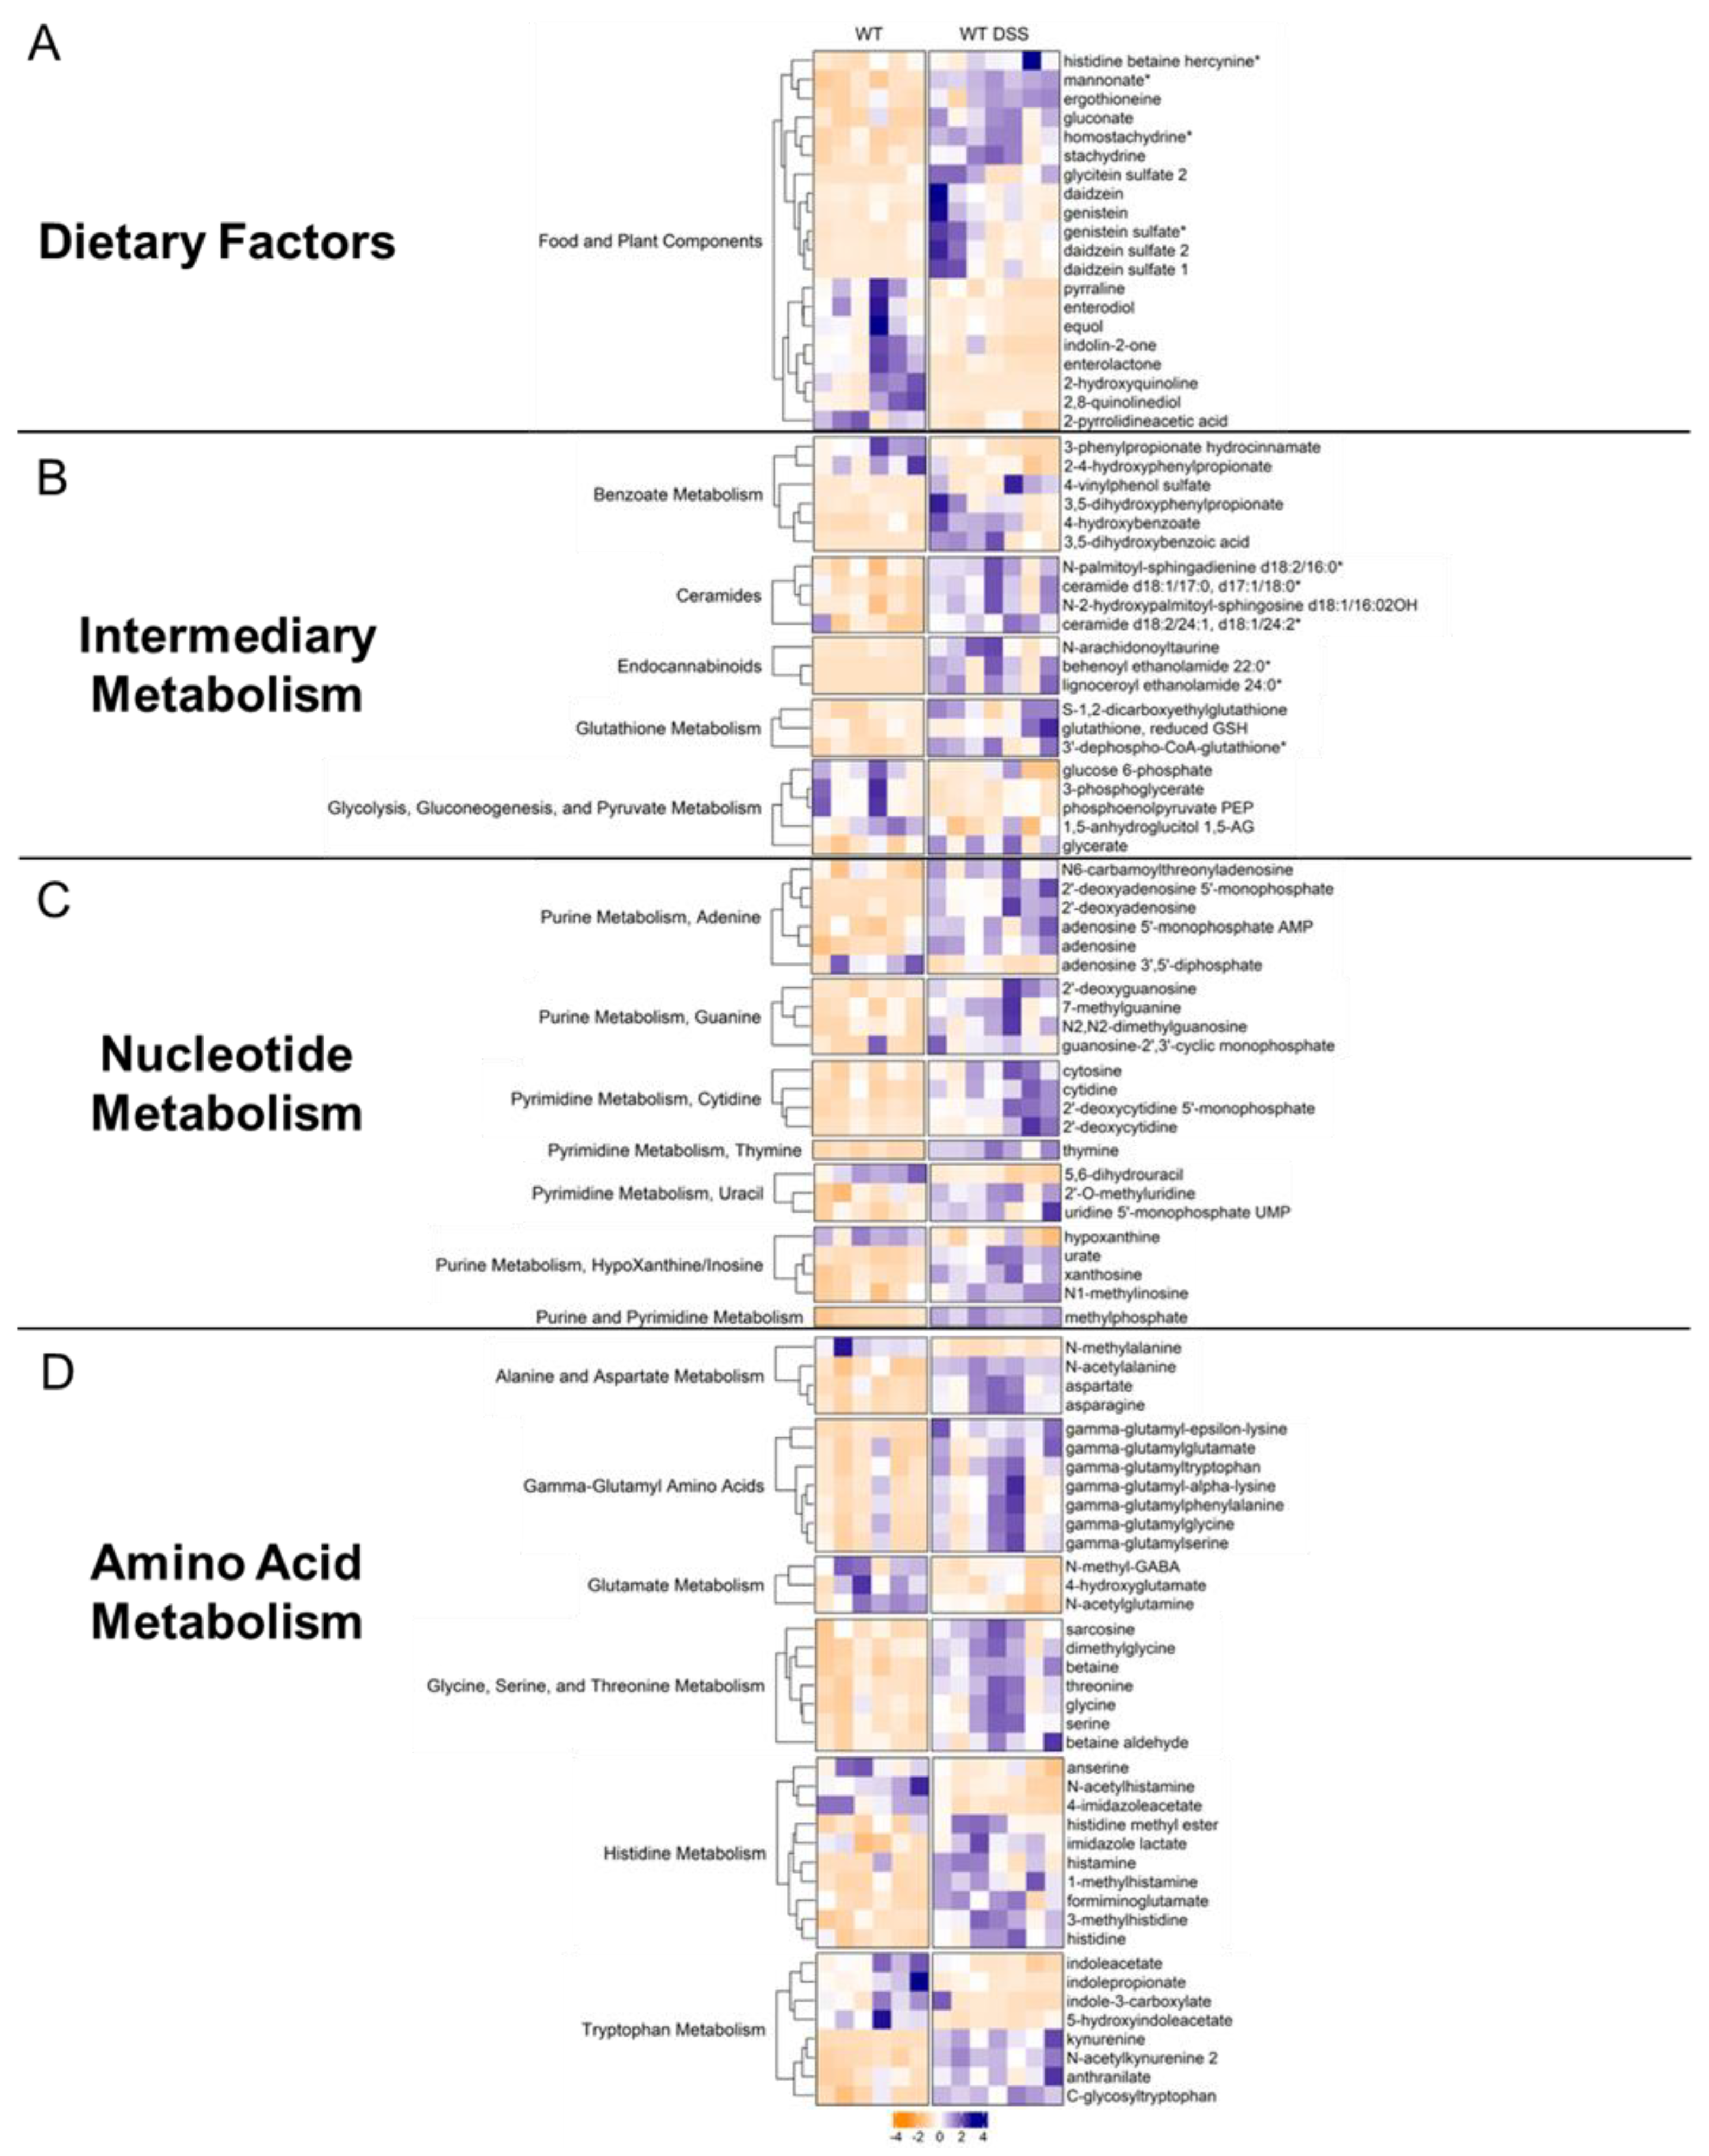
Food and plant components: We subsequently organized differentially altered metabolites by their metabolic pathway. For instance, there were several alterations in dietary and plant-derived metabolites in the colonic mucosa of mice with chronic colitis (Figure 6A). Stachydrine and ergothioneine, for instance, are both increased in the mucosa during chronic colitis. Given that these are dietary metabolites, our findings suggest altered colonic nutrient absorption in response to inflammation. Our analysis also revealed alterations in several nucleotide metabolism pathways.
Intermediary metabolism: We also found interesting increases in other classes of metabolites. For instance, endocannabinoids (Figure 6B), a class of compounds newly emerging as a possible therapeutic target in IBD, showed general increases in the mucosa of mice with chronic colitis. Other interesting findings included increases in ceramides. Furthermore, the mucosa of mice with chronic colitis demonstrated decreased glycolytic intermediates such as glucose 6-phosphate, phosphoenolpyruvate, and 3-phosphoglycerate, suggesting decreased glycolytic activity (Supplemental Figure S7).
Nucleotide metabolism: Generally, we found increases in metabolites involved in adenine, guanine, cytidine, thymine, uracil, and inosine metabolism (Figure 6C, Supplemental Figure S8) in the colon mucosa of chronic colitis mice, suggesting increased nucleotide production due to increased epithelial cell turnover. For instance, adenosine was increased in the mucosa during chronic colitis. Interestingly, adenosine receptor agonists have been shown to mitigate the effects of DSS-induced colitis through NF-κB signaling. Another interesting finding was the increase in methylated nucleotide metabolites such as N1-methylinosine, 2’-O-methyluridine, and N2, N2-dimethylguanosine, suggesting changes in genetic regulation.
Amino acid metabolism: Our data showed that gamma-glutamyl amino acids were increased during chronic colitis (Figure 6D, Supplemental Figure S9). Interestingly, we also found decreases in microbial indole tryptophan metabolites and increases co-metabolized kynurenine, revealing alterations in tryptophan metabolism within intestinal mucosa during inflammation. We also identified increases in the amino acids: glycine, serine, threonine, histidine, aspartate, and asparagine, suggesting altered transport and/or metabolism in the intestinal mucosa during chronic inflammation. This analysis revealed several findings corroborated in human cohorts of IBD and other IBD models while also describing novel metabolomic findings in the colonic mucosa during chronic colitis.

4. Discussion

In this study, we investigated the gut microbial composition and mucosal metabolome of mice with induced chronic colitis. We found that chronic colitis resulted in increased myeloperoxidase activity in the colon, as well as increased levels of pro-inflammatory cytokines IL-1β and CXCL1. Gut microbial analysis revealed expected losses in alpha diversity, two distinct beta diversity clusters, and microbial composition changes consistent with IBD patients. Furthermore, mucosal metabolomics revealed 328 differentially altered metabolites with several enriched metabolic pathways. These changes were alterations in microbial-related metabolites, food and plant components, nucleotides, amino acids, and lipids.
Gut microbial dysbiosis is a critical factor in the pathophysiology of IBD [18]. In that regard, several groups have investigated changes in the gut microbiome in IBD patients and in animal models for IBD with one characteristic feature being a loss of alpha diversity [24,25], a measure for the total number of species as well as the abundance of such species, which we observed in our study. Additionally, beta diversity which has also been consistently affected by IBD [25] was also found to be affected by induced chronic colitis in our study. Furthermore, we have highlighted several characteristic microbial changes in our model that have also been reported in IBD patients. The genus Roseburia was identified as a characteristic feature of untreated control mice and was significantly decreased in abundance in mice with chronic colitis. Roseburia are known to produce short-chain fatty acids. It has been shown to decrease in abundance in IBD, and administration of Roseburia intestinalis supernatant has been shown to alleviate induce colitis [26,27,28]. Although we did not observe a statistically significant decrease in the mucosal levels of the SCFA butyrate, there was a trend towards a decrease in the chronically inflamed mucosa. This could be due to SCFAs serving as the key fuel for colonocytes and thus they are rapidly metabolized. We also observed an increase in the genus Lactobacillus, Turicibacter sanguinis, and an Erysipleatoclostridium species which have also been observed in IBD patients [21,22,29].
While we were not surprised to observe distinct mucosal metabolic profiles during chronic colitis, we were intrigued by several findings which have been corroborated in IBD patients as well as novel discoveries that can be used for further mechanistic inquiries. For example, decreases in indole metabolites such as indoleacetate, indoleproprionate (IPA), and indole-3-carboxylate have been shown in the serum of subjects with ulcerative colitis with IPA serving as a marker for disease remission [30]. Interestingly our data shows that these decreases in these indole metabolites are also occurring in the intestinal mucosa during inflammation. This suggests that the decreases in the serum of those with IBD is due to decreased microbial production and not increased transport in mucosal epithelial or immune cells. Regarding dietary factors, we found increases in ergothioneine and stachyrdine in the inflamed mucosa. Stachydrine has been shown to have anti-inflammatory properties in primary human chondrocytes isolated from subjects with osteoarthritis that were treated with IL-1β [31]. Ergothioneine was previously shown to also demonstrate protective effects against DSS-induced colitis by decreasing MPO activity levels and improving intestinal barrier function [32]. Taken together, our findings suggest a compensatory increase in the absorption of anti-inflammatory metabolites stachydrine and ergothioneine in response to mucosal inflammation. We also found increases in mucosal ceramides which have been associated with increased inflammation in the mucosa of subjects with IBD [33]. We also found that the microbial derived metabolite fucose, a sugar known to participate in the formation of Lewis antigens, was increased in the colon mucosa of mice with chronic colitis. This is particularly notable as Lewis antigens have been associated with Ulcerative Colitis [34]. In fact, IgG and IgM reactivity has been shown to be increased towards fucosylated oligosaccharides in the serum of patients with Crohn’s disease, implicating fucose carrying Bacteroides species in intestinal inflammation [35]. In fact, our analysis identified the order Bacteroidales as a key distinguishing feature for mice with chronic colitis.
Our study also identified several altered metabolic pathways in response to chronic colitis. We found decreased levels of glycolytic intermediates which is important to note as a previous study found that patients with IBD had antibodies that recognized several glycolytic enzymes as antigens [36]. One such enzyme was phosphoglycerate mutase, the enzyme responsible for conversion of glycerate-3P to glycerate-2P. Our rendering of the KEGG glycolysis pathway demonstrated decreased levels of glycerate-2P in the intestinal mucosa during chronic colitis highlighting the need to further explore the implications of disrupted glycolysis. Our data also highlight novel increases in endocannabinoids in the colon mucosa during chronic inflammation. This is an important finding as the role of the endocannabinoid system in IBD is an emerging area of interest [37]. Moreover, we also found increases in several ceramides, a class of sphingolipids, which are emerging as a new area of investigation in IBD [33]. Ultimately, we provide a comprehensive report of alterations in mucosal metabolism during chronic inflammation in a relevant model that highlights microbial contributions and novel pathways for future investigation.
In summary, our studies provide a comprehensive view into the metabolomic alterations in the intestinal mucosa during chronic inflammation that adds to the growing number of studies utilizing metabolomics to gain new insight into disease [38,39]. We characterized the gut microbial alterations associated with chronic inflammation, and further elucidated the impacts of those changes by analyzing differentially altered microbial related metabolites. For instance, we found increases in heme degradation products protoporphyrin IX and biliverdin within the chronically inflamed colon mucosa. Simultaneously, we found that Turicibacter sanguinis, a bacterial species that synthesizes biliverdin and that the family of bacteria Erysipelotrichaceae which are known to utilize protoporphyrin IX as a substrate, were both increased in the intestinal lumens of mice with chronic colitis. Our study yielded significant findings indicating elevated levels of various purine, pyrimidine, endocannabinoid, and ceramide metabolites derived from both the host and the gut microbiota in colitis. Notably, our analysis of the origin of these metabolites revealed a microbial contribution, particularly in the case of tryptophan metabolites, including kynurenine, anthranilate, 5-hydroxyindoleacetate, and C-glycosyltryptophan. These microbial-related tryptophan metabolites displayed substantial increases within the colon mucosa during chronic inflammation and exhibited strong correlations with disease activity. These findings provide valuable insights into the underlying pathophysiology of inflammatory bowel disease (IBD) and present promising new targets for the development of microbial-based therapeutics.
The limitations of our study include that metabolomic profiling and microbial sequencing were performed on two distinct sets of mice. However, we were still able to identify microbial contributions to microbial related metabolic changes with MetOrigin. Furthermore, our study used only male mice and should be repeated in female mice at various stages of their estrous cycles, with those stages taken under consideration as a variable. While there are not strong differences in the incidence of IBD between males and females, there are some slight differences that require future study [40]. For instance, females tend to have a higher risk of CD while males tend to have a higher risk of UC. Future studies can focus on further exploring the mechanistic processes involved in the disruption of identified metabolic pathways by separating the mucosa into epithelial cell fractions and lamina propria fractions to better understand which changes are coming from epithelial cells or immune cells specifically.

Supplementary Materials

The following supporting information can be downloaded at the website of this paper posted on Preprints.org, Figure S1: Representative images of decreased colon lengths and H&E stained colons of control and DSS treated mice; Figure S2: All taxa associated with control group based on LEfSe analysis with plotted Log10 of linear discriminant analysis (LDA) scores; Figure S3: All taxa associated with control group based on LEfSe analysis with plotted Log10 of linear discriminant analysis (LDA) scores; Figure S4: Boxplots of relative abundances for various Roseburia species; Figure S5: H eatmap of differentially altered mucosal metabolites between control and DSS treated mice (p 0 05 q 0 1 Welch t test) Heatmap was scaled from 4 to 4; Figure S6: Correlation plots showing linear regression models between microbial related metabolites and MPO activity with significant Spearman correlation coefficients; Figure S7: Pathview rendering of alterations in glycolysis/gluconeogenesis; Figure S8: Pathview renderings of alterations in pyrimidineand purine metabolism; Figure S9: Pathview renderings of alterations in alanine aspartate and glutamate metabolism histidine metabolism tryptophan metabolism and glycine, serine and threonine metabolism

Author Contributions

Conceptualization, Waddah Alrefai and Ravinder Gill; Formal analysis, Nathan Calzadilla; Funding acquisition, Nathan Calzadilla, Seema Saksena, Pradeep Dudeja, Waddah Alrefai and Ravinder Gill; Investigation, Aisha Qazi, Anchal Sharma, Kai Mongan, Shane Comiskey, Jahnavi Manne, Alvin Youkhana and Sonam Khanna; Methodology, Nathan Calzadilla, Aisha Qazi and Anchal Sharma; Writing – original draft, Nathan Calzadilla; Writing – review & editing, Nathan Calzadilla, Seema Saksena, Pradeep Dudeja, Waddah Alrefai and Ravinder Gill.All authors have read and agreed to the published version of the manuscript.

Funding

These studies were supported by the NIDDK grants R01 DK098170 (RKG), the Crohn’s and Colitis Foundation CCFA 581138 (RKG), and the Department of Veterans Affairs I01BX000152 (WAA), I01BX002867 (SS), VA Merit Award I01BX002011 (PKD), VA Senior Research Career Scientist Award 1IK6BX005242 (PKD), VA BCCMA Award I01BX005862 (PKD), NIH NIDDK grant R01 DK092441 and R01 DK054016 (PKD), and F30AA030222 (NC)

Data Availability Statement

All data will be made publicly available as a GEO dataset.

Conflicts of Interest

The authors declare no conflict of interest.

References

  1. Kaplan, G.G.; Ng, S.C. Understanding and Preventing the Global Increase of Inflammatory Bowel Disease. Gastroenterology 2017, 152, 313–321e2. [Google Scholar] [CrossRef]
  2. Guan, Q. A Comprehensive Review and Update on the Pathogenesis of Inflammatory Bowel Disease. J Immunol Res 2019, 2019, 7247238. [Google Scholar] [CrossRef] [PubMed]
  3. Al-Bawardy, B.; Shivashankar, R.; Proctor, D.D. Novel and Emerging Therapies for Inflammatory Bowel Disease. Front Pharmacol 2021, 12, 651415. [Google Scholar] [CrossRef] [PubMed]
  4. Chang, J.T. Pathophysiology of Inflammatory Bowel Diseases. N Engl J Med 2020, 383, 2652–2664. [Google Scholar] [CrossRef] [PubMed]
  5. Gallagher, K.; Catesson, A.; Griffin, J.L.; Holmes, E.; Williams, H.R.T. Metabolomic Analysis in Inflammatory Bowel Disease: A Systematic Review. J Crohns Colitis 2021, 15, 813–826. [Google Scholar] [CrossRef]
  6. Aldars-García, L.; Chaparro, M.; Gisbert, J.P. Systematic Review: The Gut Microbiome and Its Potential Clinical Application in Inflammatory Bowel Disease. Microorganisms 2021, 9, 977. [Google Scholar] [CrossRef]
  7. Baydi, Z.; Limami, Y.; Khalki, L.; Zaid, N.; Naya, A.; Mtairag, E.M.; Oudghiri, M.; Zaid, Y. An Update of Research Animal Models of Inflammatory Bowel Disease. ScientificWorldJournal 2021, 2021, 7479540. [Google Scholar] [CrossRef]
  8. Lanis, J.M.; Alexeev, E.E.; Curtis, V.F.; Kitzenberg, D.A.; Kao, D.J.; Battista, K.D.; Gerich, M.E.; Glover, L.E.; Kominsky, D.J.; Colgan, S.P. Tryptophan Metabolite Activation of the Aryl Hydrocarbon Receptor Regulates IL-10 Receptor Expression on Intestinal Epithelia. Mucosal Immunol 2017, 10, 1133–1144. [Google Scholar] [CrossRef]
  9. Gu, Z. Complex Heatmap Visualization. iMeta 2022, 1, e43. [Google Scholar] [CrossRef]
  10. Gu, Z.; Eils, R.; Schlesner, M. Complex Heatmaps Reveal Patterns and Correlations in Multidimensional Genomic Data. Bioinformatics 2016, 32, 2847–2849. [Google Scholar] [CrossRef]
  11. Yu, G.; Xu, C.; Zhang, D.; Ju, F.; Ni, Y. MetOrigin: Discriminating the Origins of Microbial Metabolites for Integrative Analysis of the Gut Microbiome and Metabolome. iMeta 2022, 1, e10. [Google Scholar] [CrossRef]
  12. Xia, J.; Psychogios, N.; Young, N.; Wishart, D.S. MetaboAnalyst: A Web Server for Metabolomic Data Analysis and Interpretation. Nucleic Acids Research 2009, 37, W652–W660. [Google Scholar] [CrossRef]
  13. Krawisz, J.E.; Sharon, P.; Stenson, W.F. Quantitative Assay for Acute Intestinal Inflammation Based on Myeloperoxidase Activity. Assessment of Inflammation in Rat and Hamster Models. Gastroenterology 1984, 87, 1344–1350. [Google Scholar] [CrossRef]
  14. McIver, L.J.; Abu-Ali, G.; Franzosa, E.A.; Schwager, R.; Morgan, X.C.; Waldron, L.; Segata, N.; Huttenhower, C. BioBakery: A Meta’omic Analysis Environment. Bioinformatics 2018, 34, 1235–1237. [Google Scholar] [CrossRef]
  15. Beghini, F.; McIver, L.J.; Blanco-Míguez, A.; Dubois, L.; Asnicar, F.; Maharjan, S.; Mailyan, A.; Manghi, P.; Scholz, M.; Thomas, A.M.; et al. Integrating Taxonomic, Functional, and Strain-Level Profiling of Diverse Microbial Communities with BioBakery 3. eLife 2021, 10, e65088. [Google Scholar] [CrossRef] [PubMed]
  16. Ahmad, R.; Sorrell, M.F.; Batra, S.K.; Dhawan, P.; Singh, A.B. Gut Permeability and Mucosal Inflammation: Bad, Good or Context Dependent. Mucosal Immunol 2017, 10, 307–317. [Google Scholar] [CrossRef] [PubMed]
  17. Drury, B.; Hardisty, G.; Gray, R.D.; Ho, G.-T. Neutrophil Extracellular Traps in Inflammatory Bowel Disease: Pathogenic Mechanisms and Clinical Translation. Cell Mol Gastroenterol Hepatol 2021, 12, 321–333. [Google Scholar] [CrossRef] [PubMed]
  18. Santana, P.T.; Rosas, S.L.B.; Ribeiro, B.E.; Marinho, Y.; de Souza, H.S.P. Dysbiosis in Inflammatory Bowel Disease: Pathogenic Role and Potential Therapeutic Targets. Int J Mol Sci 2022, 23, 3464. [Google Scholar] [CrossRef] [PubMed]
  19. Chang, Q.; Luan, Y.; Sun, F. Variance Adjusted Weighted UniFrac: A Powerful Beta Diversity Measure for Comparing Communities Based on Phylogeny. BMC Bioinformatics 2011, 12, 118. [Google Scholar] [CrossRef] [PubMed]
  20. Parada Venegas, D.; De la Fuente, M.K.; Landskron, G.; González, M.J.; Quera, R.; Dijkstra, G.; Harmsen, H.J.M.; Faber, K.N.; Hermoso, M.A. Short Chain Fatty Acids (SCFAs)-Mediated Gut Epithelial and Immune Regulation and Its Relevance for Inflammatory Bowel Diseases. Front Immunol 2019, 10, 277. [Google Scholar] [CrossRef] [PubMed]
  21. Wang, W.; Chen, L.; Zhou, R.; Wang, X.; Song, L.; Huang, S.; Wang, G.; Xia, B. Increased Proportions of Bifidobacterium and the Lactobacillus Group and Loss of Butyrate-Producing Bacteria in Inflammatory Bowel Disease. J Clin Microbiol 2014, 52, 398–406. [Google Scholar] [CrossRef]
  22. Qiu, Z.; Yang, H.; Rong, L.; Ding, W.; Chen, J.; Zhong, L. Targeted Metagenome Based Analyses Show Gut Microbial Diversity of Inflammatory Bowel Disease Patients. Indian J Microbiol 2017, 57, 307–315. [Google Scholar] [CrossRef] [PubMed]
  23. Peace, C.G.; O’Neill, L.A. The Role of Itaconate in Host Defense and Inflammation. J Clin Invest 2022, 132, e148548. [Google Scholar] [CrossRef] [PubMed]
  24. Clooney, A.G.; Eckenberger, J.; Laserna-Mendieta, E.; Sexton, K.A.; Bernstein, M.T.; Vagianos, K.; Sargent, M.; Ryan, F.J.; Moran, C.; Sheehan, D.; et al. Ranking Microbiome Variance in Inflammatory Bowel Disease: A Large Longitudinal Intercontinental Study. Gut 2021, 70, 499–510. [Google Scholar] [CrossRef] [PubMed]
  25. Abdel-Rahman, L.I.H.; Morgan, X.C. Searching for a Consensus Among Inflammatory Bowel Disease Studies: A Systematic Meta-Analysis. Inflamm Bowel Dis 2023, 29, 125–139. [Google Scholar] [CrossRef] [PubMed]
  26. Nie, K.; Ma, K.; Luo, W.; Shen, Z.; Yang, Z.; Xiao, M.; Tong, T.; Yang, Y.; Wang, X. Roseburia Intestinalis: A Beneficial Gut Organism From the Discoveries in Genus and Species. Frontiers in Cellular and Infection Microbiology 2021, 11. [Google Scholar] [CrossRef] [PubMed]
  27. Luo, W.; Shen, Z.; Deng, M.; Li, X.; Tan, B.; Xiao, M.; Wu, S.; Yang, Z.; Zhu, C.; Tian, L.; et al. Roseburia Intestinalis Supernatant Ameliorates Colitis Induced in Mice by Regulating the Immune Response. Mol Med Rep 2019, 20, 1007–1016. [Google Scholar] [CrossRef] [PubMed]
  28. Tilg, H.; Danese, S. Roseburia Hominis: A Novel Guilty Player in Ulcerative Colitis Pathogenesis? Gut 2014, 63, 1204–1205. [Google Scholar] [CrossRef] [PubMed]
  29. Facchin, S.; Vitulo, N.; Calgaro, M.; Buda, A.; Romualdi, C.; Pohl, D.; Perini, B.; Lorenzon, G.; Marinelli, C.; D’Incà, R.; et al. Microbiota Changes Induced by Microencapsulated Sodium Butyrate in Patients with Inflammatory Bowel Disease. Neurogastroenterology & Motility 2020, 32, e13914. [Google Scholar] [CrossRef]
  30. Alexeev, E.E.; Lanis, J.M.; Kao, D.J.; Campbell, E.L.; Kelly, C.J.; Battista, K.D.; Gerich, M.E.; Jenkins, B.R.; Walk, S.T.; Kominsky, D.J.; et al. Microbiota-Derived Indole Metabolites Promote Human and Murine Intestinal Homeostasis through Regulation of Interleukin-10 Receptor. Am J Pathol 2018, 188, 1183–1194. [Google Scholar] [CrossRef]
  31. Wu, H.; Zhang, M.; Li, W.; Zhu, S.; Zhang, D. Stachydrine Attenuates IL-1β-Induced Inflammatory Response in Osteoarthritis Chondrocytes through the NF-ΚB Signaling Pathway. Chem Biol Interact 2020, 326, 109136. [Google Scholar] [CrossRef] [PubMed]
  32. Gao, Y.; Zhou, B.; Zhang, H.; Chen, L.; Wang, X.; Chen, H.; Zhou, L. L-Ergothioneine Exhibits Protective Effects against Dextran Sulfate Sodium-Induced Colitis in Mice. ACS Omega 2022, 7, 21554–21565. [Google Scholar] [CrossRef] [PubMed]
  33. Bryan, P.-F.; Karla, C.; Edgar Alejandro, M.-T.; Sara Elva, E.-P.; Gemma, F.; Luz, C. Sphingolipids as Mediators in the Crosstalk between Microbiota and Intestinal Cells: Implications for Inflammatory Bowel Disease. Mediators Inflamm 2016, 2016, 9890141. [Google Scholar] [CrossRef] [PubMed]
  34. Hu, D.; Zhang, D.; Zheng, S.; Guo, M.; Lin, X.; Jiang, Y. Association of Ulcerative Colitis with FUT2 and FUT3 Polymorphisms in Patients from Southeast China. PLoS One 2016, 11, e0146557. [Google Scholar] [CrossRef] [PubMed]
  35. Kappler, K.; Lasanajak, Y.; Smith, D.F.; Opitz, L.; Hennet, T. Increased Antibody Response to Fucosylated Oligosaccharides and Fucose-Carrying Bacteroides Species in Crohn’s Disease. Frontiers in Microbiology 2020, 11. [Google Scholar] [CrossRef] [PubMed]
  36. Vermeulen, N.; Vermeire, S.; Arijs, I.; Michiels, G.; Ballet, V.; Derua, R.; Waelkens, E.; Van Lommel, L.; Schuit, F.; Rutgeerts, P.; et al. Seroreactivity against Glycolytic Enzymes in Inflammatory Bowel Disease. Inflamm Bowel Dis 2011, 17, 557–564. [Google Scholar] [CrossRef]
  37. Hryhorowicz, S.; Kaczmarek-Ryś, M.; Zielińska, A.; Scott, R.J.; Słomski, R.; Pławski, A. Endocannabinoid System as a Promising Therapeutic Target in Inflammatory Bowel Disease – A Systematic Review. Frontiers in Immunology 2021, 12. [Google Scholar] [CrossRef]
  38. Sochal, M.; Ditmer, M.; Binienda, A.; Gabryelska, A.; Białasiewicz, P.; Talar-Wojnarowska, R.; Fichna, J.; Małecka-Wojciesko, E. Relation between Selected Sleep Parameters, Depression, Anti-Tumor Necrosis Factor Therapy, and the Brain-Derived Neurotrophic Factor Pathway in Inflammatory Bowel Disease. Metabolites 2023, 13, 450. [Google Scholar] [CrossRef]
  39. Jo, J.-K.; Seo, S.-H.; Park, S.-E.; Kim, H.-W.; Kim, E.-J.; Kim, J.-S.; Pyo, J.-Y.; Cho, K.-M.; Kwon, S.-J.; Park, D.-H.; et al. Gut Microbiome and Metabolome Profiles Associated with High-Fat Diet in Mice. Metabolites 2021, 11, 482. [Google Scholar] [CrossRef]
  40. Rustgi, S.D.; Kayal, M.; Shah, S.C. Sex-Based Differences in Inflammatory Bowel Diseases: A Review. Therap Adv Gastroenterol 2020, 13, 1756284820915043. [Google Scholar] [CrossRef]
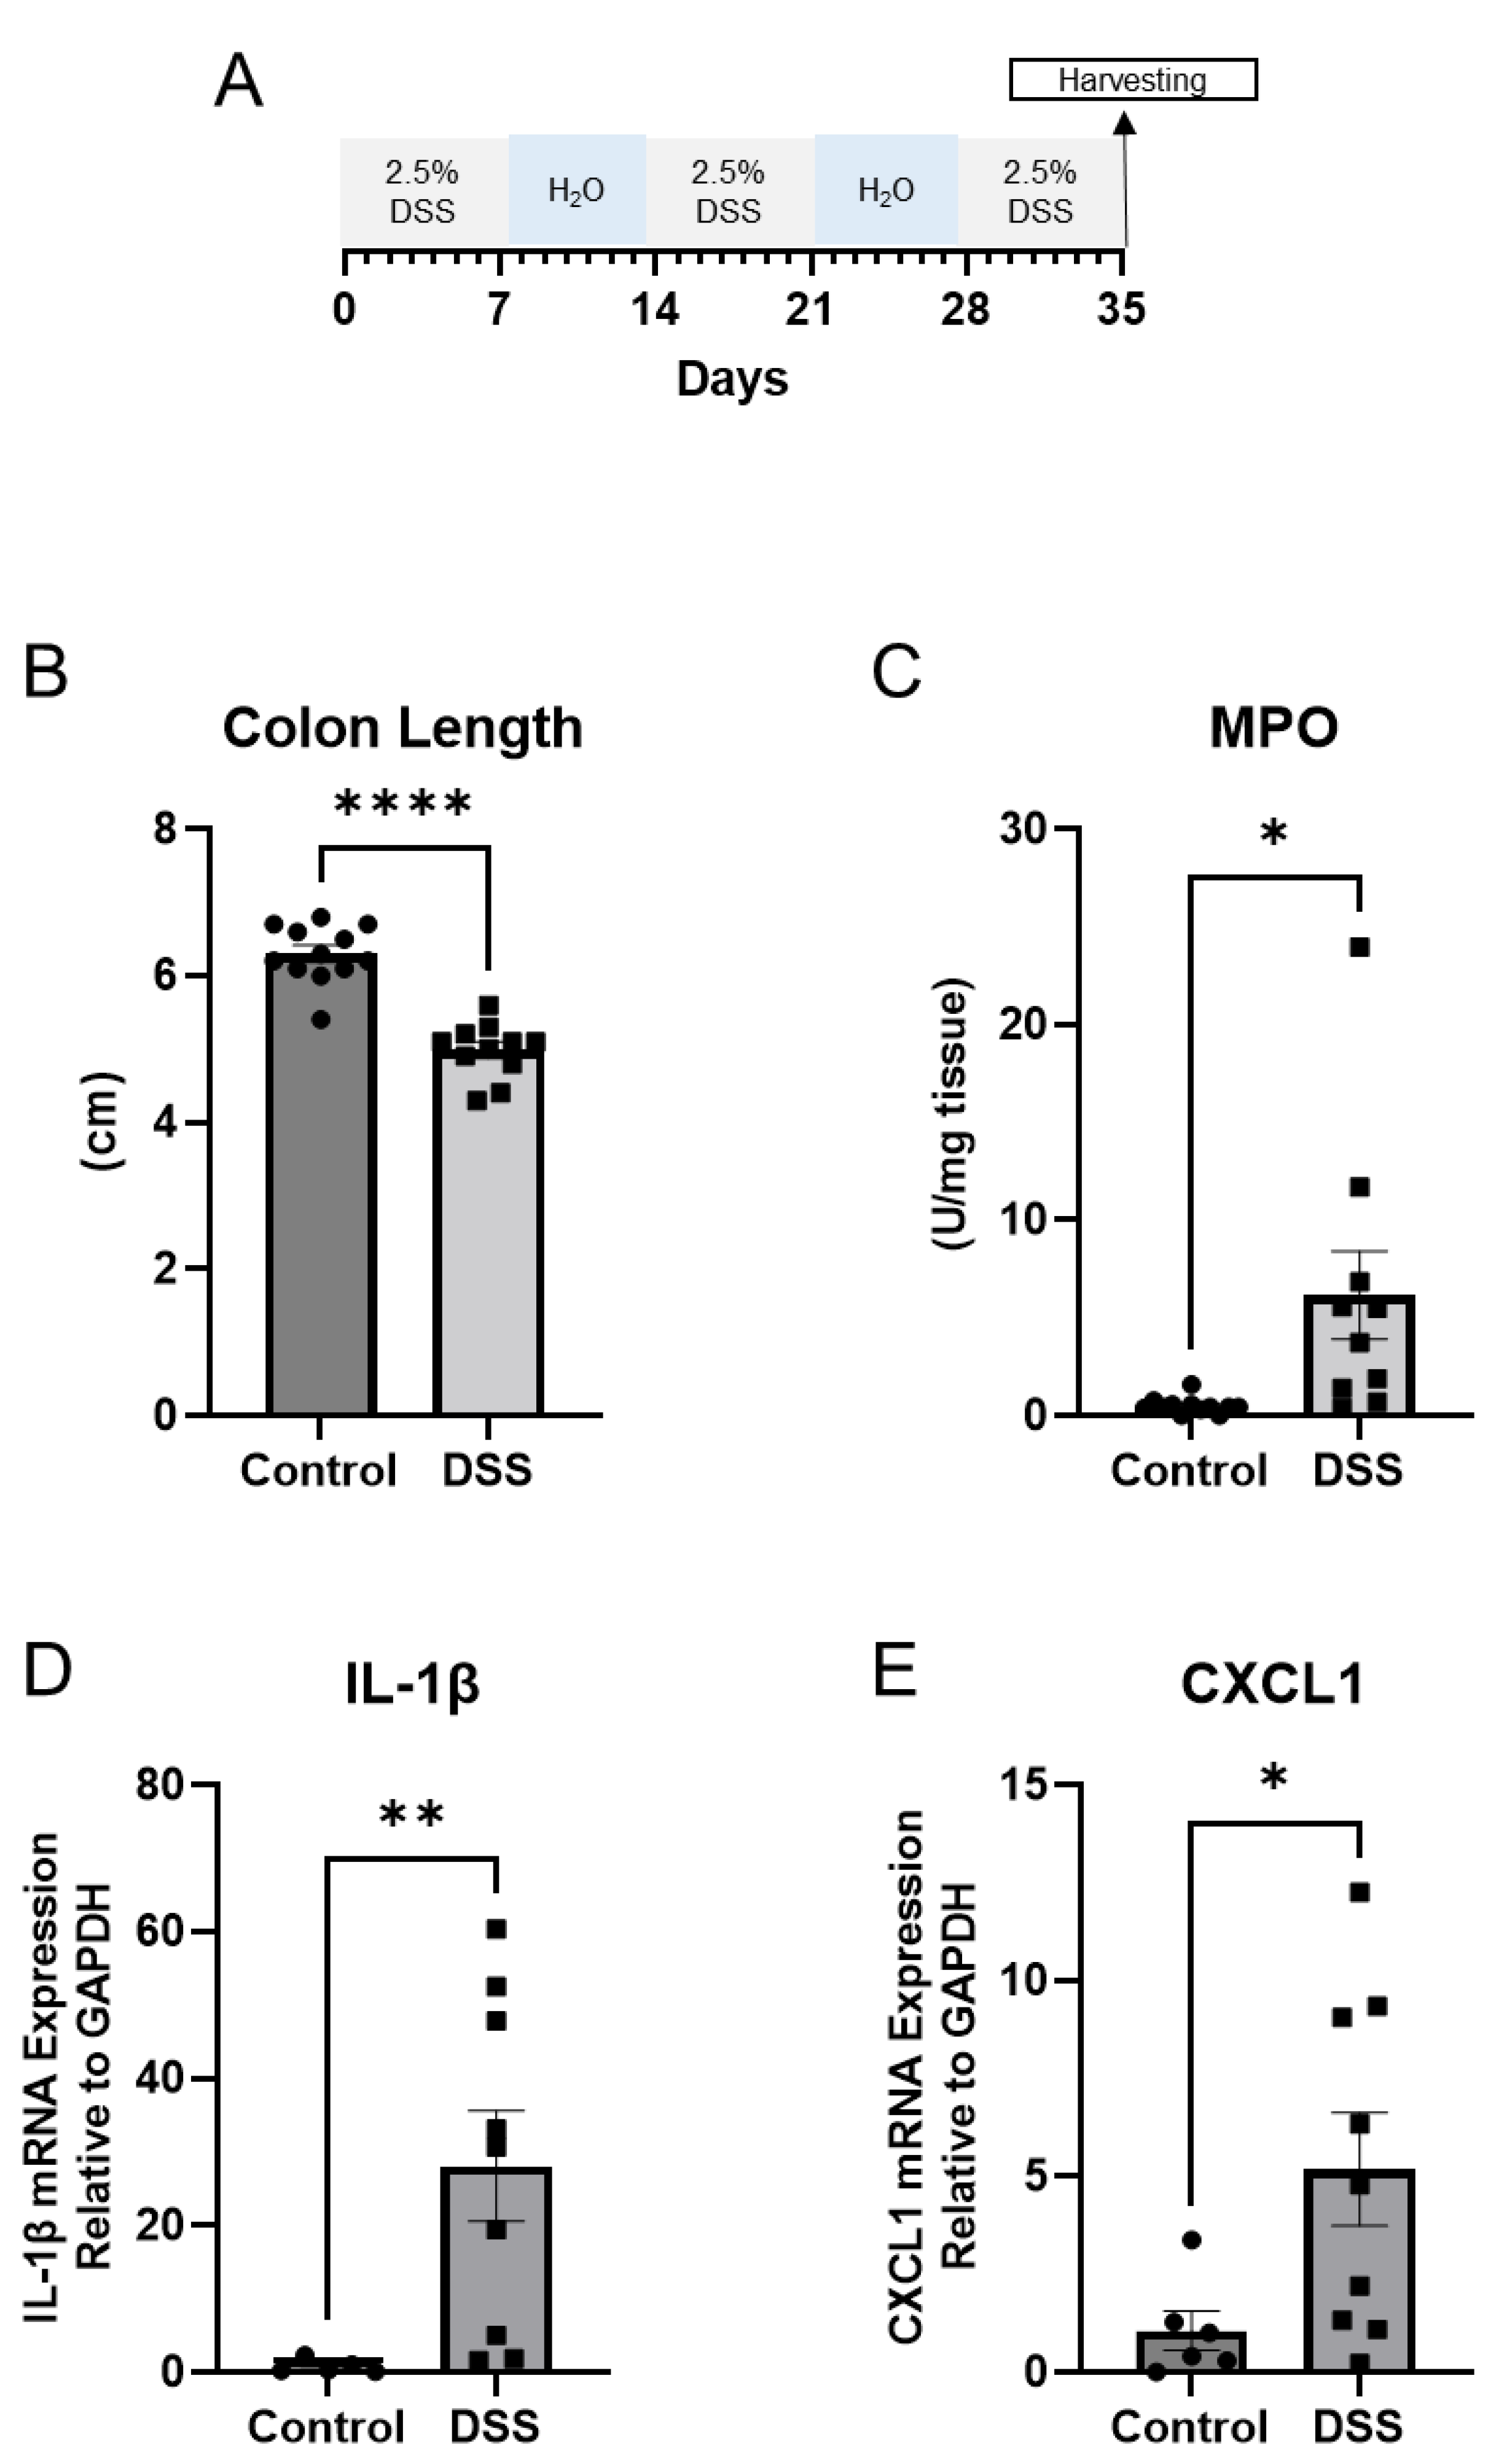
Figure 1. A. Schematic for study design. B. Colon length (cm), C. Myeloperoxidase activity units per mg of tissue (Control n = 12; DSS n = 11). D, E. Quantitative PCR for IL-1β and CXCL1 in distal colon mucosa (Control n = 5; DSS n = 9). (Welch T-test; * p < 0.05, ** p < 0.01, **** p < 0.0001).
Preprints 76414 g001
Figure 2. A. Cladogram highlighting taxa associated with control water and DSS treatments based on linear discriminant analysis effect size. B. Top 20 taxa associated with control group based on LEfSe analysis (top) and top 20 taxa associated with DSS group based on LEfSe analysis (bottom). C. Boxplots of relative abundances for various taxa associated with IBD. (p < 0.05, Welch t-test; Control n = 12; DSS n = 11). D. Boxplots for alpha diversity measures. E. Weighted-UniFrac beta diversity plot.
Preprints 76414 g002
Figure 3. A. Volcano plot (the log2 of the fold change of metabolites in WT DSS compared to WT was plotted against the -log10 of the p-value) and B. Pie chart showing the proportion of differentially altered metabolites by metabolite subtype. C. sPLSDA plots generated in Metaboanalyst using the Statistical Analysis function. D. Top 25 enriched pathways in mucosa of control vs DSS treated mice.
Preprints 76414 g003
Figure 4. A. Ridgeline plot showing the distributions of differentially altered metabolites with known roles as inflammatory mediators (p < 0.05, q < 0.01, Welch t-test; Control n = 6; DSS n = 7). The values within the parenthesis indicate the fold change between DSS and control. B. Raincloud plots showing abundance and distributions of differentially altered enterohepatic metabolites (p < 0.05, q < 0.01, Welch t-test; Control n = 6; DSS n = 7).
Preprints 76414 g004
Figure 5. A. Heatmap of microbial related and B. co-metabolized differentially altered metabolites between control and chronic colitis mice (p < 0.05, q < 0.1, Welch t-test; Control n = 6; DSS n = 7. C. Correlation plot showing Spearman correlation coefficients between microbial metabolites and MPO activity that were statistically significant (p < 0.05).
Preprints 76414 g005
Figure 6. Heatmaps of differentially altered metabolites (p < 0.05, q < 0.1, Welch t-test) in A. dietary factors, B. intermediary metabolism, C. nucleotide metabolism, and D. amino acid metabolism. Heatmap was scaled from -4 to 4. (Control = 6; DSS n = 7).
Preprints 76414 g006
Disclaimer/Publisher’s Note: The statements, opinions and data contained in all publications are solely those of the individual author(s) and contributor(s) and not of MDPI and/or the editor(s). MDPI and/or the editor(s) disclaim responsibility for any injury to people or property resulting from any ideas, methods, instructions or products referred to in the content.
Copyright: This open access article is published under a Creative Commons CC BY 4.0 license, which permit the free download, distribution, and reuse, provided that the author and preprint are cited in any reuse.
Prerpints.org logo

Preprints.org is a free preprint server supported by MDPI in Basel, Switzerland.

Subscribe

© 2024 MDPI (Basel, Switzerland) unless otherwise stated