1. Introduction
The risk management within the investment and the attitude towards the risk by the investors recalibrate the economic system in general, (Akerlof, 1978) . It is in this perspective, the innovation in the finance industry shape the century by introducing successive financial products with different characteristics and typologies to make sure that serve the investment sector in terms of stability and rentability and available for all type of risk attitude such as risk taken and risk aversion. However,, the systemic risk of these products didn’t confirm the properties of safe havens investment. Within reframe of the technologies in all the sectors and the realm for the economic sector with different sectors. The introduction of the new technologies within the economic system build a good infrastructure for the borne of the cryptocurrencies surrounding by the main goals for the macroeconomic system such as the stability. Within that occurrence, of this innovation, the cryptocurrencies was overcoming until recently one biggest extra-economic shock, the health crisis, which is classified as a multidimensional crisis as it does influence all the sectors including the capital market. Stock markets all over the world have responded in terms of growing risks and changing intermarket linkages within the frame of the world-wide health crisis COVID 19,(Zhang et al , 2020) . The pandemic was previously studied in many health crisis like for example the SARS 2012, and the outbreak of the flu H1N1 as it is coincided with a severe global financial downturn (Peckham, 2013). The emergence of the health pandemic 2020 was followed by a strict measure in the health sectors as well as the others such as “ stay at home”, partial time for work, distance; these measure was considered as main tools to be able to have a control over the spread and to maintain the economic system. Within these measures, a disequilibrium in the supply and demand was setting up leading it by the disruption of the production system size. It is basic on the economic system frame and the nature of the financial market that each economy overcome this crisis as equity prices have plummeted as well as internationally traded commodity, followed by a collapse in the oil prices and high volatility of the equity markets leading to a higher uncertainty. Within that frame, the cryptocurrencies was influenced as much as the other assets such as oil, metals like silver and gold and the stock markets in terms of volatility, and returns. The cryptocurrencies is one of the assets that was highly influenced by the pandemic in terms of investment. For that reason we will study the safe haven properties of the cryptocurrencies including a wide range of global cryptocurrencies for the sampled dataset. The related literature studying that topics are quite limited within the conclusion of that the impact of pre-COVID 19 and post-COVID 19 is highly different and in some studies they are proved the opposition of that studies in terms of safe haven properties investment (Antonakakis et al., 2017). As it is assumed that the post crisis is followed by high volatility and uncertainties for all markets (Gencer and Musoglu, 2014), including the stock market. Our main purpose within this paper is to study the case of cryptocurrencies as hedging asset in portfolio diversification and safe haven in non-stabilised market environment and higher economic uncertainties following by crisis. According to (Hussain Shahzad et al., 2020) a safe haven asset is taken the properties of uncorrelated or negatively uncorrelated with other assets or portfolio during times of market turmoil, the safe haven properties of an assets allow the hedger to have a portfolio down-risk. With reference to this definition, our empirical model is taken the properties of safe haven investment and use the GARCH model to study the cryptocurrencies models within COVID 19 period. The rest of the study is classified as follow, section 2 is dedicated for the related literature on safe haven properties investment for all the concerned assets, section 3 analyze the development of the cryptocurrencies within the selected period with comparison to the other assets such as stocks assets.
Section 4 provide a discussion on the methodology conducted in this study, followed by the empirical results, and the last section is rendered for policy recommendation and concluding remark.
2. Literature Review
The purpose of this article is to shed the light about the impact of the cryptocurrencies on the economic system within the health crisis outbreak, we take the case of the cryptocurrency and their penetration on the financial system and what is their main properties as a safe haven investment. Kumah and Odei-Mensah(2021) provide evidence of interconnectedness between the cryptocurrencies and other markets. The litterature which studying the impact of the cryptocurrencies as a safe haven investment it is quiete important as it is a source of hedging which reaching the similar properties of downside risk as much as the gold , the currencies, long dated treasury bonds, the oil and the government bonds. The COVID 19 health crisis is known as the most important shock occurred from the essor of the cryptocurrencies. Within this part we will focus on the main literature revue which examines further the safe haven properties of cryptocurrencies comparing to the other stock markets before and during the Covid 19 pandemic.
2.1. Cryptocurrencies Pre-COVID19 Period
The literature review studying and testing the safe haven investment for cryptocurrencies is diverse and the main driver conducting this assumption is the independence in monetary policy.(Bouri et al., 2017) studying the impact of bitcoin as hedge for global uncertainty using the first principal component of the VIX indices as measure for a sample of 14 developped and developing equity markets, the authors argue that bitcoin does act as a hedge against uncertainty positively at both higher quantiles and shorter frequency movements of bitcoin returns. Within this overview there are several literature which studying the development of the cryptocurrencies on Bitcoin to study the rapidly growing of cryptocurrency market price and information flows such as (Akyildirim et al., 2020), (Corbet et al., 2018), (Brandvold et al., 2015).
The studies who are studying the bitcoin as a safe haven investment for the investors are mainly agree on general conclusion that the cryptocurrencies does not confirm the properties of the safe havens investments. In that purpose, ((Corbet et al., 2018) shed the light on the evidence speculative behaviour manifesting in terms of bubbles that prevent their property of safe haven investment to be occurred. At the same perspective(Klein et al., 2018) contrast the hedging and safe haven properties of gold and Bitcoin and finding a positive correlation with downward moves in developed markets. The evidence that cryptocurrencies should rule it out as safe haven properties for cryptocurrencies is conducted previously arguing that it is more volatile, less liquid and costlier to transact than any other assets.
2.2. Cryptocurrencies Post-COVID19 Period
Conversely; the literature studying the cryptocurrencies during the COVID 19 crisis is variant in terms of the methodologies used for that. (Guesmi et al., 2019) argue that the downside portfolio risk is quite important within the inclusion of Bitcoin in a portfolio comprising of Gold, oil and emerging market stocks. (Jiang et al., 2021) examine the interconnectedness between the EPU and cryptocurrencies and those between COVID-19 pandemic and cryptocurrencies proofing that cryptocurrencies act as good hedging tools against high EPU but not during period of moderate or low EPU and that their hedging properties don’t remain all the time. In the same perspective by sheding the light on their characteristics, Shahzad et al (2019) use cross quantilogram approach and find out that bitcoin, gold and commodity index are weak safe havens but that this behaviour is time-varying, using a different approach based based at the hourly frequency Urquhart and (Zhang, 2020) find that Bitcoin is acting as hedge diversifier and safe haven for a range of international currencies. In contrast to these studies prior COVID 19 pandemic (Wang et al., 2019) using a wide range of cryptocurrencies argue that digital currencies act as safe haven for most international studies indicators.(Kumah and Odei-Mensah, 2021) find evidence that the stock market are highly exposed to cryptocurrency market disruption from the medium term and international investors seeking to hedge their price risk in stock market using cryptocurrencies may have to look at the short term. (Kliber et al., 2019) examine the time varying hedging and safe haven properties of Bitcoin using a multivariate stochastic volatility model with dynamic conditional correlation, the authors find out that bitcoin is act as a weak hedge in all markets when investment in US dollars is considered and a safe haven in Venezuela. Examining the co-movements between bitcoin and the Dow Jones World stock market index, regional Islamic stock markets and Sukuk market, (Mensi et al., 2019) use Wavelet transformation techniques to find out the evidence of diversification with Bitcoin, but this result is consistent to be smaller for longer-term investors compared to short term investors. Disli et al (2021) assesses the role of old, crude oil and cryptocurrencies as a safe haven for equity market investors, the author find out that within the onset of the pandemic the oil the gold and Bitcoin do not exhibit safe haven characteristics, however with the outbreak of the pandemic the gold, oil and Bitcoin exhibited low coherency with each stocks index across almost all considered investment horizon. (Corbet et al., 2020), study the relationship between the largest cryptocurrencies and the development of the COVID 19 outbreak considering it as the scale of economic shock centralized within the rapidly escalating pandemic. The authors prove that a significant rise in both return and volume and suggesting that the digital assets is a safe similar to precious metals during the crisis such as COVID 19. Colon et al 2020 study the impact of the COVID 19 pandemic as the largest widespread condition market since the essor of the cryptocurrency test the safe haven properties of the largest cryptocurrencies from the international perspective. The sampled cryptocurrencies confirm a difference in terms of safe havens properties based of the difference market impaired downside risk hedging. (Dwita Mariana et al., 2021) reveals that safe haven features that Etherum is possibly a better safe haven than bitcoin for stocks during the pandemic. (Mokni et al., 2022) examines the cryptocurrencies and the gold as safe haven investment against the EPU before and during the ongoing COVID-19 crisis, finding out that the cryptocurrencies and the gold at as a strong hedge investment or safe haven investment against EPU before and during the COVID-19 pandemic. At the same perspective, (Maitra et al., 2022) provide a comparative approach before and during the COVID-19 pandemic to examine the cryptocurrencies and stocks as safe haven investment finding out that the cryptocurrencies cannot provide incremental gains by hedging stock market during the COVID-19 pandemic. (Corbet et al., 2020) studying the safe havens properties of the cryptocurrencies using the return as the main indicator within a GARCH model, finding out that a developed significant and pronounced time varying price volatility effects as investors identified both the severity and the nature of the pandemic trajectory and potential economic repercussion. (Segnon and Bekiros, 2020) study the dynamic governing the mean and Variance processes of the Bitcoin, and find out that the Markov switching multifractal and FIGARCH models. The literature studying the efficiency as one the properties of safe haven investments from the outbreak of COVID 19 crisis is diverse from inefficiency such as (Urquhart, 2016) to efficiency such as. (Naeem et al., 2021) examine the asymmetric efficiency for hourly wide range of cryptocurrencies using asymmetric multifractal detrended fluctuation analysis, the authors find out that the COVID 19 outbreak have adverse effects of on the efficiency of leading cryptocurrencies confirming that the market efficiency is time varying. (Zargar and Kumar, 2019) and (Chu et al., 2019) examine the efficiency of the Bitcoin and a wide range of cryptocurrencies respectively using a daily data and using different methodologies find out that the given complexity of the cryptocurrency markets as reflected by the evidence of non-linearity and asymmetric multifractality. In the same perspective, concerning the study the safe haven properties of the cryptocurrencies , several studies were focused on the stability , specially the effects have been identified of the gold and cryptocurrency-based contagion effects (Corbet et al., 2020).
3. Cryptocurrencies within the COVID 19 Crisis
Within the first half of this decade, the international economic system been matured to economic and extra-economic shocks followed by many institutional reframe within organisations. The Pandemic is the main crisis which occurred within that period, proving their realm for the sharing economy and hedging funds as a main economic system and financial tool to prevent from any idiosyncratic risk or any unexpected volatility in terms of stocks markets or instability within the prices and macroeconomic aggregates. The COVID 19 is the main health crisis, which occurred within the century, proving their economic impact as well health and political impact in all over the world. The total cumulative number of confirmed cases and death has reach 63012924 and 1353716 respectively (30-12-2020, worldwide). The
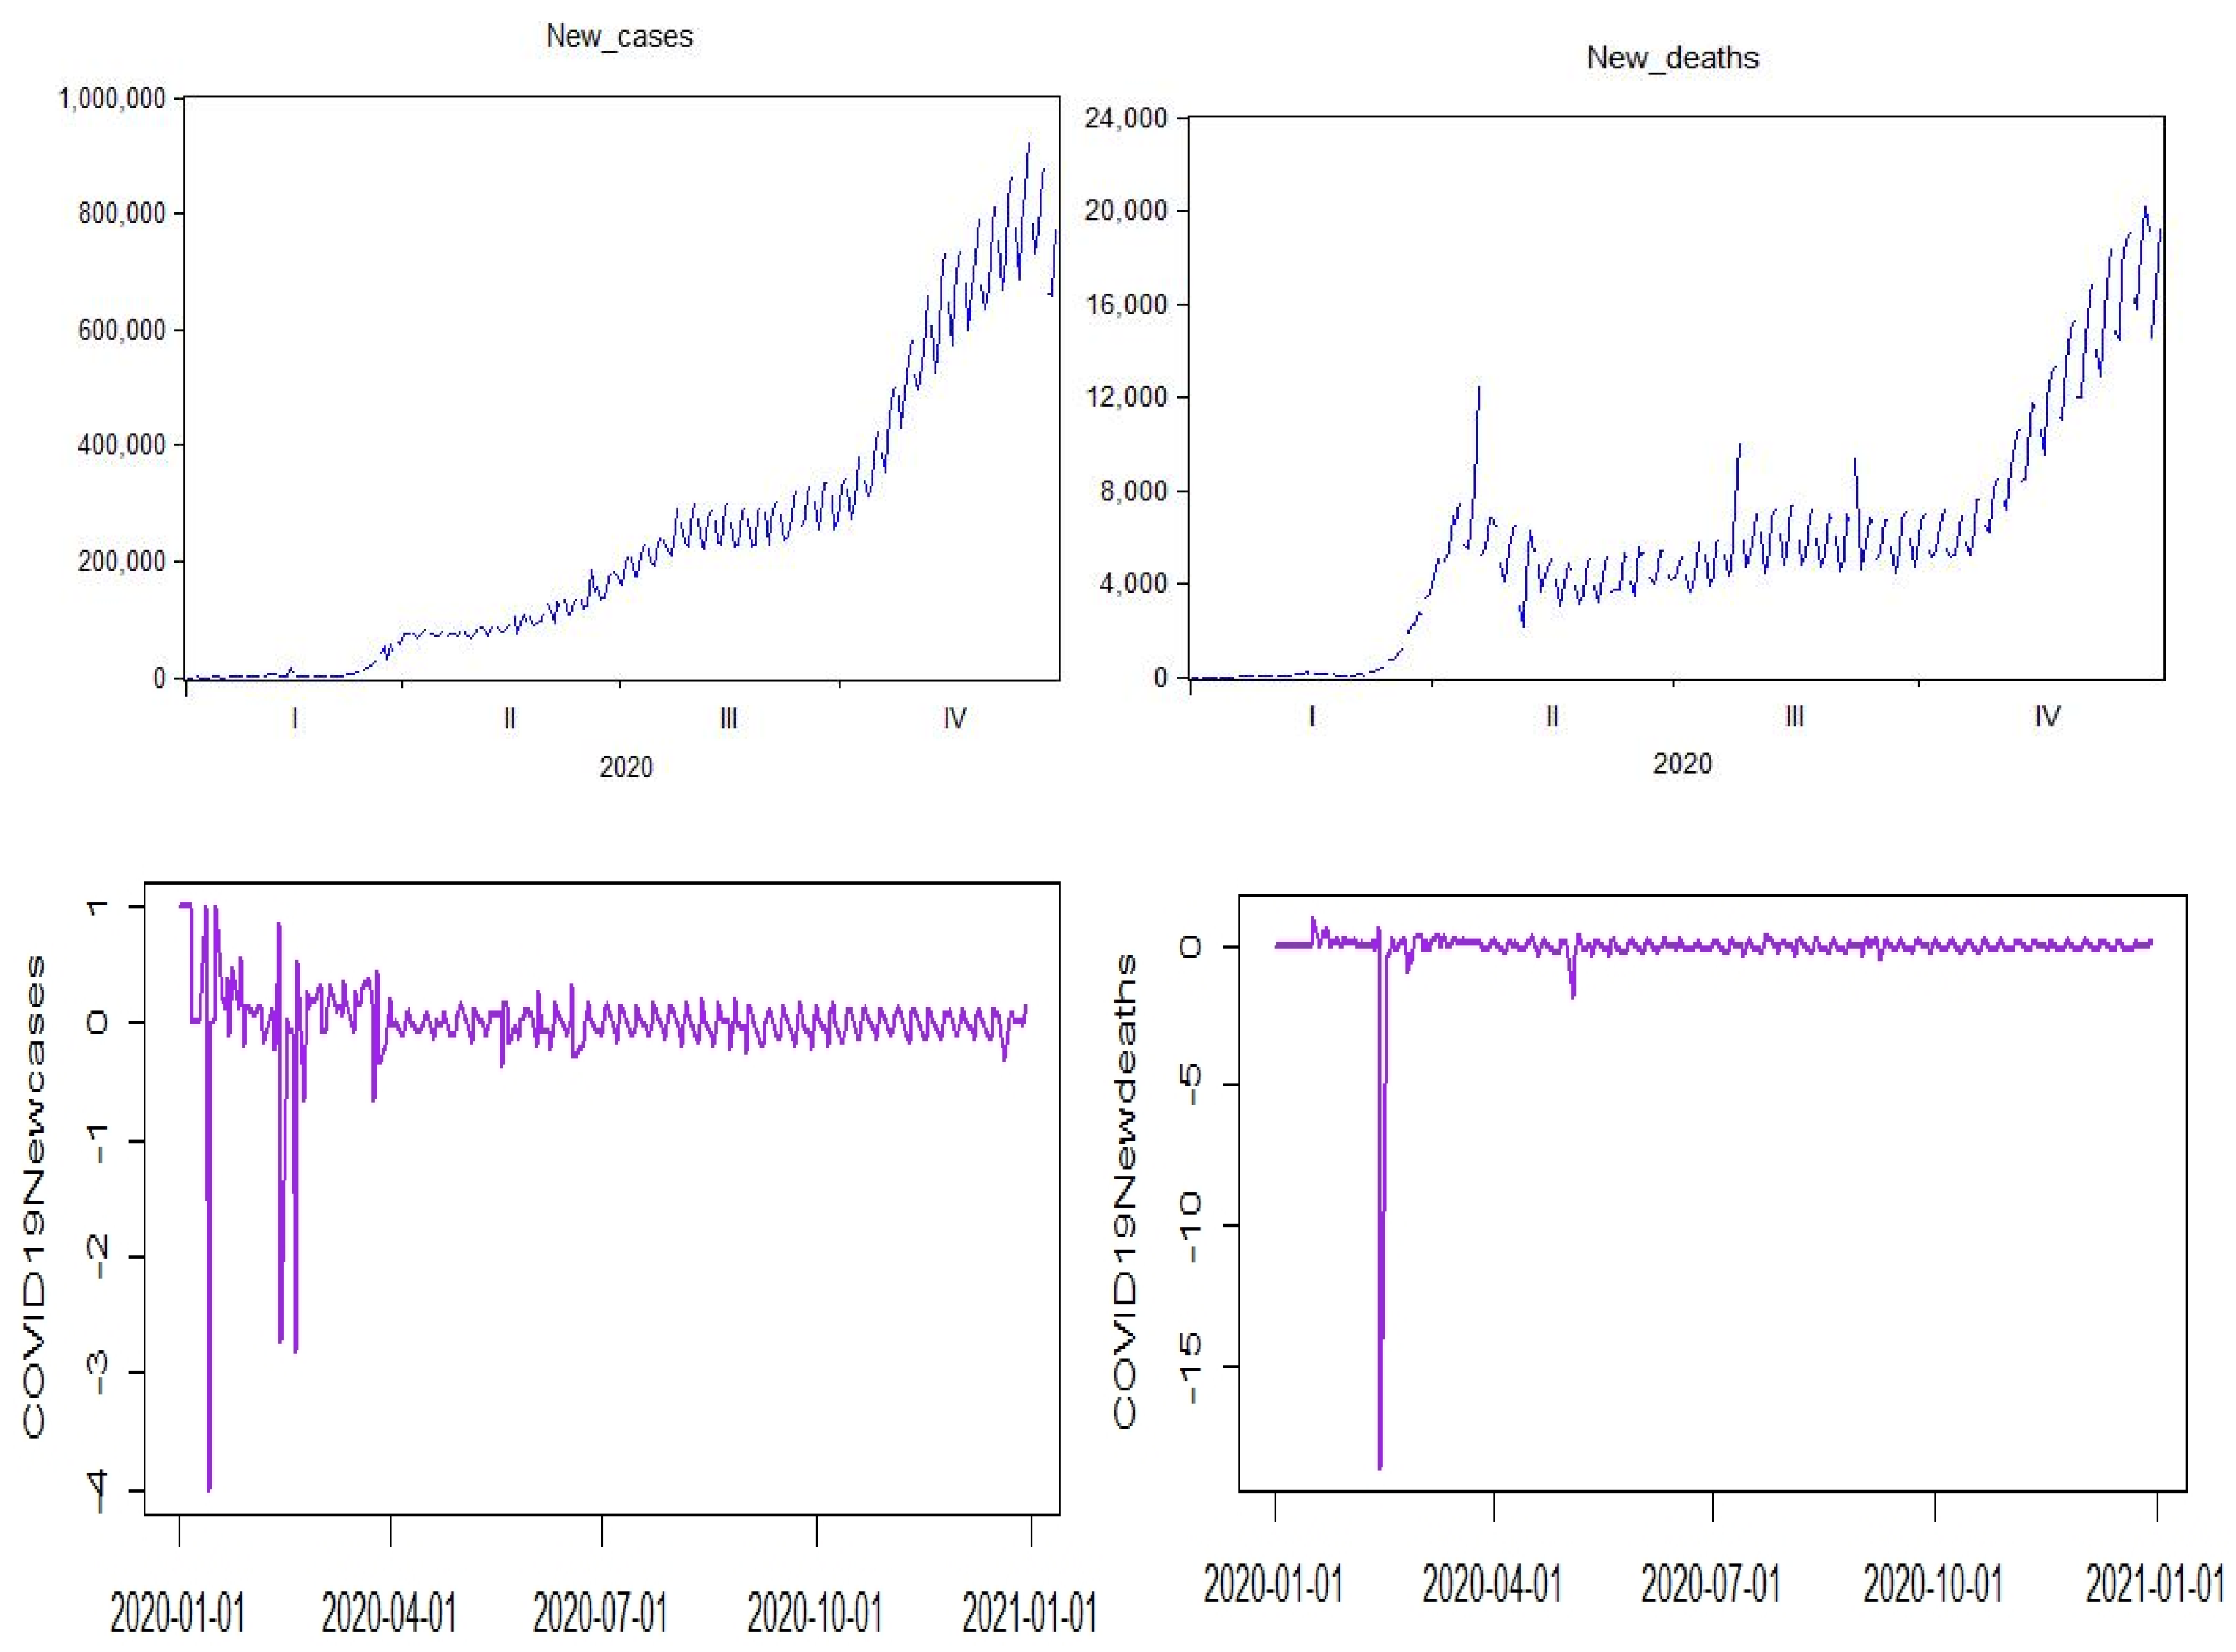
Figure 1 show the daily new cases as well as cumulative cases and death for COVID19 virus until December 2020. The global increase of the case of COVID 19 attracted global media. The first wave was in November 2019, following by the real serious rise from the beginning of the 2020. The unexpected crisis and the unprepared institutions for this frame was the main reason for the spread of the virus within communities. The measure given by the WHO (World health organisation) bring a rise for limiting the spread between nations such as Vaccine, lockdown, distancing, etc. However its severity and scale still varied by regions. According to
Figure 1 it is assumed that the peak phase of the crisis is passed and currently are going back gradually to the normalcy, as there is open up and the lockdown start partial measure. The severity of this crisis is not the same as the other crisis which occurred within the system whether political social or financial crisis. Like any other crisis, the last phase of the crisis , after the peak or post crisis era , there is a big uncertainties and volatilities within the financial market and the whole sectors of the economy, (Antonakakis et al., 2017). According to Fan et al (2018) the expected annual loss from pandemic risk to be annually approximately 500 billion dollars, or 0.6% global income. The SARS crisis known as respiratory syndrome in 2003 was costing the world wide between 30 and 100 billion (Smith, 2006).(Ang et al., 2021) evaluate the socioeconomic factors in containing the spread and mortality of COVID 19, find out that the higher number of infection or death are associated to the level of GDP and the socio economic factors such as education.
The COVID 19 crisis cost is beyond this sum. COVID 19 is a global crisis which lead to a long term shifting in costs of equity, the expectation of the rise in the perceived equity risk is reasonable within that environment. The COVID 19 has been considered a “once-in-a-century” pandemic(Gates, 2020). (Fernandes, 2020) estimate the cost of the COVID 19 to be 2.8% slowdown median economy, and at the extreme case could fall by more than 15%.
Figure 2-
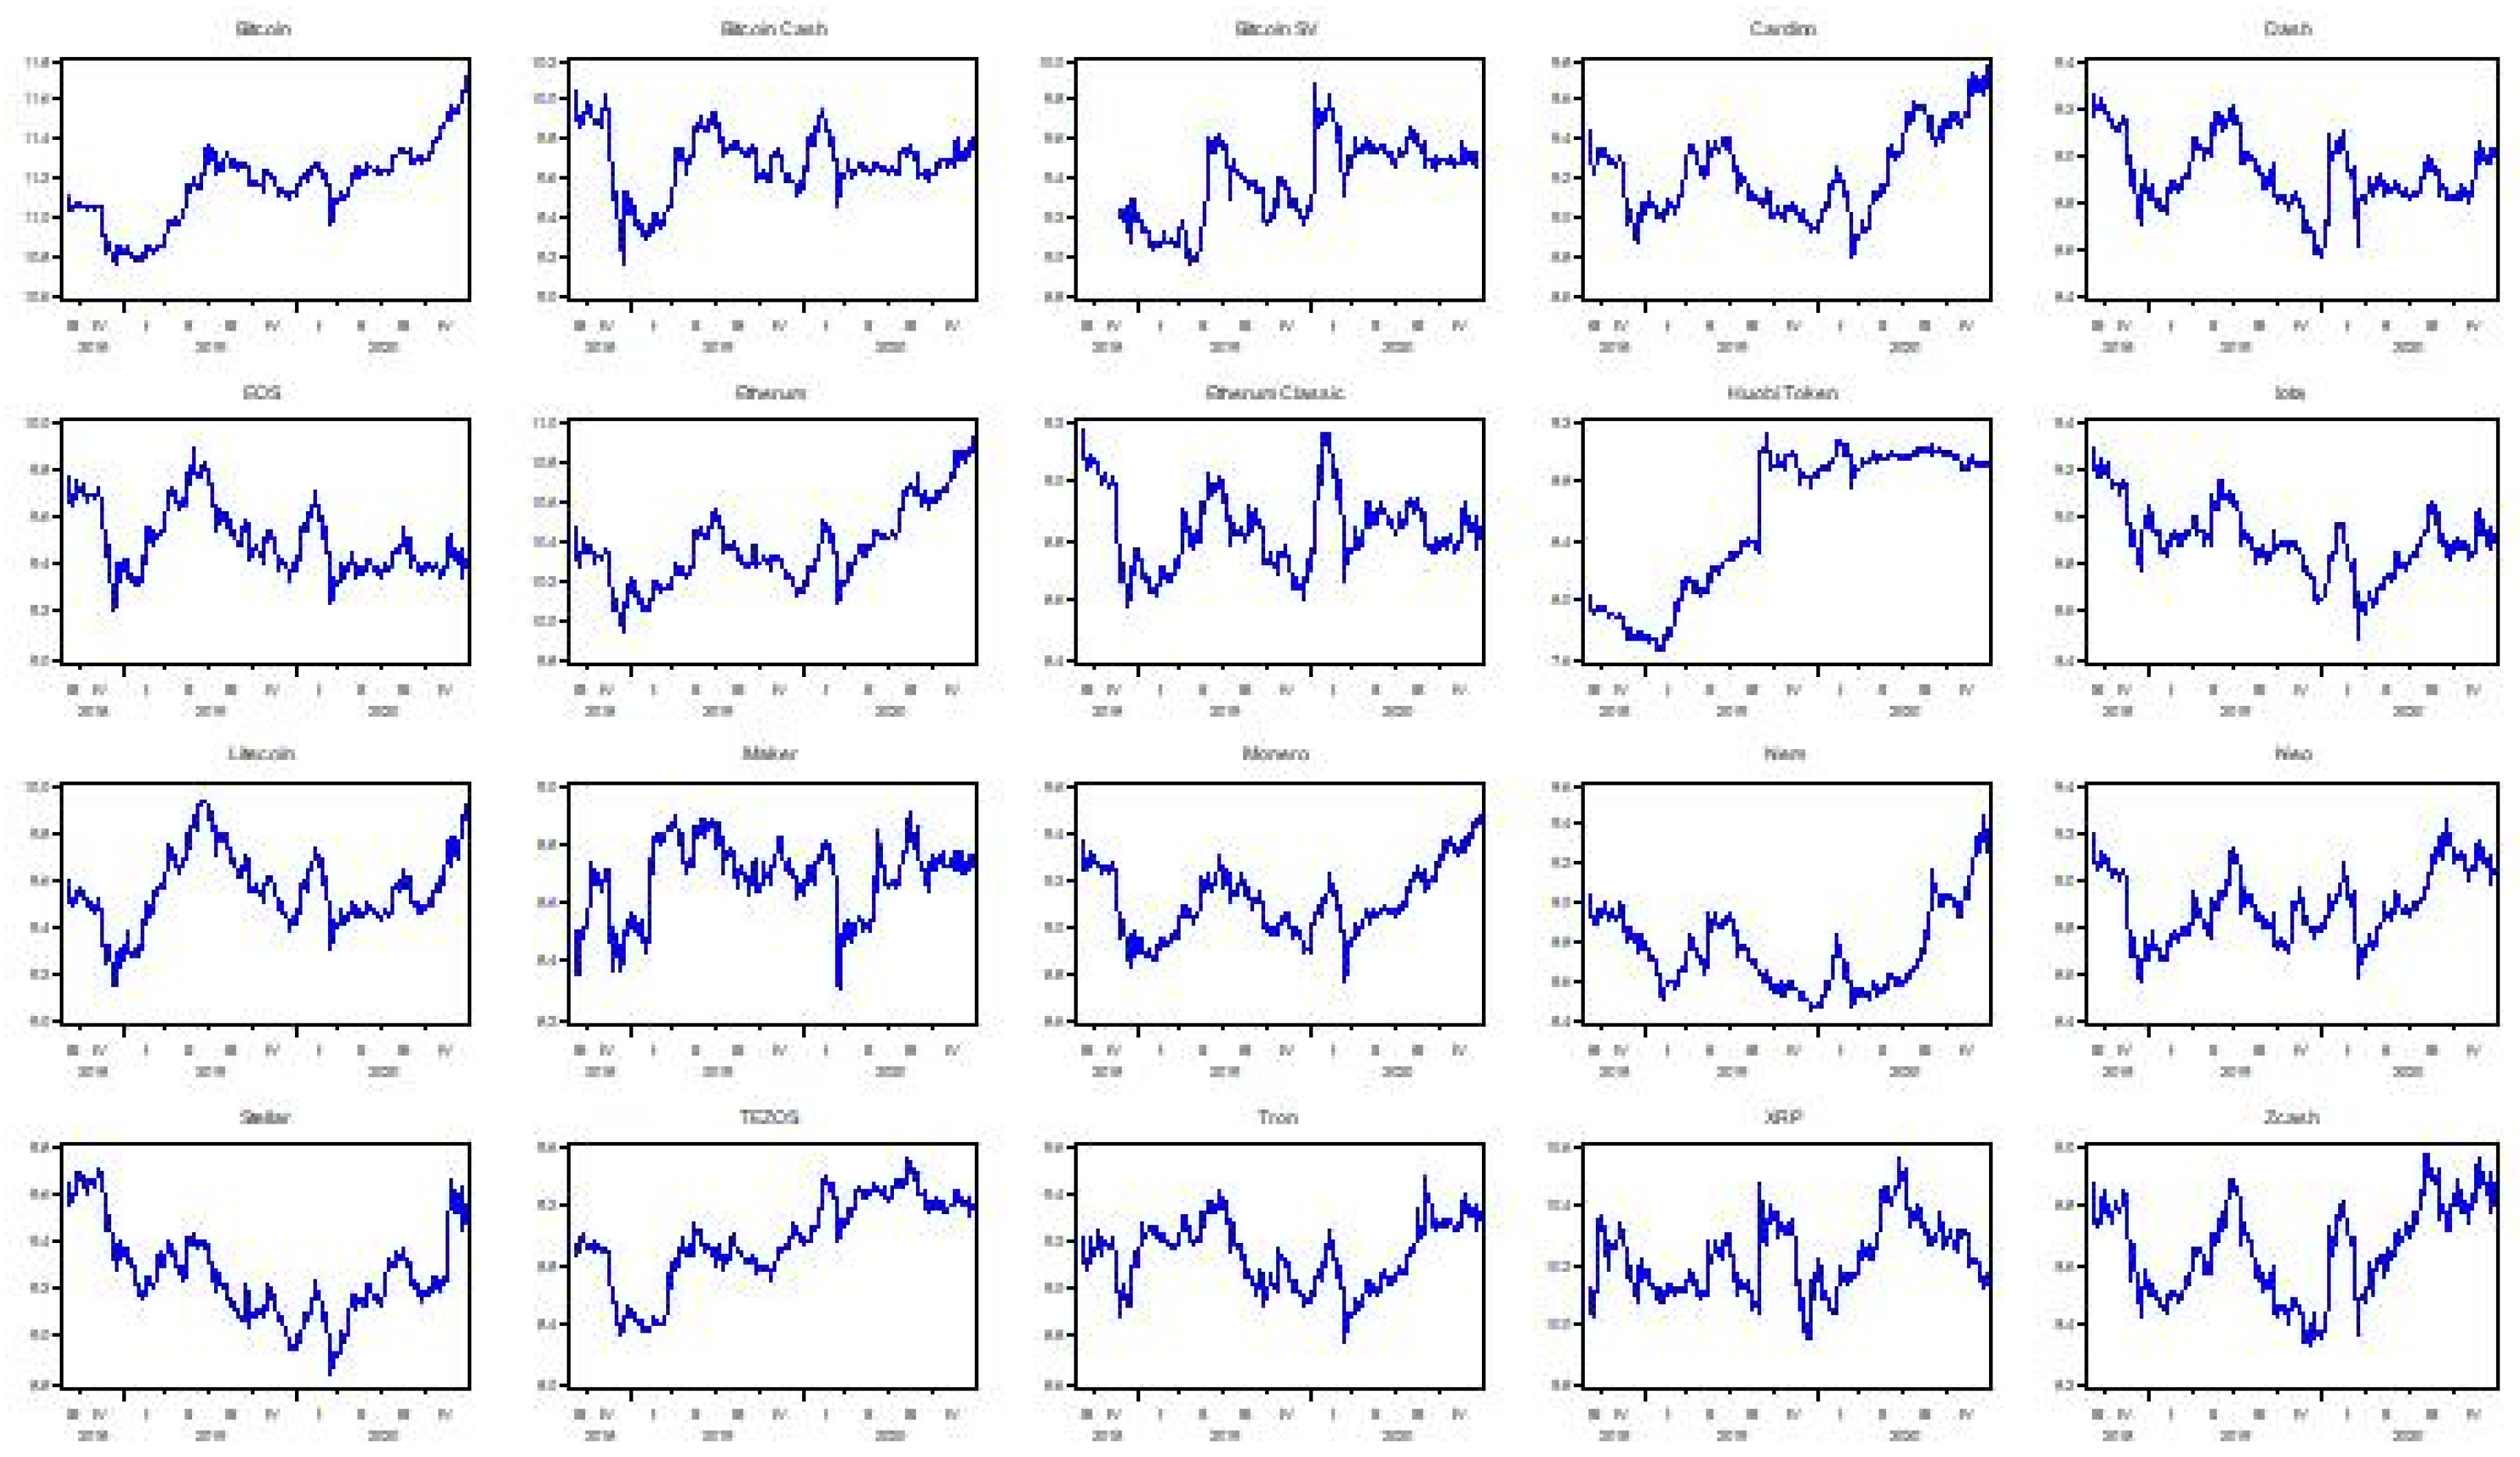
Figure 3- show the different trend of capitalization within the studied period. Bitcoin is the largest cryptocurrencies among all the currencies in all over the world, despite the inauguration of the COVID 19 pandemic, the Bitcoin keep their rank in terms of capitalisation with a rise and more pronounced trend during the onset of the COVID 19. Etherum is the second largest crypto and it maintain an increase trajectory in terms of their capitalization during the COVID 19 comparing to the other periods. Comparing the Bitcoin and the Etherum to the other cryptocurrencies such as XRP and Dash, there is a high level of volatility within the small size of cryptocurrencies. Bitcoin performed their hedge funding role from the early stage of the COVID 19 spread, there is standing rise in terms of value comparing to the other assets and cryptocurrencies.(Dyhrberg, 2016) consider Bitcoin a hedge against the bearish market scenario. The Bitcoin association with different cryptocurrencies is not symmetric in term of the difference in the correlation exhibited by the intra-market characteristics ((Aste, 2019);(Czapliński and Nazmutdinova, 2019)), which it might explain reasonably the asymmetric and non-linear association with the COVID 19 period. This is also confirmed within the correlation matrix, later explained and referred, between all cryptocurrencies within the pandemic and before the pandemic time.
Figure 4 present the time series of each cryptocurrencies, which show that the trends of some cryptocurrencies are similar Figure 4 plot the daily closing price for a wide range of cryptocurrencies selected for this study during the three phases of the health crisis which is the prior crisis, the peak and the post crisis, from September 2018 to December 2020. All crypto have experienced a high volatility with the beginning of the crisis, proving that the COVID 19 was a pulse for the dynamic variation of the trend within that period. The capitalization of cryptocurrencies maintain a trend differently prior the COVID 19, however, within receiving the same choc they maintain the same trend reaction to the recurring measures of the pandemic such as the lockdown. There is a highest rise of capitalization for all the type of crypto for different markets. Figure 4, the prices of the Bitcoin fall 19% from January to 23 March, the severe decline was 36% in 13 March. This decline is followed by other hedge funding such as the stocks (S&P, S&P 500, FTSE100, and Nikkei 225 have declined respectively by 33%, 9.51%, 10.87% , and 4.41% between March and February), the crude oil (-37.63$ per Barrel on April) and the gold by 3.35%, but it is the only hedge fund which can be considered as less influenced by the crisis in terms of drop percentage comparing to the other hedge funds.
Our data analysis is focused on the case of the crypto currencies without taking into the original country launching, it is a cross section data analysis based on daily data for different wide range of cryptocurrencies (4 cryptocurrencies) such as Bitcoin, Litecoin, Etherum and XRP; and different wide range of stock assets(4 stocks) such as SP, FTSE, DGJI, and MSCI, the sample period is for the whole year of the pandemic 2020.
We collect high frequency market data for the purpose of this analysis for cryptocurrencies from Coinmarket.com, and for stock assets from the Datastream dataset, and COVID 19 health crisis indicators such as the number of death and the number of cases is from WHO dataset and authors calculations. The selection of data for cryptocurrencies is based on different measures first the price and the level of capitalization. We are studying the dataset within three large categories of crypto, the first category is for the closing price under 10, the second is between 10 and 50, and the third is more 50. For all categories. Basic on that classification we select four cryptocurrencies.
Table 1 report the descriptive statistics for all the data used in that study, the price return for the cryptocurrencies as well as the stocks is calculated basic on the closing price minus the opening price. Related to the COVID19 indicators, it is calculated basic on the growth rate of each indicator during the PreCOVID19 period and Post COVID19 Period. The Average and the mean returns are both negative within the Pre-COVID19 period for the sampled cryptocurrencies, however it is positive for Bitcoin, Etherum and Litecoin during the Post-COVID19 period which confirm that these cryptocurrencies are affected positively during the pandemic. In contrast, the mean and the Average of the XRP during the pandemic is negative. In contrast for the stocks , are positive in both periods with amelioration during the pandemic time; this is confirm that the return of stocks is ameliorated during the pandemic due to the high demand and the reorientation of the investment to the capital market instead of real sphere. The volatility of the stock market and the cryptocurrencies is accentuated during the pandemic comparing to the Pre-COVID19 period. This is confirm that the price return is affected randomly by the pandemic within the daily volatility of the demand and supply. For both periods, the cryptocurrencies and the stocks are skewed to the left in the most case except for the case of the Litecoin and the XRP. For both sub-period, Pre-COVID 19 and Post-COVID 19, there is autocorrelation and ARCH effect in price return for all cryptocurrencies and stocks. The ADF test confirm that for both period that the dataset of return for cryptocurrencies and stocks are stationary. The Kurtosis is significantly higher than 3 in the Post-COVID19 period for both cryptocurrencies and stocks, in contrast Pre-COVID 19 was considered by a Kurtosis no less than 3 for all assets. Within the Jarque-Bera test statistics, for both periods it is rejected the hypothesis of normality.
Table 2 demonstrates the correlation matrix for both periods for cryptocurrencies and stocks as well as the COVID19 indicators. There is a general impact for the pandemic within the studied dataset, proving a significant amelioration and positive correlation between cryptocurrencies and stocks from the Pre-COVID19 period to the Post-COVID19 period. In contrast, there is a negative and significant correlation between the COVID19 indicators and all cryptocurrencies and stocks. This correlation matrix identify the interconnectedness of the financial market within that frame and the financialization of the economy and the more openness for the financial market within that time rather that the real economy.
4. Relationships Between Variables and Research Methodology
Within this paper we aim to study the safe haven properties of the cryptocurrencies within the COVID 19 crisis starting from 01/01/2020through 31/12/2020, and studying the volatility of the daily return as well as the return performance at day t. We analyse the relationship between a broad ranges of cryptocurrencies for around 20 crypto using the GARCH model.
4.1. Research Methodology
VAR-DCC- GARCH Estimator
The GARCH estimator is commune use in the literature to study the volatility(Bollerslev, 1986), Introduced the ARCH model by (Engle, 1982). The empirical application for ARCH model is often avoid problems with negative variance parameter estimates a fixed lag structure is typically imposed (Engle, 1982), in that matter an extension to ARCH model class occurred to provide a longer memory and more flexible lag structure.
Econometric estimation Methodology
The GARCH estimator is commune use in the literature to study the volatility(Bollerslev, 1986), Introduced the ARCH model by Engel (1982). The empirical application for ARCH model is often avoid problems with negative variance parameter estimates a fixed lag structure is typically imposed(Engel 1982) , in that matter an extension to ARCH model class occurred to provide to provide a longer memory and more flexible lag structure. The GARCH Process is introduced by (Bollerslev, 1986). Within the literature which processed this model in asset prices an energy sector. Studying the volatility in the stock market or the energy sector can be studying in constant or real value process changing over time via the standard deviation of prices, or in time varying (non-constant) via the GARCH-type models (Bollerslev, 1986; Engle, 2002).
There are many varieties on GARCH for studying the volatility that varies both in time and across other assets, as well as the volatility of the number of death and COVID 19 cases. We employ the VAR-DCC-GARCH setting to model the volatility of the return for wide range of cryptocurrencies. The VAR setting allow us to determine how the stock prices and the cryptocurrencies evolve together for the two periods of Pre-COVID 19 and PostCOVID19. And the DCC-GARCH model conclude how the dynamic volatility of these prices is related. Before detailing the DCC-GARCH we present the VAR model for crypto and stocks within the Indicators of the COVID 19 pandemic.
VAR MODEL
The measurement of return spillovers is based on vector auto-regression VAR modes by focusing on the impact of prices in terms of intensity and duration between the cryptocurrencies and the stocks market before and during the COVID 19 outbreak by including the volatility of the number of death and the COVID 19 cases. The VAR model used in this study is described as follow:
P is the number of cryptocurrencies, k is the number of stocks, q is the number of variables describing the health crisis COVID 19, T is the time-period of the study.
is the price of the cryptocurrencies in the period t,
is the price of the stocks in the period t,
is the COVID 19 indicator such as the number of cases during the pandemic period.
is
parameter matrix of lagged variables,
As an efficient causal analysis method, impulse response function can be used to analyse the relationship between variables. Residual in VAR model reflects the impact from external system on system variables, the coefficient matrix in the moving average form, is also impulse response coefficient matrix as follow:
Where and are coefficient matrixes, reflects the impact of on during the period of t-n. Therefore, the accumulative response of to is written as follow
VAR-DCC-Model
The DCC GARCH is introduced to solve this problem. The number
f parameters to be estimated in the model increases linearly and not exponentially, which make this model deal the dimension and duration. The model decomposes the matrix
where
is triangular matrix representing the conditional variance –covariance matrix.
The model composes the matrix
as follows:
,
,
is the residual vector composed by the residues of all the markets,
is the market information available at time t-1,
is the dynamic condition covariance matrix,
represent the diagonal matrix of time varying standard deviation of multivariate GARCH model with all three categories of volatiles variables returns, with
on
ith diagonal.
R has to definite positive and all the parameters should be equal to or less than one. In order to fulfil this condition,
has been modelled as follow:
is a symmetric positive define matrix.
is assumed to vary according to a GARCH process:
and
are scalar parameters to capture the effects of the previous shocks and previous dynamic conditional correlation on current dynamic conditional correlation, are non negative and satisfy
.
is the unconditional variance between series k, p and q and follows a GARCH process,
is the unconditional covariance between the series estimated in step 1. The parameters
and
are estimated by maximising the log-likelihood function. The log likelihood function is expressed as follow:
The modified model of (Cappiello et al., 2006) for incorporating the asymmetrical effect Allow the studied model VAR-DCC-GARCH to be written as follow :
4.2. Relationship betweenVariables : Wavelet Analysis
Within the second frame of this study, we use the wavelet approach to capture the co-movement of the two time series of cryptocurrencies and COVID 19 indicators in time and frequencies which allow for variety of scaled localizations (Rua and Nunes, 2009). We employ the Wavelet Coherence and the Wavelet Power Spectrum to measure the co-movement of the COVID 19 indicators and the pulse reaction of the cryptocurrencies. The Wavelet coherence shed the light on co-movement between cryptocurrencies and stocks as well as COVID19 indicators, in comparison to the conventional casualty and correlation analysis. The main frame for wavelet coherence using the cross wavelet transform and cross wavelet is developed by Torrence and Compo(1998). The approach of Torrence and Campo (1998) is described as follow. The cross wavelet transform of two time-series
and
using their own cross wavelet transform with continuous wavelet transform
and
as follow:
is marking the location and
is the scale. The
denotes the complex conjugate. The cross wavelet transform capture the local covariance between the two time series
and
at each scale. The wavelet coherence detect co-movement between time-series in the time-frequency domain, Torrence and Webster(1999) can be defined as follow:
is a smoothing operator over time as well as scale and
(Rua and Nunes, 2009). The Wavelet squared coherence,
, is between 0 and 1. The high value show a high co-movement between the two time series. Within the standard correlation of two time series, the wavelet squared coherence is restricted to positive values. Within that explaining, the wavelet squared coherence cannot identify between positive or negative co-movement, as well as between positive and negative correlation. The phase difference wavelet approach (Terrence and Compo, 1998) capture the two possible co-movement. Thus, this approach give causal relationships between the tow time series. The wavelet coherence phase difference of time series is defined as:
and are the imaginary part and the real part of the smoothed cross wavelet transform. Phase is indicated by black arrows on the wavelet coherence plots. A zero phase – difference means that the time series move together. The arrows point to the left (right) when time series are in phase (out of phase) or are positively (negatively) correlated. An upward pointing arrow means the first time series is leading the second by , where as an arrow pointing down indicates that the second time series leads the first by . A combination of position is general common.
5. Results
5.1. VAR-DCC-GARCH analysis
The estimated results of the VAR-DCC –GARCH model is displayed in the
Table 3 based on the specification of the model in the previous description. According to our sample studied, Bitcoin is the safe haven investment for the MSCI, FTSE, SP and DJGI investors. Within that, we will analyse each crypto comparing to the stock market and the COVID 19 indicators. Studying the correlation between the Bitcoin and the world assets MSCI, FTSE, SP and DJGI, Bitcoin is a safe haven investment for SP World Hedged comparing to the other stocks.
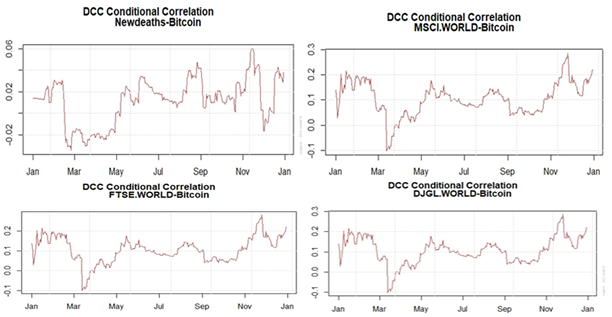
Figure 5 plots the dynamic conditional correlations obtained from the VAR-DCC-GARCH model. We observe a time varying correlation over the sample period for SP, in the
Appendix C shows the rest of the DCC plots for the whole investment stocks. We evaluate a peak down in March within the excessive contagion spread start of COVID 19 following by a fluctuation for the rise between April and December. The increase level of the DCC during the time January to March is due to the fiscal policies conducted by the international organisations and government supporting the stimulus packages as well as the interest free debt and many other regulatory measures helping to beneficiate from the diversification of the portfolio for investors, however the correlation it is negative, and this can be explained as a low return during that time for the Bitcoin and the rest of the stocks. An increase of the DCC for the rest of the period from April to December with a positive values in the majority of the fluctuations approve that the economic was updated to the new measures and stimulus packages given as targeted policies reorientation of the economic system within a new frame for the future perspective for investment. The Main trend for the DCC between Bitcoin and SP, and Bitcoin and COVID 19 New cases is opposite in the start of the pandemic and continuing similarly from April to the end of the period. The decrease level of the Bitcoin and the COVID cases and even a negative correlation between the New COVID 19 cases and Bitcoin, approve and that start of the pandemic is totally disconnected from economic sphere for their evolution, and spread and the rise of the cases was for the non-preparedness in advance for that extra-economic shock. From April to December we view a significant positive correlation between the COVID and the Bitcoin with a rise trend. This reflect that this period was with high risk aversion, and the Bitcoin was considered as a safe haven investment within a health crisis framework.
Figure 5.
Dynamic Conditional Correlation between Bitcoin and SP World Hedged, and Bitcoin and COVID19 New Cases. Source: Own study.
Figure 5.
Dynamic Conditional Correlation between Bitcoin and SP World Hedged, and Bitcoin and COVID19 New Cases. Source: Own study.
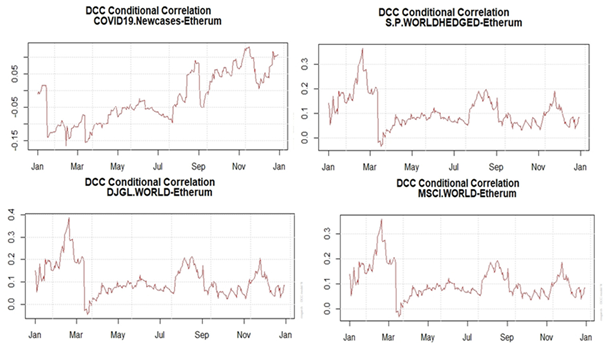
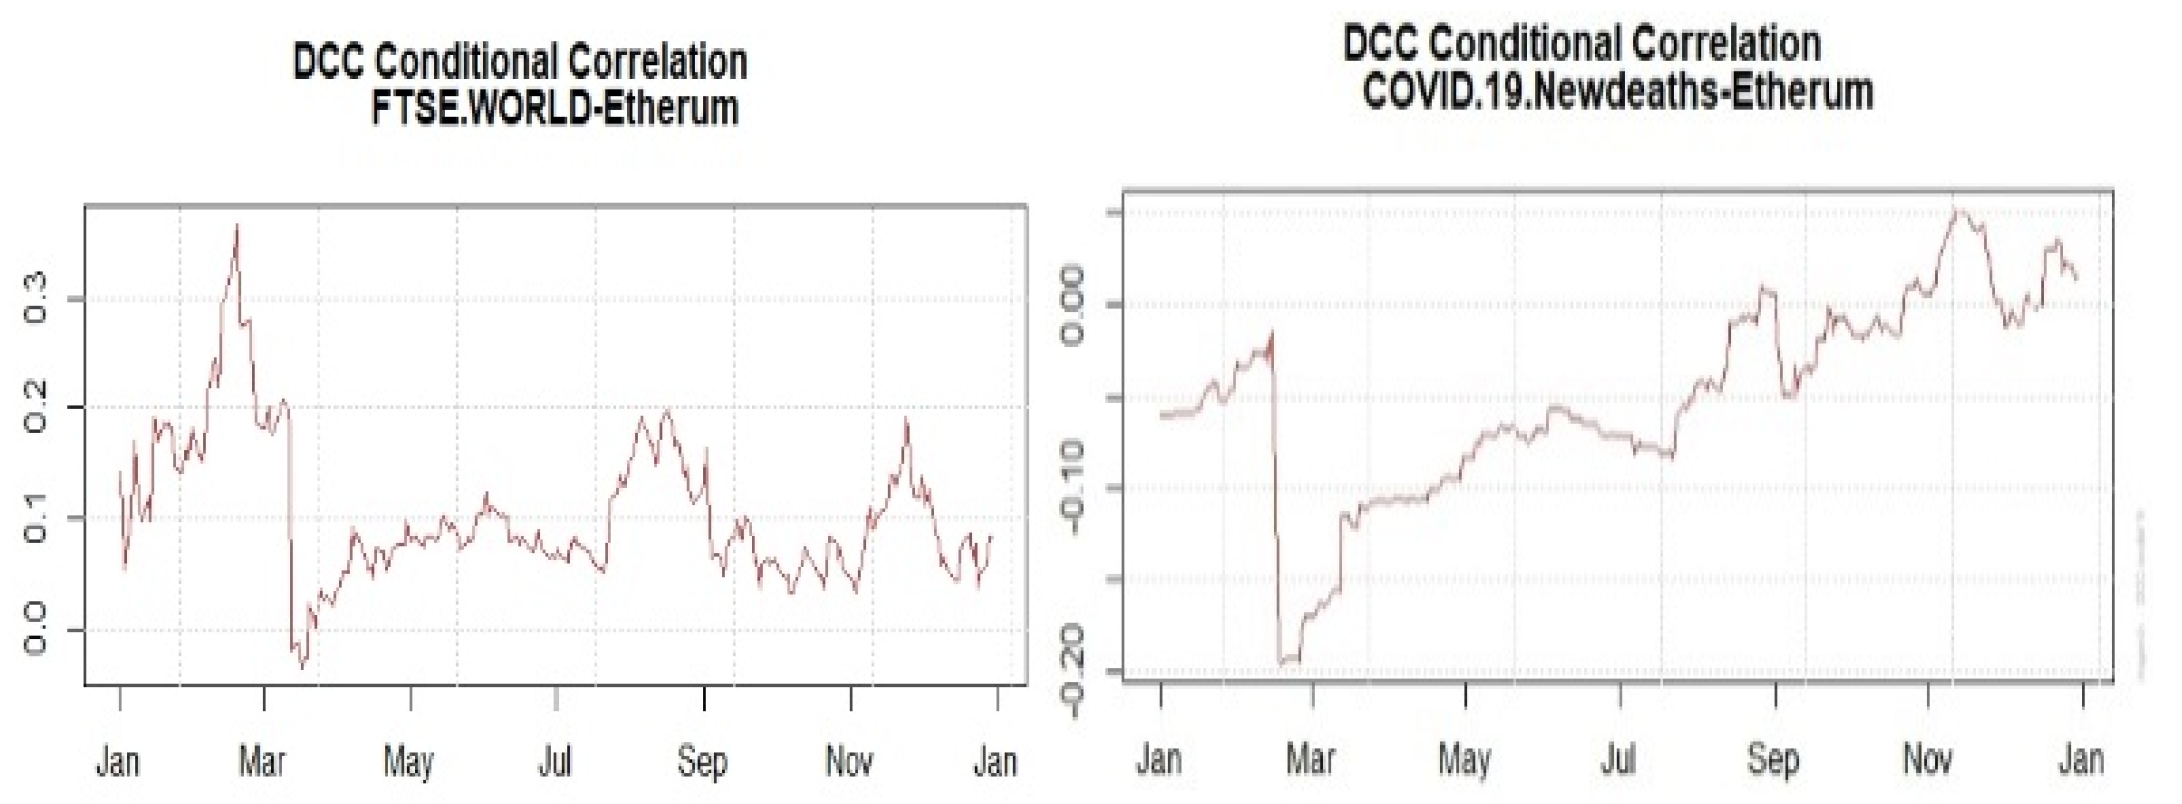
Studying the case of the Etherum comparing to the other stock assets,
Figure 6, we find that Etherum is safe investment for the FTSE comparing to the other investors. Etherum is the second largest cryptocurrencies after the Bitcoin, comparing the trajectory of the DCC for the Etherum and Bitcoin in terms of investment and COVID 19, we saw a similar trend in the majority of investment cases, as well as related to COVID 19 indicators. The similar trend, is explaining by the capitalization of the Etherum which is quite similar as bitcoin and the size of demand for that crypto as it is the second largest cryptocurrencies after Bitcoin.
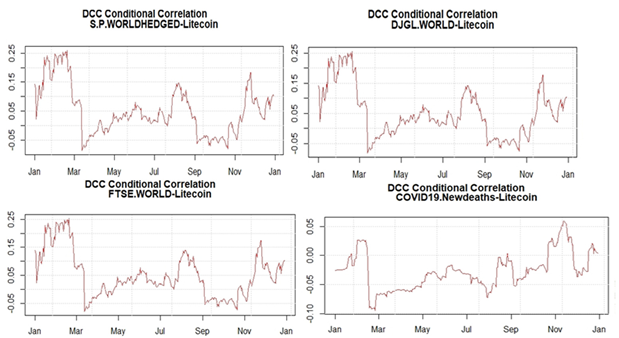
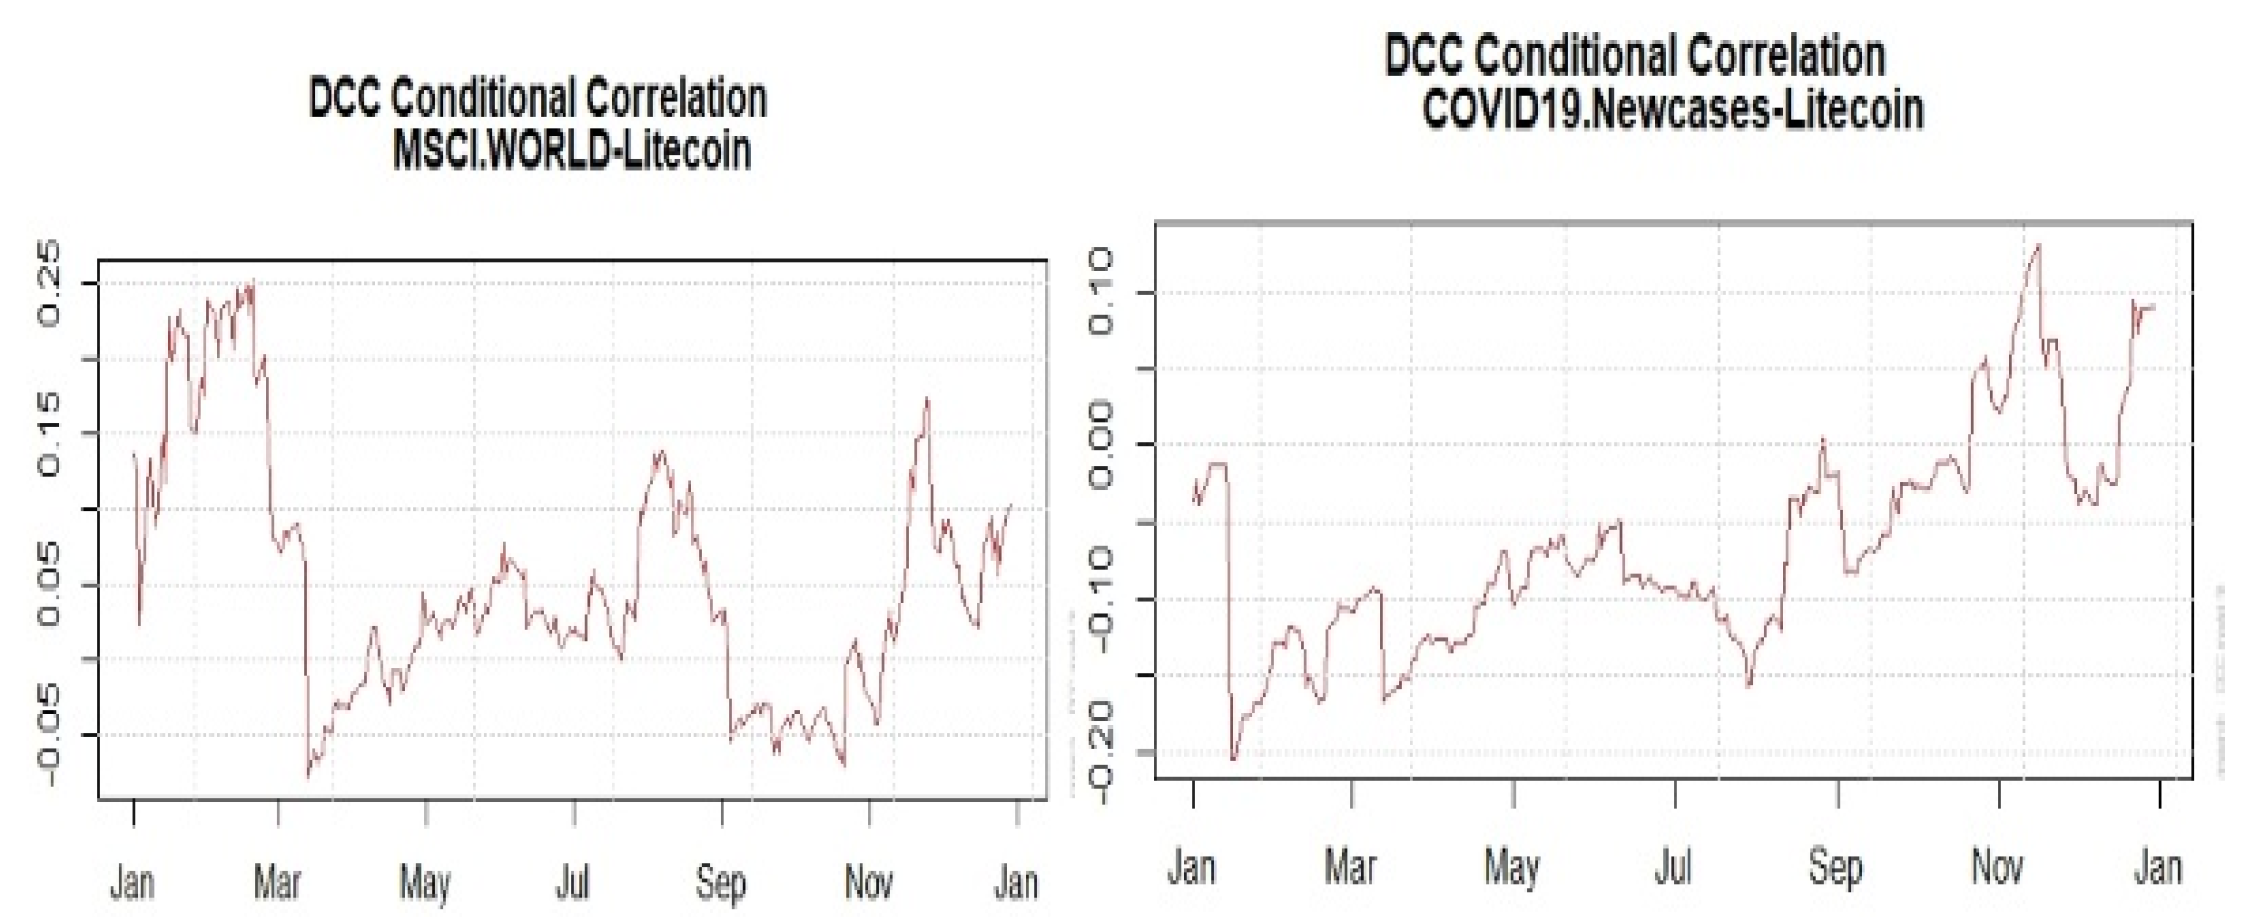
The Litecoin is a middle size cryptocurrencies comparing to the Etherum, the trend of the DCC differt basic on their size and their capitalization. According to
Figure 7, the trajectory of the DCC Litecoin is the opposite comparing to the Bitcoin and the Etherum. The litecoin is a safe haven investment for MSCI investors comparing to the other investors. There is a signifcant negative correlation between the Litecoin and the majority of stocks investment. The first period of the pandemic is followed by an increase for the the DCC until March and after it is followed by an important decrease which is the phase of the accentuation of the health crisis followed by lockdown and many other restriction measures within investment such the depreciation of the currencies. The correlation between the Litecoin and MSCI is in the rise after March followed by high volatility until december 2020. This volatility is explained by the openness of the investors to the new tools of paymenet as safe haven within an environment with high risk compatible for the risk takers and the risk averse investors. The correlation between the COVID19 new cases and the Litecoin is positive and with an increase trend. From January the trend is characterised by a decrease followed by a fluctuations for a rise of the correlation between the number of cases and the Litecoin.
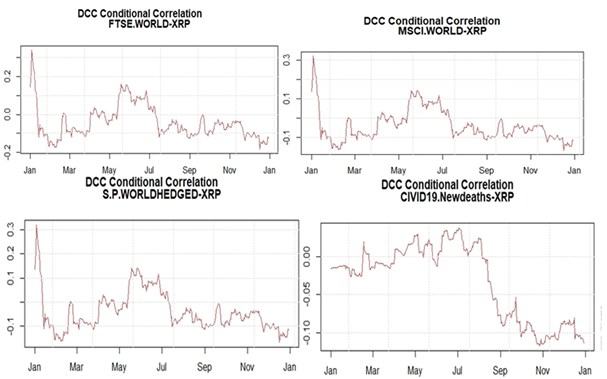
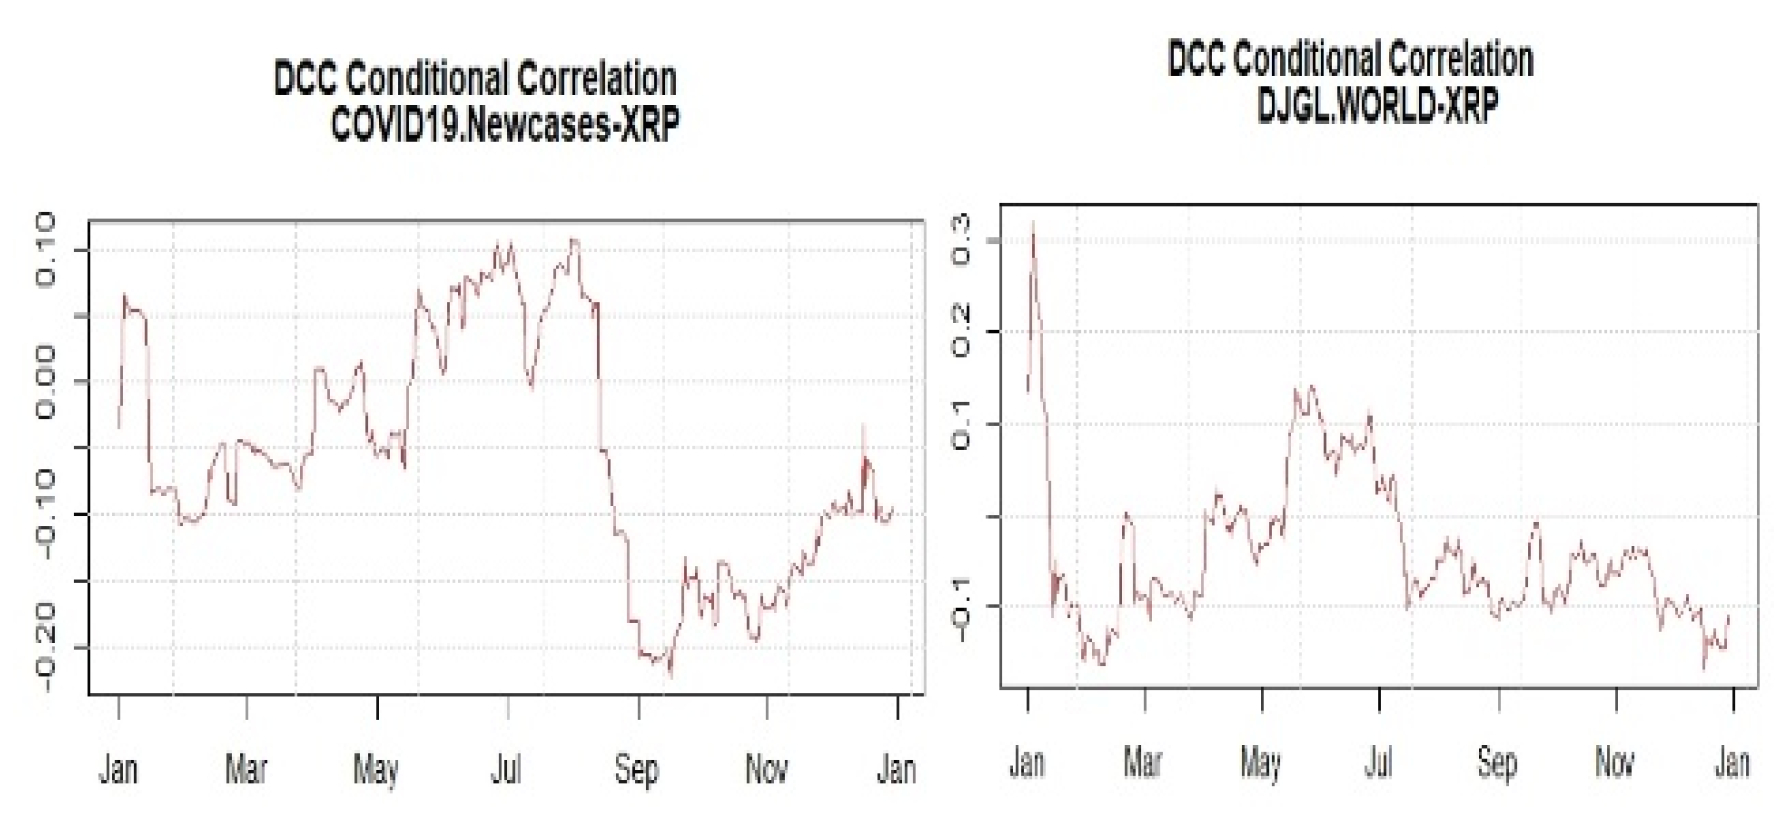
The XRP cryptocurrencies is a small size crypto comparing to the other studied cryptocurrencies. The XRP is lowest safe haven investment for DJGI investors. However within the trend of the DCC it is quite clear that the COVID 19 pandemic affect negatively the correlation between the XRP and the DJGI investment.
Figure 8, given that trajectory is explained that the diversification of the portfolio is followed by the risk management and the attitude of the investor towards the risk within the frame of the pandemic. The investors are highly risk averse towards using the XRP as tool of payment within that period due the less capitalized power of that crypto and the decrease of return which is followed by big volatility for decrease.
Basic on the VAR DCC GARCH results, the studied commodities such as Bitcoin, Etherum, Litecoin and XRP are safe haven investment for the stock market within the analyzed period and in the framework of COVID19 health crisis. Within the pandemic, the economic system was targeted to be more financialized rather than relying on the real investment, by promoting the use of the digital money in the stock market and enhancing the capitalization of the economy within a new frame base on the digitalization of the payment system within an economy facing a peak of uncertainty and overcoming the health crisis within many economic measures such as the stimulus packages, the fiscal policies reconstruction, the labour structure, and the production system.
5.2. Wavelet Transformation
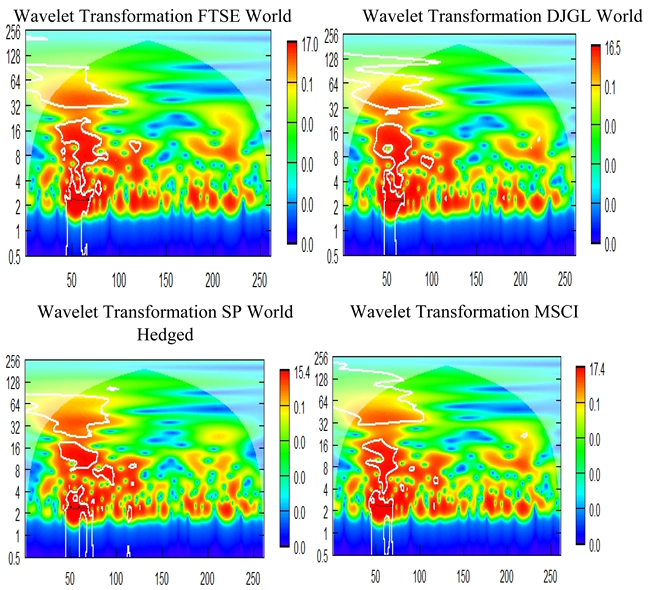
The wavelet power spectrum is the absolute value of the square of the wavelet transformation. Which measure the correlation at each scale or frequency and at each time. The horizontal axis refer to index and the vertical axis refer to frequency component from scale 1(1 day) to scale 256. It is similar to the estimation from Monte Carlo simulations using phase randomized surrogate series, the white contour indicate 5% significance. The cone of influence, shown by a solid curved line indicate the one affected by edge effects. The range of power is from red (high power) to blue (low power). As shown in
Appendix B-2, all stocks such as SP, DGJL, MSCI and FTSE are showing a high power during all the period of COVID 19 in the short and medium run during the first half of 2020. The selected stocks assets are among the top highest yield in the stocks market, which allow us to give a general assessment about the capital market during the COVID 19. Basic on the Wavelet transformation, it imply that there is a high variation during the period of COVID19. For the next half of 2020, the time and frequency of variation for stocks are very low. In general, the selected stocks show similar reaction to the COVID 19 shock.
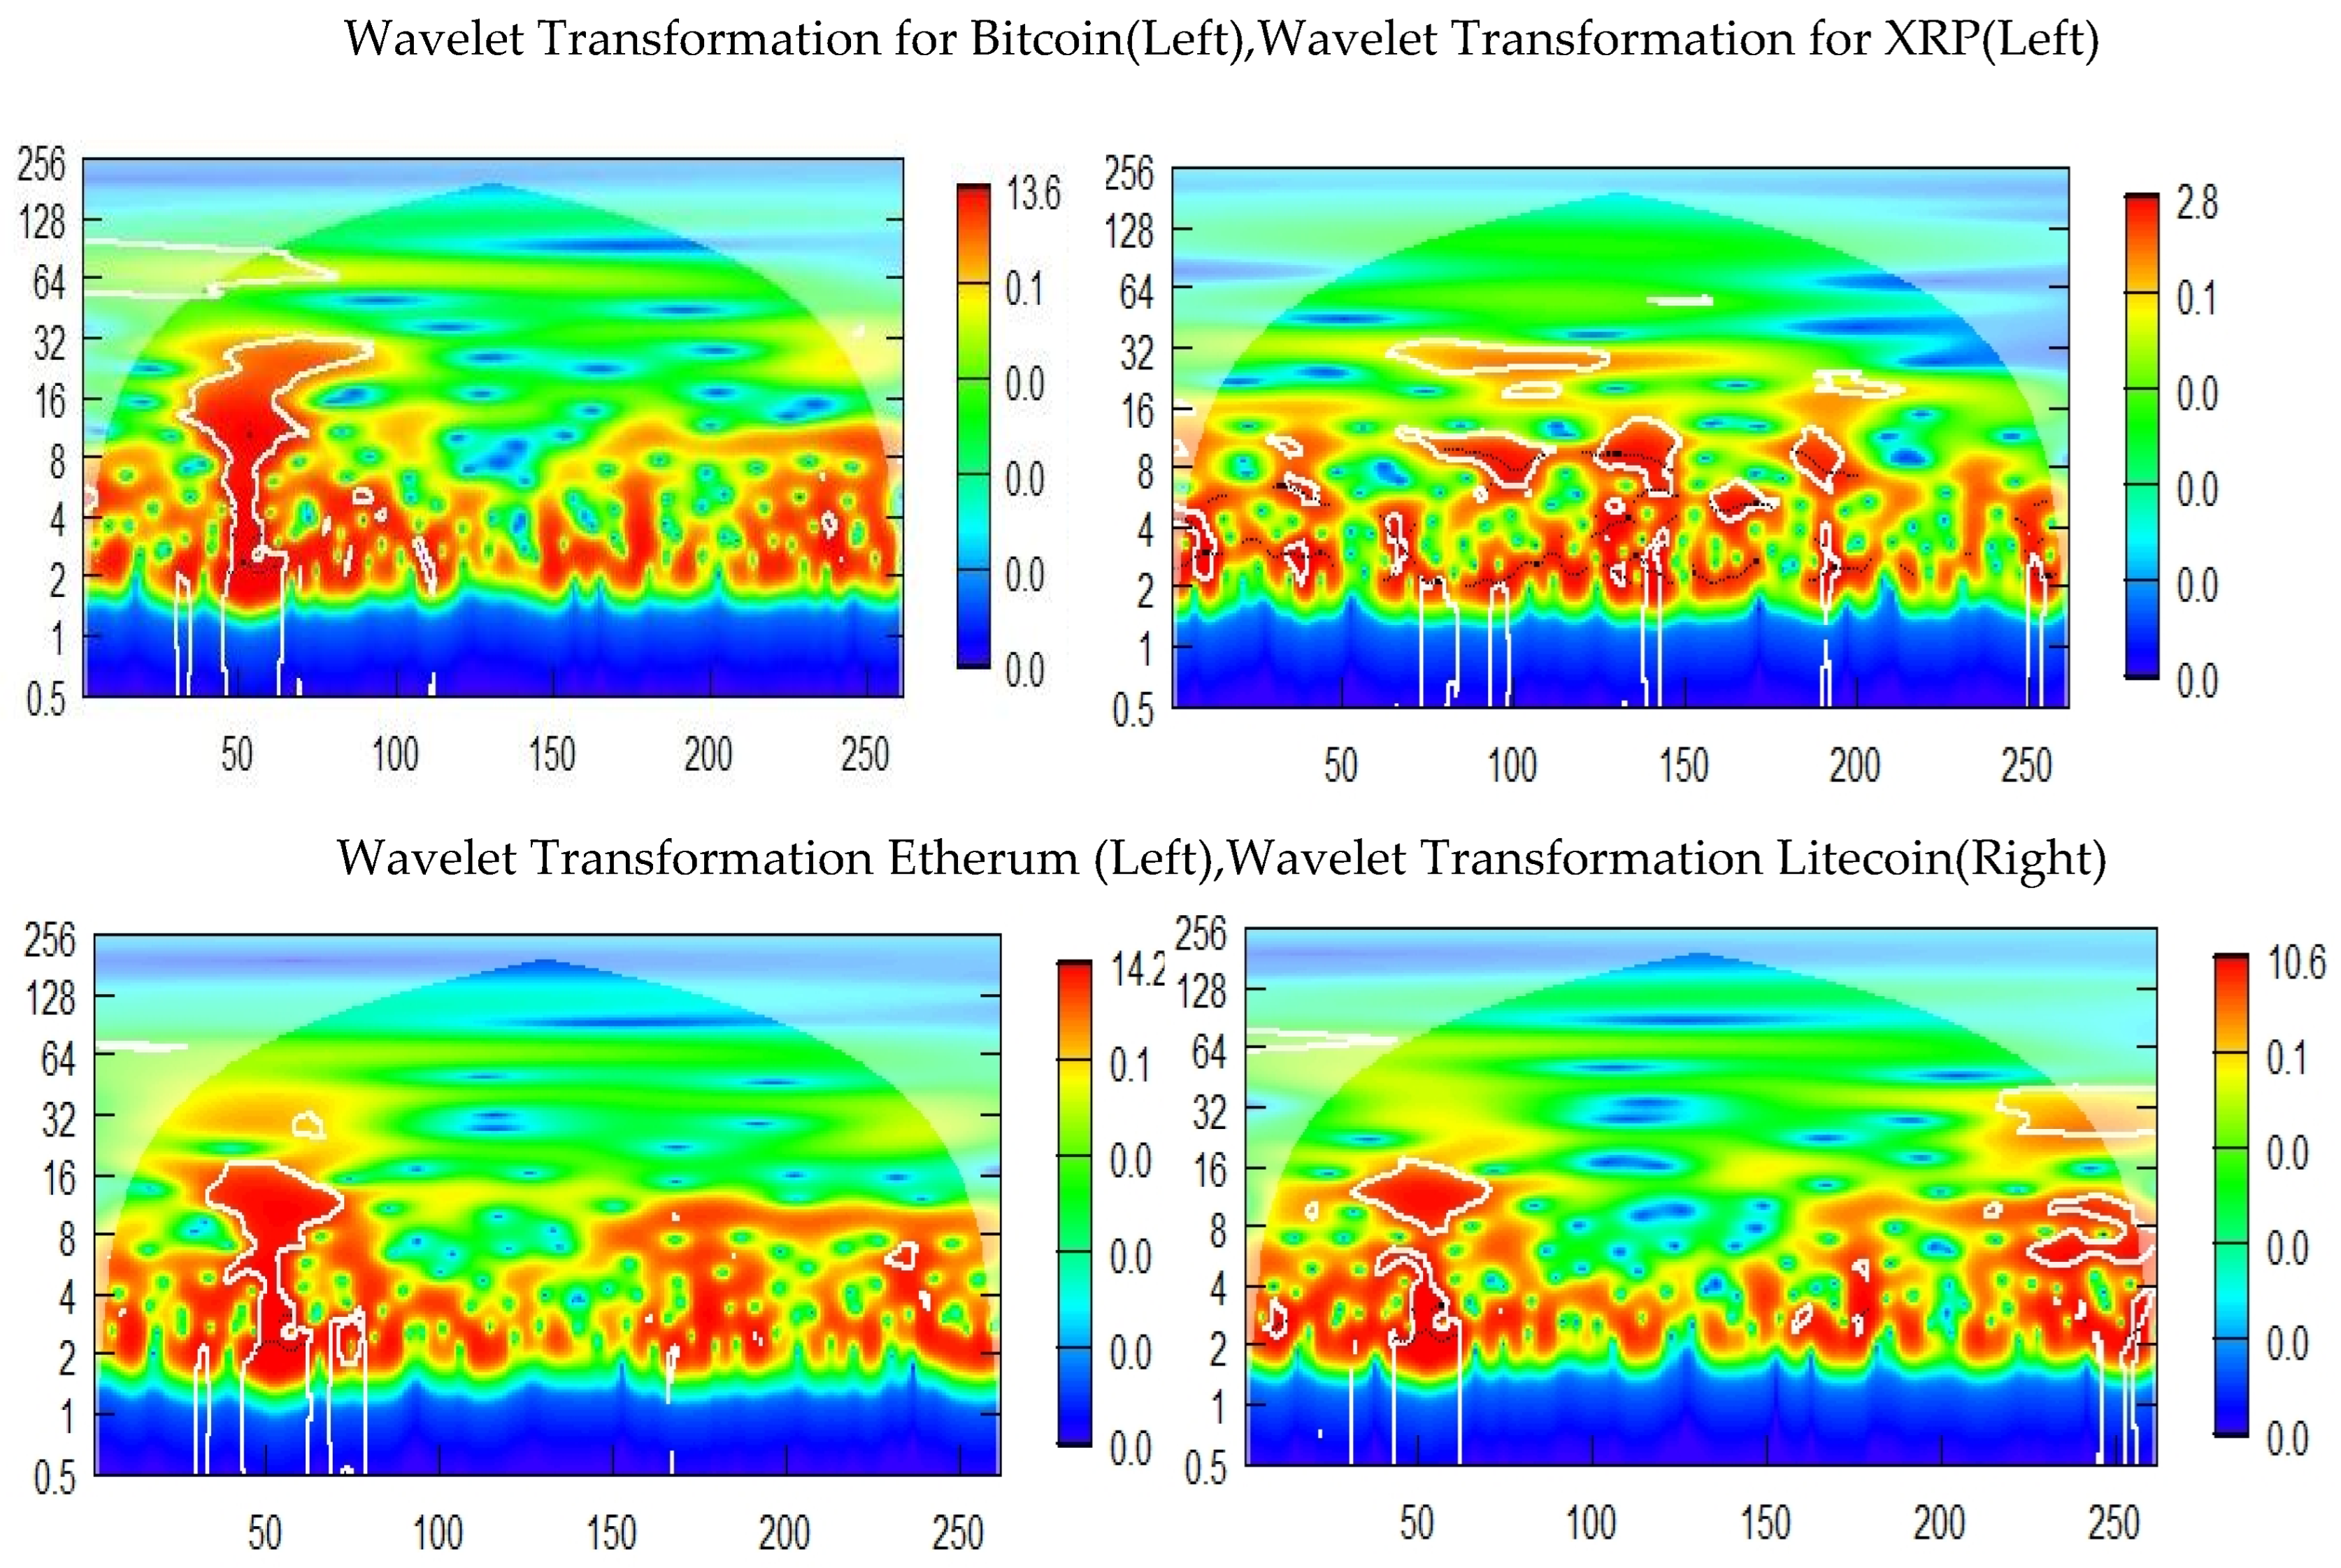
Figure 9 show the Wavelet transformation for all the sampled cryptocurrencies such as Bitcoin, Etherum, Litecoin, and XRP. Bitcoin and Etherum show the most important power during whole period with a pronounced effect during the third month of the year. Litecoin show less pronounced effect in the third month of the period with low scale. However, the XRP is the lowest power with similar low scale during the whole period. Basic on the WT, we can conclude that the size-capitalization of the cryptocurrencies is a catalyst for the variability towards the pandemic crisis.
The interpretation of the
Figure 10 for wavelet transformation for COVID19 indicators show a different trend of variability in terms of frequency and scale comparing to the stocks and the cryptocurrencies. The COVID19 New cases show a variability with a scale very high in the first three months followed by a stable low scale of frequency for the rest of the period. The new cases show less variability at the beginning of the pandemic comparing to the variability of the new deaths as it is explained by a virus which is not yet discovered the treatment a diverse prescription is proposed by the international organisations.
The stable trend for both indicators for the next nine months is explained by the measures giving by the international organisations and local authorities in the pandemic such as lockdown, face mask, etc; as well as the fiscal policies proposed by the international financial organisations. Within the Wavelet Transformation approch we can understand that all commodities are safe haven investment for the stock market within the analyzed value and return in the studied period of the COVID19 frame crisis.
5.3. Wavelet Coherency
The following part presents the WC graphs for the studied cryptocurrencies stock markets as well as the COVID19 indicators. The maps are classified per crypto and dependencies with the other stocks and COVID19 indicators. The Bivariate wavelet coherence analysis give insights on how the cryptocurrencies and the stocks have evolved over time and across frequencies during the COVID19 period. The wavelet coherence detect short and long run time series co-movements and also assess their changing behaviour over time.
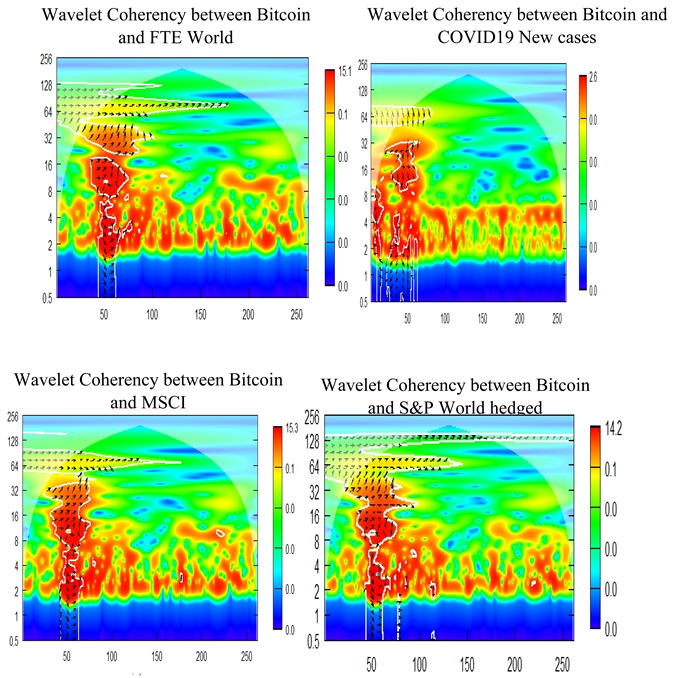
On each part of cryptocurrencies there is two maps one for stocks and the other for COVID indicator followed by the rest of the maps at the appendix. The figures represent the time scales for 1 to 256 days. For the analysis of the Wavelet coherence we rely on the colors as well as the arrows on the significance of 5% range. The colour pallet represents the strength of wavelet coherence, the hotter the colour the higher the coherence and thus the dependence between series. The coherency ranges from red (high coherency) to blue (low coherency) to measure the degree of co-movement in scale frequency. The red colored area at the bottom and the top of the wavelet coherence plot exhibits powerful coherent co-movement at low and high frequencies. The colored blue at the bottom and the top of the wavelet coherence plot exhibits weak coherent co-movement at low and high frequencies. As a general overview for the Wavelet coherency of all cryptocurrencies with stocks as well as COVID19 indicators is significant high degree co-movement for the first three months of the period across 64 to 256 days frequency band. As well as we find a more higher coherence for the rest of the period with significance at more than 128 days frequency band but with different range of time starting from six months until the rest of the period. The directional arrows give insights the lead-lag relationship as well as the sign of the dependence. If the arrow points downward, the second lead the other. And respectively if the arrow points upwards, the first series leads the other. If the arrow points to the right the two series are positively correlated. And if the arrow points to the left the two series are negatively correlated. The Arrows indicate the phase difference between the Bitcoin and the growth rate of the COVID19 New Death. For example,

and

indicate that both Bitcoin and the growth rate of COVID19 New death rate are in phase and out of phase, respectively.

And

indicate Bitcoin returns are leading those of the growth rate of the COVID19 new death rate, while

and

indicate Bitcoin returns are lagging those the growth rate of the COVID19 new death rate.
The result are stable across the potential safe haven investment between cryptocurrencies and stocks with a little diversion towards the perception of COVID19 health crisis in terms of New death and New cases.
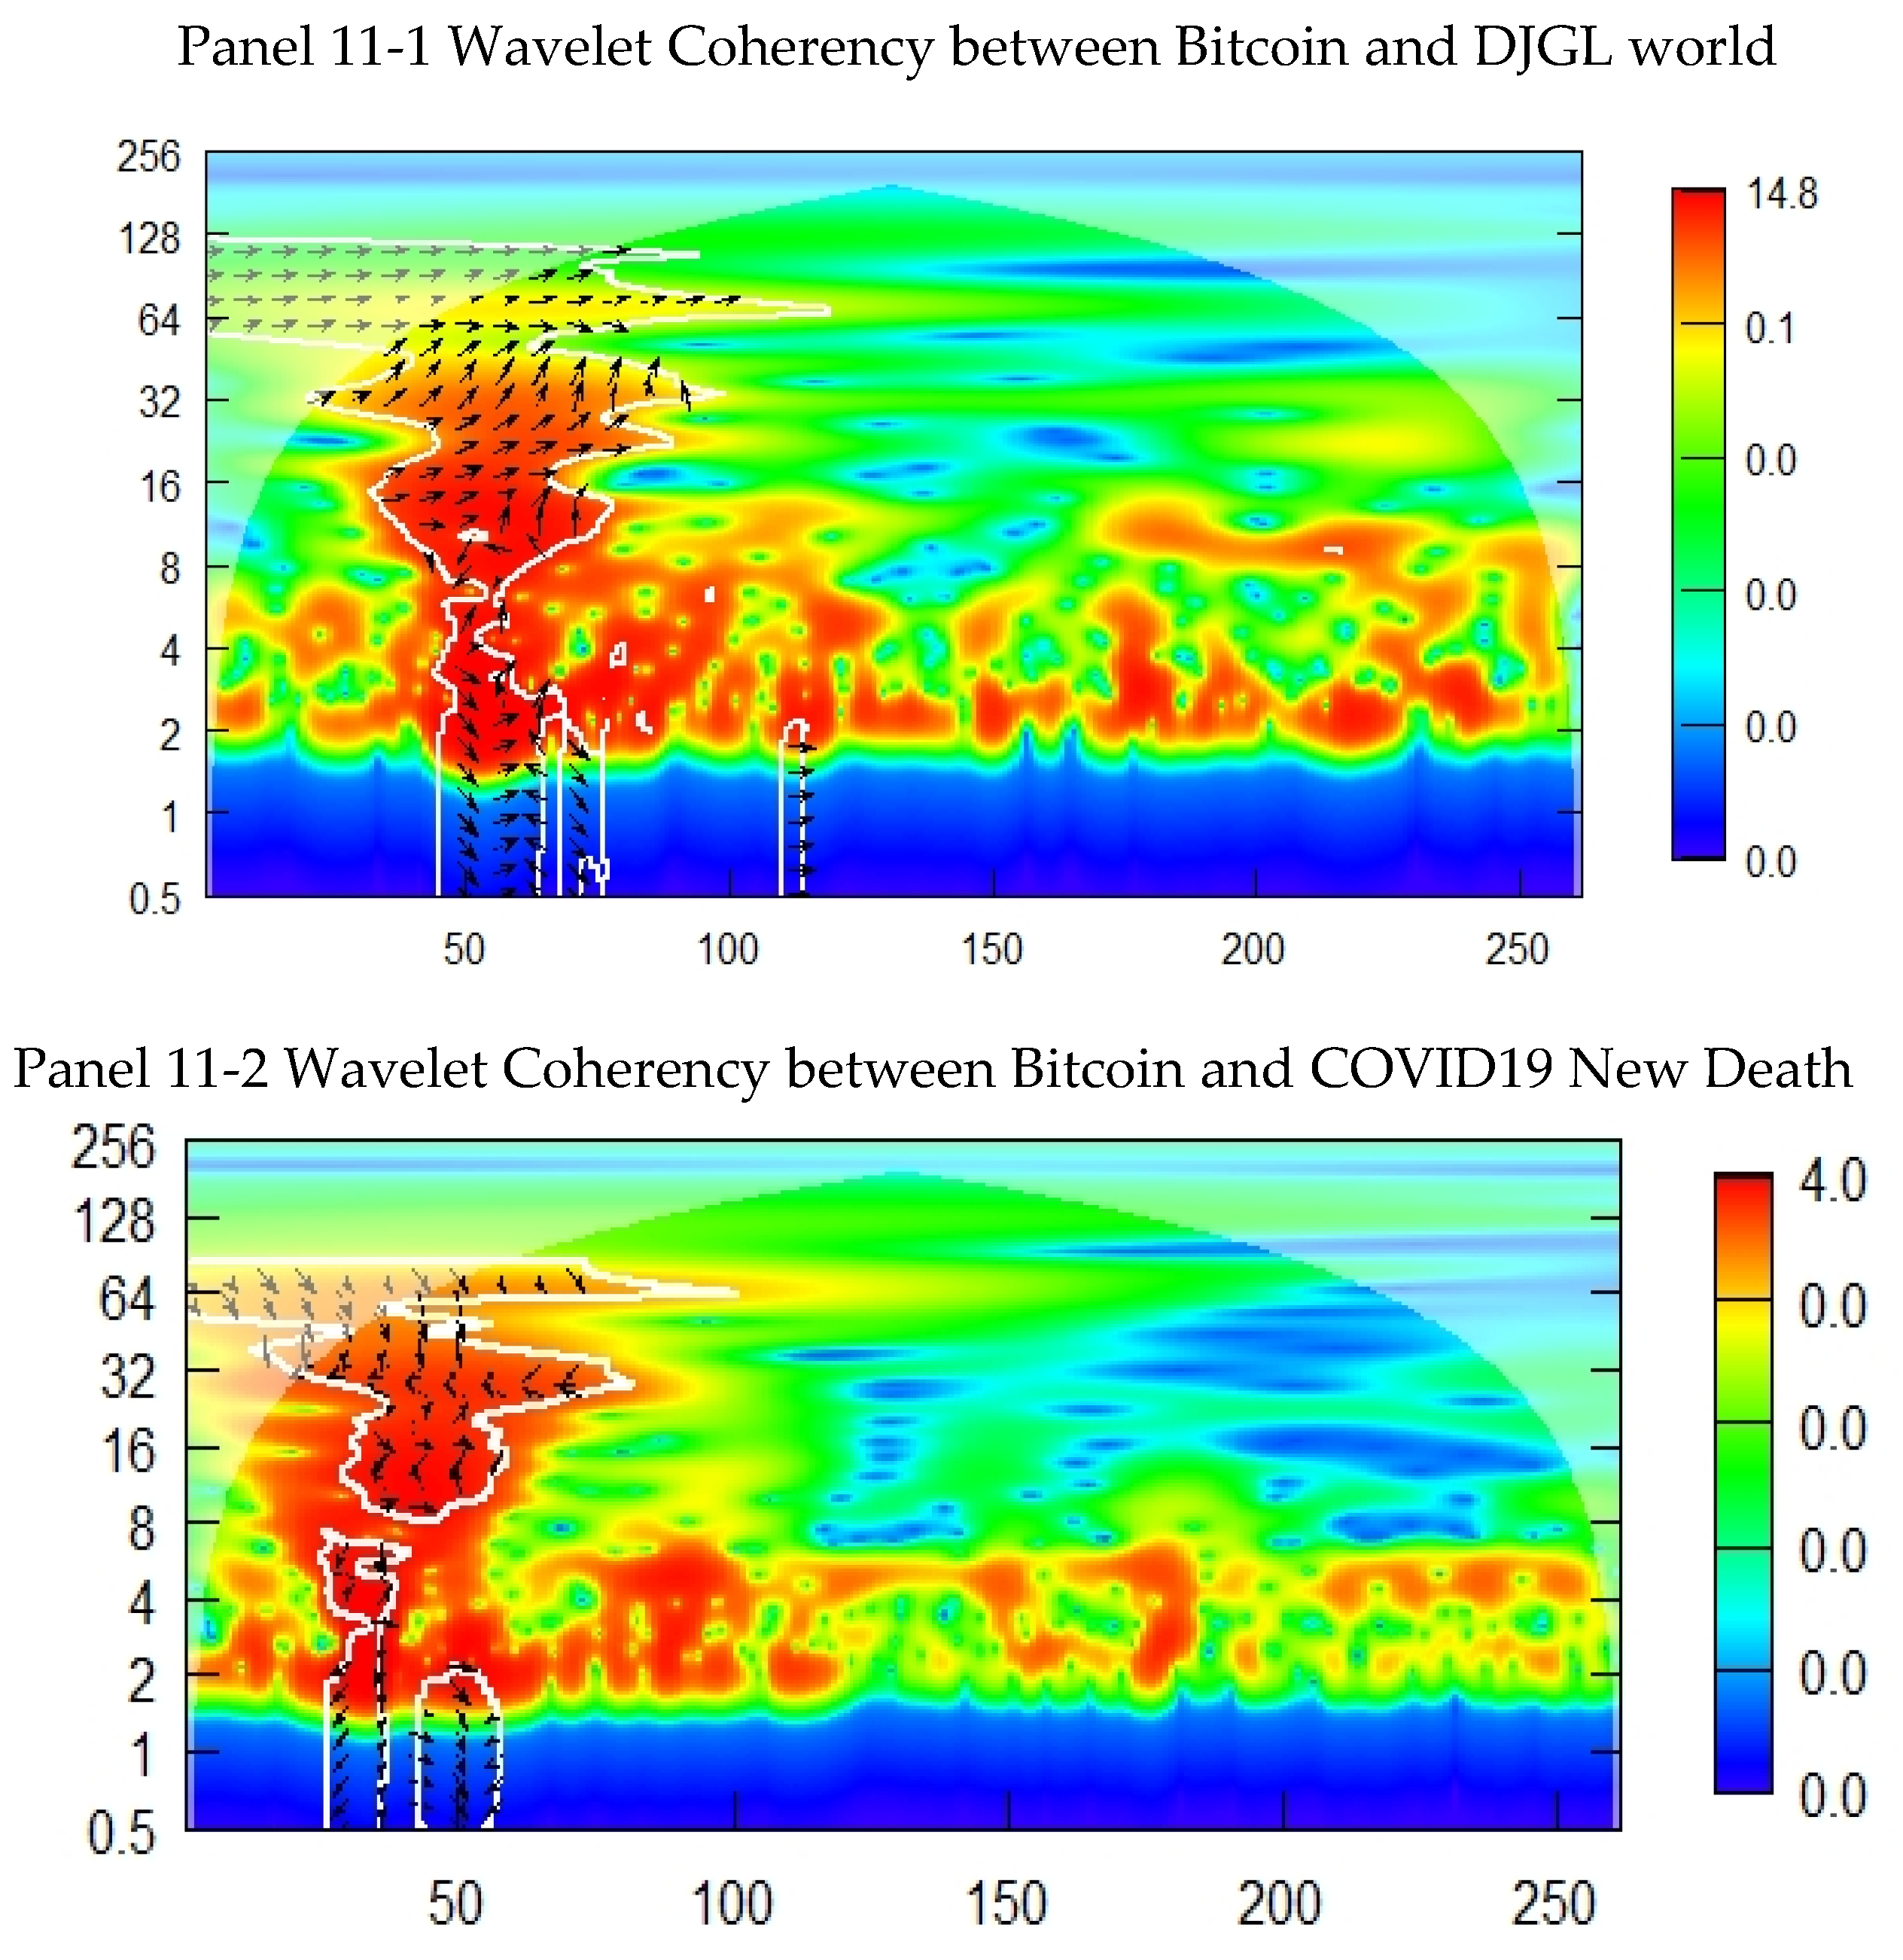
We apply wavelet coherence between Bitcoin and COVID19 indicator as well as the stocks, using tow time series at each application for the studying the variance and the co-movement of the Bitcoin with each selected variable,
Figure 11 and
Appendix B-1. It capture the co-movement between the commodities such as the Bitcoin and the stock market and the COVID19 indicators.
The maximum scale for Bitcoin is 128 days. The majority of the Arrows are for

all stock markets which means that the Bitcoin are lagging those commodities as well as the COVID 19 pandemic. We obseve a high degree of co-movement between Bitcoin and the stocks at the scale of 128 days frequencies for the first three months for the case of all stocks except the S&P who was keeping a high significant co-movement in the long run. The low frequencies and high power of coherence in the co-movement signals implies higher return from the diversification of the portfolio in short horizon. A powerful co-movement at high frequencies suggests higher diversification levels in the long-run horizon. We find a low frequency and insignificant co-movement in the second half of the period for the case of stocks as well as COVID19 indicators. The causality and phase difference of Bitcoin with stocks is concluded through the arrow point

at the scale ranging from 64 to 256 days which means phase in relationship, indicating the positive correlation between the Bitcoin and the stock market. We observe the arrow

, the first half period, ranging in scale from 8 to 64 days which means that the Bitcoin lead the stocks market in the short run during the COVID 19 crisis and after that it becomes a positive relationship of causality. As we observe through the figure that the increasing rate of death was associated with a decrease in the value of Bitcoin in short term, within the first three months of the period, with high scale of 64 days reaching after that term a low coherency for the next nine months. The phase difference and causality for the COVID 19 death and the COVID 19 New cases and Bitcoin. We see, the main significant period of coherence is from January to March, the first three months, with scale ranging between 0.5 a d 75 days , that arrows are in majority

and

, which means that the BITCOIN and the COVID19 indicators are an out-phase relationship and the COVID 19 indicators are leading the value of the Bitcoin. The Bitcoin is the biggest cryptocurrencies in terms of capitalisation, and it has unprecedented interaction towards the COVID 19 shock in short run followed by a recuperation in terms of value and size in the middle and long run. The most general color in Wavelet coherency for Bitcoin case with stocks as well as COVID 19 indicators is Red with different scale range in the short and long term, which means that the Bitcoin is correlated with stocks and the COVID 19 indicators. Economically the Bitcoin were influenced positively in terms of value within the shock of COVID 19 in the short term, and the shock were assimilated within the long horizon with less influence on the stability of the value of the Bitcoin. Most of the significant parts are in the cone of influence which means that there is a significant connection between the Bitcoin and the stocks as well as the Bitcoin and the COVID 19 indicators. Therefore, Bitcoin is considered as strong safe haven asset from the perspective of Wavelet Coherency for the whole period and all analysed stocks within the COVID19 frame crisis.
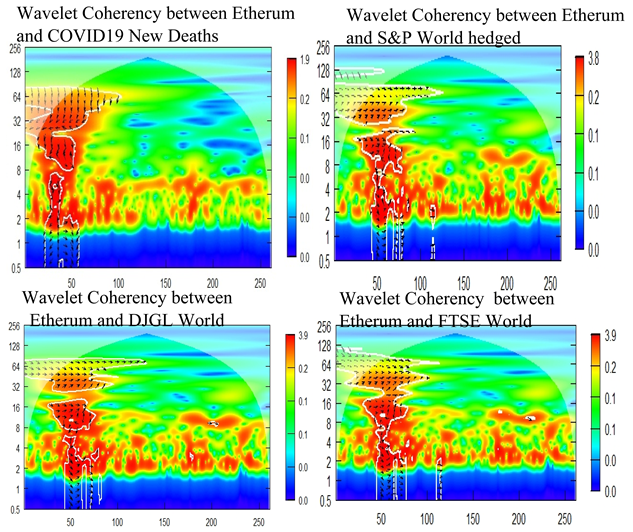
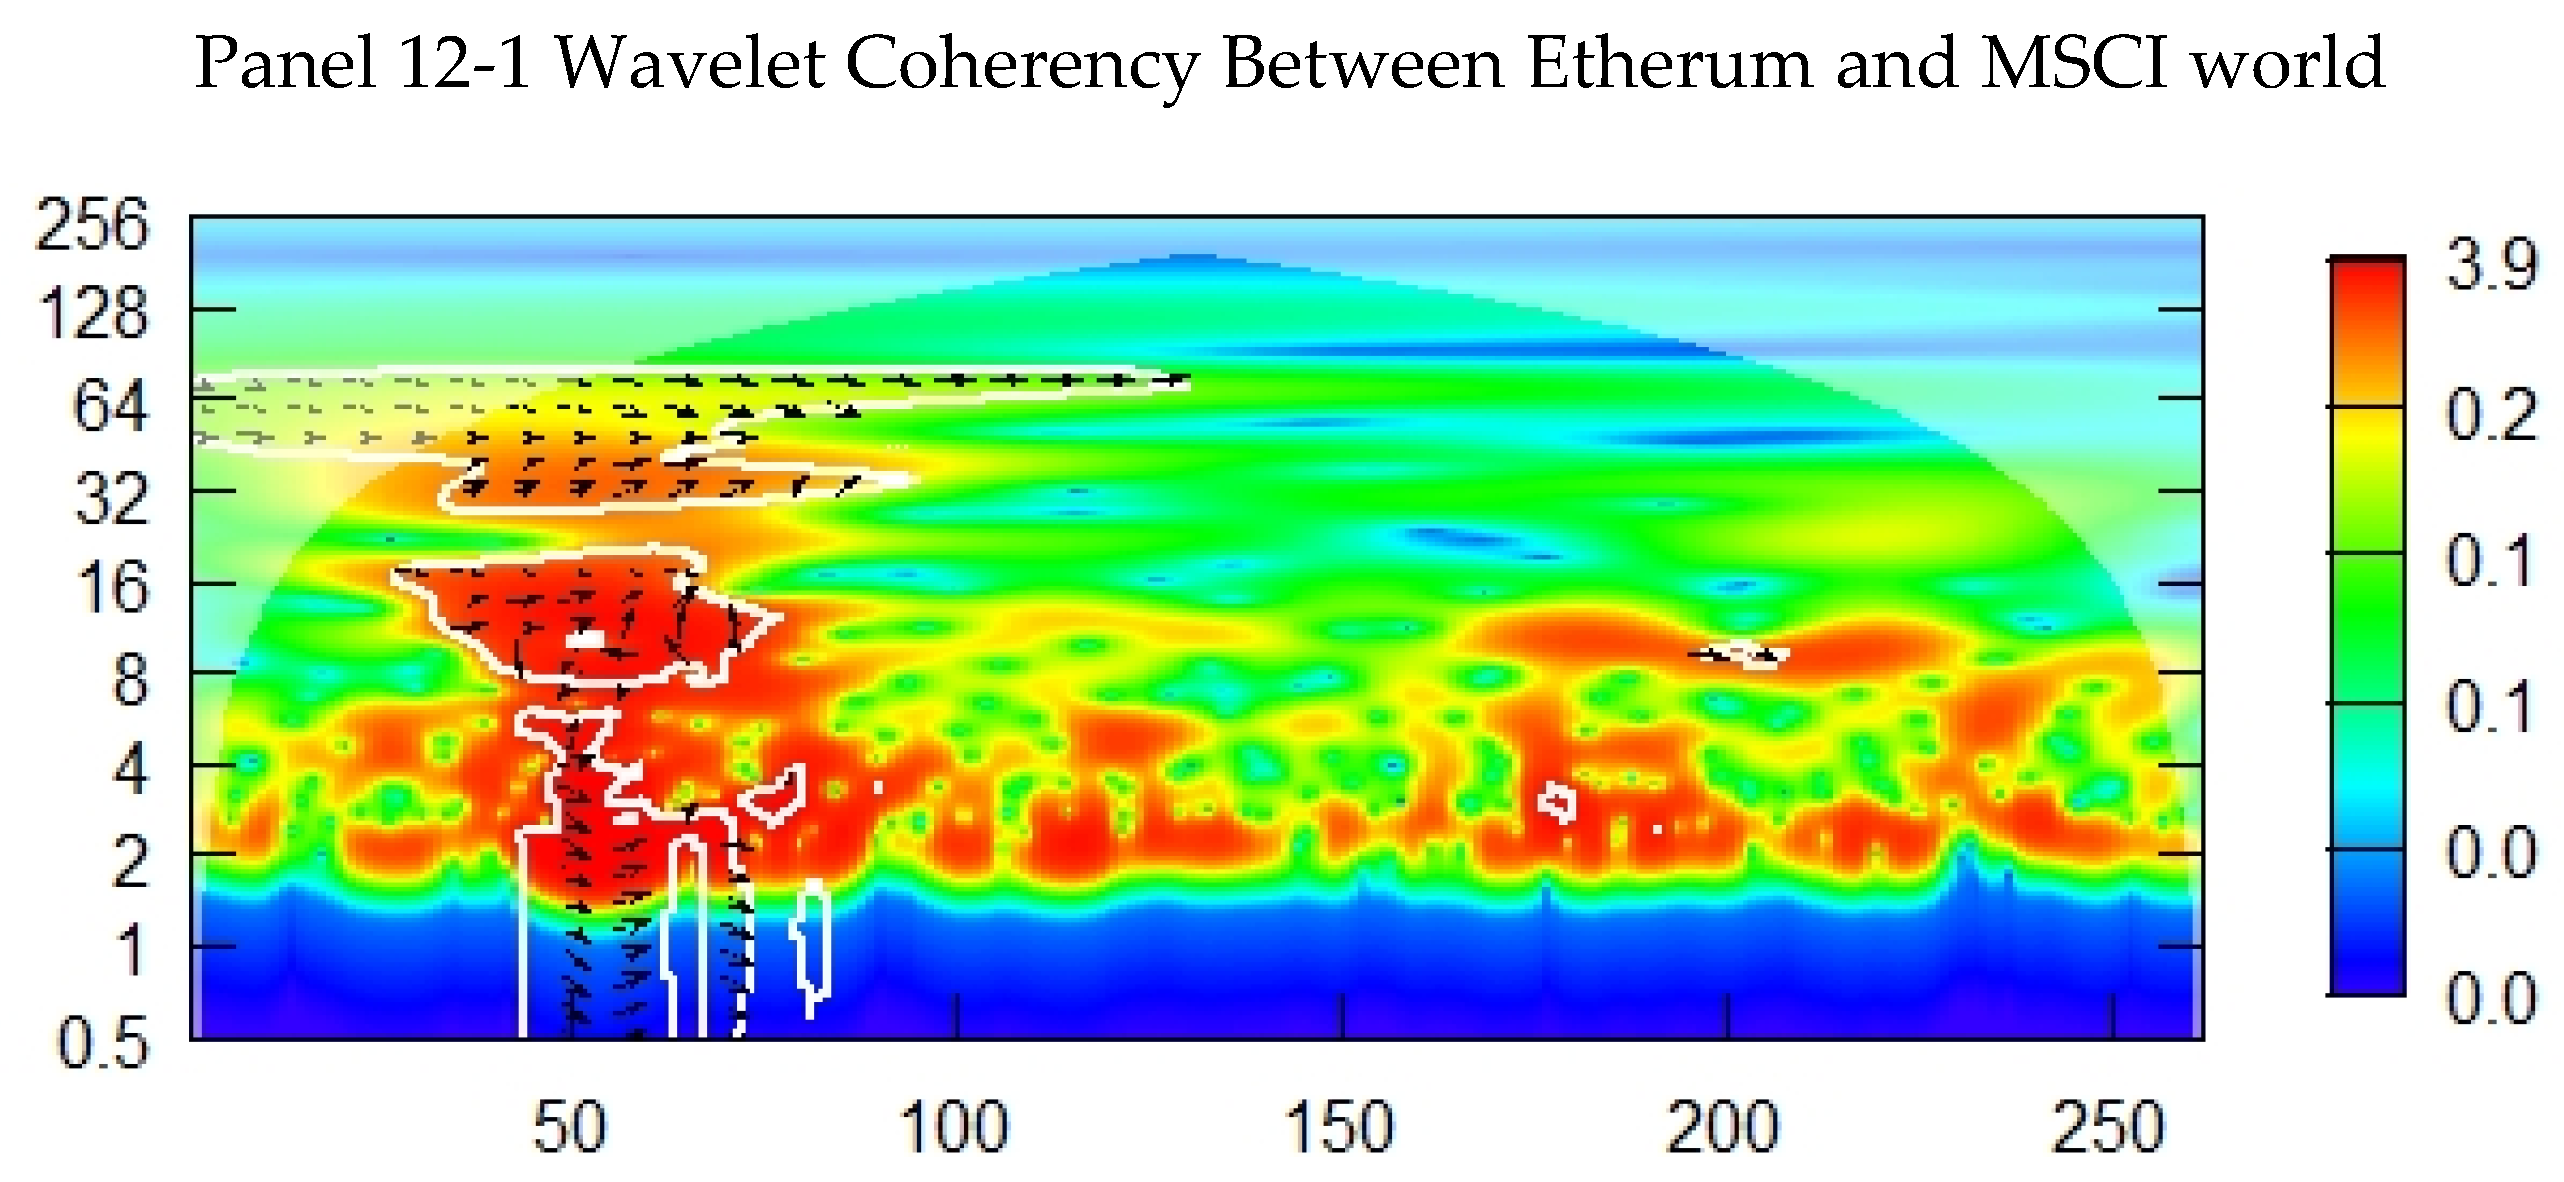
Etherum is the second largest cryptocurrencies after the Bitcoin in terms of capitalisation and size.
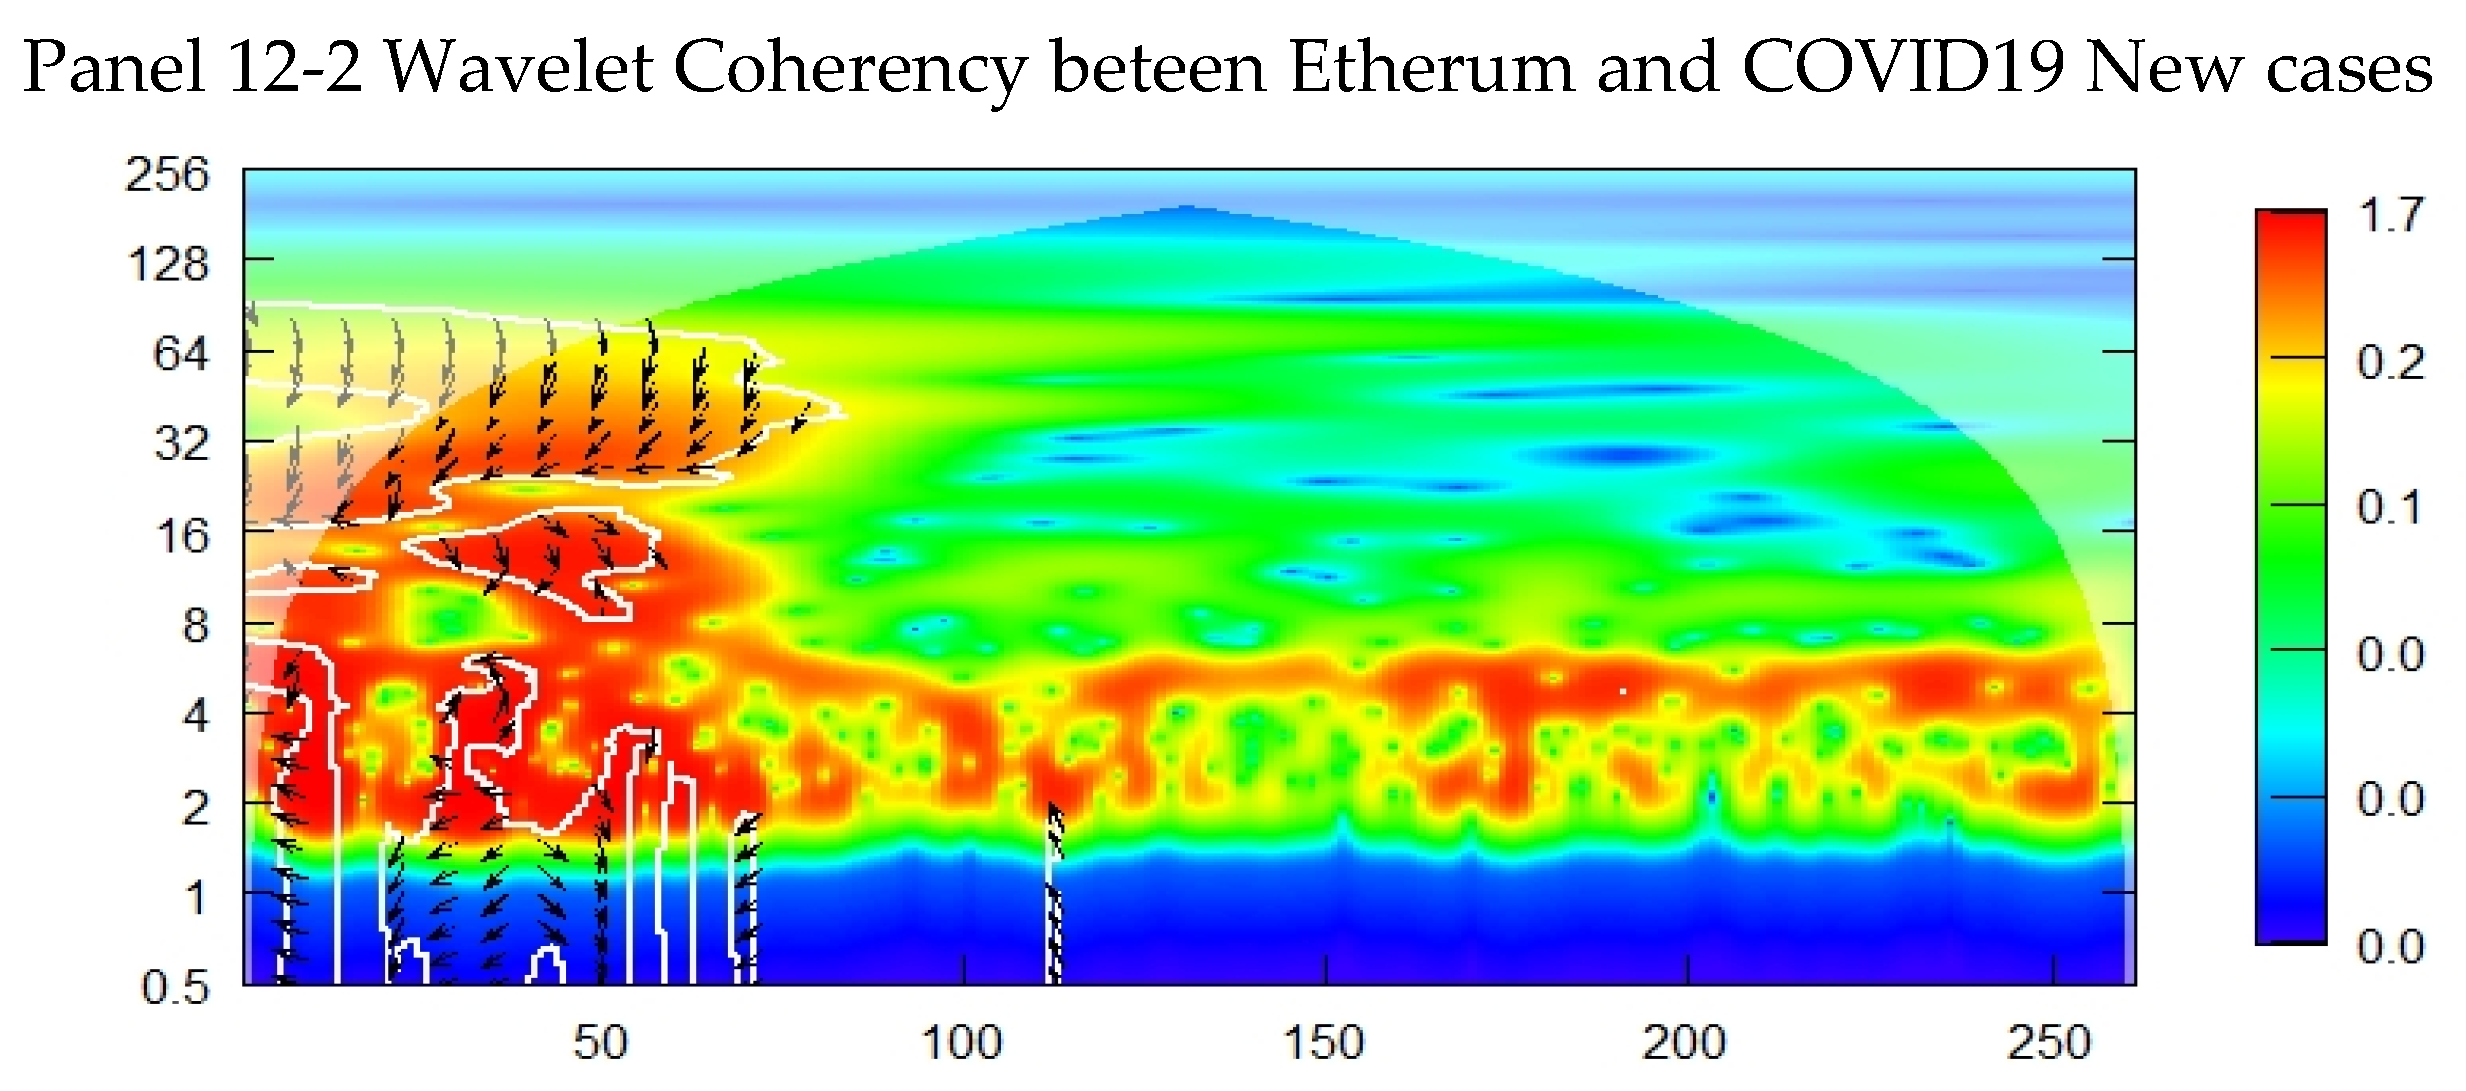
Figure 12, Basic on Wavelet Coherency and phase difference for stocks and COVID19 indicators, Etherum show similar coherency, causality and correlation in the short horizon as well as the middle and the long run as Bitcoin. The range of scale of coherency in the short horizon between the Etherum and the stock market is at 75 days with positive correlation; and in the long term with low coherence at the scale of 8 days. The phase difference between the Etherum and the stock market is in phase relationship and the stock market is leading the Etherum during the COVD 19 crisis. Etherum is considered as strong safe haven asset basic on the approach of Wavelet coherency for all analysed stocks within the COVID 19 health crisis.
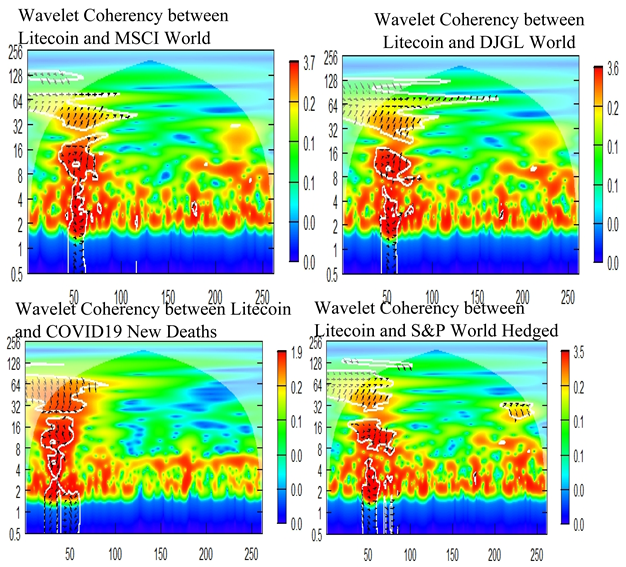
The litecoin is a middle size of capitalization cryptocurrencies comparing to the Bitcoin. The result of the wavelet coherence approach is diverse for the Litecoin comparing to the Bitcoin.
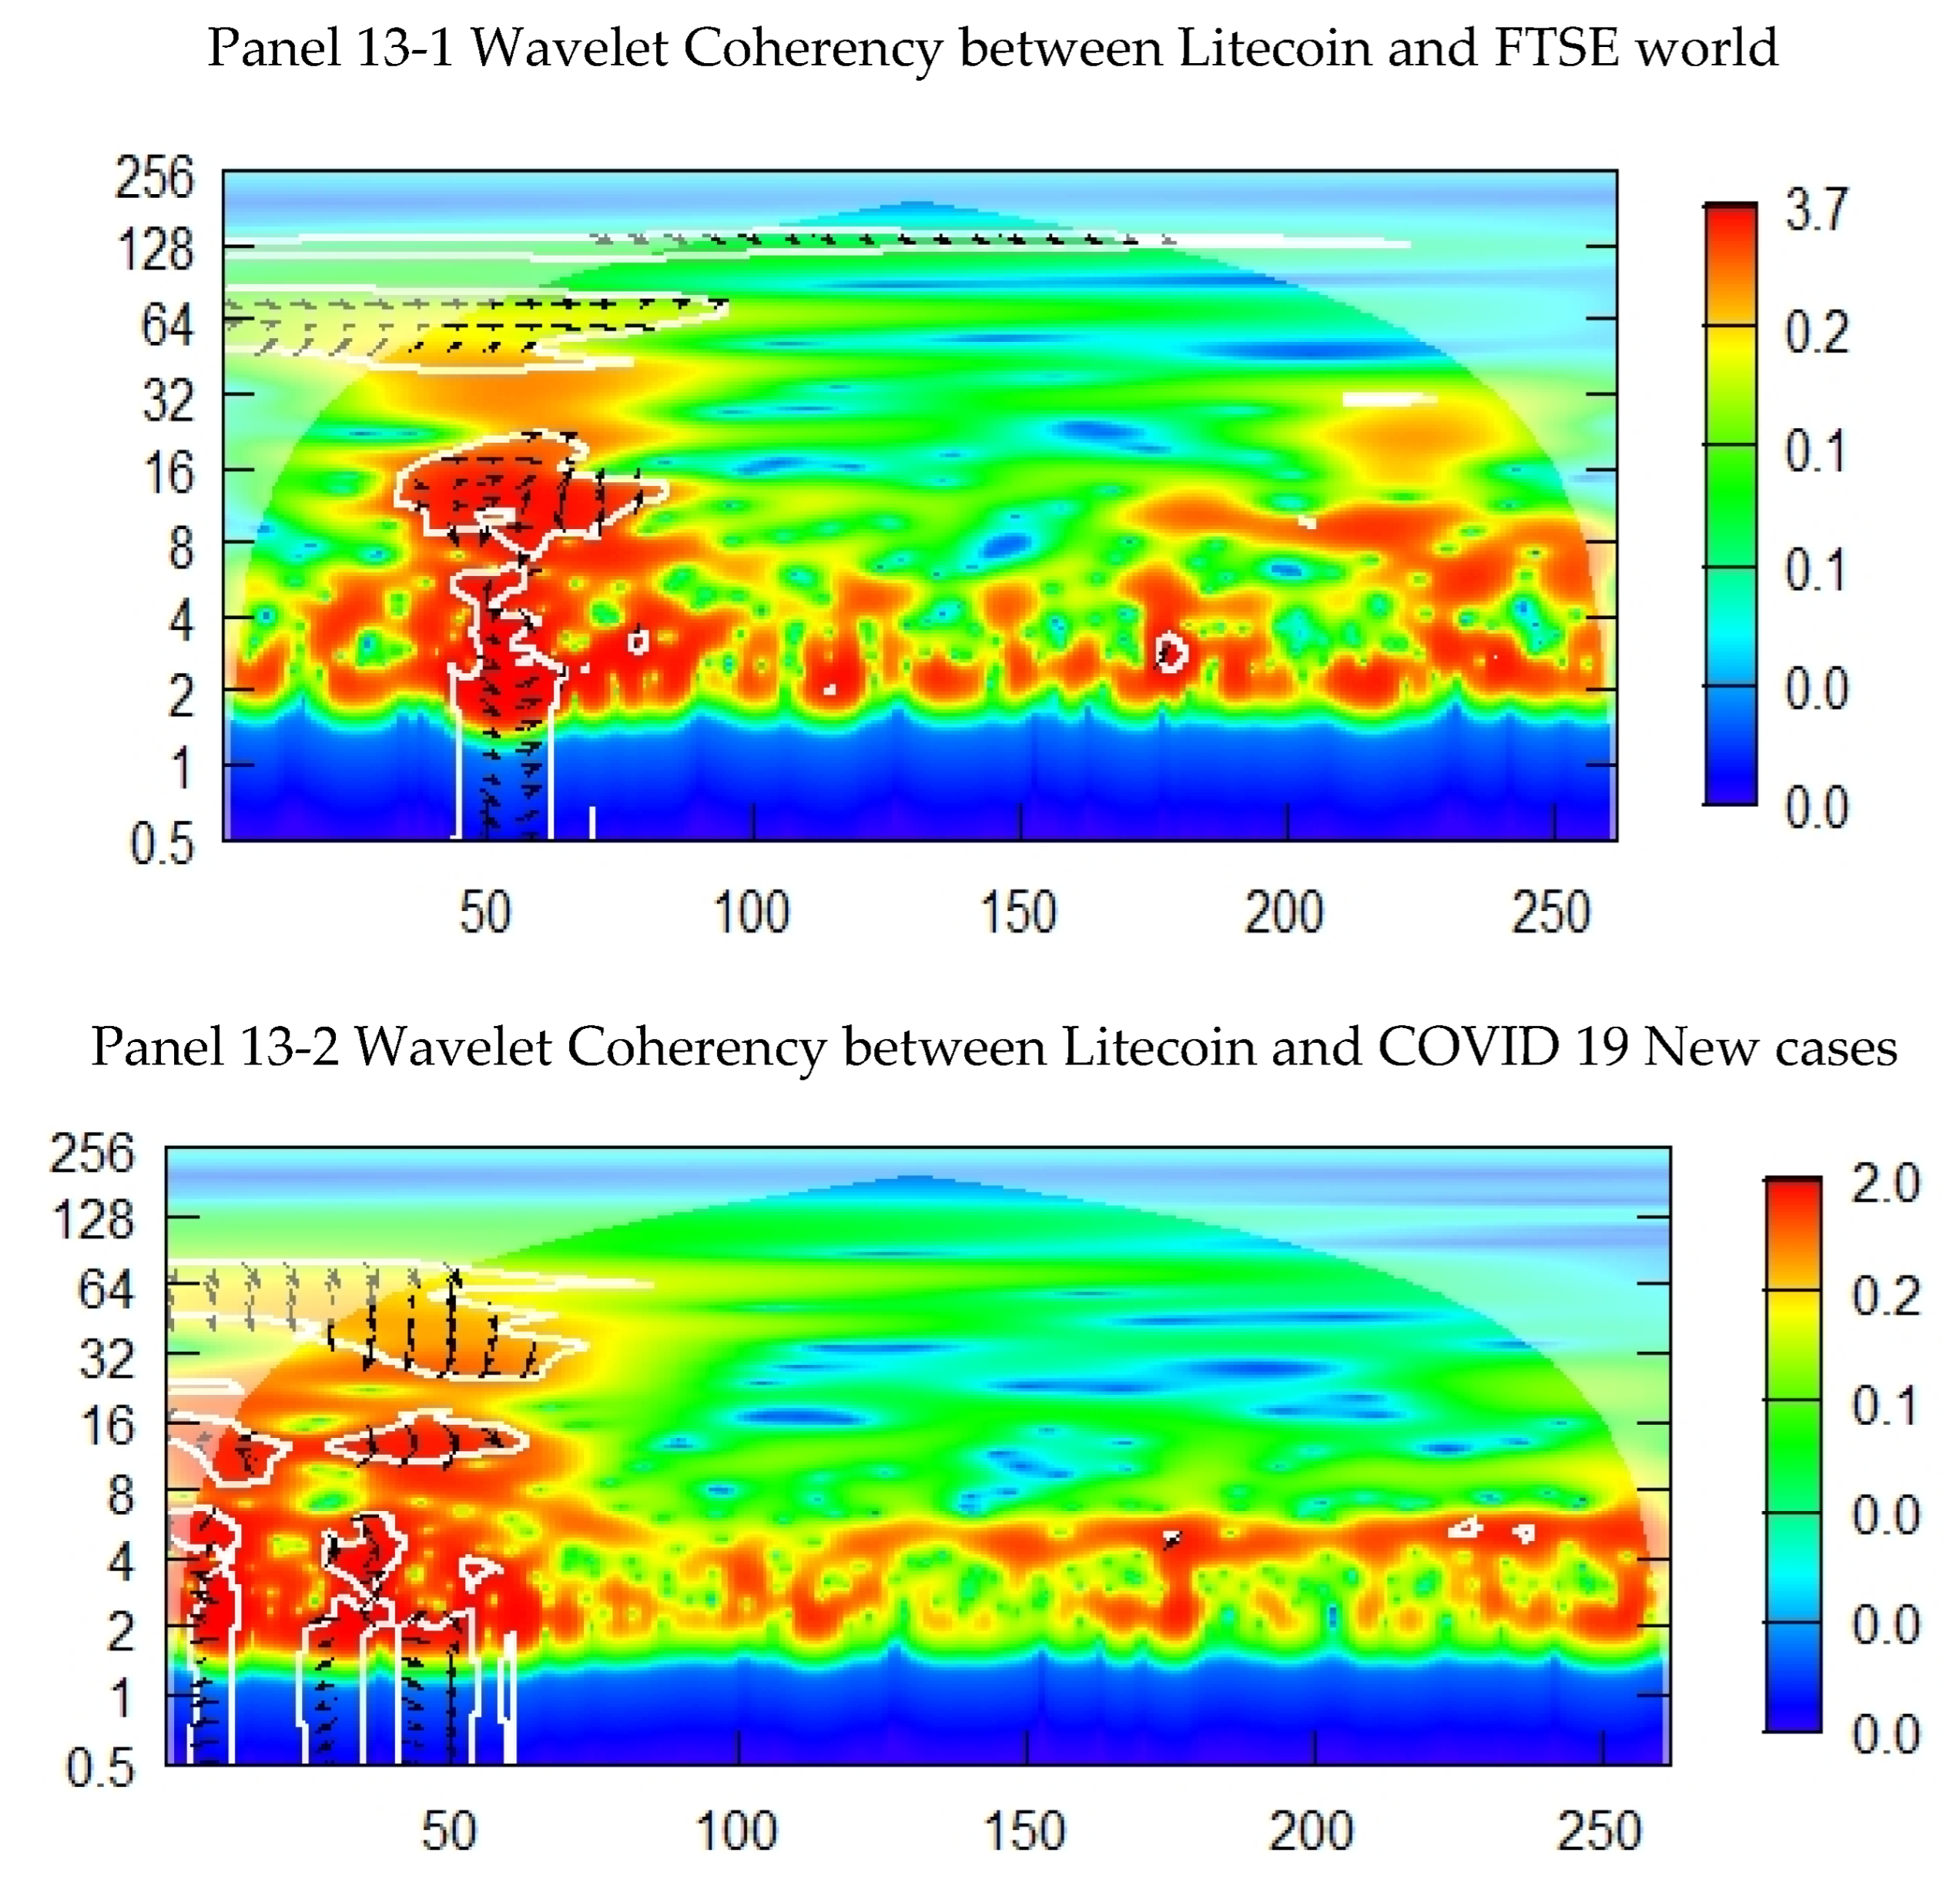
Figure 13, there is high coherency between the Litecoin and the stock market which is synchronised only within the COVID19 shock contagion in the third month of the studied period. The first two months was considered with weak coherence between Litecoin and the stock market, the rest of the period is considered with low coherency. A positive correlation is considered between the litecoin and the stocks at the scale frequencies ranging between 2 and 16 days. The majority of the significant region is in the cone of influence. The phase of difference between Litecoin and the stocks is categorised out of phase and the litecoin is lagging the stocks at a range of frequencies of 128 days. The COVID 19 indicators both the new death and the new cases have a high coherence with the value of the litecoin at the first of three months, followed by a very low coherency for the rest of the period with rage scale of 4 days. Moreover, the COVID19 crisis does not have any impact on the value of Litecoin in the long run. In general and basic on the approach of wavelet coherence, litecoin is a weak safe haven asset for all the analysed stocks during the COVID 19 pandemic.
XRP is a small size cryptocurrencies in terms of capitalization and in terms of integration in the financial market.
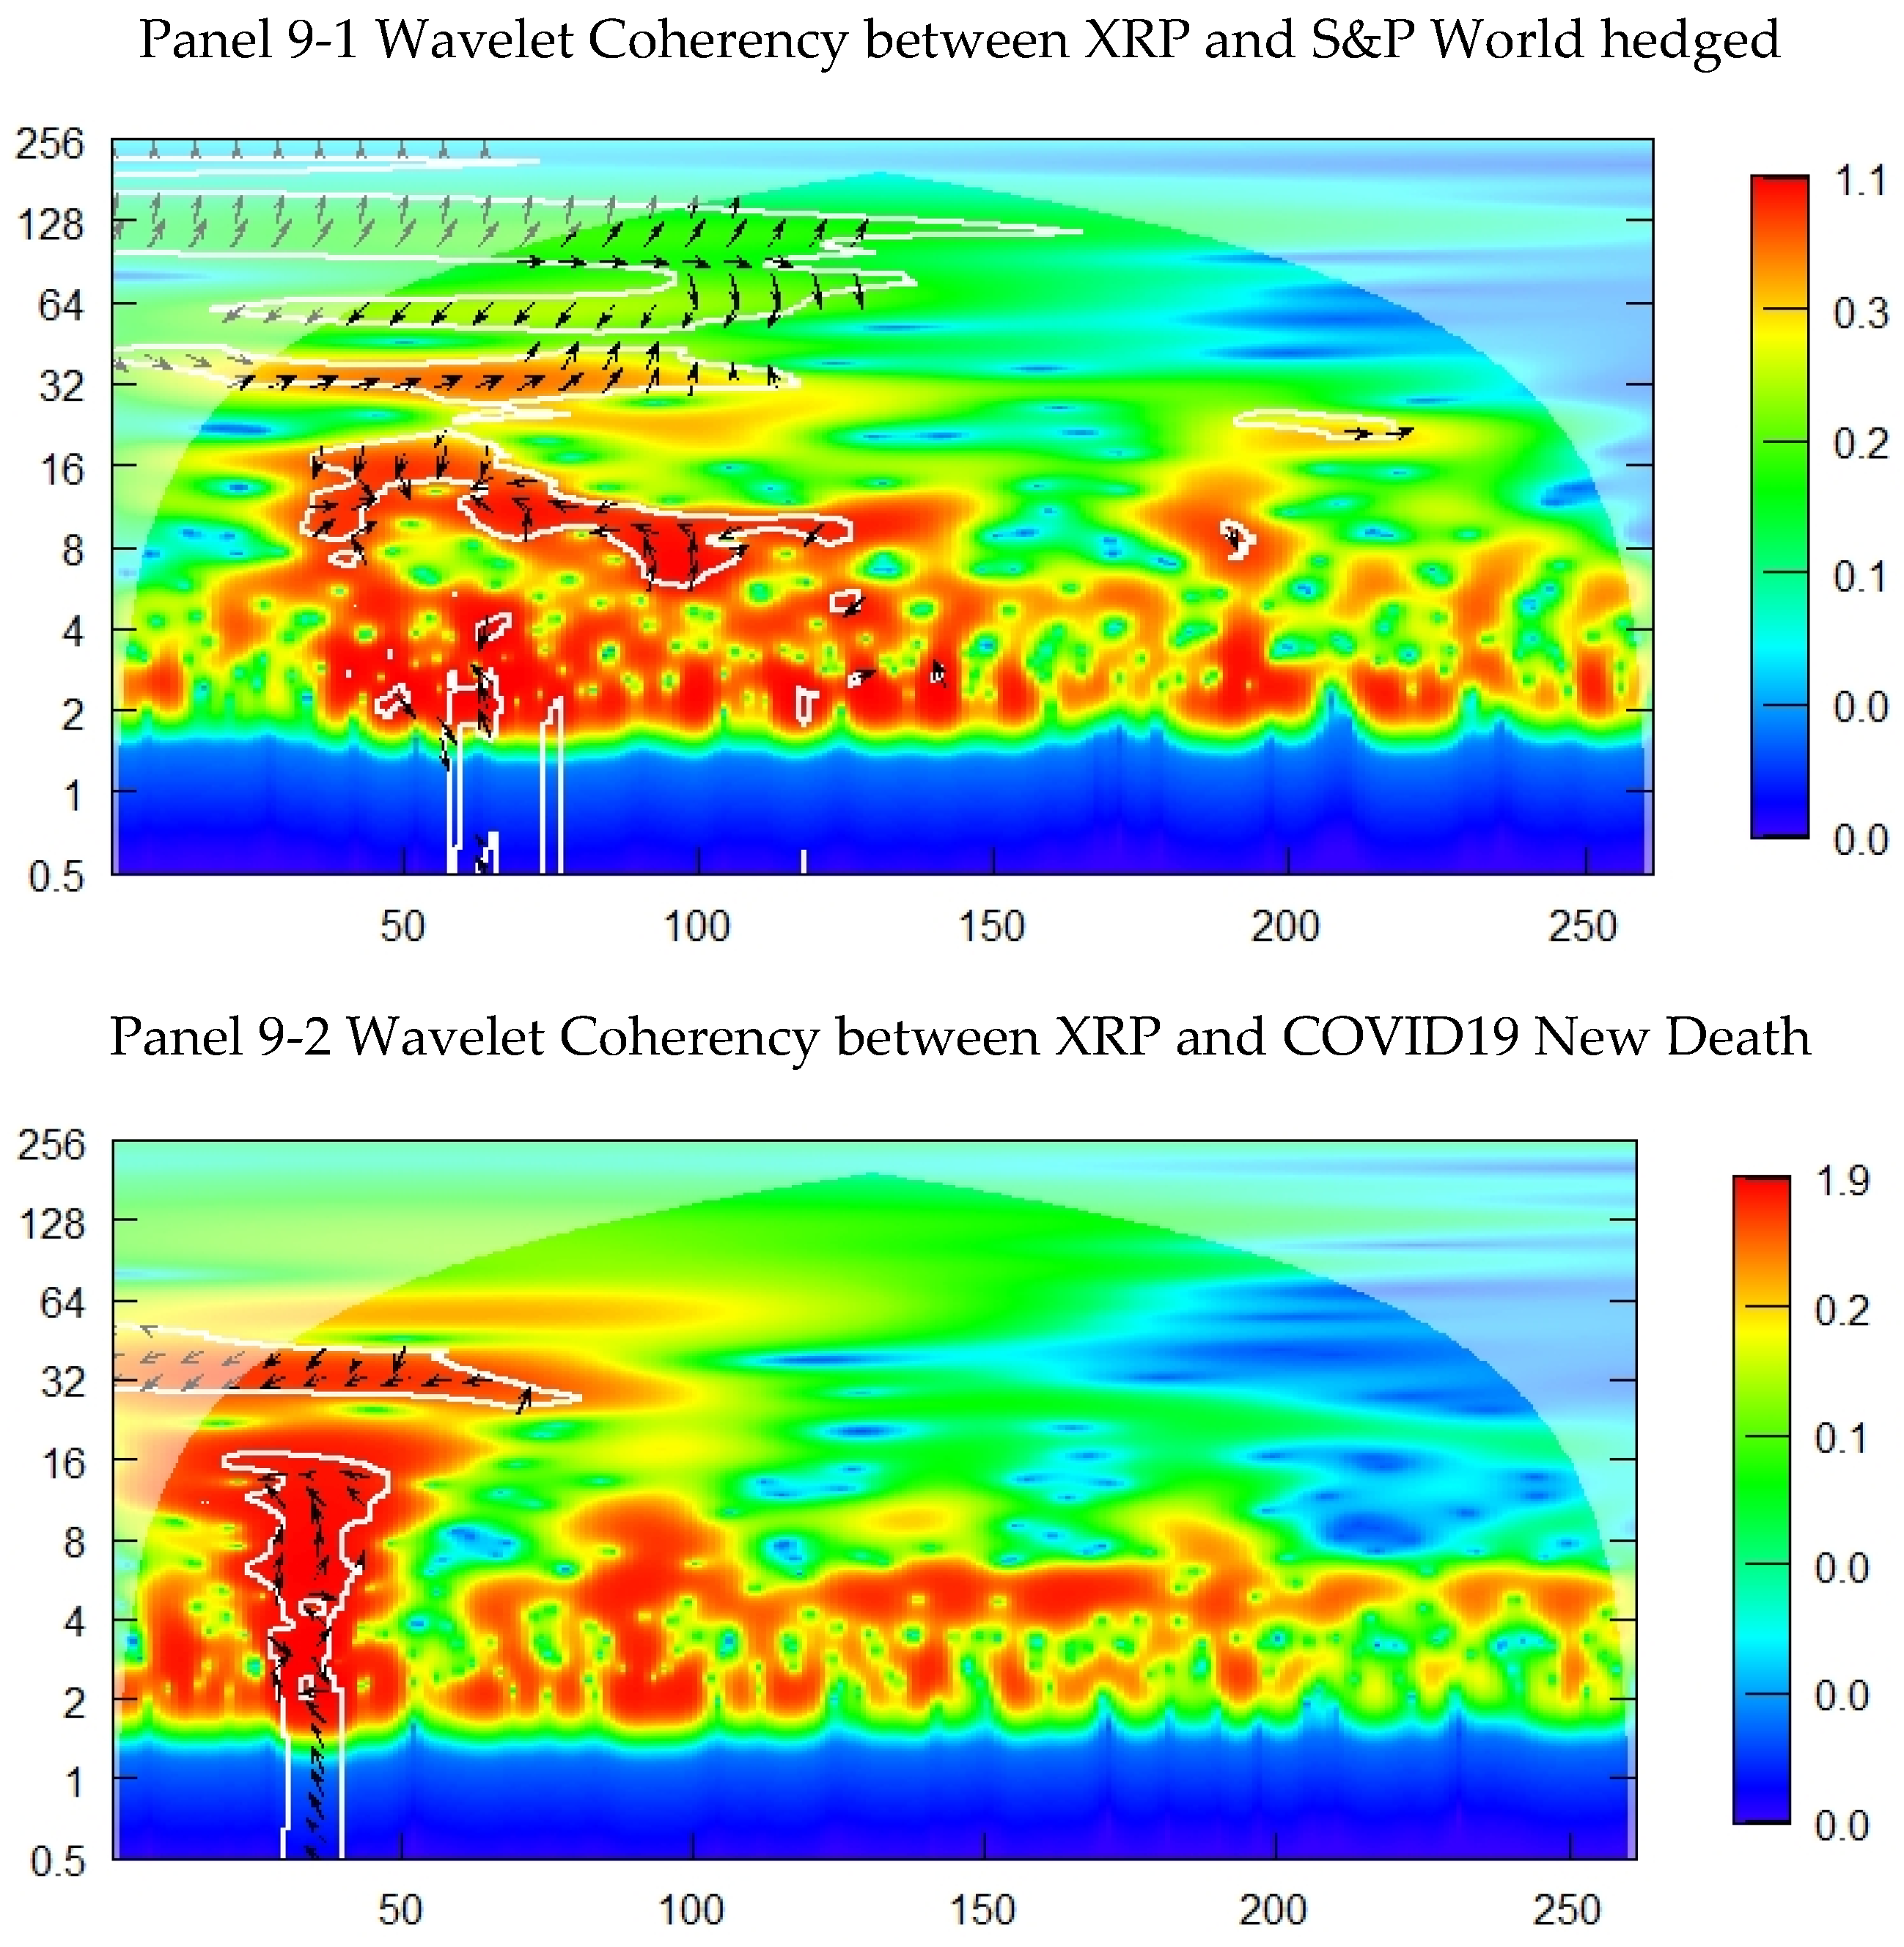
Figure 14, within the application of the wavelet coherency approach for XRP with the studied stock market within the COVID 19 framework, we find that XRP is the lowest potential of safe haven assets comparing to the Bitcoin, Etherum, and litecoin. XRP show high coherence with the stock market just within the peak phase of contagion effect of the pandemic, in the third month of the studied period. The rest of the period was categorised as low coherency between the XRP and the stock market. The significant region in the cone of influence is very small. The phase of difference and the causality of the XRP with stocks is concluded through the arrow point and at the scale frequencies ranging between 32 and 256 days, which means that the XRP value is lagging by the stocks returns. There is a weak coherency between the XRP and the COVID19 indicators in short horizon and the long run with range scale of frequencies between 2 and 8 days.
6. Discussion and Conclusion
The COVID 19 pandemic provide a reframe for the economic system to be able to overcome crisis within an economic measures related to all the fields such as labour, fiscal, investment, capital market, international trade, etc. The reframing of the investment system and the rise of the uncertainty within the economy incite for searching a safe haven assets as an important and timely issue within the health crisis. The role of traditional commodities as safe haven assets must be re-evaluated. The cryptocurrencies are a source of diversification of the portfolio and hedging against the cycles caused by the economic and extra-economic shock. Using daily data from January 2020 to December 2020, as the studied period, this article study the safe haven properties of 4 cryptocurrencies such as Bitcoin, Etherum, Litecoin and XRP; and four stocks assets such as the FTSE, MSCI, DJGL and S&P. To measure the variability and the co-movement and examine the safe haven properties of the cryptocurrencies comparing to the stocks in the COVID19 period, we make both the DCC-GARCH and wavelet method to extract the data about the time-varying and time-frequency structure of correlation and co-movement between the cryptocurrencies and the stocks market. In the first part, we use vector auto regressive Dynamic conditional correlations to detect the dynamic variability of the commodities in the capital market within the COVID 19 circumstances. This approach can entail the changes in the capital market by adding the safe haven assets into the variance portfolio. Our empirical results suggest that the Bitcoin and Etherum are a safe haven investment in the short and long run in the capital market for all the studied stocks. However, Litecoin was a safe haven investment just for the MSCI and the XRP is not safe haven investment for all the selected stocks. In the second part, we use The Wavelet Transformation and the wavelet Coherence models to measure the time series variance for each time and for each scale. These findings provide support for other empirical studies regarding the diversification of the hedge funds as through the complementarity between the stock market and the cryptocurrencies as safe haven investment.
Basic on wavelet Transform, the size of capitalization of the cryptocurrencies is a catalyst for the variability towards the COVID19 health crisis. Bitcoin and Etherum show the most important power during the studied period with a more pronounced effect during the third month. Litecoin is characterised of less pronounced effect in the third period with low scale. XRP is the lowest power with similar low scale during the whole period. The selected stocks are showing a high power during all the period of COVID19 in the short and medium run during the first half of 2020, and the same reaction to the COVID19 shock. The New cases show less variability at the beginning of the health crisis comparing to the variability of the new death, and the stable trend for both indicators for the rest of the period figured out by the international common measures taken towards COVID19 health crisis.
Basic on Wavelet Coherence Bitcoin and Etherum is strong safe haven investment assets for all the selected stocks, Litecoin is with weak potential of safe haven investment for all the selected stocks and the XRP is with the lowest potential of safe haven for all studied stocks during the COVID19 health crisis.
Our findings on the emergence of safe haven investment of the cryptocurrencies during the health crisis, which is touching the majority of economic and extra-economic sides provide new insights for the investors who are looking for certainty in their investment and for refuge for their potential portfolios, i.e., the Bitcoin and Etherum can be acting as strong hedge and strong safe haven investment for all the investment in the capital market. Moreover, our result on the analysis of the safe haven investment properties of the cryptocurrencies market and the capital market may provide significant enhancement for the regulatory agencies and the policy makers for setting new introductions of new cryptocurrencies within the economy and new targeting policies for the monetary and financial system.
Appendix A. VAR-DCC-GARCH Results
-
1-VAR-DCC GARCH Bitcoin
-
2-VAR-DCC GARCH Etherum
-
3-VAR-DCC GARCH Litecoin
-
4-VAR-DCC GARCH XRP
Appendix B. Wavelet Coherency Results
-
1-Bitcoin
-
2-Etherum
-
3-Litecoin
-
4-XRP
Appendix C. Wavelet Transformation Results
References
- Akerlof, G.A., 1978. THE MARKET FOR “LEMONS”: QUALITY UNCERTAINTY AND THE MARKET MECHANISM**, in: Uncertainty in Economics. Elsevier, pp. 235–251.
- Akyildirim, E., Corbet, S., Lucey, B., Sensoy, A., Yarovaya, L., 2020. The relationship between implied volatility and cryptocurrency returns. Finance Research Letters 33, 101212. [CrossRef]
- Ang, J.P., Dong, F., Patalinghug, J., 2021. COVID-19: effectiveness of socioeconomic factors in containing the spread and mortality. International Review of Applied Economics 35, 164–187. [CrossRef]
- Antonakakis, N., Chatziantoniou, I., Filis, G., 2017. Oil shocks and stock markets: Dynamic connectedness under the prism of recent geopolitical and economic unrest. International Review of Financial Analysis 50, 1–26. [CrossRef]
- Aste, T., 2019. Cryptocurrency market structure: connecting emotions and economics. Digit Finance 1, 5–21. [CrossRef]
- Bollerslev, T., 1986. Generalized autoregressive conditional heteroskedasticity. Journal of Econometrics 31, 307–327. [CrossRef]
- Bouri, E., Molnár, P., Azzi, G., Roubaud, D., Hagfors, L.I., 2017. On the hedge and safe haven properties of Bitcoin: Is it really more than a diversifier? Finance Research Letters 20, 192–198. [CrossRef]
- Brandvold, M., Molnár, P., Vagstad, K., Andreas Valstad, O.C., 2015. Price discovery on Bitcoin exchanges. Journal of International Financial Markets, Institutions and Money 36, 18–35. [CrossRef]
- Cappiello, L., Engle, R.F., Sheppard, K., 2006. Asymmetric Dynamics in the Correlations of Global Equity and Bond Returns. Journal of Financial Econometrics 4, 537–572. [CrossRef]
- Chu, J., Zhang, Y., Chan, S., 2019. The adaptive market hypothesis in the high frequency cryptocurrency market. International Review of Financial Analysis 64, 221–231. [CrossRef]
- Corbet, S., Hou, Y., Hu, Y., Lucey, B., Oxley, L., 2020. Aye Corona! The contagion effects of being named Corona during the COVID-19 pandemic. Finance Research Letters 101591. [CrossRef]
- Corbet, S., Meegan, A., Larkin, C., Lucey, B., Yarovaya, L., 2018. Exploring the dynamic relationships between cryptocurrencies and other financial assets. Economics Letters 165, 28–34. [CrossRef]
- Czapliński, T., Nazmutdinova, E., 2019. Using FIAT currencies to arbitrage on cryptocurrency exchanges. Journal of International Studies 12, 184–192. [CrossRef]
- Dwita Mariana, C., Ekaputra, I.A., Husodo, Z.A., 2021. Are Bitcoin and Ethereum safe-havens for stocks during the COVID-19 pandemic? Finance Research Letters 38, 101798. [CrossRef]
- Dyhrberg, A.H., 2016. Bitcoin, gold and the dollar – A GARCH volatility analysis. Finance Research Letters 16, 85–92. [CrossRef]
- Engle, R., 2002. Dynamic Conditional Correlation: A Simple Class of Multivariate Generalized Autoregressive Conditional Heteroskedasticity Models. Journal of Business & Economic Statistics 20, 339–350. [CrossRef]
- Engle, R.F., 1982. Autoregressive Conditional Heteroscedasticity with Estimates of the Variance of United Kingdom Inflation. Econometrica 50, 987. [CrossRef]
- Fernandes, N., 2020. Economic Effects of Coronavirus Outbreak (COVID-19) on the World Economy. SSRN Journal. [CrossRef]
- Gates, B., 2020. Responding to Covid-19 — A Once-in-a-Century Pandemic? N Engl J Med 382, 1677–1679. [CrossRef]
- Gencer, H.G., Musoglu, Z., 2014. Volatility Transmission and Spillovers among Gold, Bonds and Stocks: An Empirical Evidence from Turkey 4, 9.
- Guesmi, K., Saadi, S., Abid, I., Ftiti, Z., 2019. Portfolio diversification with virtual currency: Evidence from bitcoin. International Review of Financial Analysis 63, 431–437. [CrossRef]
- Hussain Shahzad, S.J., Bouri, E., Roubaud, D., Kristoufek, L., 2020. Safe haven, hedge and diversification for G7 stock markets: Gold versus bitcoin. Economic Modelling 87, 212–224. [CrossRef]
- Jiang, Y., Lie, J., Wang, J., Mu, J., 2021. Revisiting the roles of cryptocurrencies in stock markets: A quantile coherency perspective. Economic Modelling 95, 21–34. [CrossRef]
- Klein, T., Pham Thu, H., Walther, T., 2018. Bitcoin is not the New Gold – A comparison of volatility, correlation, and portfolio performance. International Review of Financial Analysis 59, 105–116. [CrossRef]
- Kliber, A., Marszałek, P., Musiałkowska, I., Świerczyńska, K., 2019. Bitcoin: Safe haven, hedge or diversifier? Perception of bitcoin in the context of a country’s economic situation — A stochastic volatility approach. Physica A: Statistical Mechanics and its Applications 524, 246–257. [CrossRef]
- Kumah, S.P., Odei-Mensah, J., 2021. Are Cryptocurrencies and African stock markets integrated? The Quarterly Review of Economics and Finance 81, 330–341. [CrossRef]
- Maitra, D., Ur Rehman, M., Ranjan Dash, S., Hoon Kang, S., 2022. Do cryptocurrencies provide better hedging? Evidence from major equity markets during COVID-19 pandemic. The North American Journal of Economics and Finance 62, 101776. [CrossRef]
- Mensi, W., Rehman, M.U., Al-Yahyaee, K.H., Al-Jarrah, I.M.W., Kang, S.H., 2019. Time frequency analysis of the commonalities between Bitcoin and major Cryptocurrencies: Portfolio risk management implications. The North American Journal of Economics and Finance 48, 283–294. [CrossRef]
- Mokni, K., Youssef, M., Ajmi, A.N., 2022. COVID-19 pandemic and economic policy uncertainty: The first test on the hedging and safe haven properties of cryptocurrencies. Research in International Business and Finance 60, 101573. [CrossRef]
- Naeem, M.A., Bouri, E., Peng, Z., Shahzad, S.J.H., Vo, X.V., 2021. Asymmetric efficiency of cryptocurrencies during COVID19. Physica A: Statistical Mechanics and its Applications 565, 125562. [CrossRef]
- Peckham, R., 2013. Economies of contagion: financial crisis and pandemic. Economy and Society 42, 226–248. [CrossRef]
- Rua, A., Nunes, L.C., 2009. International comovement of stock market returns: A wavelet analysis. Journal of Empirical Finance 16, 632–639. [CrossRef]
- Segnon, M., Bekiros, S., 2020. Forecasting volatility in bitcoin market. Ann Finance 16, 435–462. [CrossRef]
- Smith, R.D., 2006. Responding to global infectious disease outbreaks: Lessons from SARS on the role of risk perception, communication and management. Social Science & Medicine 63, 3113–3123. [CrossRef]
- Urquhart, A., 2016. The inefficiency of Bitcoin. Economics Letters 148, 80–82. [CrossRef]
- Wang, G.-J., Xie, C., Wen, D., Zhao, L., 2019. When Bitcoin meets economic policy uncertainty (EPU): Measuring risk spillover effect from EPU to Bitcoin. Finance Research Letters 31, S1544612318305749. [CrossRef]
- Zargar, F.N., Kumar, D., 2019. Informational inefficiency of Bitcoin: A study based on high-frequency data. Research in International Business and Finance S0275-5319(18)30353–2, 26. [CrossRef]
- Zhang, D., 2020. Financial markets under the global pandemic of COVID-19. Finance Research Letters 6. [CrossRef]
Figure 1.
COVID 19 Pandemic Indicators. Source: Own study.
Figure 1.
COVID 19 Pandemic Indicators. Source: Own study.
Figure 2.
Market Capitalization for cryptocurrencies for 09/2018 to 12/2020. Source: Own study.
Figure 2.
Market Capitalization for cryptocurrencies for 09/2018 to 12/2020. Source: Own study.
Figure 3.
Market Cap for Wide range of cryptocurrencies. Source: Own study.
Figure 3.
Market Cap for Wide range of cryptocurrencies. Source: Own study.
Figure 6.
Dynamic Conditional Correlation between Etherum and FTSE World, and Bitcoin and COVID19 New Deaths. Source: Own study.
Figure 6.
Dynamic Conditional Correlation between Etherum and FTSE World, and Bitcoin and COVID19 New Deaths. Source: Own study.
Figure 7.
Dynamic Conditional Correlation between Litecoin and MSCI World, and Bitcoin and COVID19 New Cases. Source: Own study.
Figure 7.
Dynamic Conditional Correlation between Litecoin and MSCI World, and Bitcoin and COVID19 New Cases. Source: Own study.
Figure 8.
Dynamic Conditional Correlation between XRP and FTSE World, and Bitcoin and COVID19 New Cases. Source: Own study.
Figure 8.
Dynamic Conditional Correlation between XRP and FTSE World, and Bitcoin and COVID19 New Cases. Source: Own study.
Figure 9.
Wavelet Transformation for the selected cryptocurrencies. Source: Own study.
Figure 9.
Wavelet Transformation for the selected cryptocurrencies. Source: Own study.
Figure 10.
The Wavelet transformation for COVID19 proxies during the pandemic: COVID19 New cases and COVID19 New Death. Source: Own study.
Figure 10.
The Wavelet transformation for COVID19 proxies during the pandemic: COVID19 New cases and COVID19 New Death. Source: Own study.
Figure 11.
Wavelet Coherency for Bitcoin. Source: Own study.
Figure 11.
Wavelet Coherency for Bitcoin. Source: Own study.
Figure 12.
Wavelet Coherency for Etherum. Source: Own study.
Figure 12.
Wavelet Coherency for Etherum. Source: Own study.
Figure 13.
Wavelet Coherency of Litecoin. Source: Own study.
Figure 13.
Wavelet Coherency of Litecoin. Source: Own study.
Figure 14.
Wavelet Coherency of the XRP. Source: Own study.
Figure 14.
Wavelet Coherency of the XRP. Source: Own study.
Table 1.
Descriptive Statistics for Wide range of cryptocurrencies for two Sub period Pre-COVID19 and PostCOVID1. Source: Created by the authors using the results from the study.
Table 1.
Descriptive Statistics for Wide range of cryptocurrencies for two Sub period Pre-COVID19 and PostCOVID1. Source: Created by the authors using the results from the study.
| |
|
|
|
|
|
PostCOVID 19 |
|
|
|
|
| |
Min |
1st Qu |
Median |
Mean |
3rd Qu |
Max |
Std.Dev |
ADF |
ARCH |
Kurtosis |
Jarque-Bera |
Skewness |
| Bitcoin |
-0.46501 |
-0.00956 |
0.002541 |
0.005517 |
0.021107 |
0.165772 |
0.0443475 |
-6.4665 |
4.2657 |
47.46899 |
25688 |
-4.209104 |
| Etherum |
-0.55005 |
-0.01566 |
0.003716 |
0.005557 |
0.031471 |
0.173444 |
0.0557963 |
-6.9564 |
4.0022 |
36.58489 |
15343 |
-3.514246 |
| XRP |
-0.18286 |
-0.02135 |
-0.00348 |
-0.00272 |
0.017301 |
0.144923 |
0.0442121 |
-6.8589 |
11.458 |
3.034323 |
117.99 |
-0.5793017 |
| Litecoin |
-0.44881 |
-0.01756 |
0.002472 |
0.003328 |
0.024995 |
0.188752 |
0.0559964 |
-5.7381 |
10.752 |
16.43344 |
3144.6 |
-1.870529 |
| S.P.WORLD |
0.9814 |
0.9992 |
1.0002 |
1.0001 |
1.0014 |
1.0131 |
0.0031441 |
-5.305 |
47.666 |
9.911706 |
1200.4 |
-1.584432 |
| MSCI World |
0.9862 |
0.9994 |
1.0002 |
1.0001 |
1.001 |
1.0114 |
0.0024016 |
-5.1831 |
58.109 |
10.13762 |
1202.8 |
-1.193446 |
| DJGI World |
0.9831 |
0.9992 |
1.0002 |
1.0001 |
1.0012 |
1.014 |
0.0029072 |
-5.1918 |
54.896 |
10.7689 |
1365.6 |
-1.343664 |
| FTSE |
0.9837 |
0.9993 |
1.0002 |
1.0001 |
1.0012 |
1.0135 |
0.0028027 |
-5.178 |
56.547 |
10.47085 |
1283.6 |
-1.238498 |
| New Cases |
-4 |
-0.08855 |
0.024898 |
0.008816 |
0.121115 |
1 |
0.4144078 |
-6.5604 |
20.388 |
47.21804 |
25954 |
-5.453089 |
| New Death |
-18.6923 |
-0.06875 |
0.0303 |
-0.0454 |
0.15029 |
1 |
1.182291 |
-5.8924 |
0.045565 |
234.1049 |
615300 |
-15.0397 |
| |
|
|
|
|
PreCOVID19 |
|
|
|
|
| |
Min |
1st Qu. |
Median |
Mean |
3rd Qu |
Max. |
Std.Dev |
ADF |
ARCH |
Kurtosis |
Jarque-Bera |
Skewness |
| Bitcoin |
-0.15189 |
-0.0156 |
-0.00043 |
-0.00059 |
0.014416 |
0.160346 |
0.0375464 |
-6.2676 |
12.178 |
3.568552 |
188.37 |
0.07197 |
| Etherum |
-0.20801 |
-0.02298 |
-0.00342 |
-0.0034 |
0.016416 |
0.163395 |
0.0489513 |
-5.8646 |
10.215 |
2.886396 |
130.93 |
-0.3611 |
| XRP |
-0.20801 |
-0.02497 |
-0.00418 |
-0.00334 |
0.016215 |
0.320902 |
0.0559733 |
-5.7217 |
36.455 |
5.382889 |
448.09 |
0.60802 |
| Litecoin |
-0.18017 |
-0.0276 |
-0.00441 |
-0.00314 |
0.019769 |
0.268087 |
0.0507959 |
-6.6652 |
5.1031 |
3.989177 |
256.49 |
0.6101 |
| S.P.WORLD |
0.9953 |
0.9994 |
1.0001 |
1 |
1.0008 |
1.0047 |
0.0012338 |
-5.6772 |
11.7 |
1.523063 |
42.086 |
-0.3558 |
| MSCI World |
0.9968 |
0.9996 |
1.0001 |
1 |
1.0006 |
1.0041 |
0.0009713 |
-6.0166 |
13.805 |
2.100639 |
73.544 |
-0.3689 |
| DJGI World |
0.9958 |
0.9994 |
1.0001 |
1 |
1.0008 |
1.0044 |
0.001187 |
-5.8146 |
15.708 |
1.630829 |
48.419 |
-0.386 |
| FTSE |
0.9961 |
0.9995 |
1.0001 |
1 |
1.0007 |
1.0044 |
0.0011292 |
-5.9367 |
14.882 |
1.836789 |
59.842 |
-0.4049 |
Table 2.
Correlation Matrix for the dataset before and during the Pandemic. Source: Created by the authors using the results from the study.
Table 2.
Correlation Matrix for the dataset before and during the Pandemic. Source: Created by the authors using the results from the study.
| |
Bitcoin |
Etherum |
XRP |
Litecoin |
S.P.WORLD |
MSCI.WORLD |
DJGL.WORLD |
FTSE.WORLD |
New_cases |
New_deaths |
| Post-COVID19 Period |
|
|
|
|
|
|
|
|
|
| Bitcoin |
1 |
|
|
|
|
|
|
|
|
|
| Etherum |
0.883493 |
1 |
|
|
|
|
|
|
|
|
| XRP |
0.064332 |
0.046643 |
1 |
|
|
|
|
|
|
|
| Litecoin |
0.861134 |
0.877619 |
0.019993 |
1 |
|
|
|
|
|
|
| S.P.WORLD |
0.426971 |
0.423789 |
0.00751 |
0.388062 |
1 |
|
|
|
|
|
| MSCI.WORLD |
0.455064 |
0.460891 |
0.041583 |
0.414247 |
0.957017 |
1 |
|
|
|
|
| DJGL.WORLD |
0.443168 |
0.44521 |
0.037213 |
0.401393 |
0.963749 |
0.995357 |
1 |
|
|
|
| FTSE.WORLD |
0.449002 |
0.453422 |
0.039509 |
0.40801 |
0.9593 |
0.998819 |
0.998447 |
1 |
|
|
| New_cases |
-0.05863 |
-0.09355 |
-0.08028 |
-0.0815 |
-0.04021 |
-0.01987 |
0.02694 |
0.023522 |
1 |
|
| New_deaths |
-0.00481 |
-0.05454 |
-0.00942 |
-0.03038 |
-0.01851 |
-0.01665 |
-0.01704 |
-0.01679 |
0.439601 |
1 |
| Pre-COVID19 Period |
|
|
|
|
|
|
|
|
|
| |
Bitcoin |
Etherum |
XRP |
Litecoin |
S.P.WORLD |
MSCI.WORLD |
DJGL.WORLD |
FTSE.WORLD |
|
| Bitcoin |
1 |
|
|
|
|
|
|
|
|
|
| Etherum |
0.835839 |
1 |
|
|
|
|
|
|
|
|
| XRP |
0.484652 |
0.60349 |
1 |
|
|
|
|
|
|
|
| Litecoin |
0.786054 |
0.850677 |
0.531003 |
1 |
|
|
|
|
|
|
| S.P.WORLD |
0.003792 |
0.070417 |
0.058606 |
0.068761 |
1 |
|
|
|
|
|
| MSCI.WORLD |
0.02 |
0.084639 |
0.080901 |
0.080296 |
0.945489 |
1 |
|
|
|
|
| DJGL.WORLD |
0.015258 |
0.085993 |
0.088233 |
0.084059 |
0.950479 |
0.992395 |
1 |
|
|
|
| FTSE.WORLD |
0.016718 |
0.084669 |
0.085083 |
0.080798 |
0.944955 |
0.99756 |
0.997642 |
1 |
|
|
Table 3.
estimation of multivariate VAR-DCC-GARCH model for Bitcoin, Etherum, XRP, and Litecoin result. Source: Created by the authors using the results from the study.
Table 3.
estimation of multivariate VAR-DCC-GARCH model for Bitcoin, Etherum, XRP, and Litecoin result. Source: Created by the authors using the results from the study.
| |
|
Bitcoin |
|
|
XRP |
|
|
Litecoin |
|
|
Etherum |
|
| |
|
Coef |
P-value |
|
Coef |
P-value |
|
Coef |
P-value |
|
Coef |
P-value |
| |
Ω |
-0.52586 |
0 |
|
-3.22211 |
0.007693 |
|
-0.22798 |
0.381499 |
|
-4.51815 |
0 |
| |
α1 |
-0.17198 |
0.047393 |
|
-0.08772 |
0.375392 |
|
-0.12324 |
0.144265 |
|
-0.52469 |
0.036697 |
| |
β1 |
0.915766 |
0 |
|
0.484252 |
0.013249 |
|
0.956034 |
0 |
|
0.22703 |
0.070032 |
| |
γ1 |
-0.05055 |
0.365184 |
|
0.349759 |
0.012725 |
|
0.176618 |
0.000037 |
|
-0.07059 |
0.699011 |
| S.P.WORLDHEDGED |
Ω |
-0.0374 |
0.995407 |
|
-0.0374 |
0.997661 |
|
-0.0374 |
0.996114 |
|
-0.0374 |
0.996664 |
| |
α1 |
0.017747 |
0.99775 |
|
0.017747 |
0.998205 |
|
0.017747 |
0.99916 |
|
0.017747 |
0.989101 |
| |
β1 |
0.899893 |
0.023568 |
|
0.899893 |
0.068088 |
|
0.899893 |
0.375215 |
|
0.899893 |
0.000033 |
| |
γ1 |
0.097332 |
0.981782 |
|
0.097332 |
0.994983 |
|
0.097332 |
0.994247 |
|
0.097332 |
0.99412 |
| MSCI.WORLD |
Ω |
-0.03728 |
0.998812 |
|
-0.03728 |
0.998742 |
|
-0.03728 |
0.99884 |
|
-0.03728 |
0.998888 |
| |
α1 |
0.01765 |
0.999579 |
|
0.01765 |
0.999603 |
|
0.01765 |
0.999572 |
|
0.01765 |
0.99957 |
| |
β1 |
0.899774 |
0.912719 |
|
0.899774 |
0.912103 |
|
0.899774 |
0.90717 |
|
0.899774 |
0.911331 |
| |
γ1 |
0.097177 |
0.999106 |
|
0.097177 |
0.999336 |
|
0.097177 |
0.999441 |
|
0.097177 |
0.999346 |
| DJGL.WORLD |
Ω |
-0.03731 |
0.999684 |
|
-0.03731 |
0.999701 |
|
-0.03731 |
0.999706 |
|
-0.03731 |
0.999707 |
| |
α1 |
0.017689 |
0.999757 |
|
0.017689 |
0.999768 |
|
0.017689 |
0.999759 |
|
0.017689 |
0.999772 |
| |
β1 |
0.899782 |
0.919964 |
|
0.899782 |
0.923039 |
|
0.899782 |
0.910583 |
|
0.899774 |
0.924402 |
| |
γ1 |
0.097156 |
0.999542 |
|
0.097156 |
0.999584 |
|
0.097156 |
0.999645 |
|
0.097177 |
0.999589 |
| FTSE.WORLD |
Ω |
-0.03724 |
0.999742 |
|
-0.03724 |
0.999759 |
|
-0.03724 |
0.999759 |
|
-0.03724 |
0.999761 |
| |
α1 |
0.017635 |
0.99975 |
|
0.017635 |
0.999776 |
|
0.017635 |
0.999757 |
|
0.017635 |
0.999777 |
| |
β1 |
0.89973 |
0.927756 |
|
0.89973 |
0.930147 |
|
0.89973 |
0.923175 |
|
0.89973 |
0.930425 |
| |
γ1 |
0.097097 |
0.999635 |
|
0.097097 |
0.999676 |
|
0.097097 |
0.99973 |
|
0.097097 |
0.999681 |
| COVID19.Newdeaths |
Ω |
-5.83138 |
0.753238 |
|
-5.6716 |
0.940932 |
|
-5.60113 |
0.199372 |
|
-0.06556 |
0.743953 |
| |
α1 |
0.137591 |
0.917836 |
|
0.133544 |
0.946303 |
|
0.150849 |
0.753658 |
|
0.307361 |
0.103186 |
| |
β1 |
-0.94645 |
0.000022 |
|
-0.9463 |
0.293071 |
|
-0.9478 |
0 |
|
0.981452 |
0 |
| |
γ1 |
0.183189 |
0.52905 |
|
0.174444 |
0.924285 |
|
0.193237 |
0.383799 |
|
0.642266 |
0.01413 |
| COVID19.Newcases |
Ω |
-0.06556 |
0.744478 |
|
-0.06556 |
0.744048 |
|
-0.06556 |
0.744825 |
|
-5.89528 |
0.403812 |
| |
α1 |
0.307361 |
0.098156 |
|
0.307361 |
0.089505 |
|
0.307361 |
0.097531 |
|
0.168446 |
0.46136 |
| |
β1 |
0.981452 |
0 |
|
0.981452 |
0 |
|
0.981452 |
0 |
|
-0.9495 |
0.310167 |
| |
γ1 |
0.642266 |
0.0149 |
|
0.642266 |
0.016071 |
|
0.642266 |
0.015339 |
|
0.218242 |
0.395469 |
| DCCa1 |
|
0.017356 |
0.355255 |
|
0.018425 |
0.592009 |
|
0.018654 |
0.431299 |
|
0.017826 |
0.950745 |
| DCCb1 |
|
0.982644 |
0 |
|
0.981575 |
0 |
|
0.981346 |
0 |
|
0.982174 |
0 |
|
Disclaimer/Publisher’s Note: The statements, opinions and data contained in all publications are solely those of the individual author(s) and contributor(s) and not of MDPI and/or the editor(s). MDPI and/or the editor(s) disclaim responsibility for any injury to people or property resulting from any ideas, methods, instructions or products referred to in the content. |
© 2023 by the authors. Licensee MDPI, Basel, Switzerland. This article is an open access article distributed under the terms and conditions of the Creative Commons Attribution (CC BY) license (http://creativecommons.org/licenses/by/4.0/).

 and
and  indicate that both Bitcoin and the growth rate of COVID19 New death rate are in phase and out of phase, respectively.
 And
And  indicate Bitcoin returns are leading those of the growth rate of the COVID19 new death rate, while
  and
and  indicate Bitcoin returns are lagging those the growth rate of the COVID19 new death rate.
  all stock markets which means that the Bitcoin are lagging those commodities as well as the COVID 19 pandemic. We obseve a high degree of co-movement between Bitcoin and the stocks at the scale of 128 days frequencies for the first three months for the case of all stocks except the S&P who was keeping a high significant co-movement in the long run. The low frequencies and high power of coherence in the co-movement signals implies higher return from the diversification of the portfolio in short horizon. A powerful co-movement at high frequencies suggests higher diversification levels in the long-run horizon. We find a low frequency and insignificant co-movement in the second half of the period for the case of stocks as well as COVID19 indicators. The causality and phase difference of Bitcoin with stocks is concluded through the arrow point
  at the scale ranging from 64 to 256 days which means phase in relationship, indicating the positive correlation between the Bitcoin and the stock market. We observe the arrow
  , the first half period, ranging in scale from 8 to 64 days which means that the Bitcoin lead the stocks market in the short run during the COVID 19 crisis and after that it becomes a positive relationship of causality. As we observe through the figure that the increasing rate of death was associated with a decrease in the value of Bitcoin in short term, within the first three months of the period, with high scale of 64 days reaching after that term a low coherency for the next nine months. The phase difference and causality for the COVID 19 death and the COVID 19 New cases and Bitcoin. We see, the main significant period of coherence is from January to March, the first three months, with scale ranging between 0.5 a d 75 days , that arrows are in majority
  and
and  , which means that the BITCOIN and the COVID19 indicators are an out-phase relationship and the COVID 19 indicators are leading the value of the Bitcoin. The Bitcoin is the biggest cryptocurrencies in terms of capitalisation, and it has unprecedented interaction towards the COVID 19 shock in short run followed by a recuperation in terms of value and size in the middle and long run. The most general color in Wavelet coherency for Bitcoin case with stocks as well as COVID 19 indicators is Red with different scale range in the short and long term, which means that the Bitcoin is correlated with stocks and the COVID 19 indicators. Economically the Bitcoin were influenced positively in terms of value within the shock of COVID 19 in the short term, and the shock were assimilated within the long horizon with less influence on the stability of the value of the Bitcoin. Most of the significant parts are in the cone of influence which means that there is a significant connection between the Bitcoin and the stocks as well as the Bitcoin and the COVID 19 indicators. Therefore, Bitcoin is considered as strong safe haven asset from the perspective of Wavelet Coherency for the whole period and all analysed stocks within the COVID19 frame crisis.