Introduction
Esophageal cancer is the eighth most common type of cancer and the sixth primary cause of tumor-related deaths all over the world. More than 50% of the newly diagnosed esophageal carcinoma cases occur in China, and esophageal squamous cell carcinoma (ESCC) is the major histological subtype (more than 90%) [
1,
2]. A limited lymphadenectomy may make patients who received esophagectomy for ESCC at risk for missing occult nodal disease. Some previous researches had identified that occult lymph node metastasis directly influences the long-term prognosis of esophageal cancer. Inaccurate follow-up recommendations and adjuvant treatment caused by staging bias could be one important reason [
3,
4]. So high-quality lymphadenectomy is very necessary for patients with esophageal carcinoma. However, some studies provided different optimal or minimum threshold values (ranging from 14 to 30) for lymph nodes (LNs) harvested for esophageal carcinoma [
5,
6,
7,
8,
9,
10]. Besides, the minimum number of LNs examined offered in the existing guidelines is also variable. The current National Comprehensive Cancer Network (NCCN) guideline recommends examining at least 15 LNs to acquire adequate staging. And the American Society of Clinical Oncology (ASCO) advises surgeons to perform adequate nodal dissection with at least 16 to 18 LNs. Meanwhile, existing guidelines (NCCN or ASCO) did not suggest any postoperative therapy for ESCC patients without neoadjuvant therapy who had received complete resection (R0) regardless of pathological N stage [
11,
12]. But given the probability of missing occult nodal disease, even for pN0 patients, the decision-making of postoperative treatment should be more carefully considered.
Therefore, this study aimed to determine an effective threshold of lymph nodes for evaluation of the quality of lymphadenectomy and explore the effect of adjuvant chemotherapy on pN0 patients.
Methods
Patients
The requirement for informed consent was waived on account of anonymous data. Patients who underwent esophagectomy with ESCC in Sichuan Cancer Hospital between 2010 and 2018 were included. Patients with preoperative chemo/radiotherapy, visceral metastasis, other carcinomas and incomplete resection had been excluded. These remaining patients were selected to create our mathematical model. To further explore the influence of postoperative chemotherapy for pN0 patients, the small number of patients who received postoperative radiotherapy, chemoradiotherapy or unknown treatment were excluded. The remaining pN0 patients were divided into surgery alone (S) and postoperative chemotherapy (POCT) groups and propensity-score matching (PSM) was used to reduce selection bias between the two groups. One-to-one matching without replacement was employed with a caliper width of 0.01. This retrospective study was reviewed by the Ethics Committee (EC) for Medical Research and New Medical Technology of Sichuan Cancer Hospital (SCCHEC-02-2022-050).
Model Development
In this study, we adopted a previously described mathematical model using the beta-binomial distribution to estimate the negative predictive value as a function of number of LNs examined and our method had slight differences (detailed explanations are listed in the supplementary materials). This algorithm has already been used for other types of cancer widely to assess adequate staging of node-negative disease [
13,
14,
15,
16].
We simply summarized the method into the following three steps. The equations use the abbreviations: , probability; , false-negative; , true-negative; , true-positive;, number of LNs examined; Prev, prevalence; , beta function.
A beta-binomial model was fitted among the cohort of node-positive patients first. The shape parameters (
and
) within the beta function were estimated with a maximum likelihood approach. Less than 10% of omission rate of positive LNs is considered acceptable. Then, for each possible number of LNs examined (
), the probability of false-negative findings for a patient with true node-positive disease can be expressed as:
- 2.
Estimate the true-positive node disease prevalence.
The observed prevalence is commonly underestimated and needs to be adjusted for false-negative findings. The number of false-negative patients (
) was calculated at each value of m as follows first:
presents the number of true positives for a given
. Then, the adjusted prevalence was estimated by averaging over
:
- 3.
Negative Predictive Value (NPV).
NPV is the probability that a pathologically node-negative patient is indeed free of nodal disease and following is the calculation formula:
Follow-up and Statistical Analysis
Overall survival (OS) was measured from the date of surgery to the date of death or last follow-up and censored at the last contact date in surviving patients. Disease-free survival (DFS) was measured from the date of surgery to the date of first evidence of relapse or death for any cause, whichever was observed first. Local recurrence was defined as recurrence in the supraclavicular, mediastinal, and peritoneal regions. Distant metastasis was defined as recurrence elsewhere.
OS and DFS curves were plotted by the Kaplan-Meier method and compared by the log-rank test. A Cox regression model with stepwise selection was used for univariate and multivariate analyses.
p < 0.05 were regarded as statistically significant. The characteristics with
p < 0.05 on univariate analysis were selected for multivariate analysis. X
2 test is used for categorical variables. All tests of statistical significance were 2-sided. MATLAB R2022b (
https://matlab.mathworks.com/) was used to fit the beta-binomial model, and R version 4.2.1 (
https://www.r-project.org/) was carried out with statistical analyses.
Results
Patient Characteristics
A total of 2722 patients with ESCC were included and divided into pN0 (n = 1261) and pN+ (n = 1461) groups to develop our mathematical model (
Table 1). Of these, pN+ patients were analyzed to get probabilities of false-negative disease as a function of the number of LNs resected. The remaining pN0 patients were enrolled to estimate the adjusted prevalence of the true positive disease. The incorporated patients comprised 12.6% pT1, 16.7% pT2, 61.6% pT3 and 9.1% pT4. The median number of LNs resected for all involved patients was 20 (interquartile range 14-28).
Probability of False-negatives and NPV
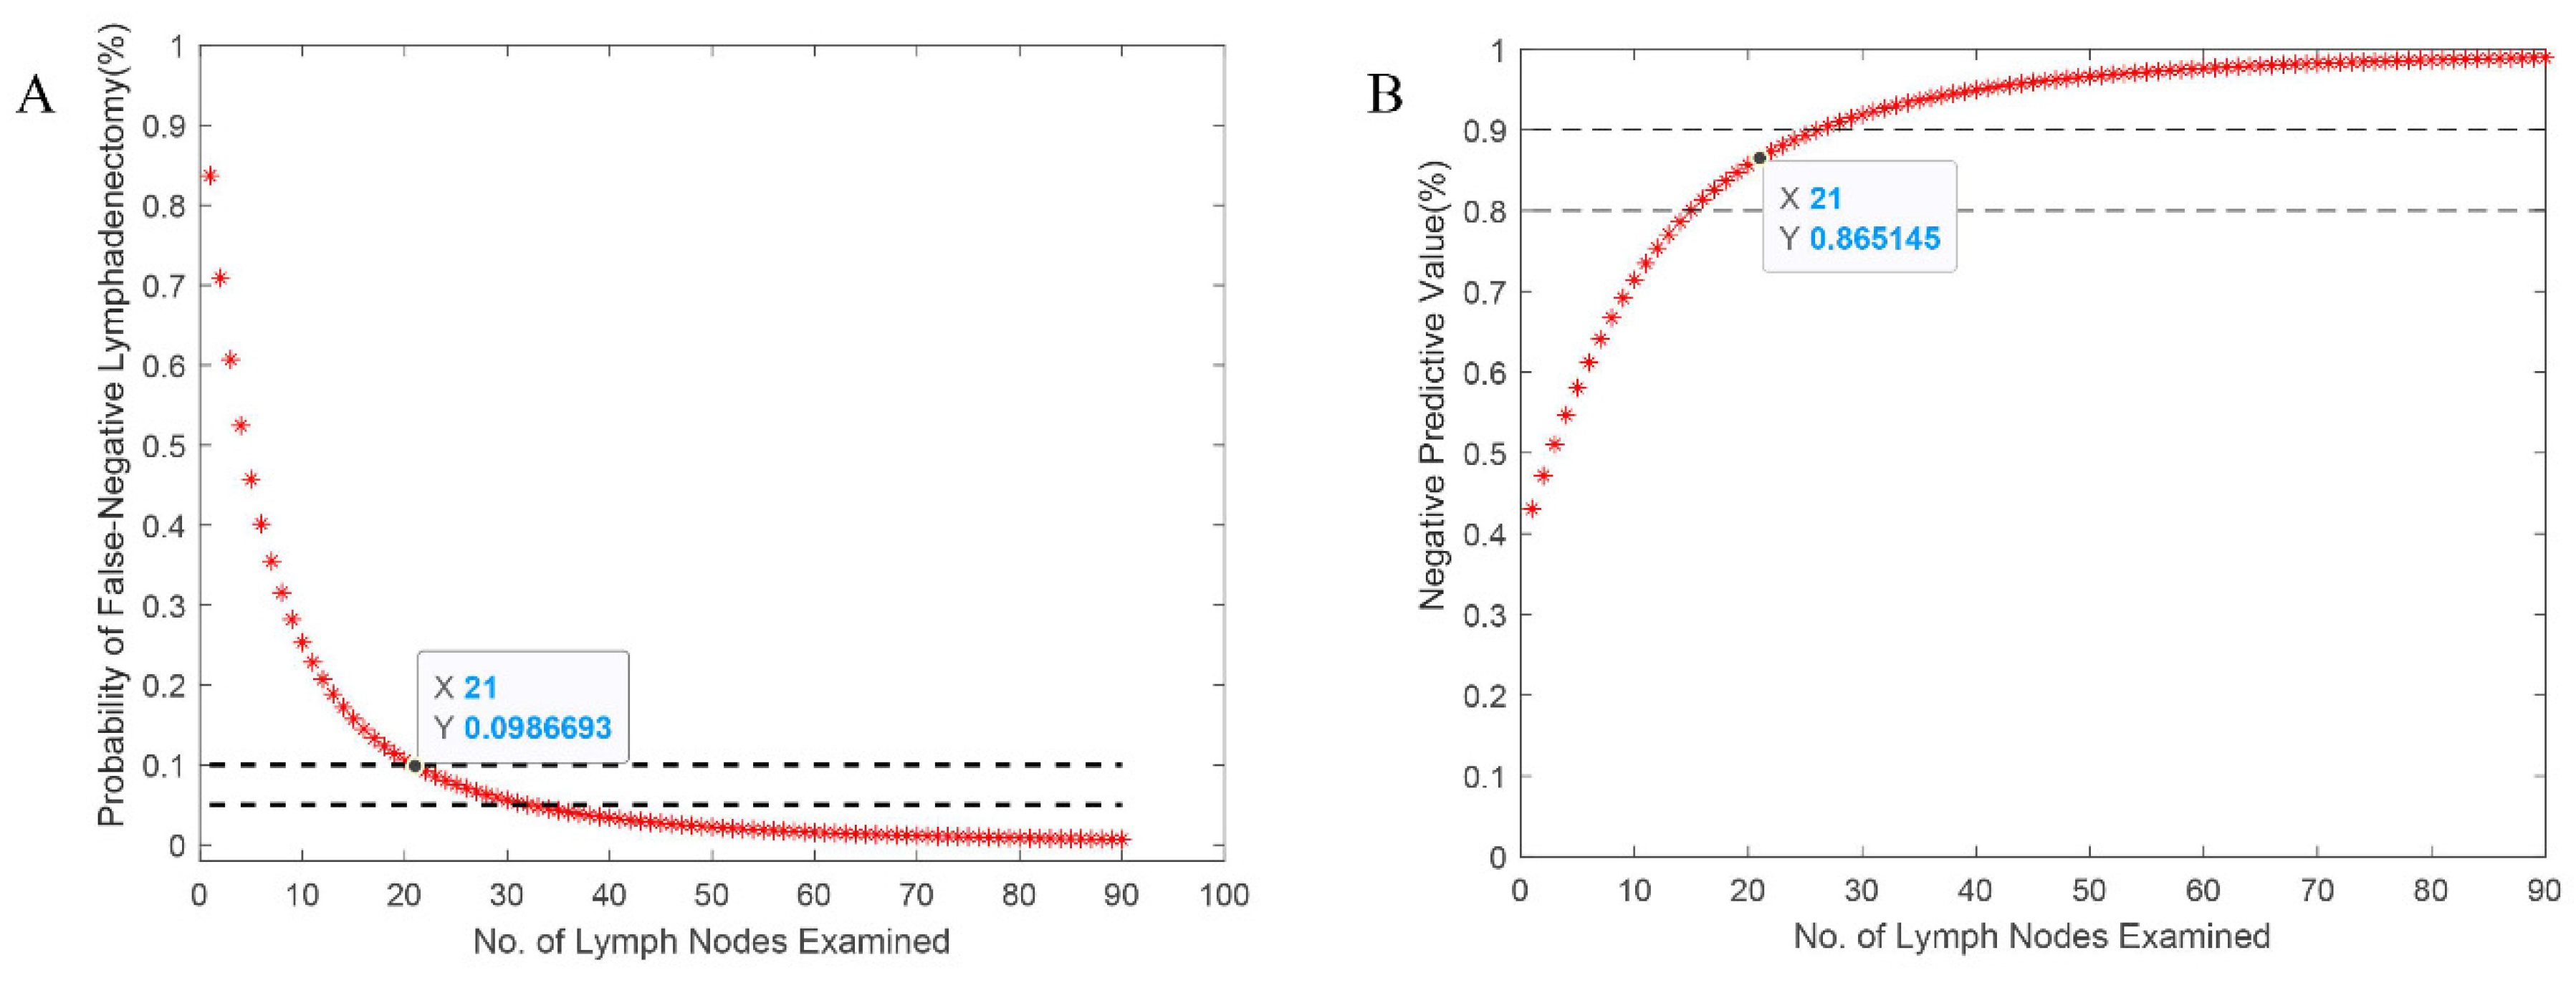
The distribution of the proportion of lymph node metastasis among entire pN+ patients was fit a β-binomial distribution with resulting model parameters of α = 2.423 (95% CI, 1.881 to 3.120) and β = 12.425 (95% CI, 9.315 to 16.574). The probability of false-negative nodes and the NPV estimated were plotted in
Figure 1. As expected,
decreased as the number of LNs examined increased, and the NPV increased as the counts increased. The probability of false-negative findings was calculated as less than 10% for 21 LNs examined. And the corresponding NPV was estimated at more than 86.5% for pN0 patients with 21 LNs examined. The apparent prevalence of the nodal disease is 53.7%, but accounting for potential false-negatives, the corrected prevalence is 61.2%.
Influence of Postoperative Chemotherapy for Prognosis
After excluding the small number of pN0 patients (n = 91) who received postoperative radiotherapy, chemoradiotherapy or unknown treatment, the remaining 1170 patients were divided into surgery alone (S) and postoperative chemotherapy (POCT) groups and propensity-score matching was used to reduce selection bias between the two groups. Finally, 682 pN0 patients were selected for further analysis. There was an expected balance of covariates in the two groups (
Table 4). The reason why T stage cannot be balanced may be that tumor infiltration depth itself is one of the indicators for the selection of adjuvant chemotherapy in actual clinical practice.
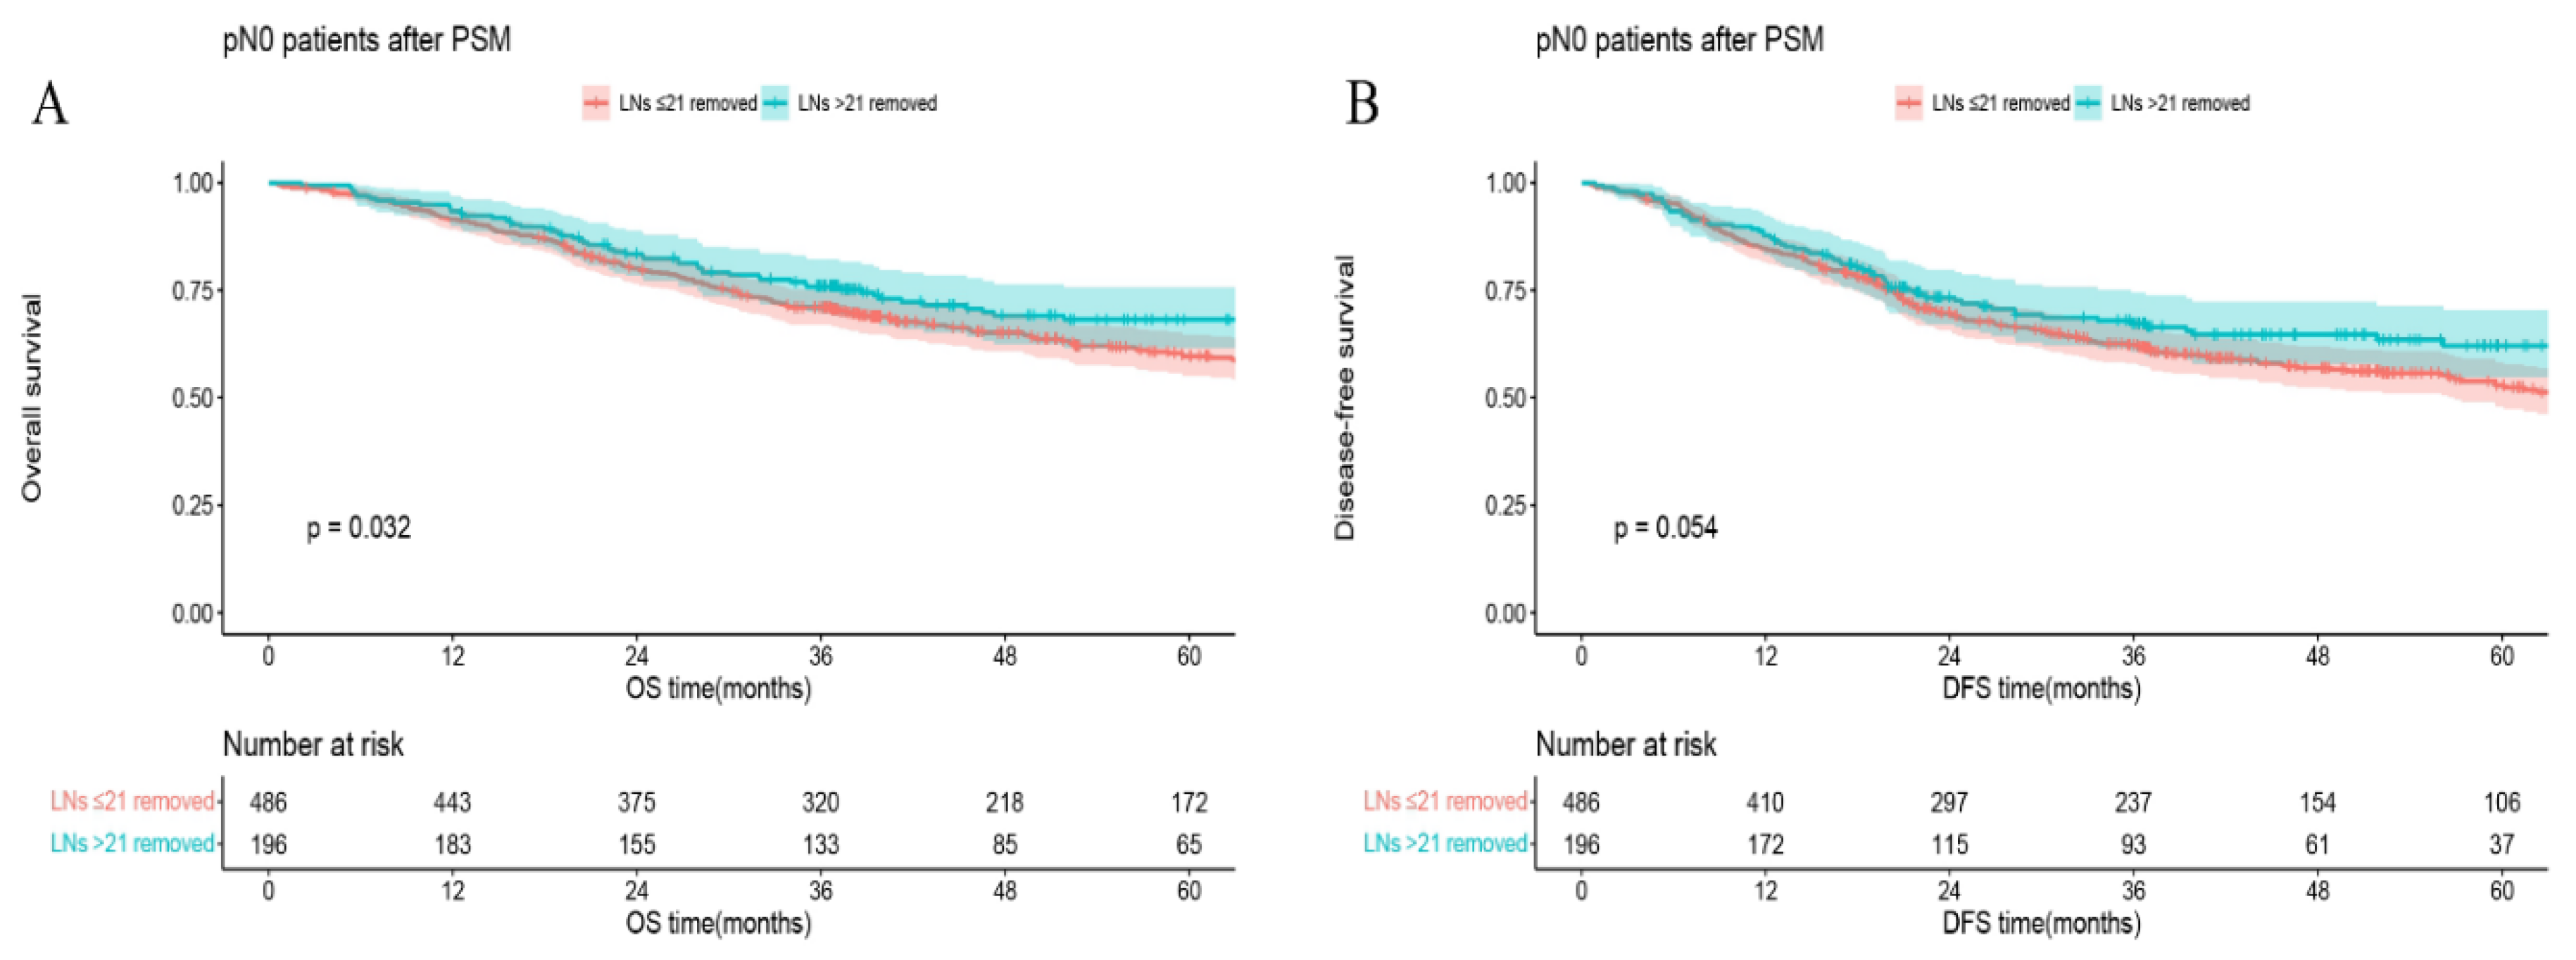
In all matched pN0 patients, 5-year OS (or DFS) in the group of LNs examined >21 vs that in the group of LNs examined ≤21 was 68.2% vs 59.7%,
p = 0.032 (or 62.1% vs 52.9%,
p = 0.054) (
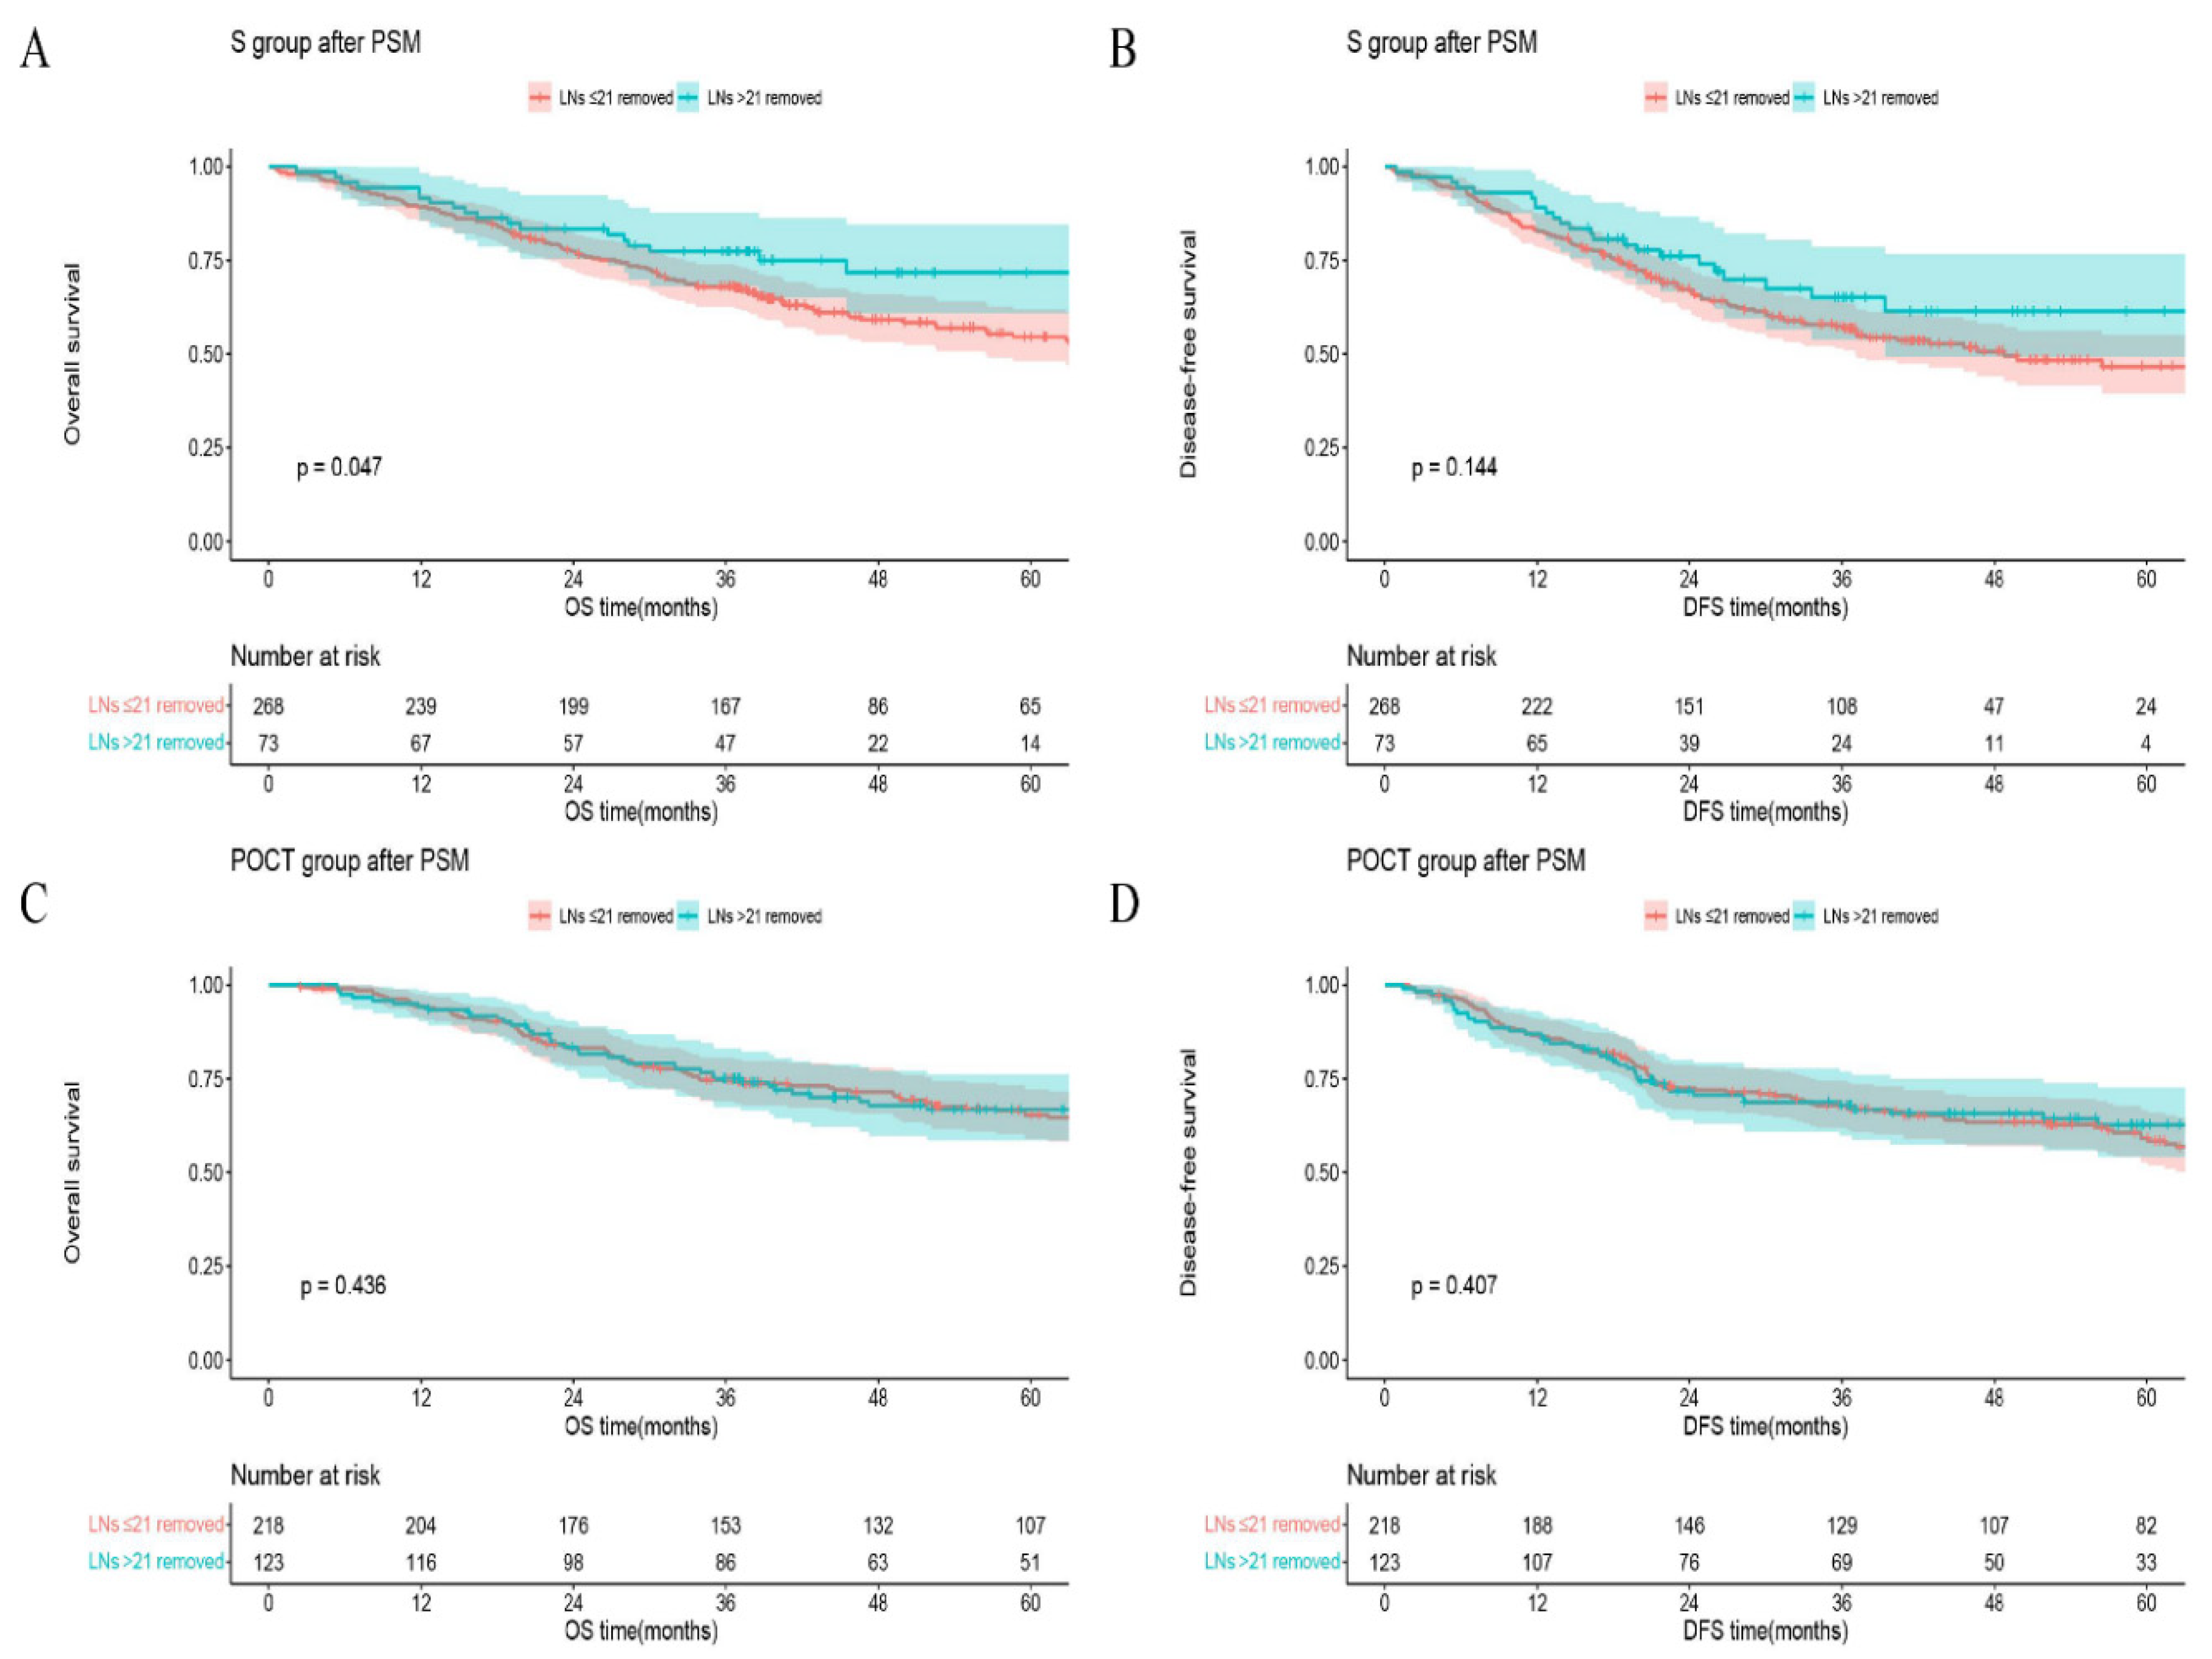
Figure 3). In the S group, 5-year OS (or DFS) in the group of LNs removed >21 vs that in the group of LNs ≤21 was 71.8% vs 54.6%,
p = 0.047 (or 61.4% vs 46.6%,
p = 0.144;
Figure 4A, B), respectively. However, in the POCT group, the curves crossed each other regardless of whether the number of LNs removed was more or less than 21 (
p = 0.436 for OS or
p = 0.407 for DFS;
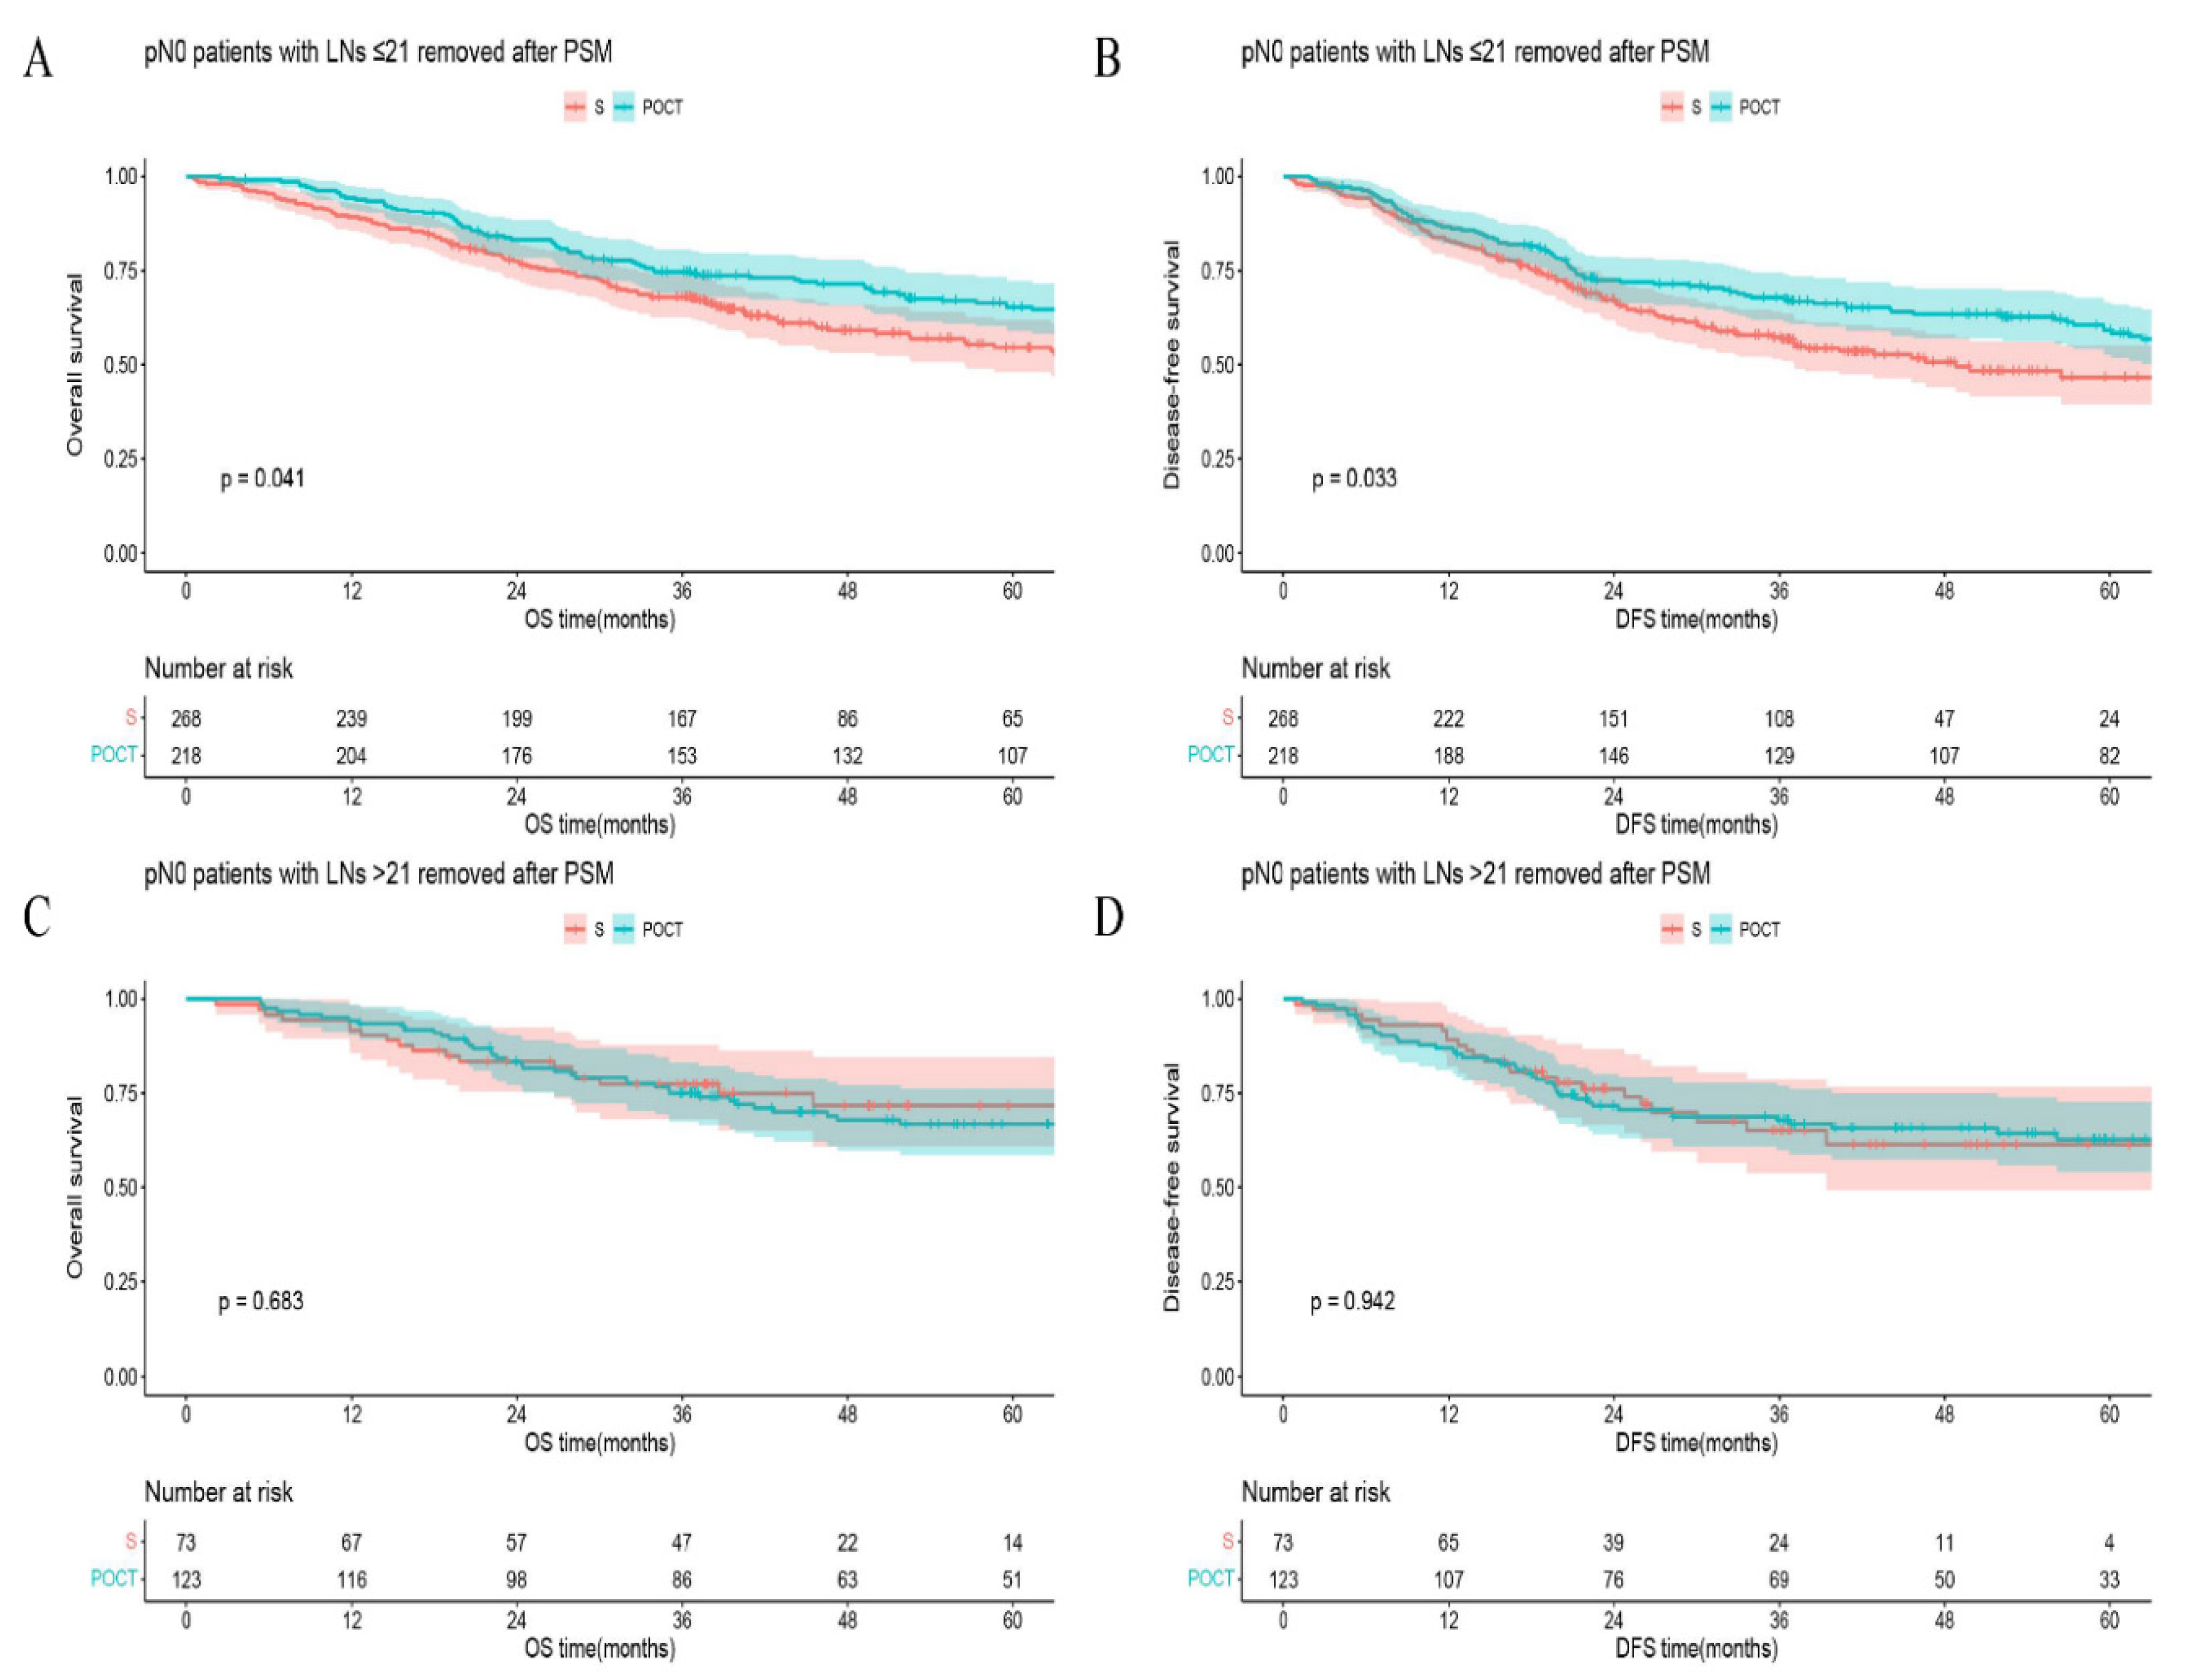
Figure 4C, D). Furthermore, in the subgroup of LNs removed ≤21, 5-year OS (or DFS) in the POCT group vs that in the S group was 65.3% vs 54.6%,
p = 0.041 (or 59.2% vs 46.6%,
p = 0.033;
Figure 5A, B). But for patients with >21 LNs resected, the curves overlapped on OS or DFS between S and POCT groups (
p = 0.683 for OS or
p = 0.942 for DFS;
Figure 5C, D).
Discussion
As many studies claimed, occult lymph node metastasis has a significantly detrimental influence on prognosis in node-negative esophagus cancer patients [
3,
7,
8]. An adequate lymph node examination is crucially necessary to diminish the risk of omission node-positive disease. The number of lymph node dissection might impact patients on accurate staging, prognostic prediction and postoperative treatment.
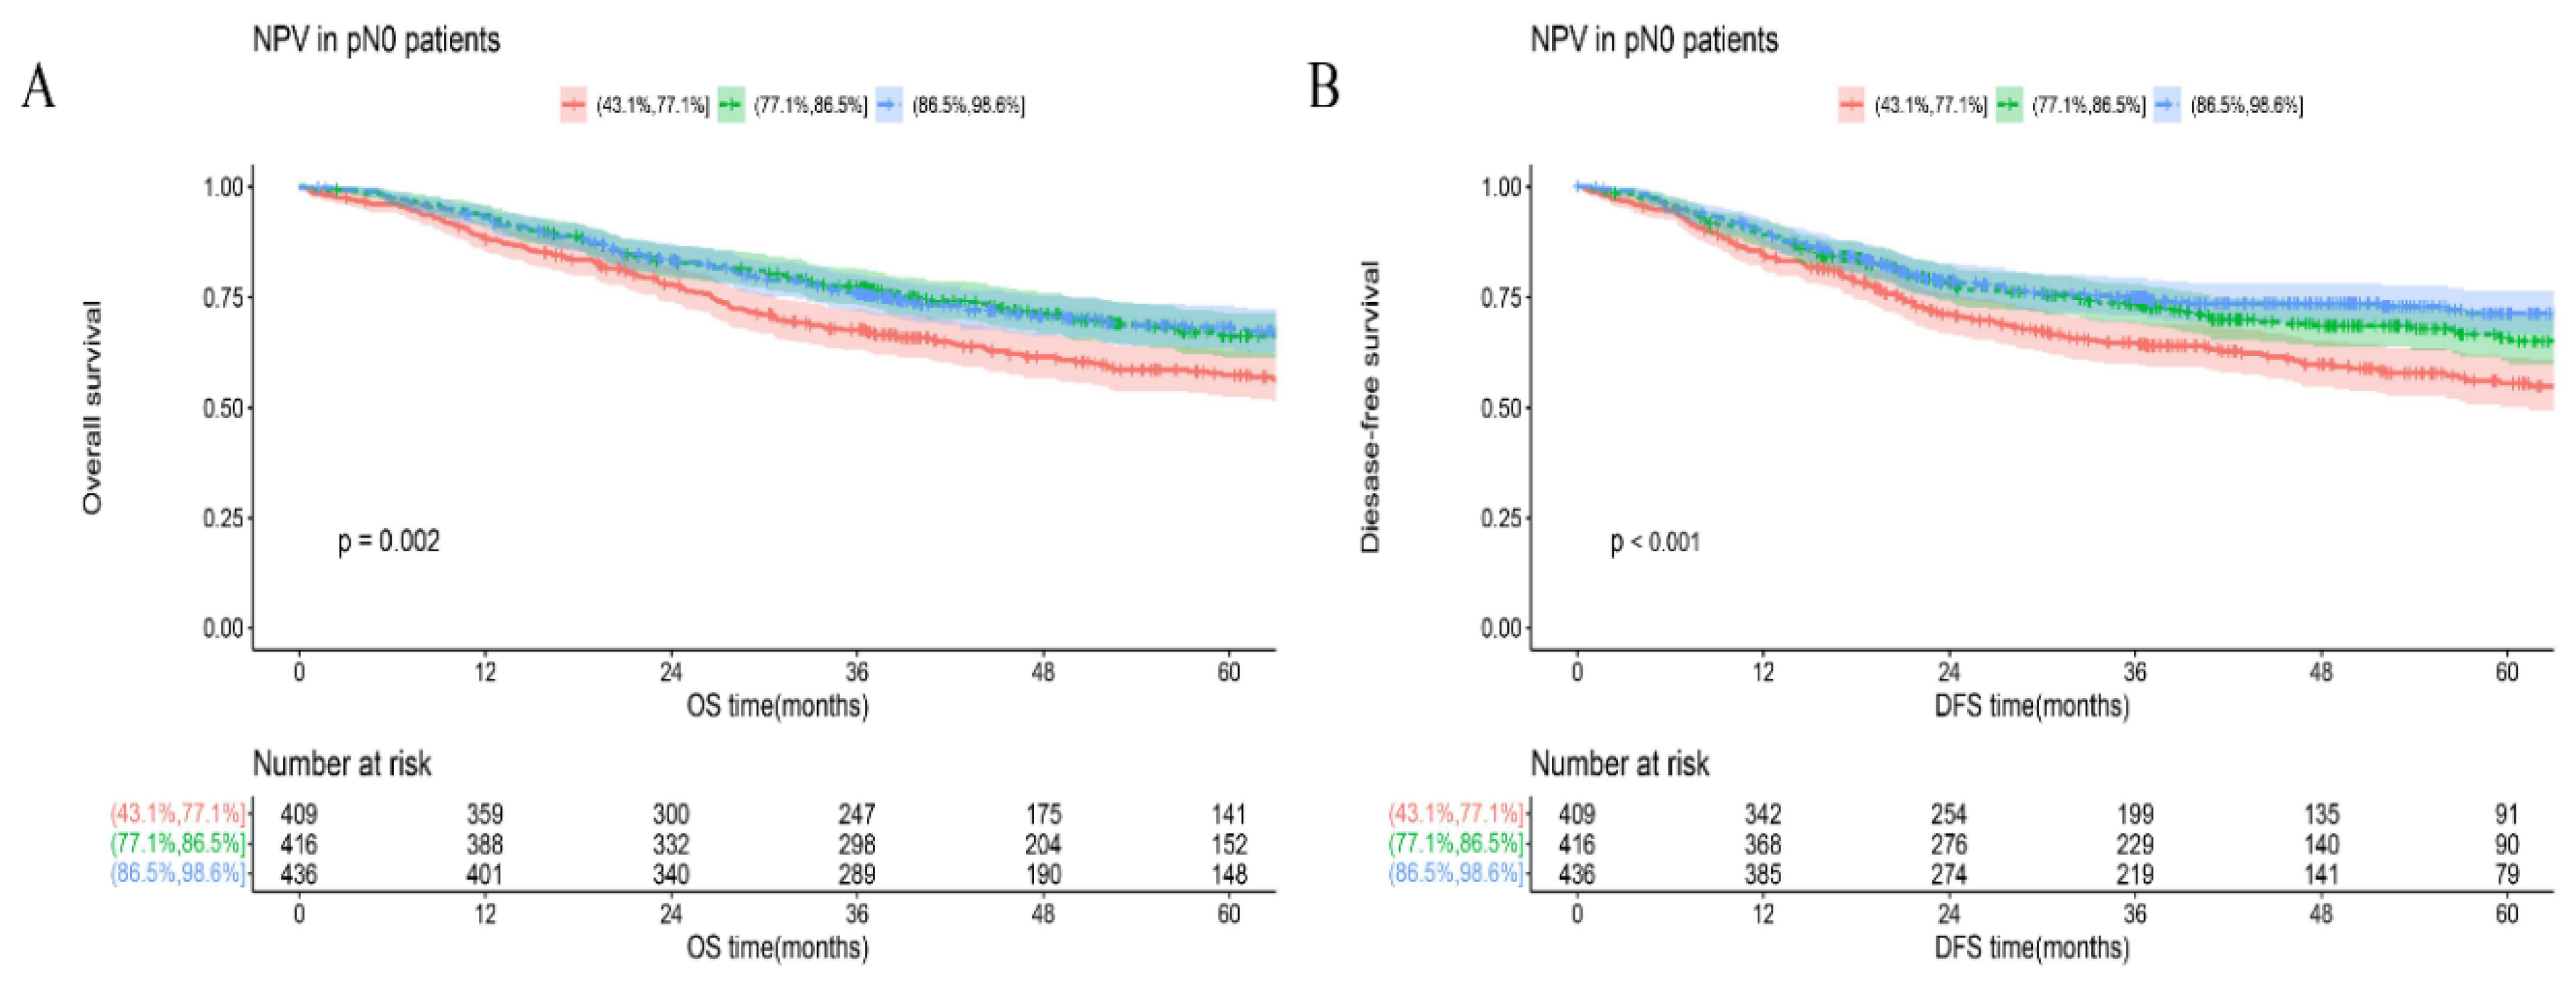
We created a visualized model based on a beta-binomial distribution to estimate the risk for occult lymph node metastasis and verified the validity precisely. When the minimal false-negative disease probability was less than 10%, we must harvest at least 21 LNs. Correspondingly, pN0 patients with >21 LNs examined (86.5%< NPV ≤98.5%) could get better long-term outcomes (
Figure 2). On this standard, we reviewed the distribution of examined LNs count (the median was 20) and inferred more than 50% of patients from our data had received a limited lymphadenectomy. The nodal disease rate of ESCC was 42.2-51.2% in previous researches [
11,
17,
18,
19]. Our apparent prevalence of the nodal disease is 53.7%, and the corrected prevalence is 61.2% after accounting for missing potential positive cases. Nearly 7.5% of patients had underestimated N stages. Because of the huge base of esophageal cancer patients worldwide, quite a lot of patients actually underwent unradical surgery on oncology. In reality, the proportion could be higher because of the different quality of esophagectomy in various medical centers, particularly somewhere lack of abundant experience. Apparently, this consequence is deeply unacceptable by either the clinical physician or the patient.
Our tool has preliminarily demonstrated that the more extensive lymphadenectomy could improve prognosis effectively. NPV was an independent prognostic factor and higher NPV corresponded to better OS or DFS. Several possible underlying reasons exist for this difference in survival or relapse. First of all, staging bias results in prognosis differences directly. Patients with enough LNs examined were estimated at low risk of occult lymph node metastasis and would naturally get better long-term outcomes. Second, staging correction led to the proper delivery of postoperative therapy [
20,
21]. To explore the influence of postoperative chemotherapy, we chose 21 LNs as the threshold for further analysis (NPV of patients with >21 LNs examined were relatively high). Roughly, pN0 patients with >21 LNs resected derived a definite benefit on both OS and DFS (Figure3). But in the subgroups, this benefit seemly only existed in S group (
Figure 4). In
Figure 5A, B, postoperative chemotherapy would bring an appreciable positive impact on patients who were at high risk of occult lymph node metastasis (examined LNs ≤21) even though the tumor was completely resected (R0) and the pathological lymph nodes were declared negative (pN0). The improved survival may be the result of chemotherapy curing potential micrometastases caused by limited lymphadenectomy. Following this logic, the postoperative chemotherapy for pN0 patients who received relatively adequate lymphadenectomy (examined LNs >21) is naturally ineffective (
Figure 5C, D). The findings are also powerful proof of the effectiveness of our mathematical model simultaneously. Several studies had shown that ESCC patients who received either postoperative chemotherapy or radiotherapy could have better OS or DFS than surgery alone [
20,
21,
22,
23], especially cohort with lymph node metastasis. Our results support this claim in a different way that adjuvant chemotherapy is effective for false negative patients. Clinicians perhaps ought to make more active treatment decisions for patients with high risk of occult lymph node metastasis. Most studies [
5,
6,
7,
8,
9,
10] suggested the optimal number of lymph nodes based on seeking a threshold for maximizes the prognostic discrimination between the resulting groups. Compared with those, the work we did were remarkably different, our model achieves the visualization of risk of occult lymph node metastasis first and then we prove its effectiveness powerfully with survival outcomes. Note, our study proposed an effective threshold rather than an optimal value.
However, existing international guidelines (NCCN or ASCO) did not suggest any adjuvant therapy for all ESCC patients without neoadjuvant treatment as long as the tumor was completely resected. In consideration of occult nodal disease, only follow-up for pN0 patients could still be not appropriate, especially someone with inadequate lymphadenectomy. Meanwhile, it is equally important to avoid overtreatment or missing patients at high risk of death. Our tool could help clinicians identify patients with poor prognosis and provide adjuvant treatment recommendations in a more accurate, logical and convincing way.
In brief, lymphadenectomy locates in the crucial status on surgical treatment of esophageal carcinoma, and occult lymph node metastasis after operation is easy to be ignored. The more examined lymph nodes cause the lesser occult lymph node metastasis and greater outcome. But in the actual clinical work, the quality of lymphadenectomy varies greatly among different medical centers, a significant number of patients with potential nodal disease may be omitted. And considering the disparate experience in lymphadenectomy for different pathological types (squamous cell carcinoma or adenocarcinoma), we believe our conclusions have a more generalized significance in China where squamous cell carcinoma is the majority. The main purpose of this article is to call on surgeons to pay more attention on occult lymph node metastasis caused by limited lymphadenectomy and consider more on postoperative treatment decision. With more nodes examined and more detailed data in the future, our results could be confirmed and updated furtherly.
This research has some limitations. First, this was a retrospective analysis based on a single-institutional database. Second, some confounding factors could make the records of LN counts inaccurate, including difficulty in separating each node in the excised tissues and the fragmentation of lymph node tissue during the dissection. Finally, the study did not include patients who received preoperative therapy. Because preoperative chemo/radiotherapy commonly causes a shrinkage of lymph nodes [
24], and the impact of LNs examined on resected ESCC might be different compared to those who did not receive preoperative therapy.
Conclusions
Our study recommends 21 lymph nodes examined as an effective threshold for evaluation of the quality of lymphadenectomy for patients with declared node-negative esophageal squamous cell carcinoma. Patients with higher negative predictive value could get better long-term outcomes. Postoperative chemotherapy could bring an appreciable benefit for pN0 patients who were at high risk of occult lymph node metastasis (examined LNs ≤21), but it might be ineffective for patients with a relatively adequate lymph node examination (examined LNs >21).
Author Contributions
Zhiyu Li, MD: Conceptualization; Methodology; Formal analysis; Visualization; Writing - original draft; Validation. Wenwu He, MD: Conceptualization; Investigation; Project administration; Writing - review & editing; Validation. Changding Li, MD: Conceptualization; Formal analysis; Methodology; Validation. Xin Nie, MD: Data curation; Formal analysis; Validation. Kunhan Ni, MD: Data curation; Formal analysis; Validation. Xuefeng Leng, MD: Funding acquisition; Writing - review & editing; Supervision; Validation. Kunzhi Li, MD: Data curation; Formal analysis; Validation. Kun Liu, MD: Data curation; Formal analysis; Validation. Deyao Tu, PhD: Software; Formal analysis; Validation. Yongtao Han, MD: Funding acquisition; Project administration; Supervision; Validation; Writing - review & editing;
Funding
This work is supported by grants from the Science and Technology of Sichuan Province (Grant No. 2020YFH0169 and No. 2021YJ0118); Science and Technology Department of Sichuan Province (23ZDYF2430) and Sichuan Province Clinical Key Specialty Construction Project.
Institutional Review Board Statement
This retrospective study was reviewed by the Ethics Committee (EC) for Medical Research and New Medical Technology of Sichuan Cancer Hospital (SCCHEC-02-2022-050).
Informed Consent Statement
The requirement for informed consent was waived on account of anonymous data.
Data Availability Statement
The data that support the findings of this study are available from the corresponding author upon reasonable request.
Acknowledgements
The authors are grateful to Science and Technology Department of Sichuan Province (23ZDYF2430); Science and Technology Department of Sichuan Province (2020YFH0169); Sichuan Province Clinical Key Specialty Construction Project and all hospital committee members.
The authors claim that they have no financial, personal or other relationships that could lead to bias or conflict of interest.
References
- Uhlenhopp DJ, Then EO, Sunkara T, et al. Epidemiology of esophageal cancer: update in global trends, etiology and risk factors. Clin J Gastroenterol 2020; 13(6):1010-1021. [CrossRef]
- Bray F, Ferlay J, Soerjomataram I, et al. Global cancer statistics 2018: GLOBOCAN estimates of incidence and mortality worldwide for 36 cancers in 185 countries. CA Cancer J Clin 2018; 68(6):394-424. [CrossRef]
- Yun JK, Kim HR, Park SI, et al. Risk prediction of occult lymph node metastasis in patients with clinical T1 through T2 N0 esophageal squamous cell carcinoma. J Thorac Cardiovasc Surg 2022; 164(1):265-275 e5. [CrossRef]
- Moon SH, Kim HS, Hyun SH, et al. Prediction of occult lymph node metastasis by metabolic parameters in patients with clinically N0 esophageal squamous cell carcinoma. J Nucl Med 2014; 55(5):743-8. [CrossRef]
- Zheng YZ, Li XQ, Wang JY, et al. Impact of Examined Lymph Node Count for Esophageal Squamous Cell Carcinoma in Patients who Underwent Right Transthoracic Esophagectomy. Ann Surg Oncol 2021; 28(6):3025-3033. [CrossRef]
- Xia W, Liu S, Mao Q, et al. Effect of lymph node examined count on accurate staging and survival of resected esophageal cancer. Thorac Cancer 2019; 10(5):1149-1157. [CrossRef]
- Wu LL, Zhong JD, Zhu JL, et al. Postoperative survival effect of the number of examined lymph nodes on esophageal squamous cell carcinoma with pathological stage T1-3N0M0. BMC Cancer 2022; 22(1):118. [CrossRef]
- Liu Q, Tan Z, Lin P, et al. Impact of the number of resected lymph nodes on postoperative survival of patients with node-negative oesophageal squamous cell carcinoma. Eur J Cardiothorac Surg 2013; 44(4):631-6. [CrossRef]
- Groth SS, Virnig BA, Whitson BA, et al. Determination of the minimum number of lymph nodes to examine to maximize survival in patients with esophageal carcinoma: data from the Surveillance Epidemiology and End Results database. J Thorac Cardiovasc Surg 2010; 139(3):612-20. [CrossRef]
- Yang HX, Xu Y, Fu JH, et al. An evaluation of the number of lymph nodes examined and survival for node-negative esophageal carcinoma: data from China. Ann Surg Oncol 2010; 17(7):1901-11. [CrossRef]
- Ye G, Chen Z, Wang L, et al. Log odds of positive lymph nodes predicts survival in patients treated with neoadjuvant therapy followed by esophagectomy. J Surg Oncol 2020; 121(7):1074-1083. [CrossRef]
- Shah MA, Kennedy EB, Catenacci DV, et al. Treatment of Locally Advanced Esophageal Carcinoma: ASCO Guideline. J Clin Oncol 2020; 38(23):2677-2694. [CrossRef]
- Gonen M, Schrag D, Weiser MR. Nodal staging score: a tool to assess adequate staging of node-negative colon cancer. J Clin Oncol 2009; 27(36):6166-71. [CrossRef]
- Tan KS, Hsu M, Adusumilli PS. Pathologic node-negative lung cancer: Adequacy of lymph node yield and a tool to assess the risk of occult nodal disease. Lung Cancer 2022; 174:60-66. [CrossRef]
- Robinson TJ, Thomas S, Dinan MA, et al. How Many Lymph Nodes Are Enough? Assessing the Adequacy of Lymph Node Yield for Papillary Thyroid Cancer. J Clin Oncol 2016; 34(28):3434-9. [CrossRef]
- Kluth LA, Abdollah F, Xylinas E, et al. Pathologic nodal staging scores in patients treated with radical prostatectomy: a postoperative decision tool. Eur Urol 2014; 66(3):439-46. [CrossRef]
- Rizk NP, Ishwaran H, Rice TW, et al. Optimum lymphadenectomy for esophageal cancer. Ann Surg 2010; 251(1):46-50. [CrossRef]
- Baba Y, Watanabe M, Shigaki H, et al. Negative lymph-node count is associated with survival in patients with resected esophageal squamous cell carcinoma. Surgery 2013; 153(2):234-41. [CrossRef]
- Boralkar AK, Rafe A, Bhalgat B. Lymph Node Involvement in Oesophageal Carcinoma: A Single-Centre Observational Study From Western India. Cureus 2021; 13(9):e17741. [CrossRef]
- Zhang SS, Yang H, Xie X, et al. Adjuvant chemotherapy versus surgery alone for esophageal squamous cell carcinoma: a meta-analysis of randomized controlled trials and nonrandomized studies. Dis Esophagus 2014; 27(6):574-84. [CrossRef]
- Yu S, Zhang W, Ni W, et al. A propensity-score matching analysis comparing long-term survival of surgery alone and postoperative treatment for patients in node positive or stage III esophageal squamous cell carcinoma after R0 esophagectomy. Radiother Oncol 2019; 140:159-166. [CrossRef]
- Chen J, Zhu J, Pan J, et al. Postoperative radiotherapy improved survival of poor prognostic squamous cell carcinoma esophagus. Ann Thorac Surg 2010; 90(2):435-42. [CrossRef]
- Chen SB, Weng HR, Wang G, et al. The impact of adjuvant radiotherapy on radically resected T3 esophageal squamous cell carcinoma. J Cancer Res Clin Oncol 2016; 142(1):277-86. [CrossRef]
- Giugliano DN, Berger AC, Pucci MJ, et al. Comparative Quantitative Lymph Node Assessment in Localized Esophageal Cancer Patients After R0 Resection With and Without Neoadjuvant Chemoradiation Therapy. J Gastrointest Surg 2017; 21(9):1377-1384. [CrossRef]
|
Disclaimer/Publisher’s Note: The statements, opinions and data contained in all publications are solely those of the individual author(s) and contributor(s) and not of MDPI and/or the editor(s). MDPI and/or the editor(s) disclaim responsibility for any injury to people or property resulting from any ideas, methods, instructions or products referred to in the content. |
© 2023 by the authors. Licensee MDPI, Basel, Switzerland. This article is an open access article distributed under the terms and conditions of the Creative Commons Attribution (CC BY) license (http://creativecommons.org/licenses/by/4.0/).
