Submitted:
12 June 2023
Posted:
13 June 2023
You are already at the latest version
Abstract
Keywords:
1. Introduction
2. Measurements and Methods
2.1. Previous Research
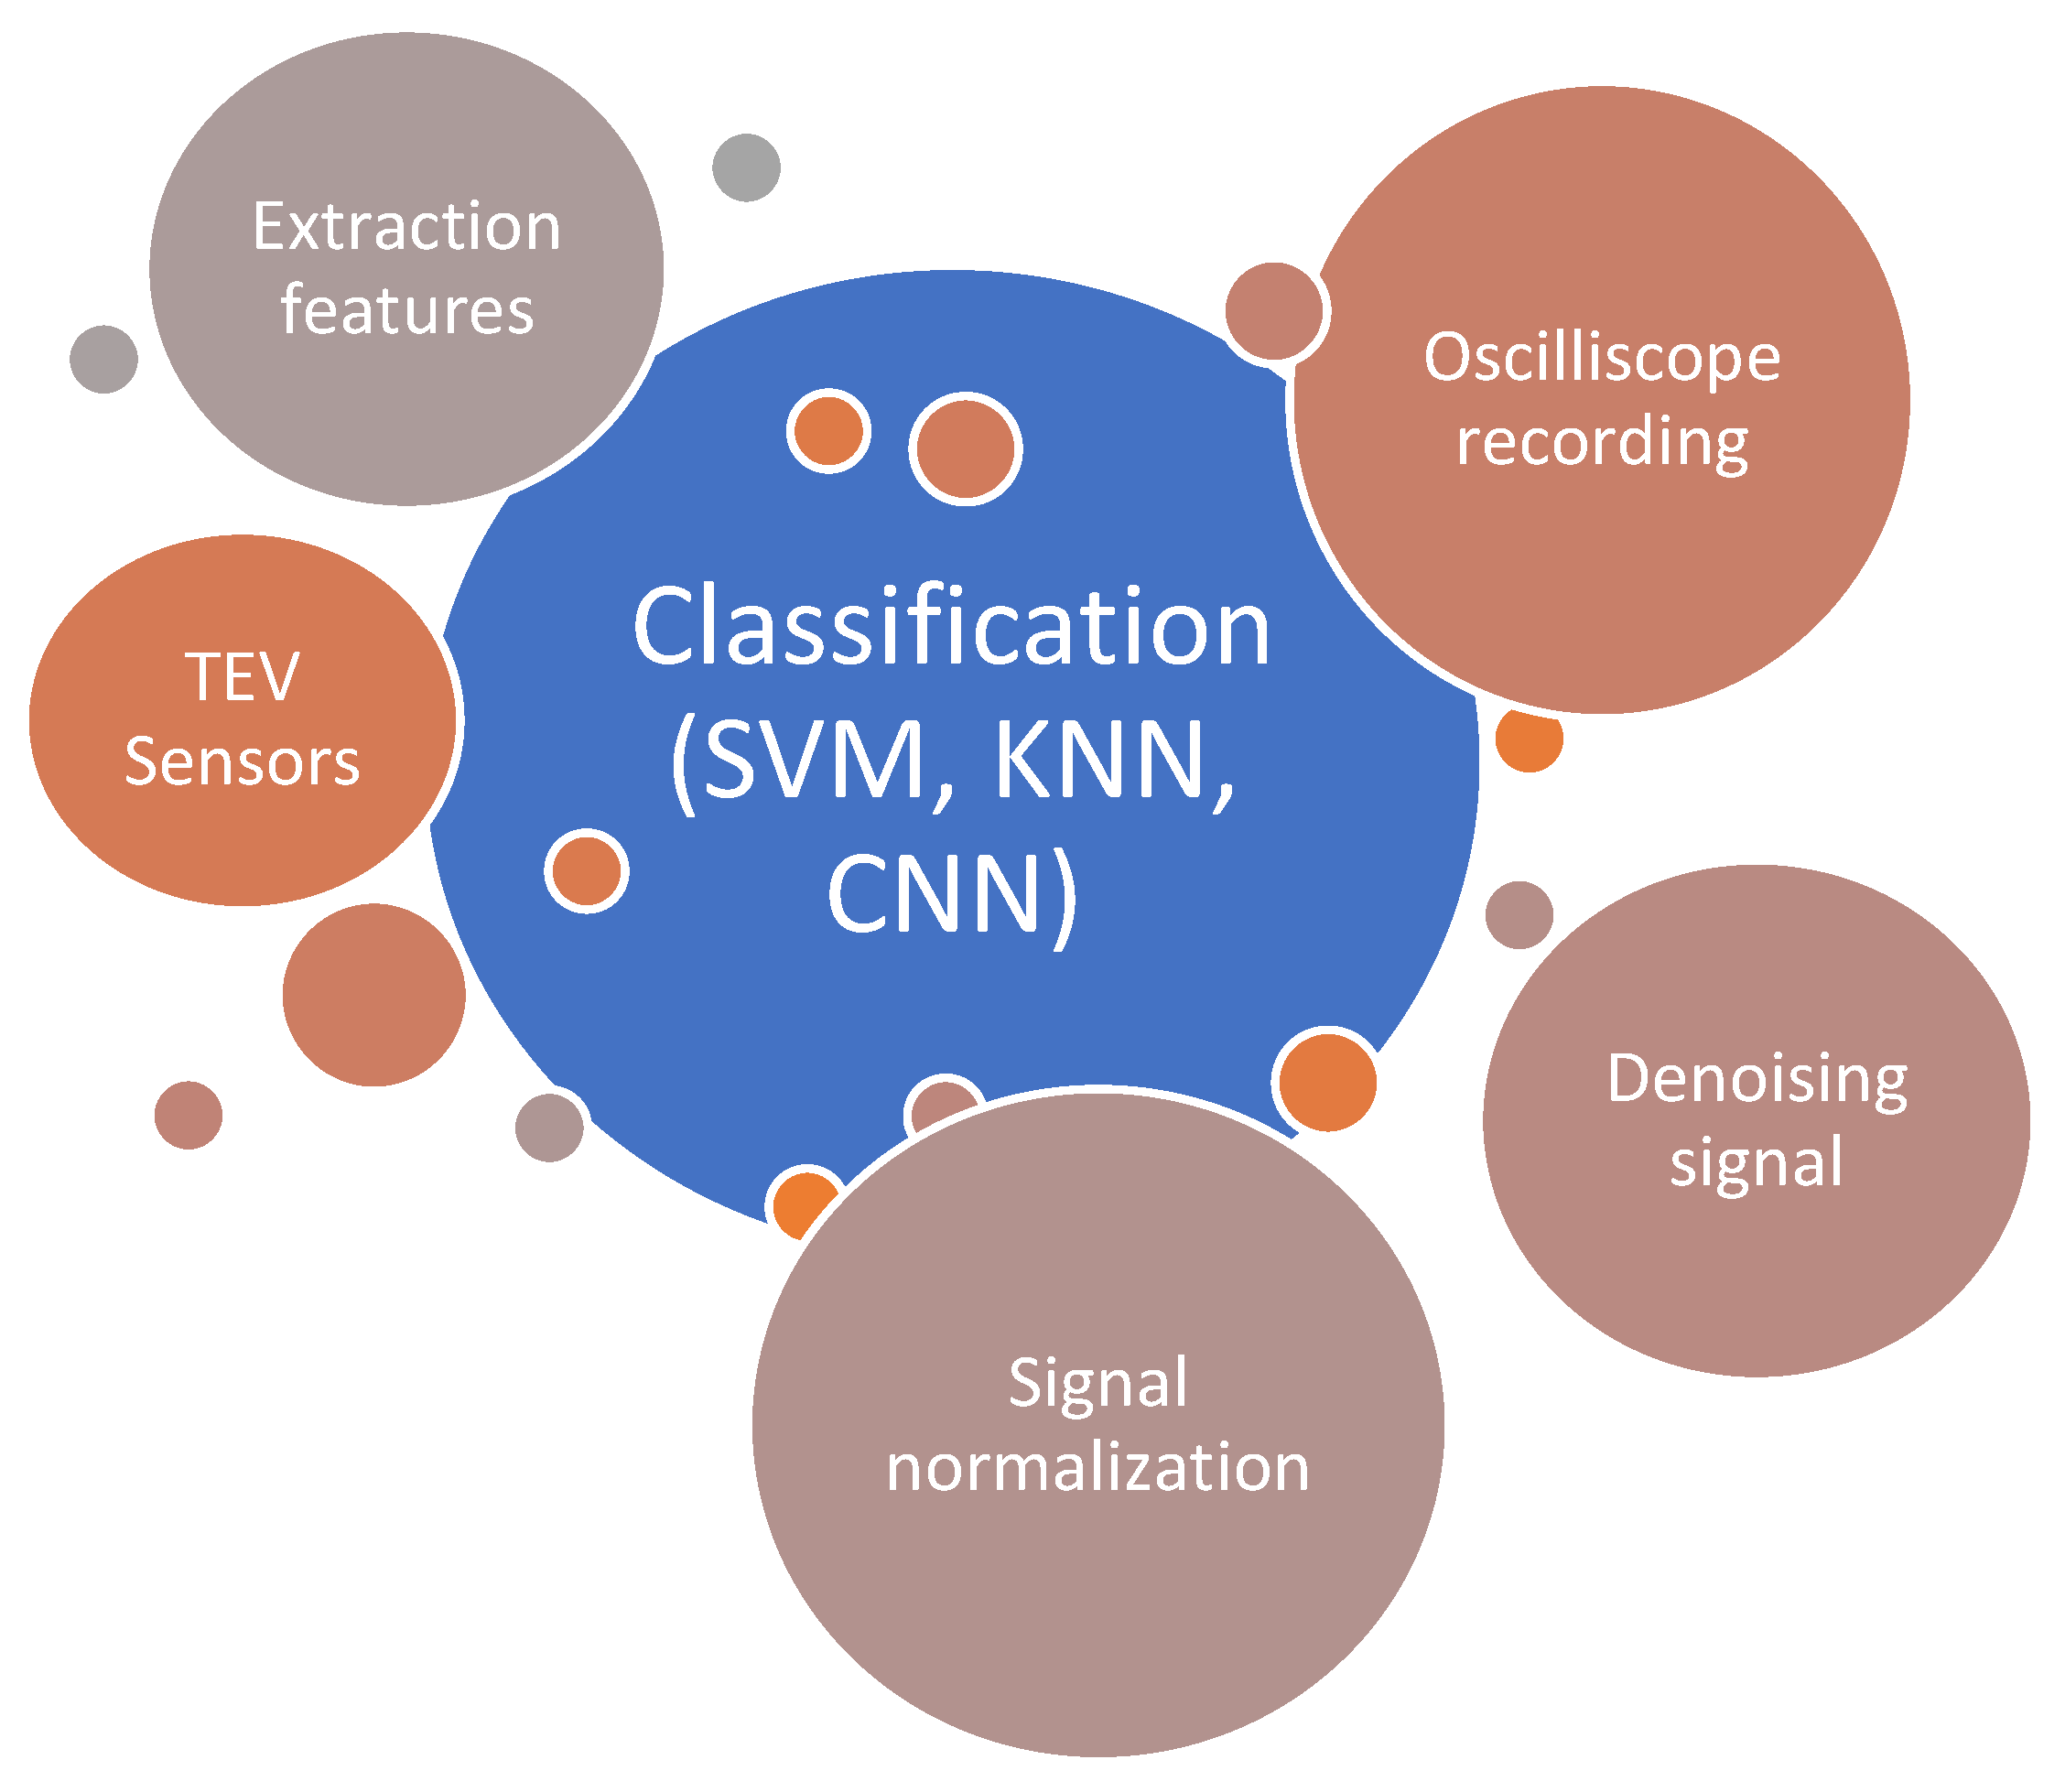
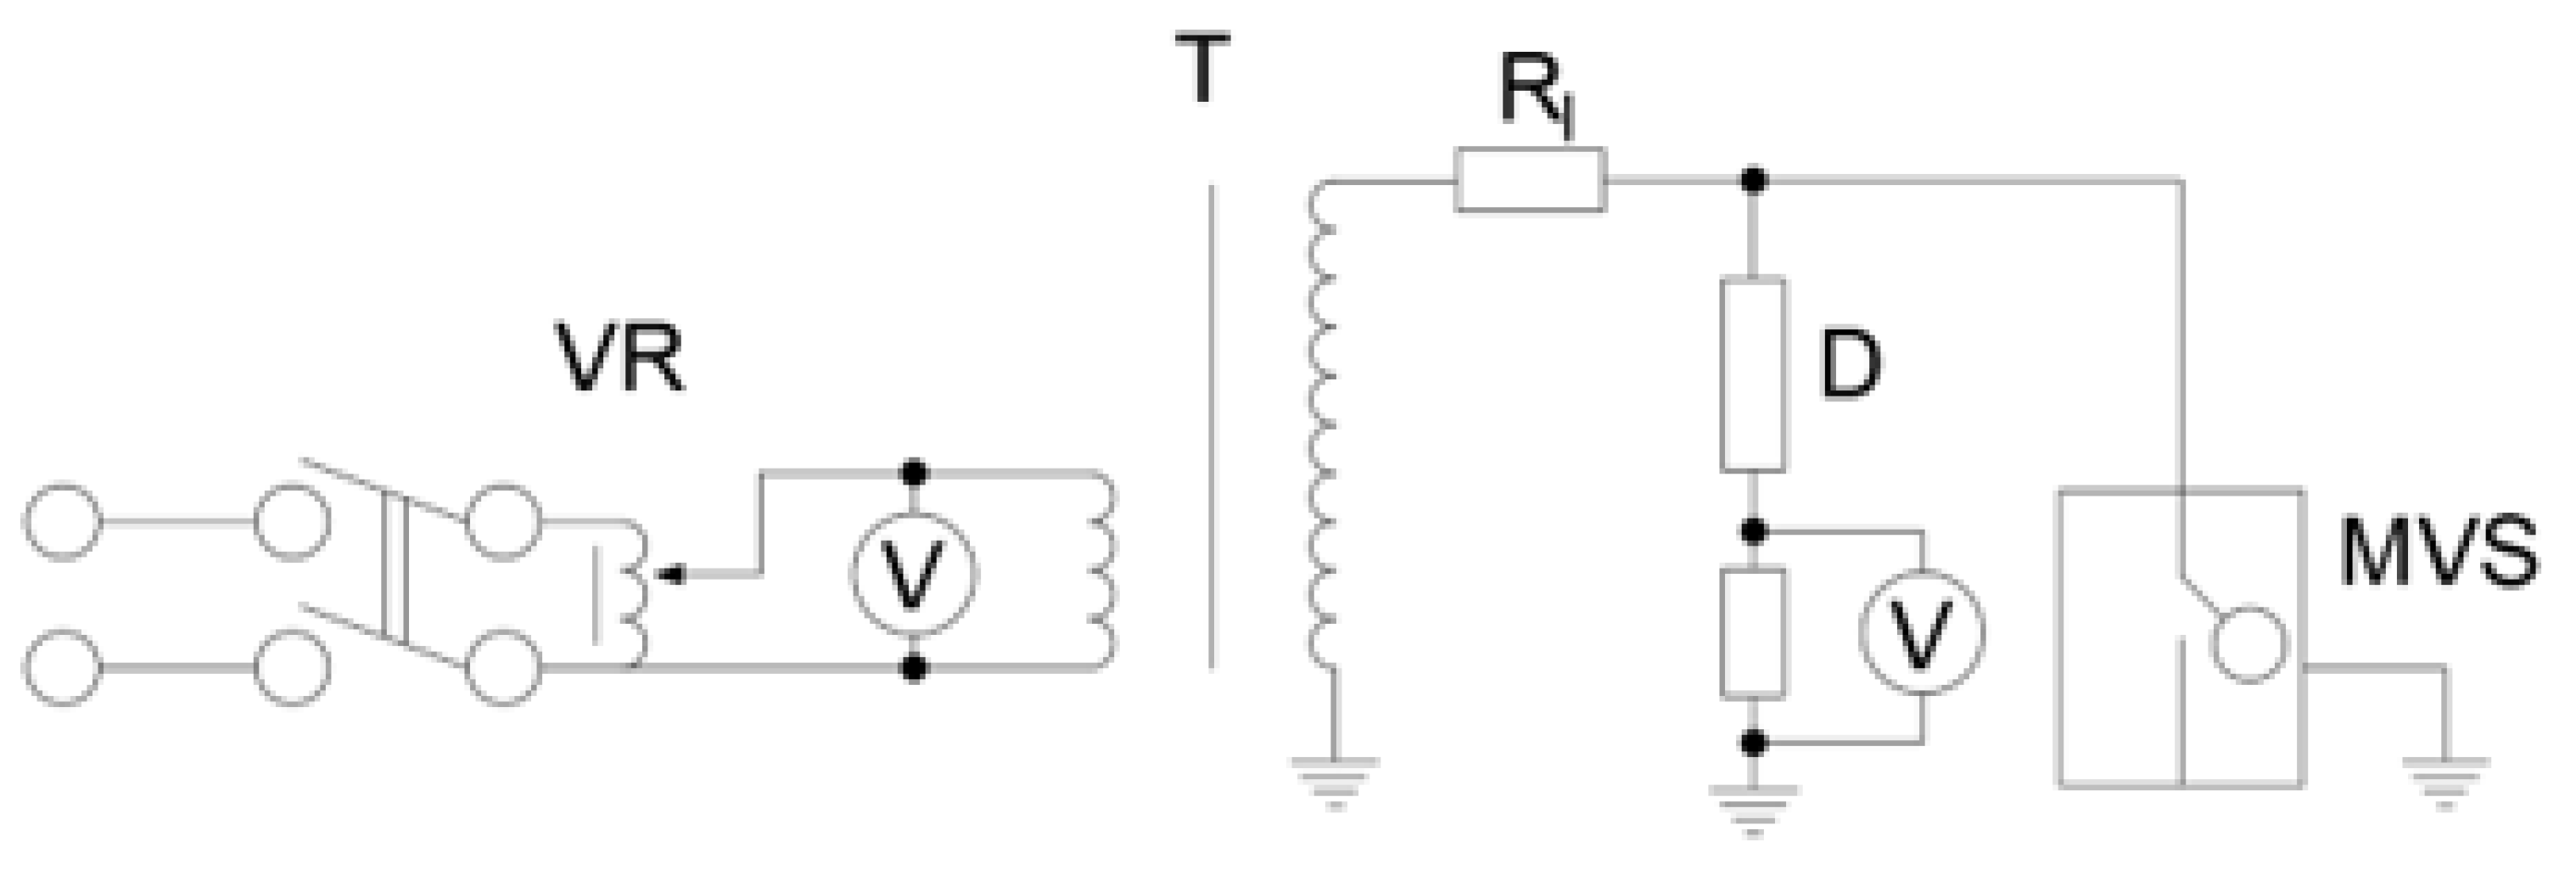
2.2. Current Research and Measuring System with TEV Sensors
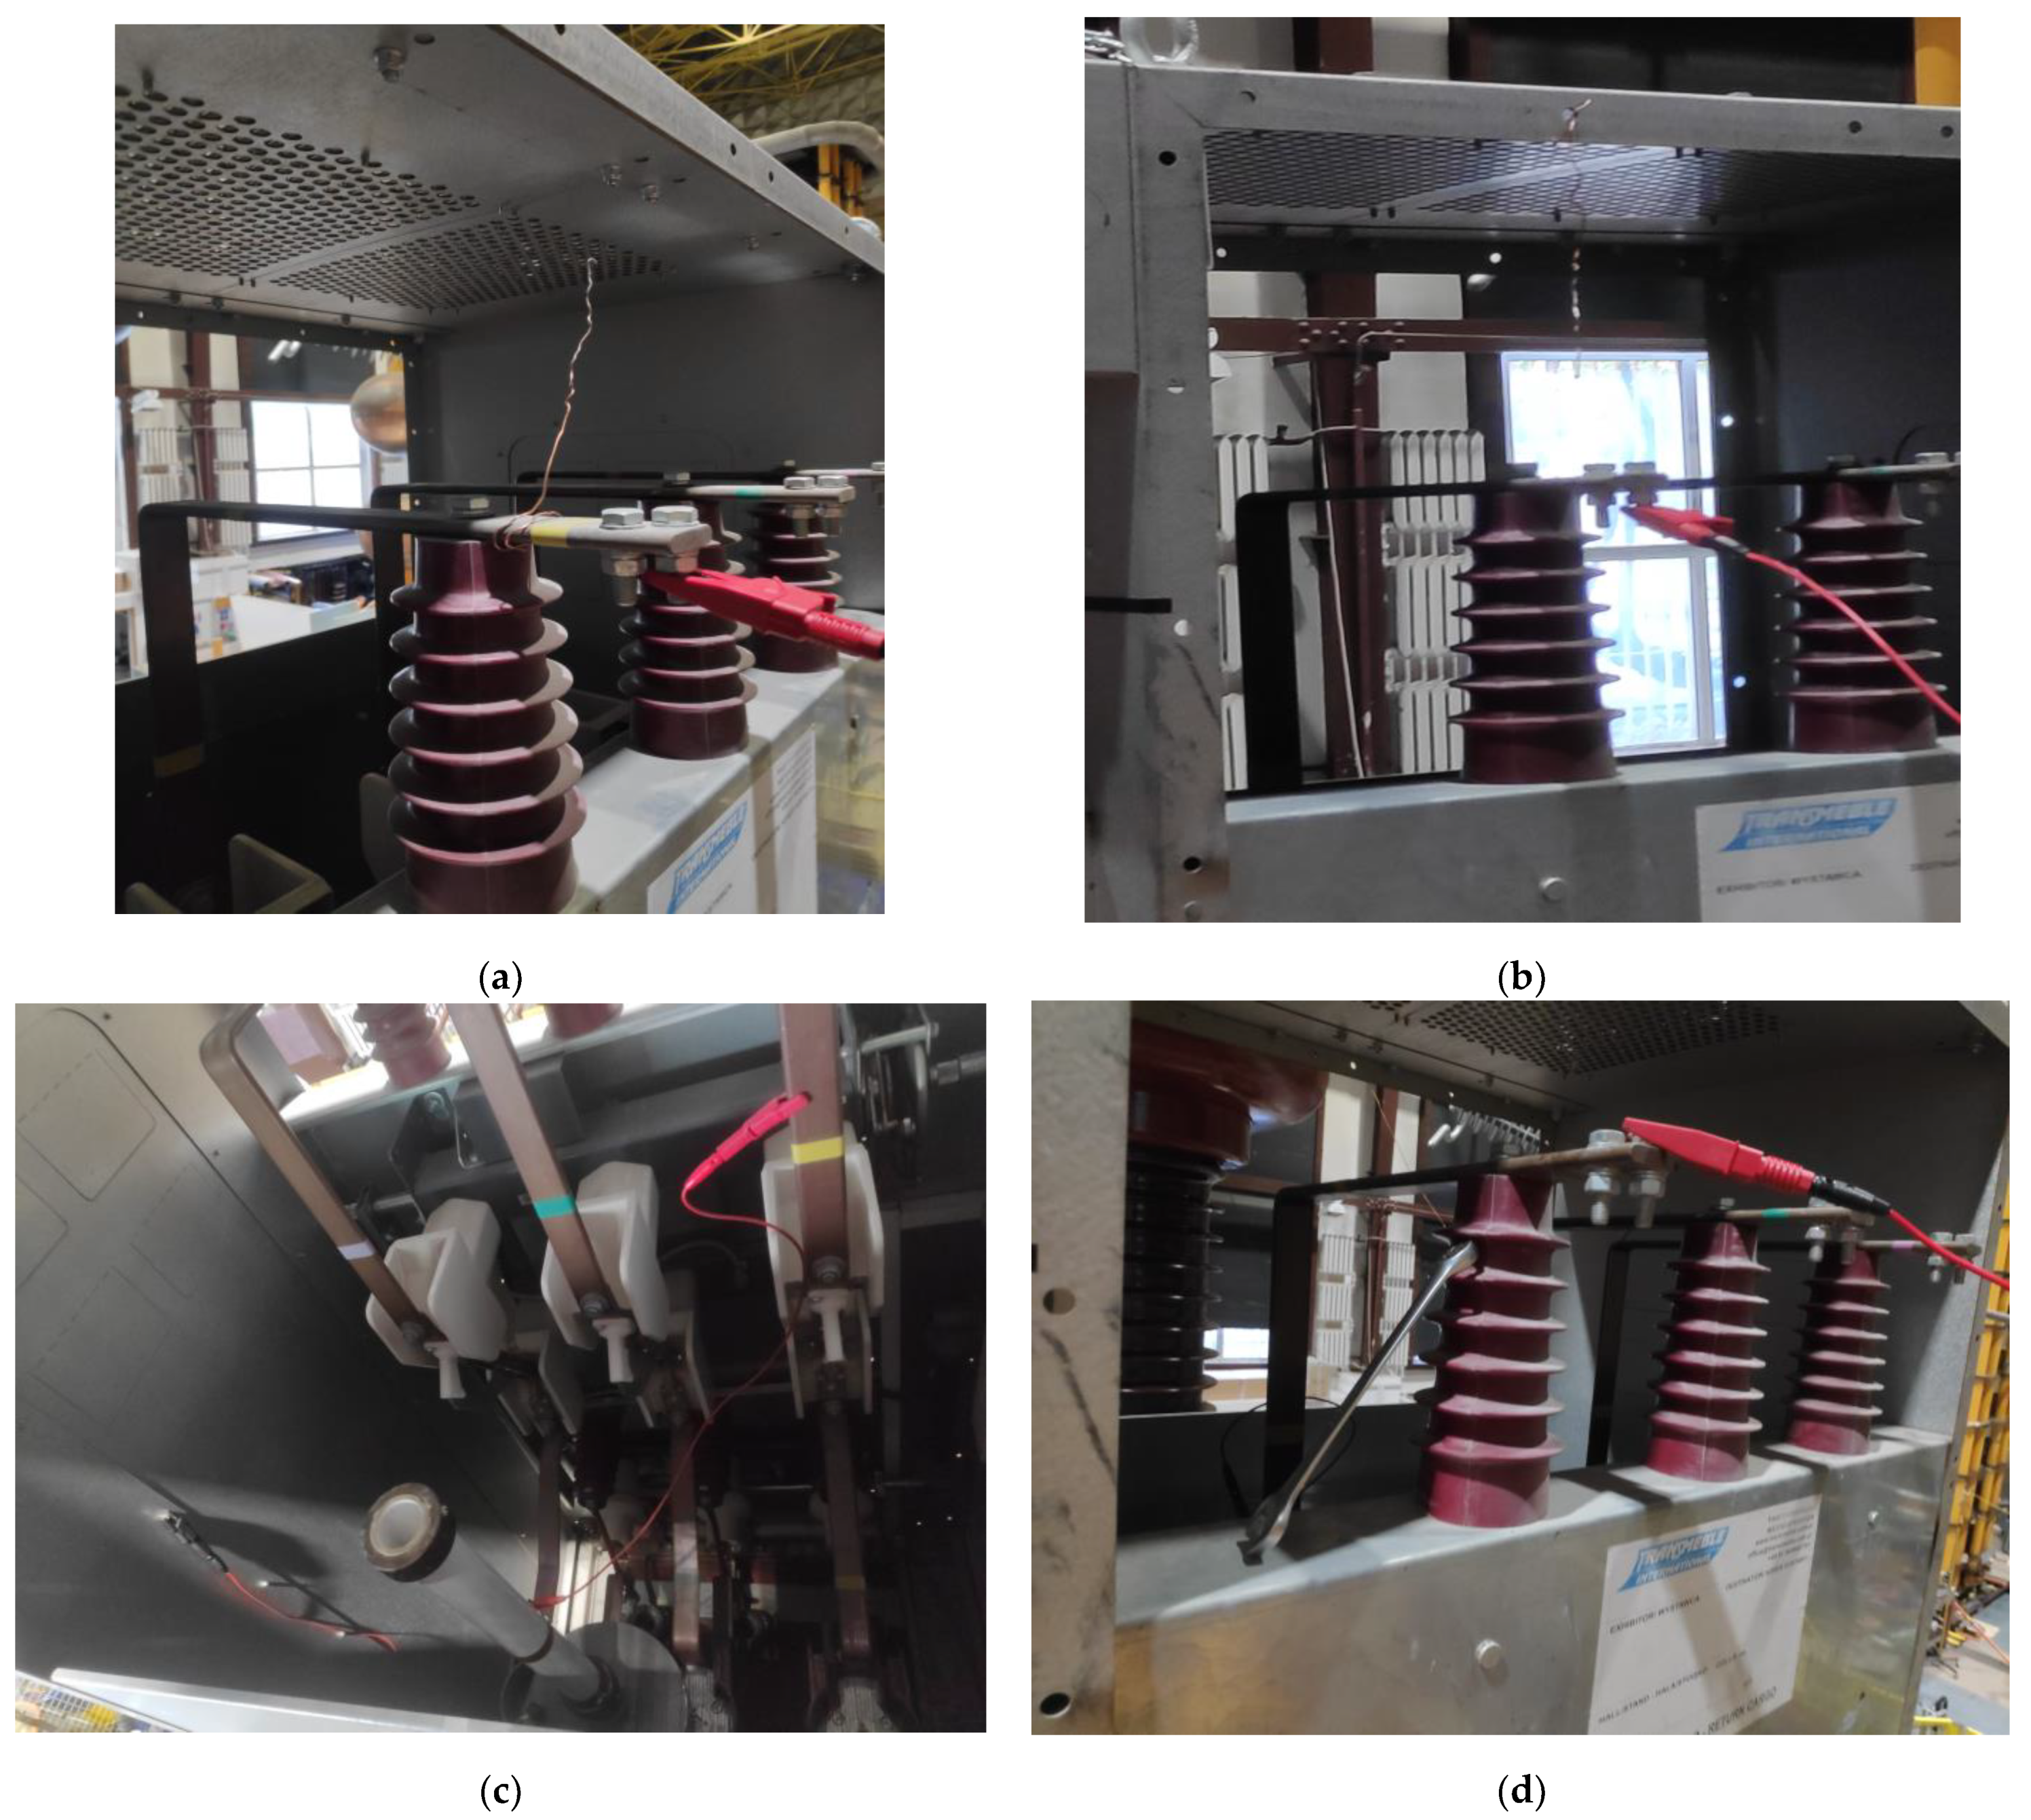
2.2.1. Simulation of Possible Switchgear Failures
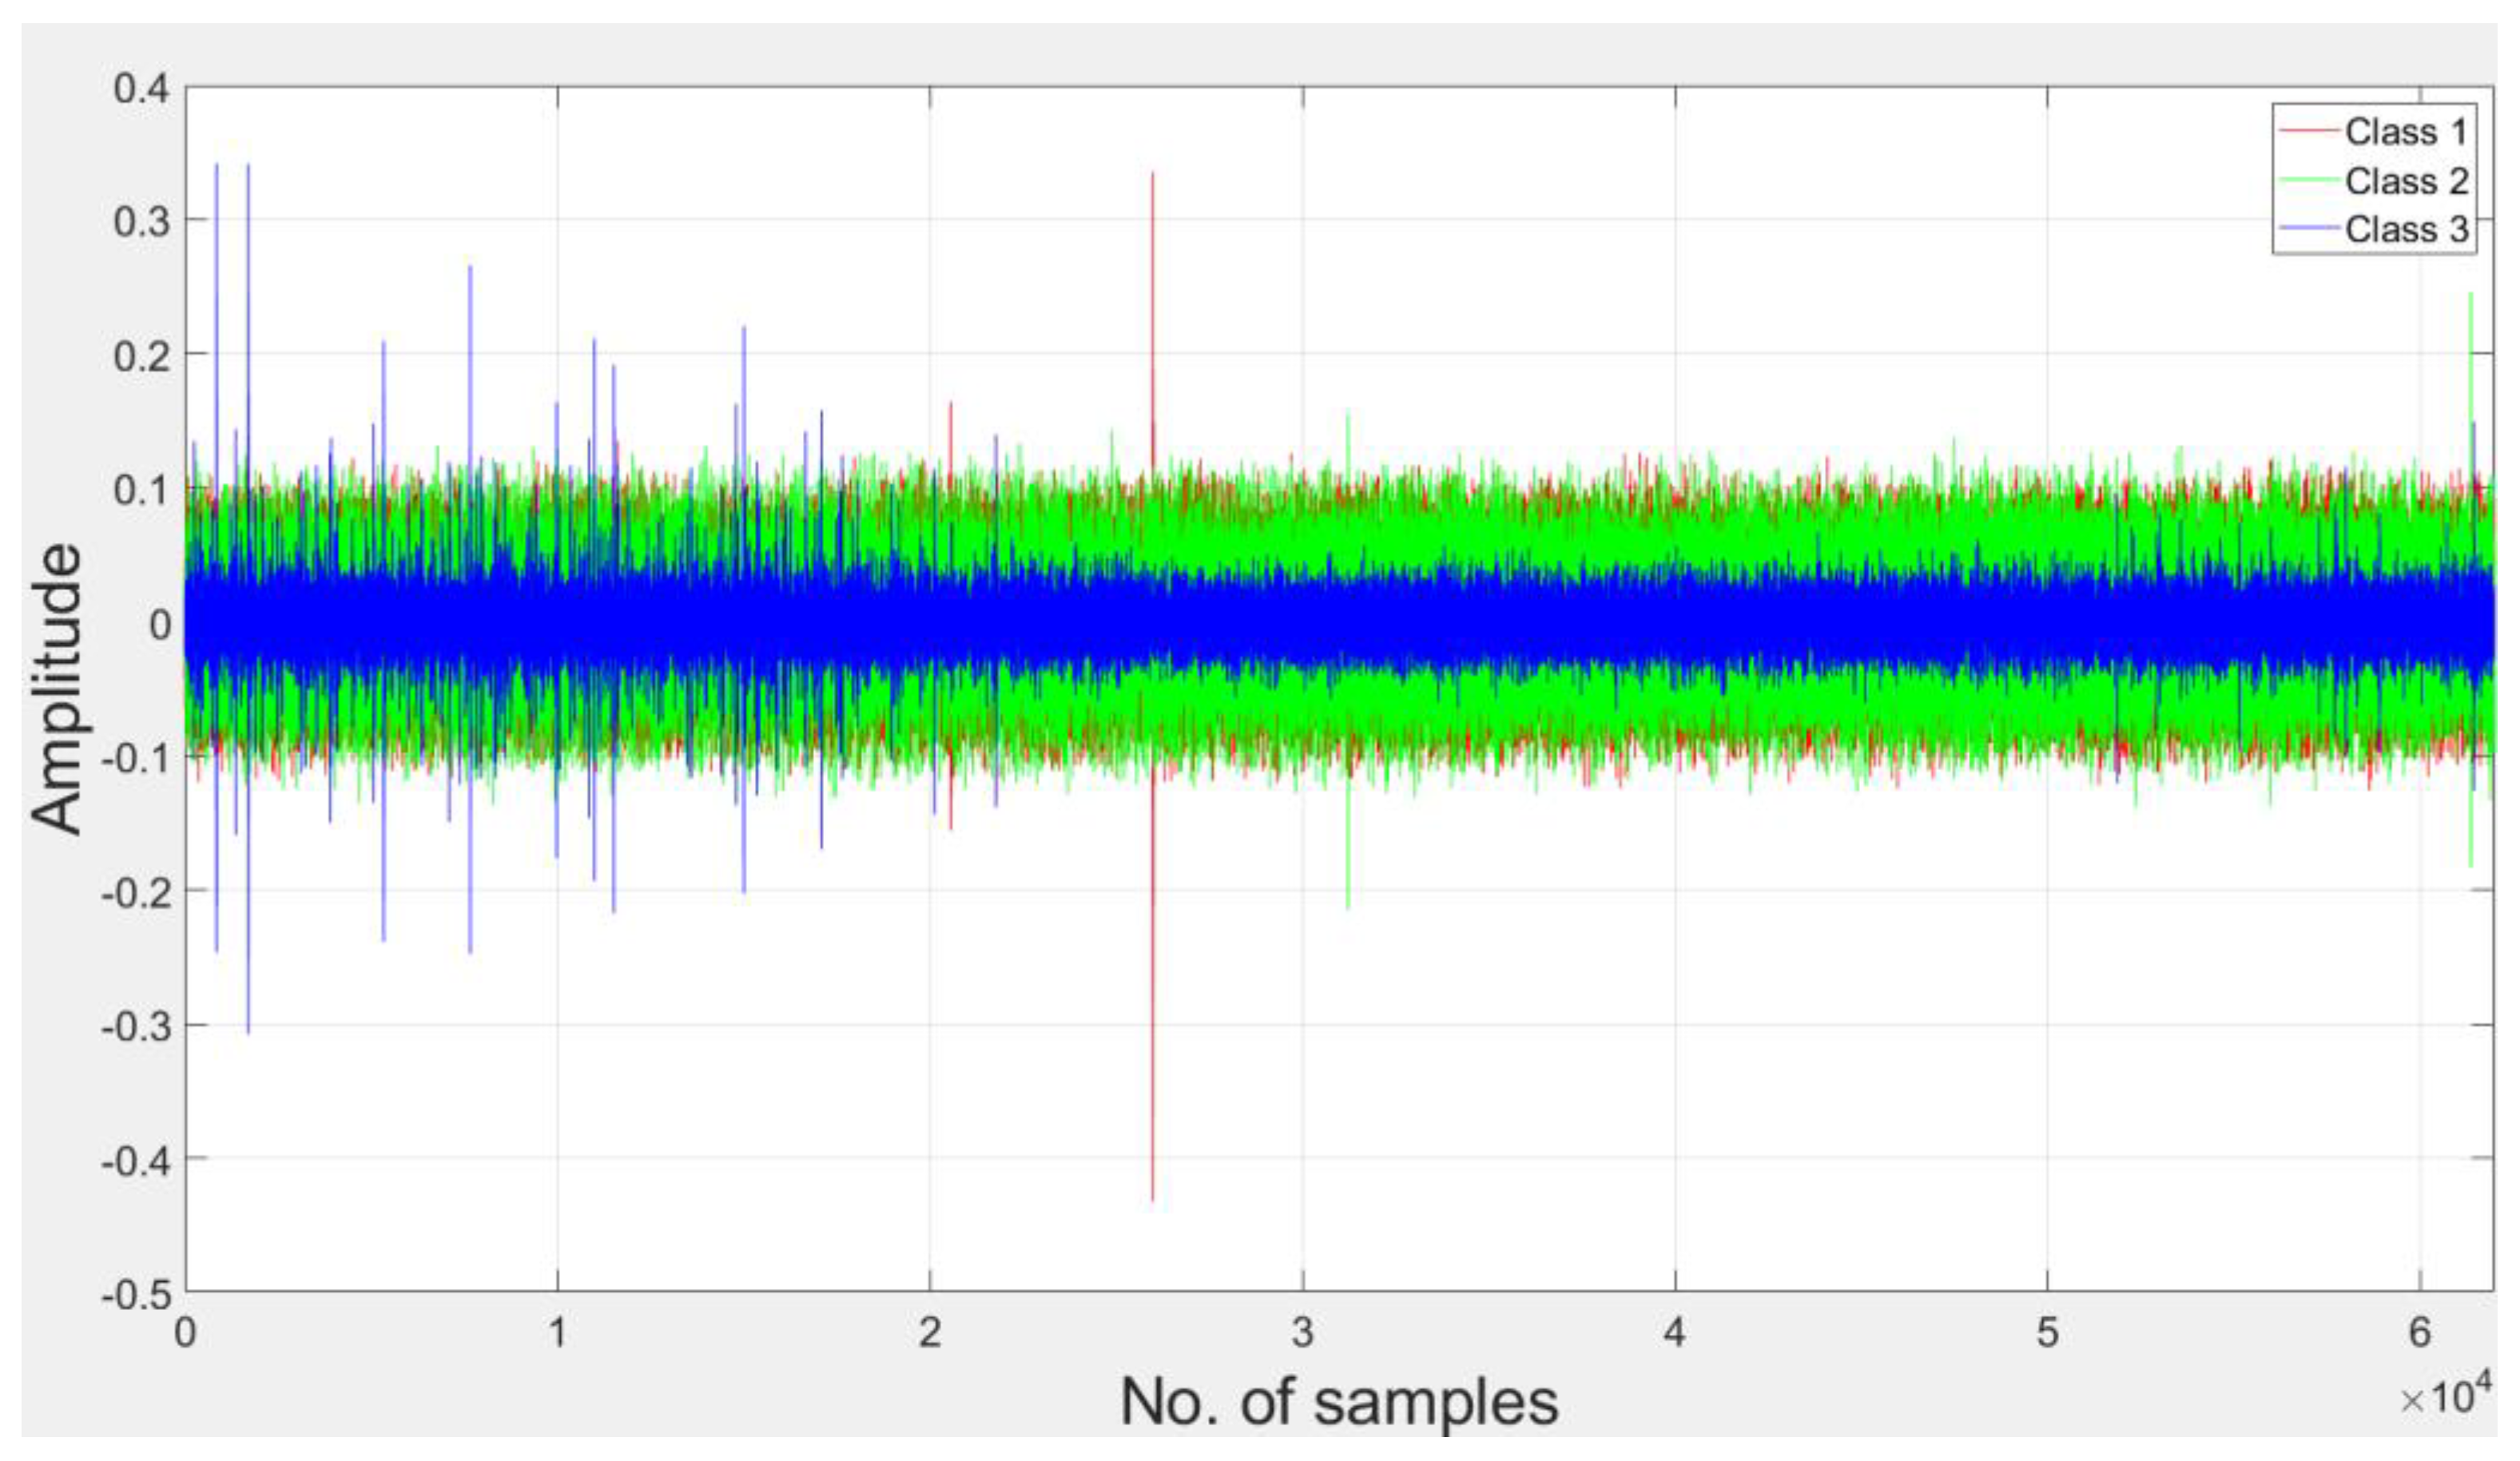
- The first one (Class 1) - a copper wire was attached to one phase of the switchgear, which was at high potential;
- The second (Class 2) - a copper wire was attached to a grounded metal switchgear enclosure;
- Third (Class 3) - surface partial discharges were artificially induced inside the switchgear;
- The fourth (Class 4) - contained a confusion of multiple defects, including: leaving a wrench in the switchgear along with fault one, surface discharge with fault from high potential and surface discharge with fault from low potential;
- The last one (Class 5) - an additional class to validate the algorithm, which was actually the measured noise level.
2.2.2. Placement of TEV Sensors
- Close to the power supply;
- On the front door of the switchgear;
- At the point furthest from the PD source.
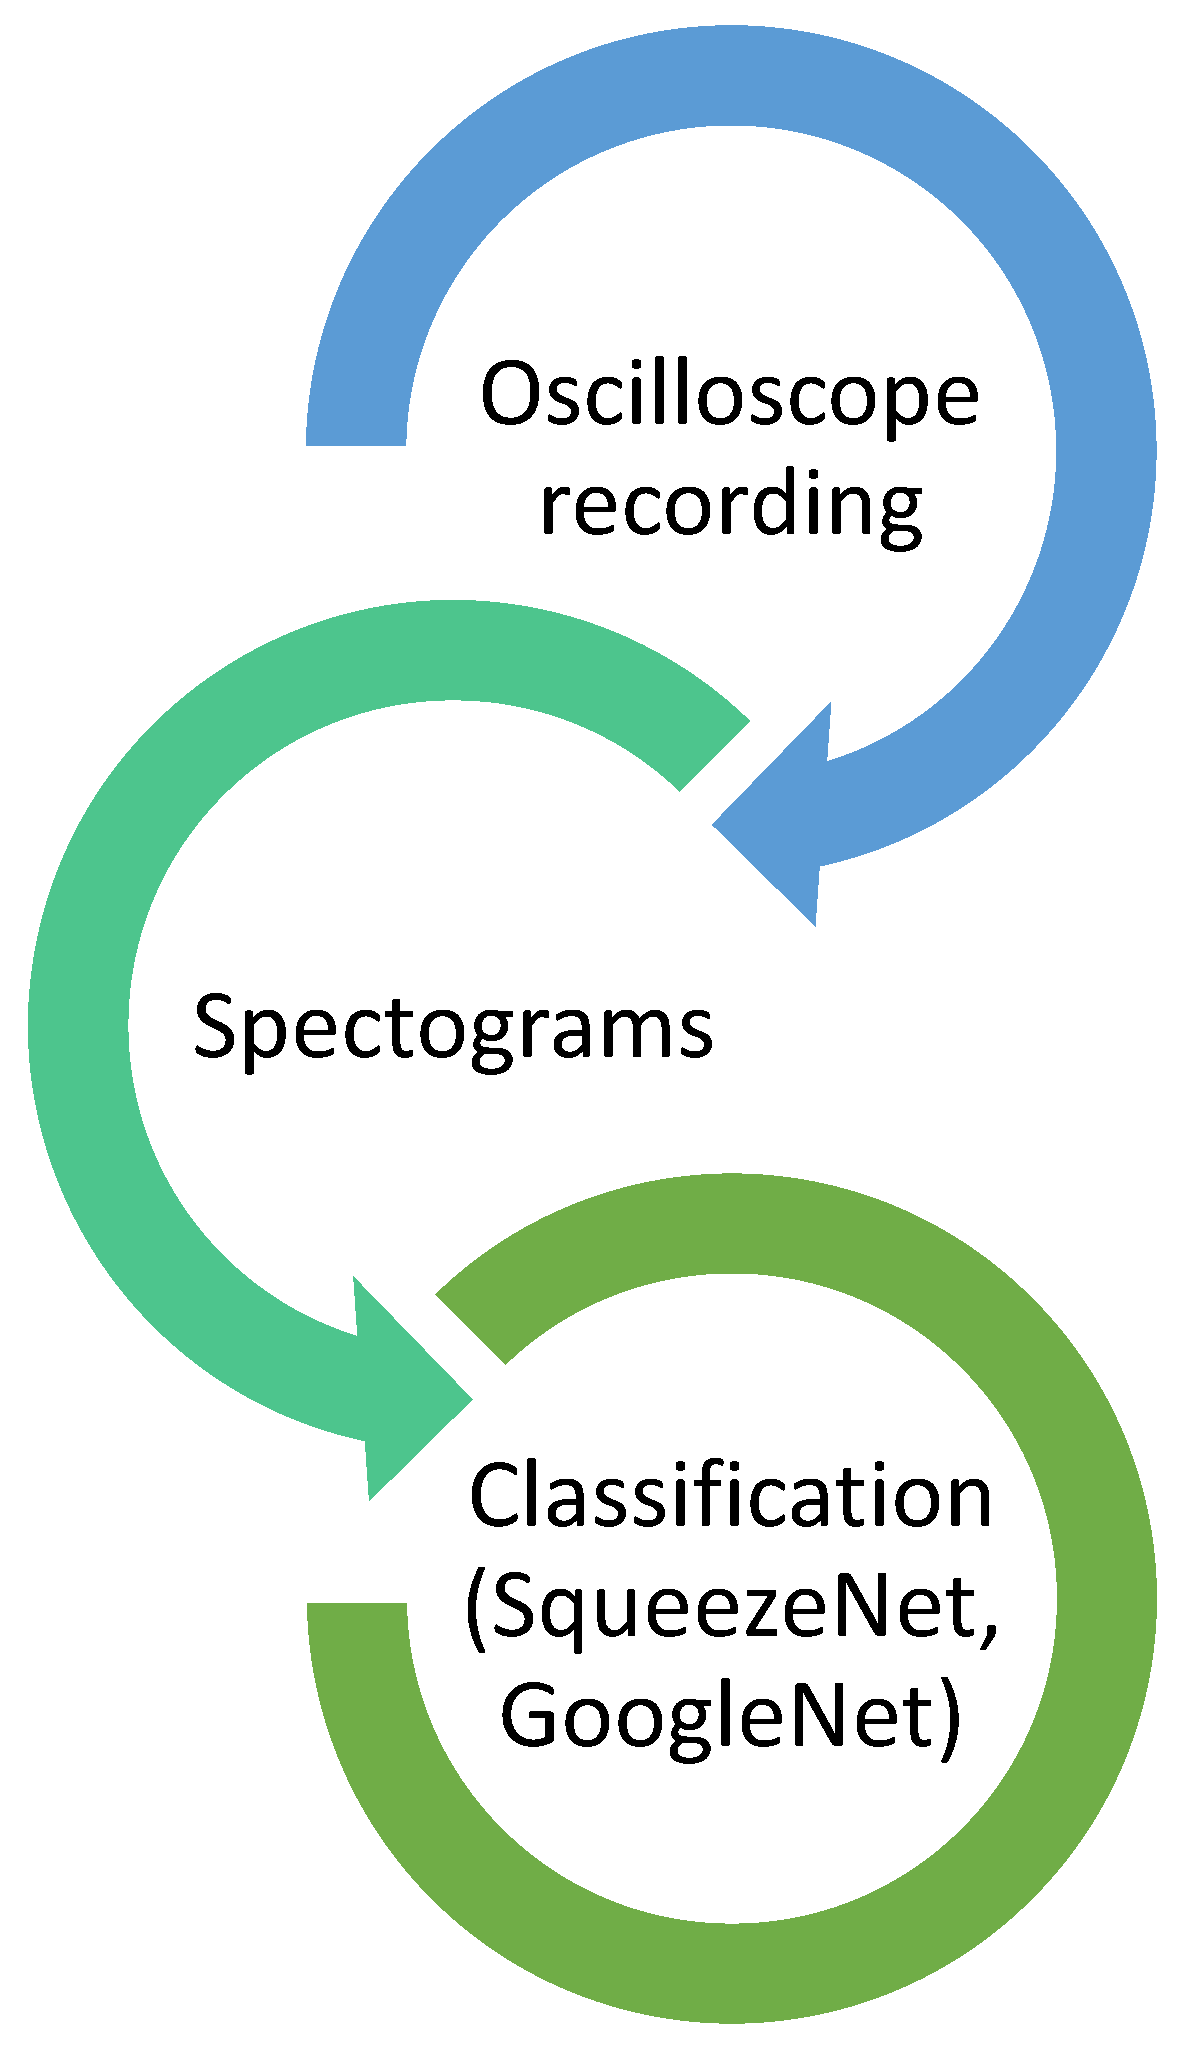
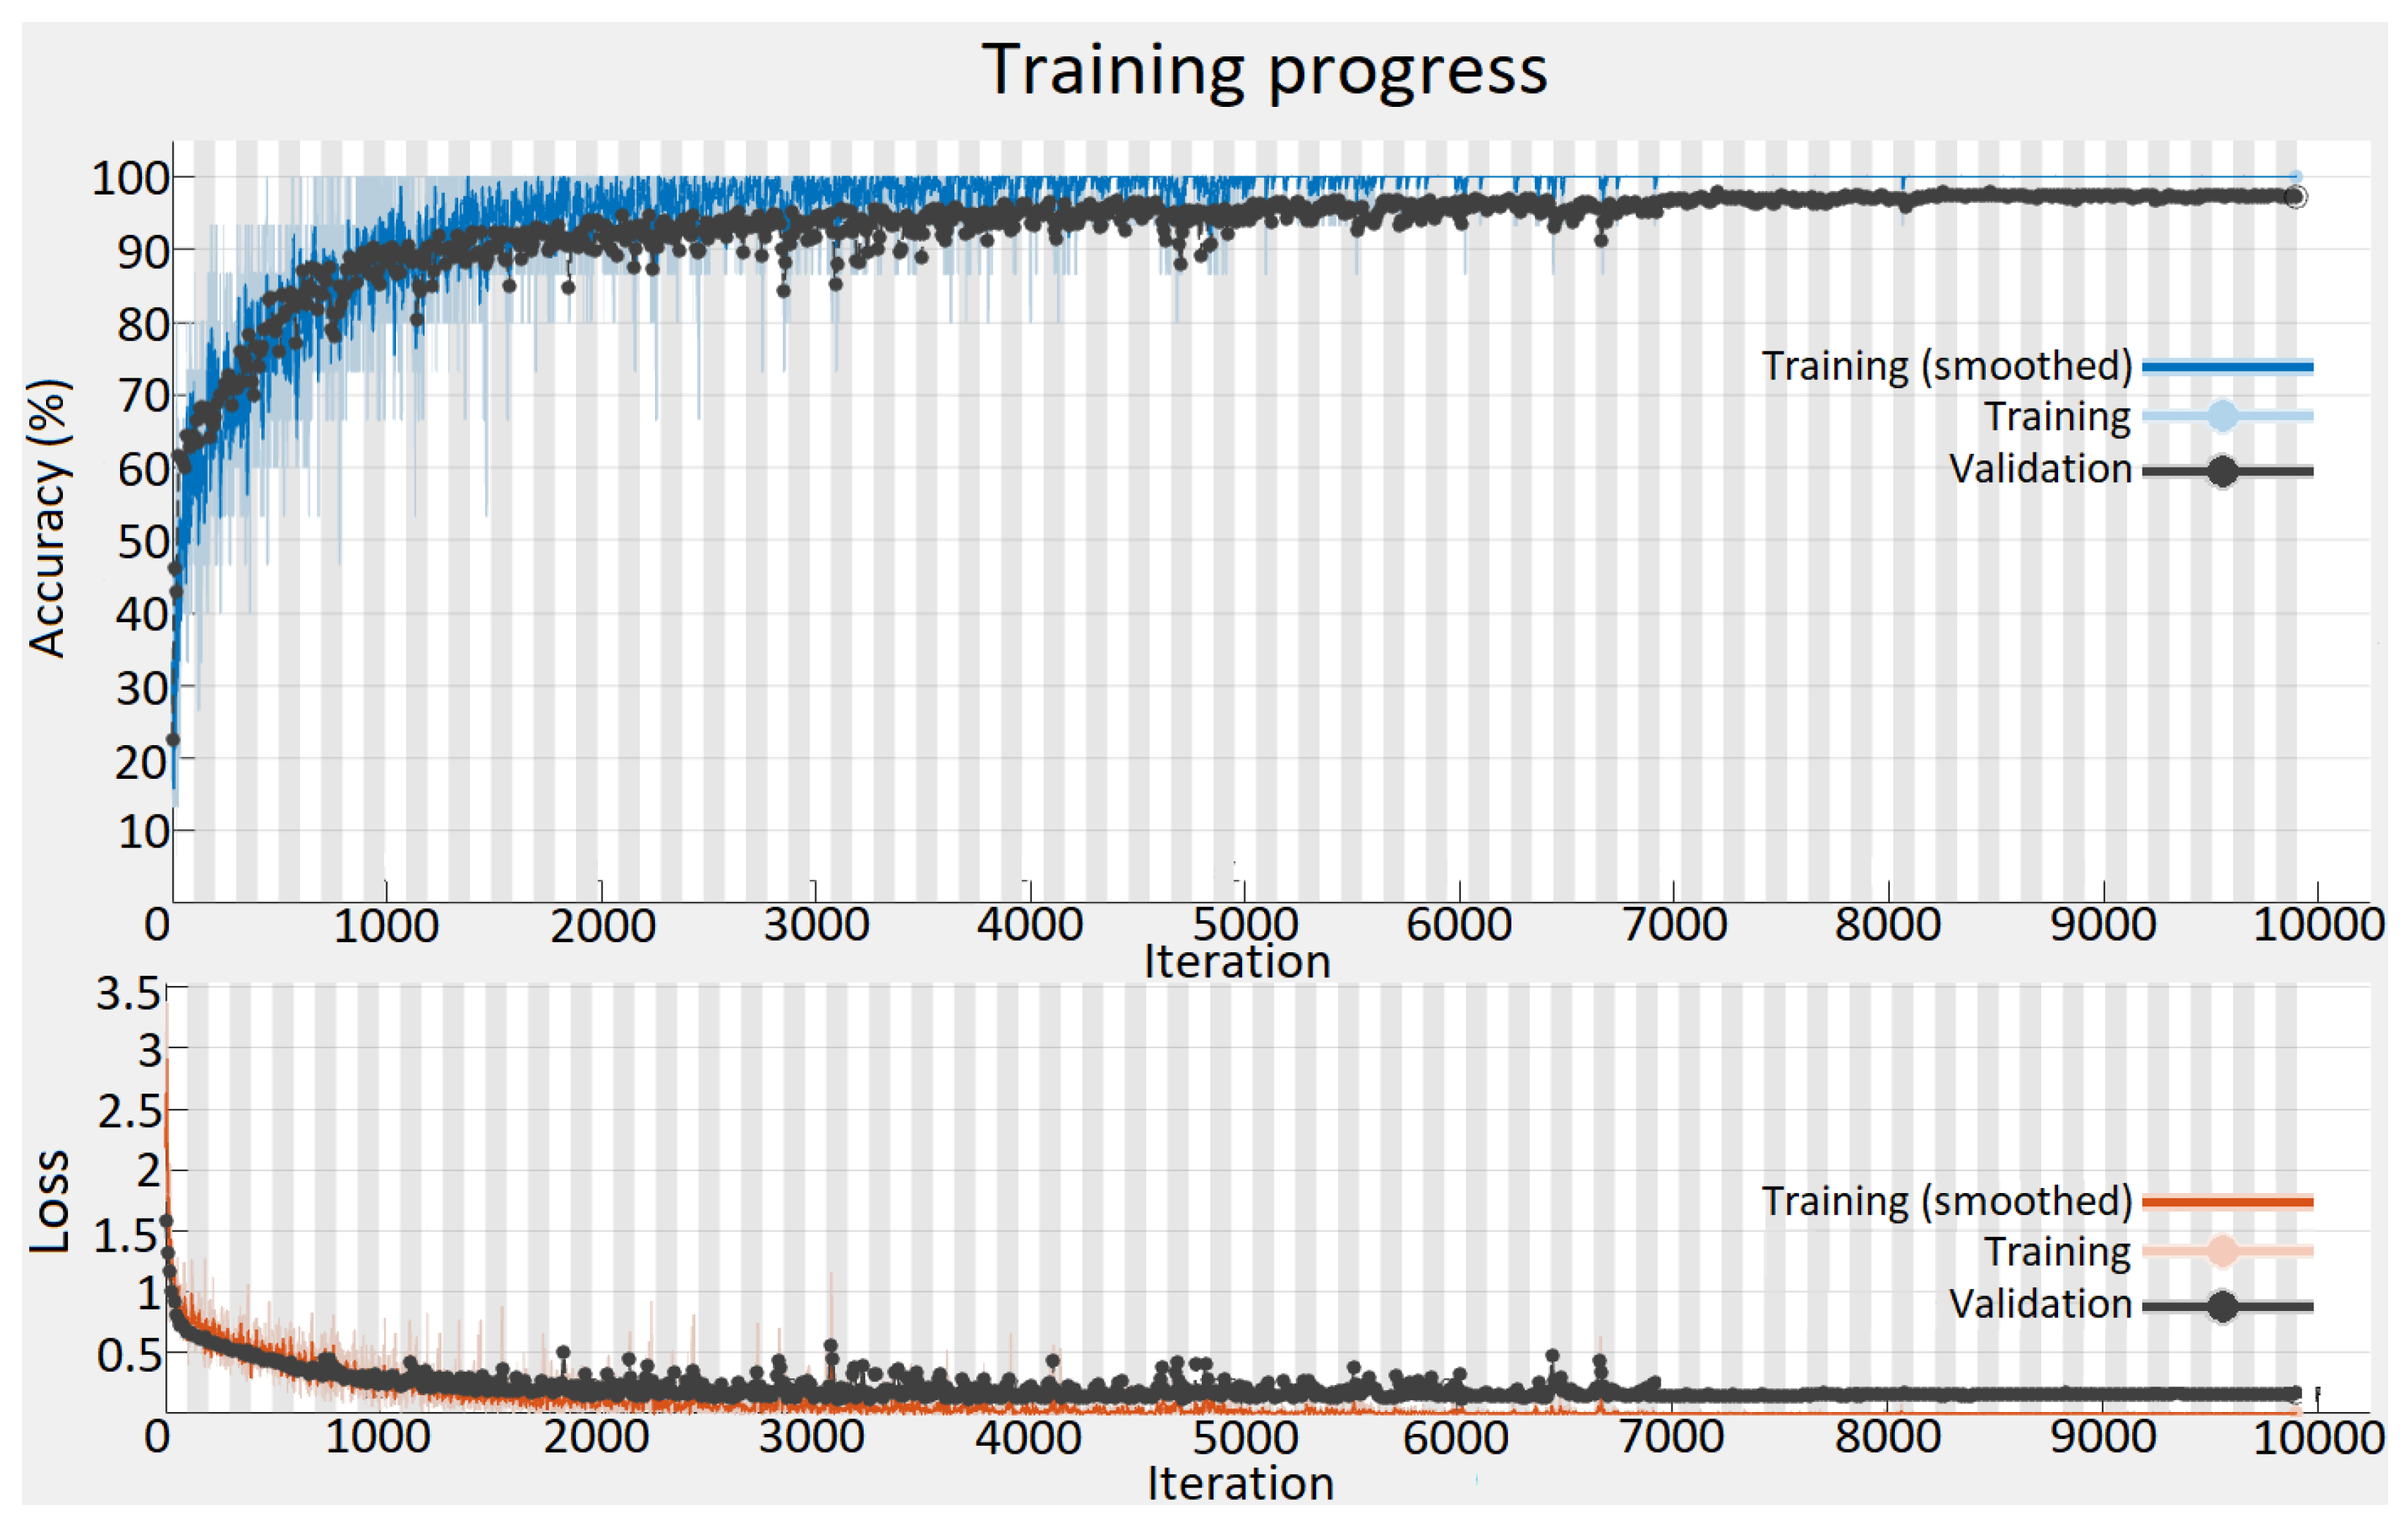
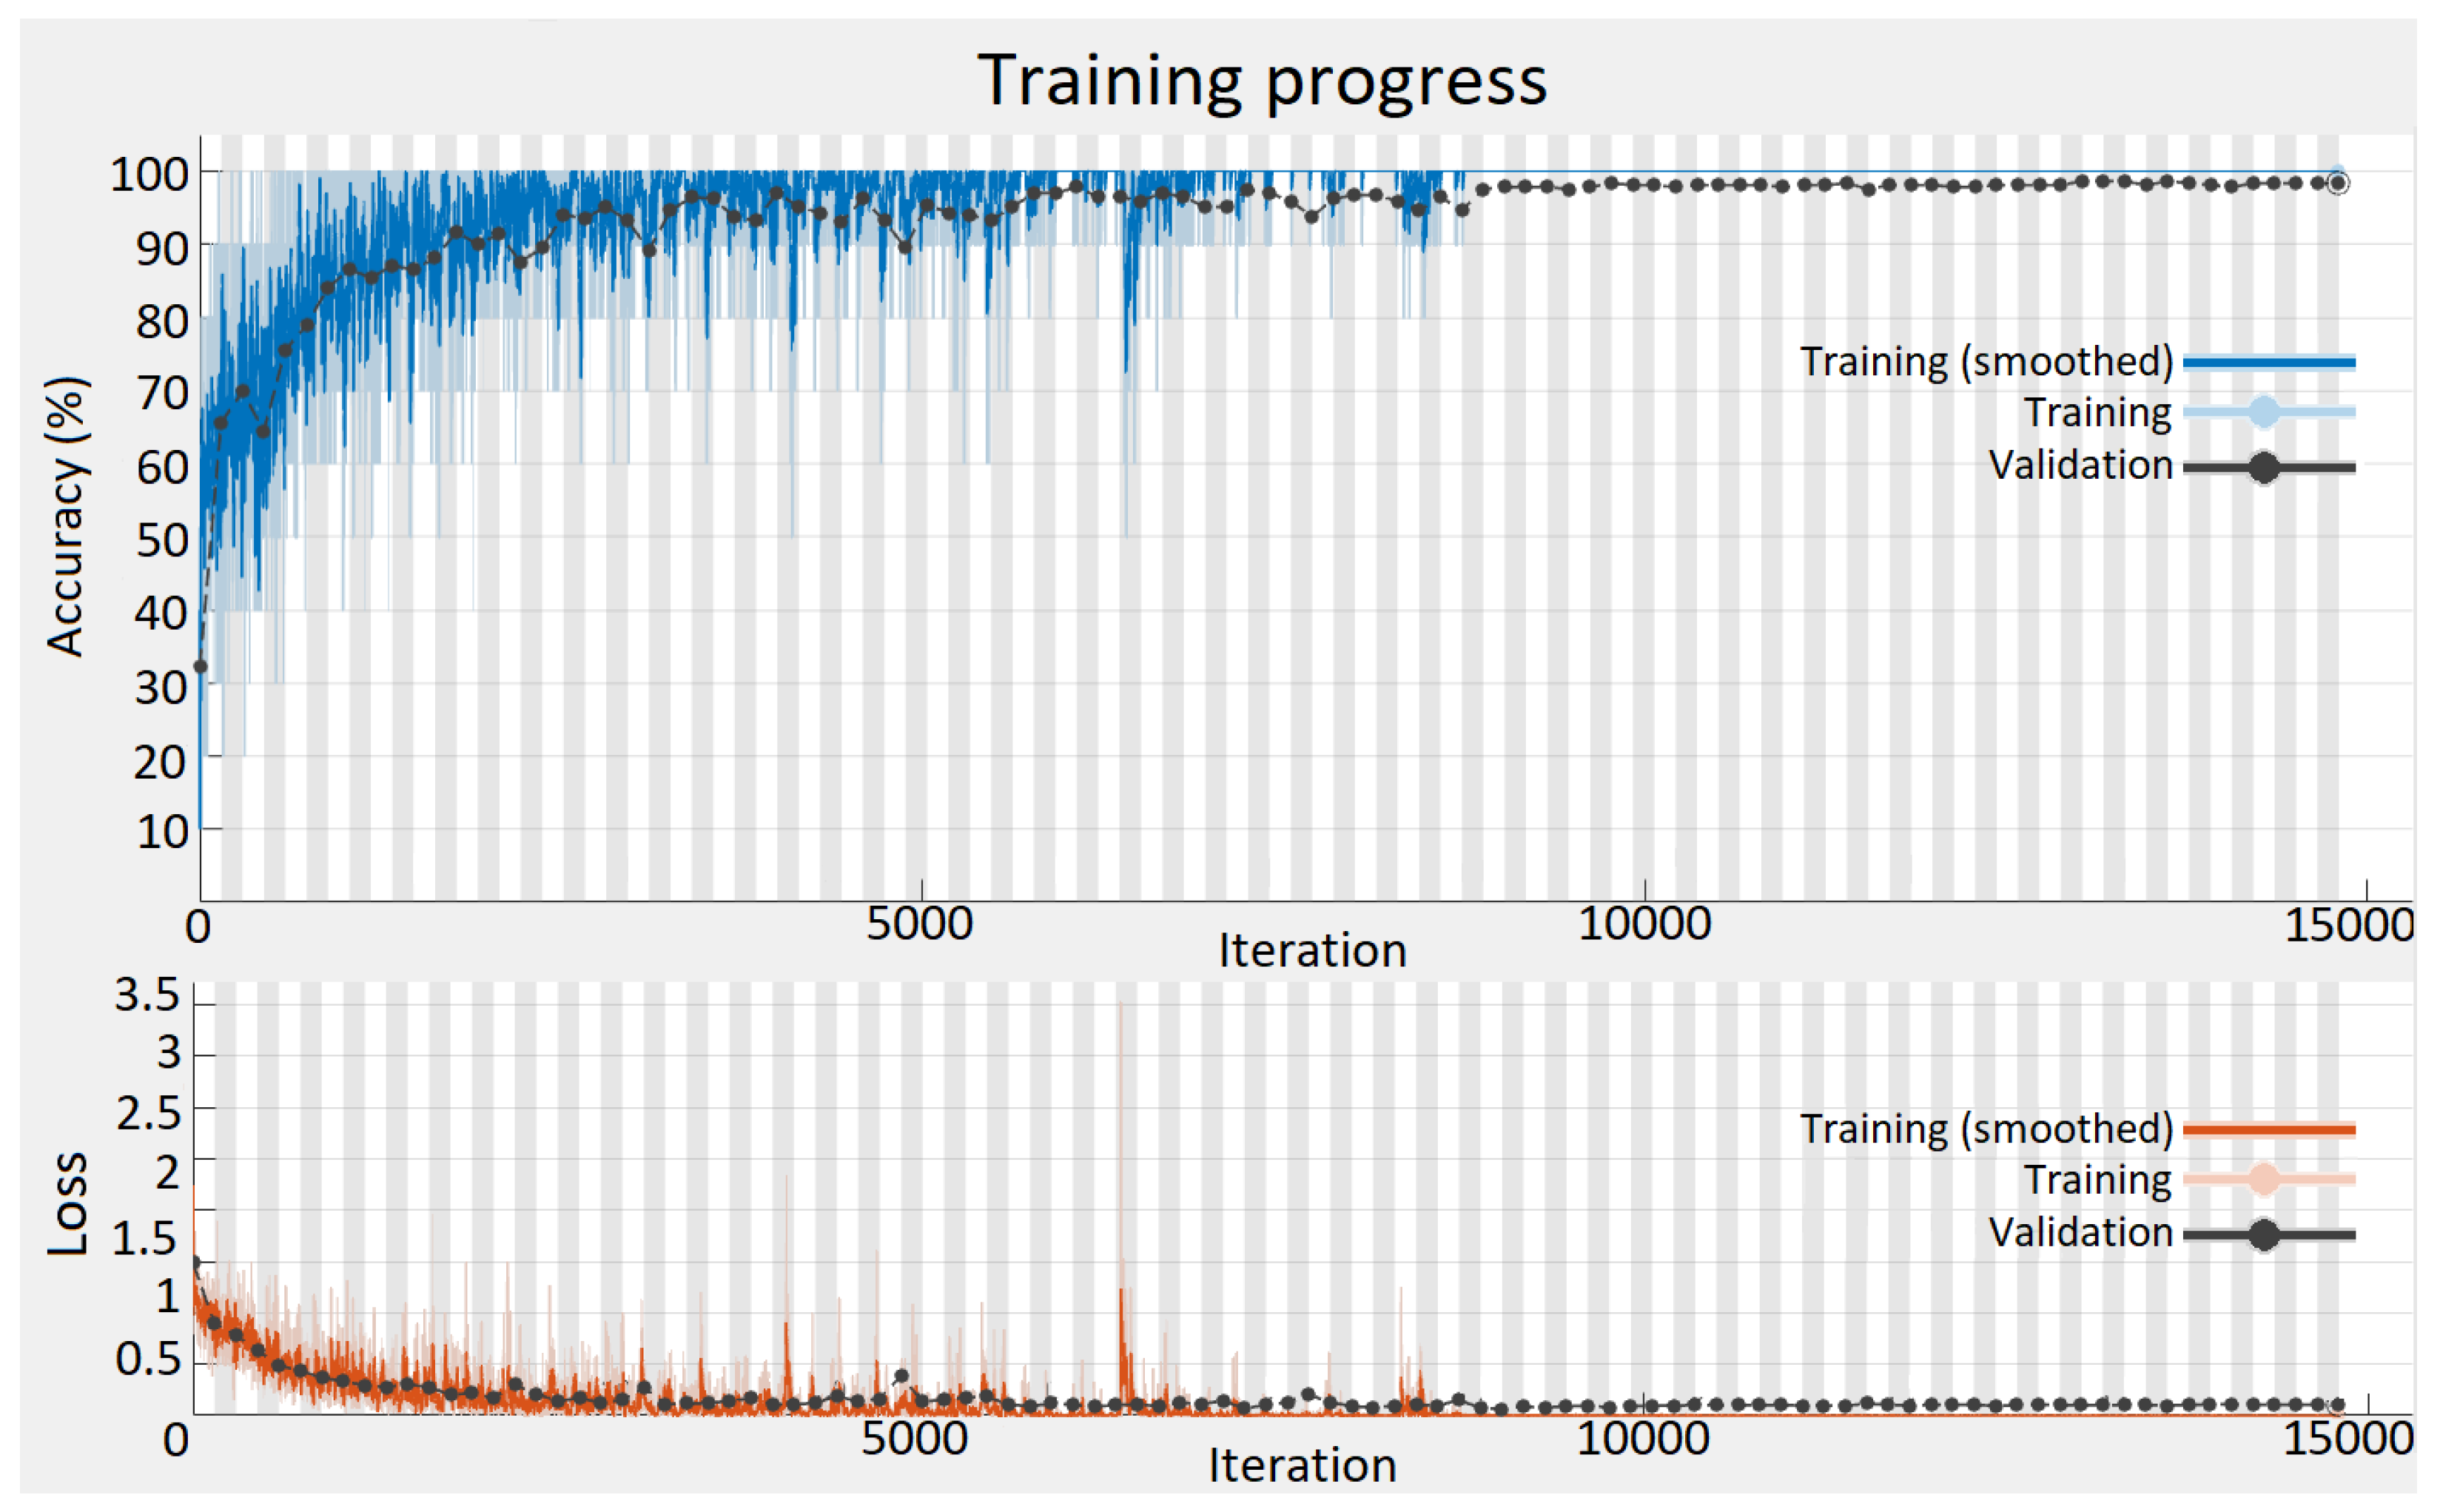
2.3. GoogleNet and SqueezeNet + Spectrograms
2.4. Hybrid Neural Network
2.4.1. SAE+FNN
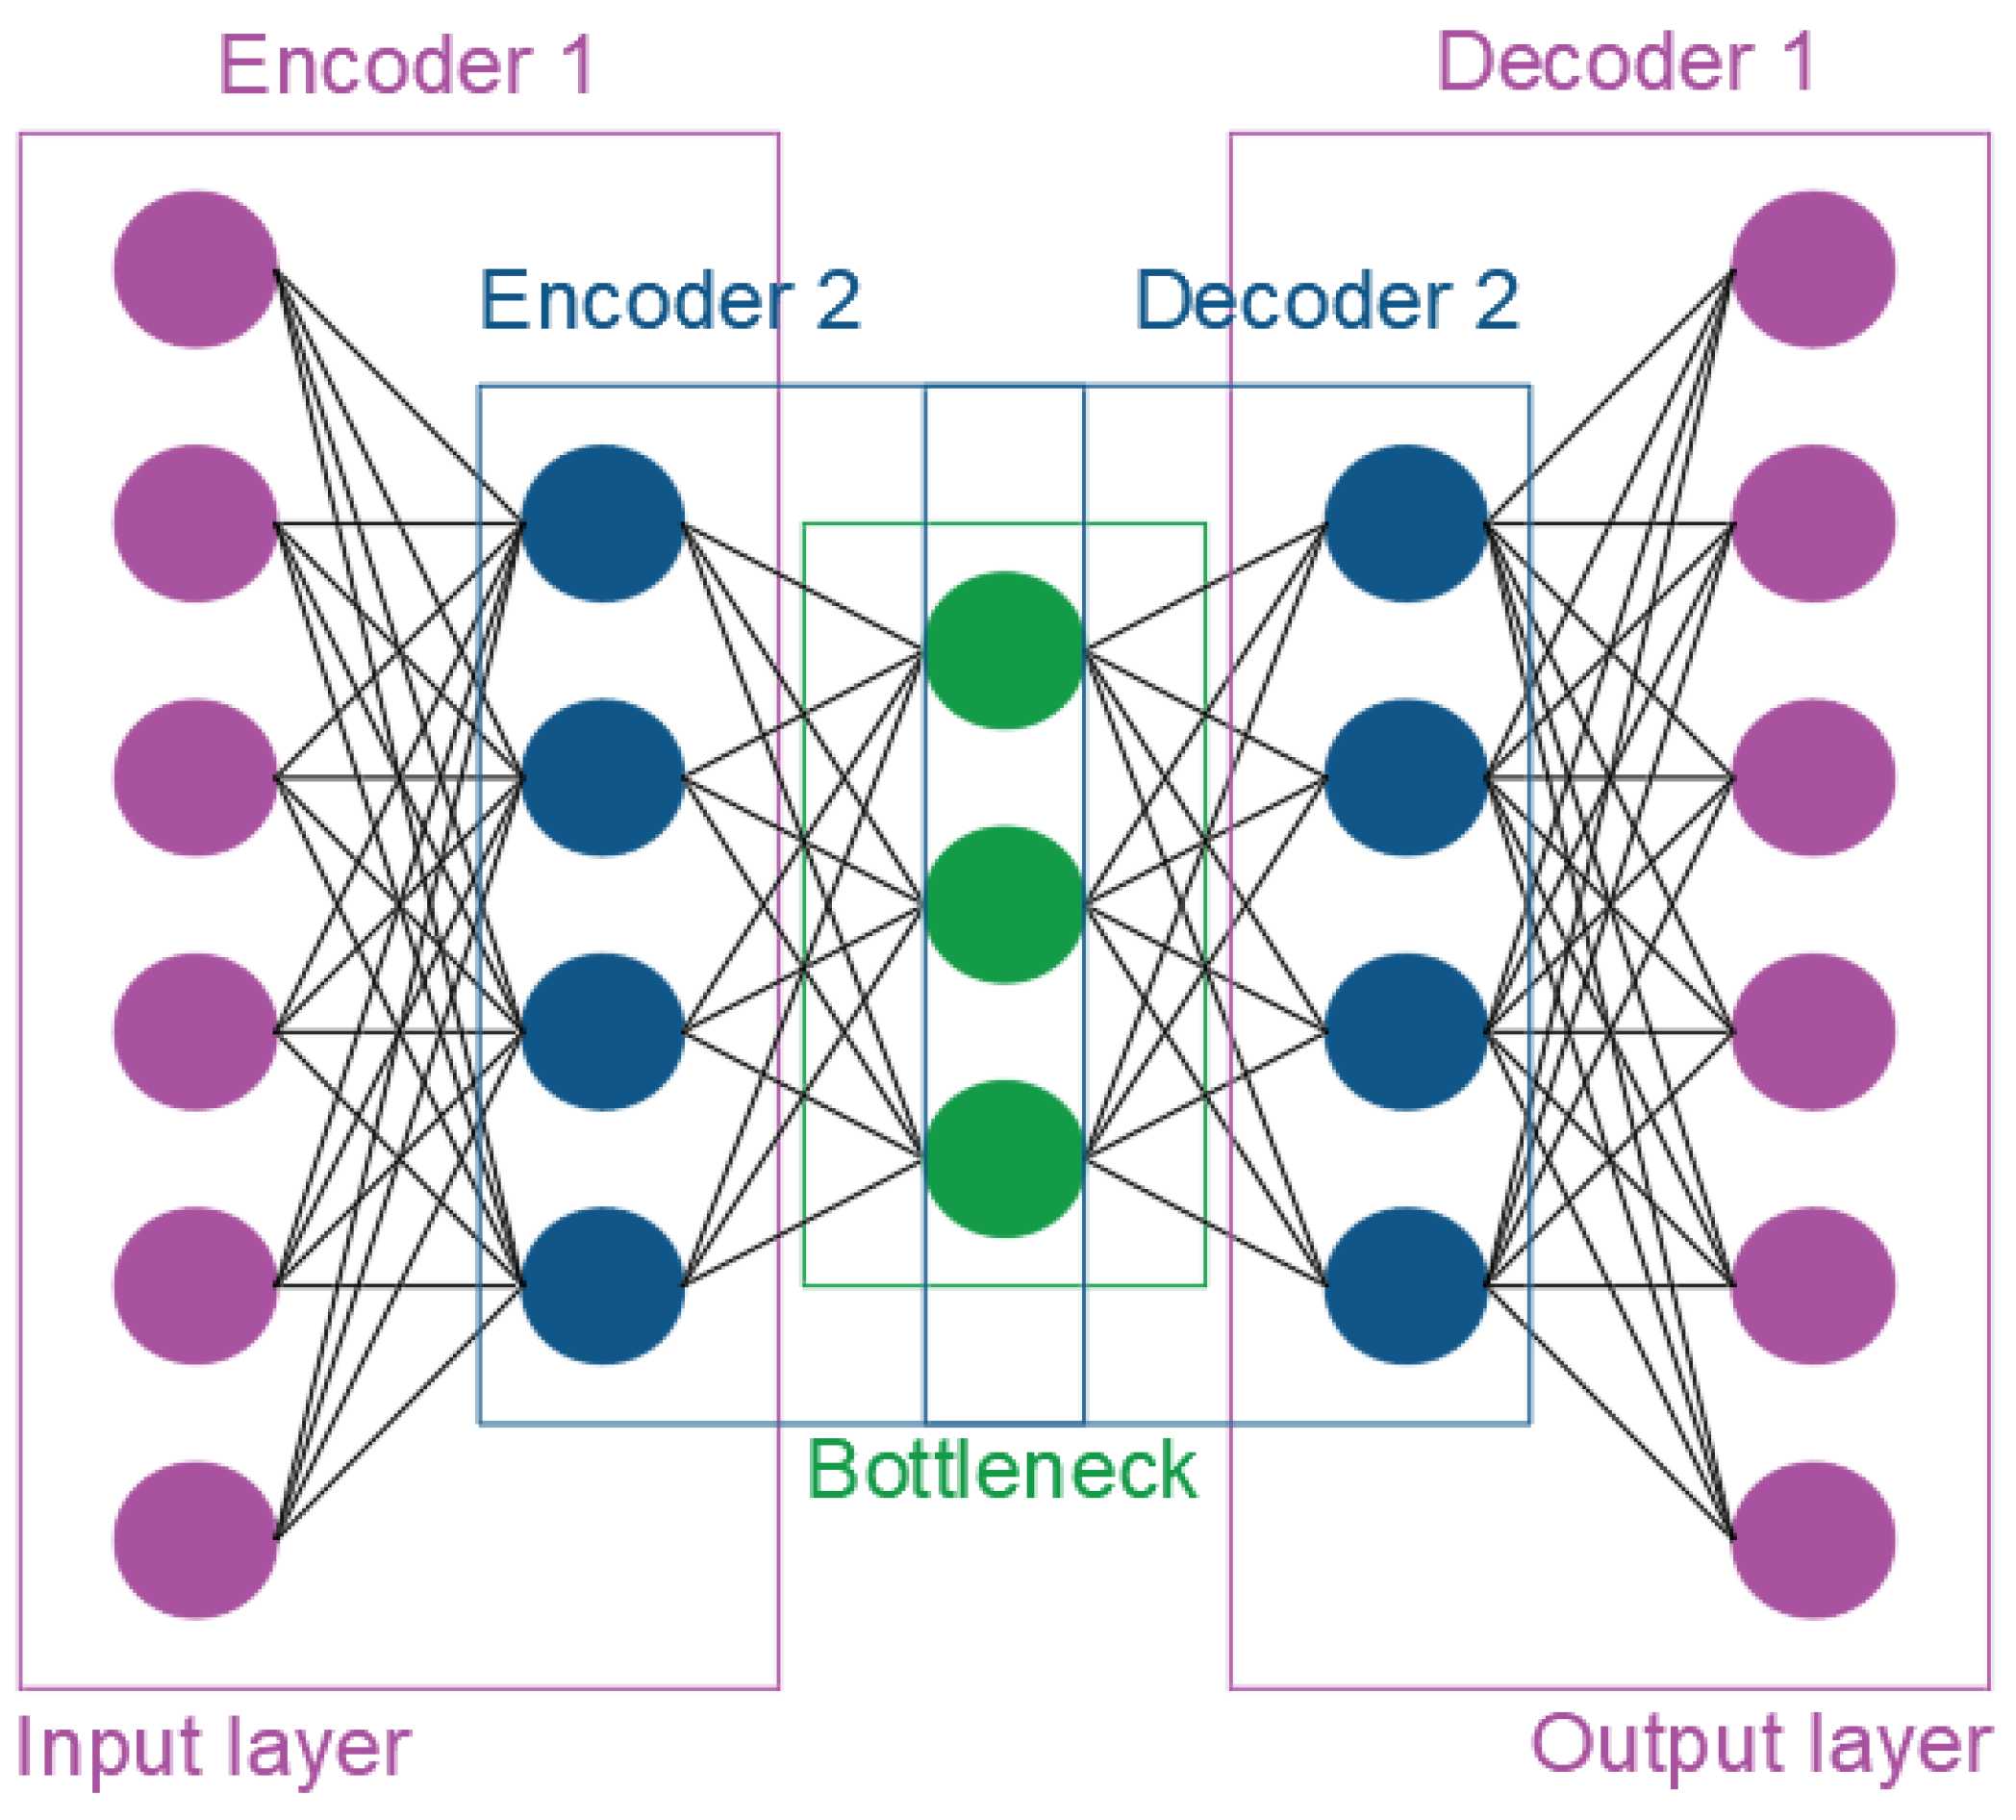
2.4.2. 2. D-CNN+LSTM

2.4.3. AE+1D-CNN+LSTM
3. Results and Discussion
4. Conclusions
Author Contributions
Funding
Data Availability Statement
Conflicts of Interest
References
- Subramaniam, A.; Sahoo, A.; Manohar, S.S.; Raman, S.J.; Panda, S.K. Switchgear Condition Assessment and Lifecycle Management: Standards, Failure Statistics, Condition Assessment, Partial Discharge Analysis, Maintenance Approaches, and Future Trends. IEEE Electrical Insulation Magazine 2021, 37, 27–41. [Google Scholar] [CrossRef]
- Hussain, G.A.; Zaher, A.A.; Hummes, D.; Safdar, M.; Lehtonen, M. Hybrid Sensing of Internal and Surface Partial Discharges in Air-Insulated Medium Voltage Switchgear. Energies (Basel) 2020, 13. [Google Scholar] [CrossRef]
- Zhou, X.; Wu, X.; Ding, P.; Li, X.; He, N.; Zhang, G.; Zhang, X. Research on Transformer Partial Discharge Uhf Pattern Recognition Based on Cnn-Lstm. Energies (Basel) 2019, 13. [Google Scholar] [CrossRef]
- Subramaniam, A.; Janaki Raman, S.; Kumar Panda, S. Comparison of Partial Discharge Signal in a Three Phase Transformer by UHF, TEV and HFCT Sensors; Comparison of Partial Discharge Signal in a Three Phase Transformer by UHF, TEV and HFCT Sensors. 2021. [CrossRef]
- Zhang, C.; Dong, M.; Ren, M.; Huang, W.; Zhou, J.; Gao, X.; Albarracín, R. Partial Discharge Monitoring on Metal-Enclosed Switchgear with Distributed Non-Contact Sensors. Sensors (Switzerland) 2018, 18. [Google Scholar] [CrossRef]
- Ji, K.H.; Xiao, J.X.; Li, W. Bin; Wang, X.F.; Song, P.; Si, W.R. Review of Partial Discharge Detection Technology for Transient Earth Voltage of HV Switchgear Cabinet. In Proceedings of the Proceedings - 2020 13th International Conference on Intelligent Computation Technology and Automation, ICICTA 2020; Institute of Electrical and Electronics Engineers Inc., October 1 2020; pp. 735–739.
- Montanari, G.C.; Ghosh, R.; Cirioni, L.; Galvagno, G.; Mastroeni, S. Partial Discharge Monitoring of Medium Voltage Switchgears: Self-Condition Assessment Using an Embedded Bushing Sensor. IEEE Transactions on Power Delivery 2022, 37, 85–92. [Google Scholar] [CrossRef]
- Ewaida, R.F.; Wani, N.R.; Khan, Y.; Al-Arainy, A.A. Defect Localization inside Simulated Mv Switchgear Based on Cumulative Energy Curve Using Transient Earth Voltage Sensors. Energies (Basel) 2021, 14. [Google Scholar] [CrossRef]
- Ren, M.; Dong, M.; Ren, Z.; Peng, H.D.; Qiu, A.C. Transient Earth Voltage Measurement in PD Detection of Artificial Defect Models in SF 6. IEEE Transactions on Plasma Science 2012, 40, 2002–2008. [Google Scholar] [CrossRef]
- Zhao, M.; Cao, X.; Zhou, K.; Fu, Y.; Li, X.; Wan, L. Flexible Sensor Array Based on Transient Earth Voltage for Online Partial Discharge Monitoring of Cable Termination. Sensors (Switzerland) 2020, 20, 1–15. [Google Scholar] [CrossRef]
- Florkowski, M. Classification of Partial Discharge Images Using Deep Convolutional Neural Networks. Energies (Basel) 2020, 13. [Google Scholar] [CrossRef]
- Mantach, S.; Ashraf, A.; Janani, H.; Kordi, B. A Convolutional Neural Network-Based Model for Multi-Source and Single-Source Partial Discharge Pattern Classification Using Only Single-Source Training Set. Energies (Basel) 2021, 14. [Google Scholar] [CrossRef]
- Wang, Y.B.; Chang, D.G.; Qin, S.R.; Fan, Y.H.; Mu, H.B.; Zhang, G.J. Separating Multi-Source Partial Discharge Signals Using Linear Prediction Analysis and Isolation Forest Algorithm. IEEE Trans Instrum Meas 2020, 69, 2734–2742. [Google Scholar] [CrossRef]
- Raymond, W.J.K.; Xin, C.W.; Kin, L.W.; Illias, H.A. Noise Invariant Partial Discharge Classification Based on Convolutional Neural Network. Measurement (Lond) 2021, 177. [Google Scholar] [CrossRef]
- Uckol, H.I.; Ilhan, S.; Ozdemir, A. Workmanship Defect Classification in Medium Voltage Cable Terminations with Convolutional Neural Network. Electric Power Systems Research 2021, 194. [Google Scholar] [CrossRef]
- Raymond, W.J.K.; Azil Illias, H.; Mokhlis, H. Novel Data Augmentation for Improved Insulation Fault Diagnosis under Nonideal Condition. Expert Syst Appl 2022, 209. [Google Scholar] [CrossRef]
- Davari, N.; Akbarizadeh, G.; Mashhour, E. Corona Detection and Power Equipment Classification Based on GoogleNet-AlexNet: An Accurate and Intelligent Defect Detection Model Based on Deep Learning for Power Distribution Lines. IEEE Transactions on Power Delivery 2022, 37, 2766–2774. [Google Scholar] [CrossRef]
- Barrios, S.; Buldain, D.; Comech, M.P.; Gilbert, I.; Orue, I. Partial Discharge Classification Using Deep Learning Methods - Survey of Recent Progress. Energies (Basel) 2019, 12. [Google Scholar] [CrossRef]
- Barrios, S.; Buldain, D.; Comech, M.P.; Gilbert, I. Partial Discharge Identification in MV Switchgear Using Scalogram Representations and Convolutional AutoEncoder. IEEE Transactions on Power Delivery 2021, 36, 3448–3455. [Google Scholar] [CrossRef]
- Classify Time Series Using Wavelet Analysis and Deep Learning - MATLAB & Simulink Example. Available online: https://www.mathworks.com/help/deeplearning/ug/classify-time-series-using-wavelet-analysis-and-deep-learning.html (accessed on 10 April 2023).
- Alsumaidaee, Y.A.M.; Yaw, C.T.; Koh, S.P.; Tiong, S.K.; Chen, C.P.; Ali, K. Review of Medium-Voltage Switchgear Fault Detection in a Condition-Based Monitoring System by Using Deep Learning. Energies (Basel) 2022, 15. [Google Scholar] [CrossRef]
- Zemouri, R.; Levesque, M.; Amyot, N.; Hudon, C.; Kokoko, O.; Tahan, S.A. Deep Convolutional Variational Autoencoder as a 2D-Visualization Tool for Partial Discharge Source Classification in Hydrogenerators. IEEE Access 2020, 8, 5438–5454. [Google Scholar] [CrossRef]
- Thi, N.D.T.; Do, T.D.; Jung, J.R.; Jo, H.; Kim, Y.H. Anomaly Detection for Partial Discharge in Gas-Insulated Switchgears Using Autoencoder. IEEE Access 2020, 8, 152248–152257. [Google Scholar] [CrossRef]
- Lu, S.; Chai, H.; Sahoo, A.; Phung, B.T. Condition Monitoring Based on Partial Discharge Diagnostics Using Machine Learning Methods: A Comprehensive State-of-the-Art Review. IEEE Transactions on Dielectrics and Electrical Insulation 2020, 27, 1861–1888. [Google Scholar] [CrossRef]
- Zhou, X.; Wu, X.; Ding, P.; Li, X.; He, N.; Zhang, G.; Zhang, X. Research on Transformer Partial Discharge Uhf Pattern Recognition Based on Cnn-Lstm. Energies (Basel) 2019, 13. [Google Scholar] [CrossRef]
- Liu, T.; Yan, J.; Wang, Y.; Xu, Y.; Zhao, Y. Gis Partial Discharge Pattern Recognition Based on a Novel Convolutional Neural Networks and Long Short-term Memory. Entropy 2021, 23. [Google Scholar] [CrossRef]
- Li, Z.; Qu, N.; Li, X.; Zuo, J.; Yin, Y. Partial Discharge Detection of Insulated Conductors Based on CNN-LSTM of Attention Mechanisms. Journal of Power Electronics 2021, 21, 1030–1040. [Google Scholar] [CrossRef]
- Li, G.; Wang, X.; Li, X.; Yang, A.; Rong, M. Partial Discharge Recognition with a Multi-Resolution Convolutional Neural Network. Sensors (Switzerland) 2018, 18. [Google Scholar] [CrossRef] [PubMed]
- Mohammed Alsumaidaee, Y.A.; Yaw, C.T.; Koh, S.P.; Tiong, S.K.; Chen, C.P.; Yusaf, T.; Abdalla, A.N.; Ali, K.; Raj, A.A. Detection of Corona Faults in Switchgear by Using 1D-CNN, LSTM, and 1D-CNN-LSTM Methods. Sensors 2023, 23, 3108. [Google Scholar] [CrossRef] [PubMed]
- Nguyen, M.T.; Nguyen, V.H.; Yun, S.J.; Kim, Y.H. Recurrent Neural Network for Partial Discharge Diagnosis in Gas-Insulated Switchgear. Energies (Basel) 2018, 11. [Google Scholar] [CrossRef]
- Duan, L.; Hu, J.; Zhao, G.; Chen, K.; He, J.; Wang, S.X. Identification of Partial Discharge Defects Based on Deep Learning Method. IEEE Transactions on Power Delivery 2019, 34, 1557–1568. [Google Scholar] [CrossRef]
- Kluge, P.; Lasica, A. Non-Invasive PD Measurement Method in Air-Insulated Switchgear - Signal Processing. In Proceedings of the 2022 23rd International Conference on Computational Problems of Electrical Engineering, CPEE 2022; Institute of Electrical and Electronics Engineers Inc., 2022.
- Szegedy, C.; Liu, W.; Jia, Y.; Sermanet, P.; Reed, S.; Anguelov, D.; Erhan, D.; Vanhoucke, V.; Rabinovich, A. Going Deeper with Convolutions. In Proceedings of the Proceedings of the IEEE Computer Society Conference on Computer Vision and Pattern Recognition; IEEE Computer Society, October 14 2015; Vol. 07-12-June-2015, pp. 1–9.
- Iandola, F.N.; Han, S.; Moskewicz, M.W.; Ashraf, K.; Dally, W.J.; Keutzer, K. SqueezeNet: AlexNet-Level Accuracy with 50x Fewer Parameters and <0.5MB Model Size. 2016.
- Keras: Deep Learning for Humans. Available online: https://keras.io/ (accessed on 17 April 2023).
- TensorFlow. Available online: https://www.tensorflow.org/ (accessed on 17 April 2023).
| SAE+FNN | 2D-CNN + LSTM | AE + 1D-CNN + LSTM |
|---|---|---|
| Encoder(100) | 2DConv(64) | Encoder(1984) |
| Decoder | BatchNormalization | Dense(RELU) |
| Encoder(50) | Activation(RELU) | Dense(Sigmoid) |
| Decoder | 2DConv(64) | Decoder |
| fullyConnectedLayer(256) | BatchNormalization | 1DConv(128-RELU) |
| RELULayer | Activation(RELU) | BatchNormalization |
| fullyConnectedLayer(128) | GlobalAveragePooling2D | MaxPooling |
| RELULayer | Drop-out | 1DConv(64-RELU) |
| fullyConnectedLayer(64) | LSTM(200) | BatchNormalization |
| RELULayer | Flatten | MaxPooling |
| fullyConnectedLayer(4) | Dense(4)(SoftMax) | Drop-out |
| SoftMaxLayer | LSTM(256) | |
| ClassificationLayer | Drop-out | |
| LSTM(128) | ||
| Drop-out | ||
| Dense(4)(SoftMax) |
| Neural Network | Class | Recall | Precision | F1-Score |
|---|---|---|---|---|
| GoogleNet | 1 | 90.42% | 93.91% | 92.09% |
| 2 | 97.15% | 96.42% | 98.97% | |
| 3 | 97.18% | 98.88% | 97.92% | |
| 4 | 93.57% | 94.47% | 95.34% | |
| 5 | 100% | 100% | 100% | |
| SqueezeNet | 1 | 94.64% | 97.65% | 96.15% |
| 2 | 99.78% | 98.43% | 99.53% | |
| 3 | 98.48% | 99.91% | 99.04% | |
| 4 | 99.98% | 99.49% | 98.19% | |
| 5 | 100% | 100% | 100% | |
| SAE + FNN | 1 | 54.72% | 48.12% | 56.16% |
| 2 | 51.98% | 49.78% | 55.65% | |
| 3 | 83.84% | 83.65% | 84.11% | |
| 4 | 79.12% | 83.21% | 85.24% | |
| 5 | 100% | 100% | 100% | |
| CNN + LSTM | 1 | 68.12% | 73.44% | 70.68% |
| 2 | 83.33% | 79.44% | 81.35% | |
| 3 | 55.17% | 94.12% | 69.57% | |
| 4 | 97.39% | 74.12% | 84.21% | |
| 5 | 100% | 100% | 100% | |
| AE+CNN+LSTM | 1 | 52.72% | 56.72% | 54.29% |
| 2 | 67.37% | 65.31% | 66.32% | |
| 3 | 81.25% | 90.28% | 85.53% | |
| 4 | 89.52% | 89.52% | 85.71% | |
| 5 | 100% | 100% | 100% |
| Neural Network | Accuracy |
|---|---|
| GoogleNet | 97.31%. |
| SqueezeNet | 98.39% |
| SAE+FNN | 80.98% |
| CNN+LSTM | 83.91%. |
| AE+CNN+LSTM | 81.21%. |
Disclaimer/Publisher’s Note: The statements, opinions and data contained in all publications are solely those of the individual author(s) and contributor(s) and not of MDPI and/or the editor(s). MDPI and/or the editor(s) disclaim responsibility for any injury to people or property resulting from any ideas, methods, instructions or products referred to in the content. |
© 2023 by the authors. Licensee MDPI, Basel, Switzerland. This article is an open access article distributed under the terms and conditions of the Creative Commons Attribution (CC BY) license (http://creativecommons.org/licenses/by/4.0/).


