Preprint
Article

Loose Belt Fault Detection and Virtual Flow Meter Development Using Identified Data-driven Energy Model for Fan Systems

Altmetrics

Downloads

111

Views

53

Comments

0

A peer-reviewed article of this preprint also exists.

Submitted:

12 June 2023

Posted:

13 June 2023

You are already at the latest version

Alerts
Abstract
An energy model that correlates fan airflow, head, speed, and system power input is essential to detect device faults and optimize control strategies in fan systems. Since the application of variable frequency drives (VFDs) makes the motor efficiency data published by manufacturers inapplicable, the fan efficiency and drive (belt-motor-VFD) efficiency must be identified for each individual system to obtain accurate energy models. The objectives of this paper are to identify an energy model of existing VFD-motor-fan systems using available experimental data and demonstrate its applications in loose belt fault detection and virtual airflow meter development for optimal control. First, an approach is developed to identify the fan head, fan efficiency and drive efficiency curves using available fan head, speed, and system power input as well as temporarily measured airflow rate without measuring shaft power. Then the energy model is identified for an existing VFD-motor-fan system. Finally, the identified model is applied to detect the slipped belt faults and develop the virtual airflow meter. The experiment results reveal that the developed approach can effectively obtain the energy model of VFD-motor-fan systems and the model can be applied to effectively detect slipped belt faults and accurately calculate the fan airflow rate.
Keywords: 
Subject: Engineering  -   Mechanical Engineering

1. Introduction

Electric motor-driven fans in Heating, Ventilation, and Air Conditioning (HVAC) systems account for about 7% of the primary energy usage in commercial buildings in the United States (U.S.) [1]. Since faulty or inefficient operations can lead to energy consumption 15% to 30% greater than optimal fault-free operation in HVAC systems [2], it is critical to detect device operation faults and optimize control strategies for the energy efficiency of electric motor-driven fan systems [3].

1.1. Loose Belt Faults and Virtual Airflow Meters for Optimal Control

Belt wear is one common fault in fan systems which can lead to efficiency and performance problems. As belt slippage increases, motors cannot translate required shaft power to fans through a slipped belt [4]. On the other hand, optimal controls, such as duct static pressure control [5], building pressure control [6], outdoor air control [6,7], and cooling demand control [8], all require the airflow measurement at air handling units (AHUs). Unfortunately, physical airflow meters are not typically installed at AHUs due to space and cost limitations. Virtual fan airflow meters that determine the airflow rate using other measurable variables, such as fan head, speed, and power, are recommended to overcome the limitations of physical flow meters. A comprehensive energy model, which covers all the components in electric motor-driven fan systems, is required to detect loose belt faults and develop virtual fan airflow meters.

1.2. Configuration of Fan Systems

Figure 1 shows a schematic of an electric motor-driven fan system, which includes all the basic components. Besides the fan, the motor is a key component, which functions as a bridge to connect the mechanical components to power grids and converts the electrical energy from power grids to mechanical energy to the fan. The motor mechanical power output is also called the motor load and shaft power. Most of the electric motors in fan systems are alternating current (AC) three-phase induction motors and the AC induction motor speed is approximately proportional to the frequency (f) of power supply [9].
A belt typically connects the fan and motor to transfer the motor shaft power to the fan shaft power ( W s h ) to form the airflow (Q) through the fan under demanded fan head (H) in most fan systems. The fan speed (ω) is proportional to the motor speed with a fixed speed ratio, which is inversely proportional to the pulley diameter ratio between the fan and motor.
Seasonal changes in weather and daily schedules of occupants and plug loads make the space cooling load as well as the required fan airflow more dynamic in commercial buildings. According to the affinity laws, the fan shaft power is proportional to the fan speed cubed and the fan airflow rate is proportional to the fan speed [4,10]. Thus, it is more energy efficient to reduce the fan speed than to close dampers at partial load conditions. Therefore, AC induction motors are often paired with variable frequency drives (VFDs) to significantly reduce the fan system power by adjusting VFD output frequency (f) under partial load conditions [4]. So the fan speed (ω), motor speed, and VFD output frequency (f) are proportional and exchangeable in this paper.
Thus, with the application of a VFD, a fan system becomes a VFD-motor-fan system that comprises of a fan and its drive system, including a belt, a motor, and a VFD. The energy model needs to be developed based on the fan and its drive system.

1.3. Energy Model of Fan Systems and Demand for Identification

As a mechanical component, the energy model of a fan is relatively straightforward and basically defined by the fan head-airflow curve and the fan shaft power-airflow curve at a full design speed. Then the affinity laws are applied to obtain the fan head and shaft power curves at any speed other than the full design speed [4,10]. The fan efficiency is defined as the ratio of the product of the flow rate and head to the fan shaft power. Alternatively, the fan shaft power-airflow curve can be replaced by either the fan efficiency curve or the fan shaft power-head curve. As a result, two of the four fan curves are dependent, and the fan energy model can be determined by any two of these four fan curves. In this paper, the fan head-airflow curve and the fan efficiency curve are identified first and are applied to obtain the other two curves.
On the hand hand, the energy model of a drive system is simply defined by the drive efficiency, the ratio of the fan shaft power ( W s h ) to the system power input ( W s y s ), which is a product of three efficiencies of a belt, a motor, and a VFD. The belt efficiency is defined as the ratio of the fan shaft power to the motor shaft power, the motor efficiency is defined as the ratio of the motor shaft power to the motor power input, and the VFD efficiency is defined as the ratio of the system power input to the VFD to the VFD ouput power to the motor, which is also the motor power input. Among them, the motor and VFD are electrical components and traditionally, motor and VFD efficiency curves are not well understood by HVAC engineers and furthermore the application of VFDs make the motor efficiency more complicated.
Induction motors are initially designed to be powered by power grids, which provide pure sinusoidal power with constant rated voltage and frequency. As a result, the motor efficiency is only impacted by the motor shaft power. IEEE Standard 112 is used for testing the efficiency of induction motors in the U.S.[11]. The standard clearly states the motor efficiency testing condition that the power supply should be a sinusoidal waveform with constant rated voltage and frequency. Currently most motor manufacturers provide motor efficiency data at various motor loads under this standard testing condition [12].
When a motor is powered by a VFD, the VFD output power to the motor is the pulse width modulation (PWM) power at variable voltage and frequency, which is significantly different from the sinusoidal power in power grids and makes the motor efficiency data published by manufacturers inapplicable for VFD-motor-fan systems [4]. Both the motor equivalent circuit theory [9,13] and available experimental data [14,15,16,17] revealed that the motor efficiency associated with VFDs is a function of not only motor shaft power but also VFD output frequency and voltage. Ignoring the PWM and variable voltage impacts can underestimate the motor efficiency by 10-25%[18].
VFDs, as electrical devices, consume energy by the semiconductor components residing in control circuits, which can be reflected by the VFD efficiency. The U.S. Department of Energy [19] presented the VFD efficiency data as a function of the VFD output power, which is also the motor power input. Meanwhile, some VFD manufacturers provided VFD efficiency data as a function of both the VFD output power and frequency [20].
Overall, the drive efficiency is theoretically impacted by three influencing factors, the fan shaft power, VFD output voltage and frequency. Thus, it is hard to regress the complicated drive efficiency function with three influencing factors. On the other hand, the three factors are correlated in a VFD-motor-fan system. Most VFDs on the market provide different voltage-frequency (V/f) ratio controls. The squared ratio controls the voltage to be proportional to the square of the frequency, which is recommended for centrifugal fans. Moreover, the motor load is approximately proportional to the cube of the motor speed, which is proportional to the VFD output frequency, for centrifugal fans. Thus, the drive efficiency can be simplified as a function of the fan speed or VFD output power by consolidating three influencing factors.
Due to the lack of available motor efficiency data for VFD-motor-fan systems, the drive efficiency curve along with the fan head and efficiency curves need to be identified for existing fan systems individually.

1.4. Challenges to Identify the Energy Model

The available operation parameters in a VFD-motor-fan/pump system determine the identification approach of fan system energy models. In general, the VFD output frequency (f) can be obtained from the VFD, the fan head (H) can be measured by a differential pressure (DP) transducer, the system power input to the VFD ( W s y s ), can be measured by a conventional power meter, and the airflow rate (Q) can be measured by multiple air velocity probes traversing supply air ducts. On the other hand, the fan shaft power cannot be measured in existing systems since it is impossible to install torque sensors. The fan head-airflow can be readily identified with the available fan airflow, head, and speed. However, the challenge is to identify the motor efficiency and fan efficiency simultaneously without measuring the fan shaft power, which needs to be overcome in this paper.

1.5. Objectives

In summary, the fan energy model can be defined by the fan head-airflow curve and the fan efficiency curve, while the drive system model can be defined by the drive efficiency-fan speed curve. Thus, the fan head, speed, airflow rate, shaft power, and system power input are involved in modeling VFD-motor-fan systems. Among them, the fan speed, fan head, system power input, and fan airflow rate are measurable in existing VFD-motor-fan systems. The major challenge is that the fan shaft power is difficult to measure. Consequently, the direct identification of the fan efficiency curve and drive efficiency curve is not realistic.
The objectives of this paper are to identify an energy model of existing VFD-motor-fan systems using available experimental data and demonstrate its applications in loose belt fault detection and virtual airflow meter development for optimal control. First, an identification approach is developed to identify the fan head and efficiency curves and drive efficiency curves using available fan head, speed, and system power input as well as temporarily measured airflow rate. Then the energy model is identified for an existing VFD-motor-fan system with a design airflow of 1,200L/s using the developed approach. Finally, the identified model is applied to detect the slipped belt faults and develop the virtual airflow meter for potential optimal AHU control with the measurements of fan head, speed, and system power input.

2. Theory and Identification Approach

In this section, two basic fan performance curves, including the fan head-airflow curve and the fan shaft power-airflow curve, are defined and the resultant fan head-shaft power curve is derived at the full design speed. Then the fan performance curves at variable speeds and various speed-independent fan efficiency curves are derived using the affinity laws. Next, the speed-dependent drive efficiency curve is defined based on the previous consolidation discussion. Finally, an identification approach is developed to identify the fan efficiency curve and the drive efficiency curve without measuring fan shaft power.

2.1. Fan Performance Curves at the Full Design Speed

The energy model of a fan is basically defined by two curves, which are the fan head-airflow rate curve and shaft power-airflow rate curve, at the full design speed. Both curves can be expressed as a function of the fan airflow rate:
H d = f H Q ( Q d )
W s h , d = f W Q ( Q d )
where H d , W s h , d , and Q d are the fan head, shaft power, and airflow rate at the full design speed, respectively.
Furthermore, the fan head-shaft power curve can be derived based on these two basic performance curves.
H d = f H W ( W s h , d )

2.2. Affinity Laws

The affinity laws state that the fan airflow rate is proportional to the fan speed, the fan head is proportional to the fan speed squared, and the fan shaft power is proportional to the fan speed cubed. If the fan speed ( ω ) is written in a relative value with respect to the full design speed, the affinity laws can be expressed as:
Q d = Q ω
H d = H ω 2
W s h , d = W s h ω 3
First, the affinity laws are applied to transfer the fan performance curves at the full design speed ( ω =1) to the fan performance curves at any speed, ω , and vice versa.
H = ω 2 f H Q ( Q ω )
W s h = ω 3 f W Q ( Q ω )
H = ω 2 f H W ( W s h ω 3 )
Equation (5) will be applied to directly identify the basic fan head-airflow curve at the full design speed using fan airflow, head, and speed, Equation (6) will be applied to create the basic fan shaft power-airflow curve at the full design speed afterwards while Equation (7) will be applied to detect the loose belt faults using fan head, shaft power and speed.
Second, the affinity laws are applied to obtain the fan efficiency functions independent of the fan speed in Equations (8) and (9).
η f a n = Q H W s h = f H & Q H Q 2
η f a n = Q H W s h = f W & H W s h H 1.5
The fan efficiency in Equation (8) is a function of the ratio of the fan head to airflow rate squared, which is impacted by damper positions, and plays a key role to separate the drive efficiency and fan efficiency without measuring the fan shaft power for the model identification. The fan efficiency in Equation (9) is a function of the ratio of the fan shaft power to fan head to the power of 1.5 and plays a key role to detect the loose belt faults and develop the virtual fan airflow meter where the fan airflow is not available.

2.3. Drive Efficiency and System Efficiency

After the consolidation, the drive efficiency can be expressed as a function of the fan speed.
η d r i v e = W s h W s y s = f d r i v e ( ω )
During the identification process, the fan shaft power is not available. As result, the fan efficiency that correlates the available fan airflow and head to the fan shaft power and the drive efficiency that correlates the available system power input to the fan shaft power cannot be directly identified without fan shaft power.
The system efficiency ( η s y s ), is defined as the ratio of the product of the flow rate and head to the system power input and is the product of the fan efficiency and drive efficiency.
η s y s = Q H W s y s = η d r i v e · η f a n = f d r i v e ( ω )   f H & Q H Q 2
First, with the available fan airflow rate, head and system power input, the system efficiency is always available. Second, two uncorrelated efficiency functions, the speed-dependent drive efficiency function, and the speed-independent fan efficiency function, can be applied to separate the fan efficiency and drive efficiency from the available system efficiency.

2.4. Identification Approach

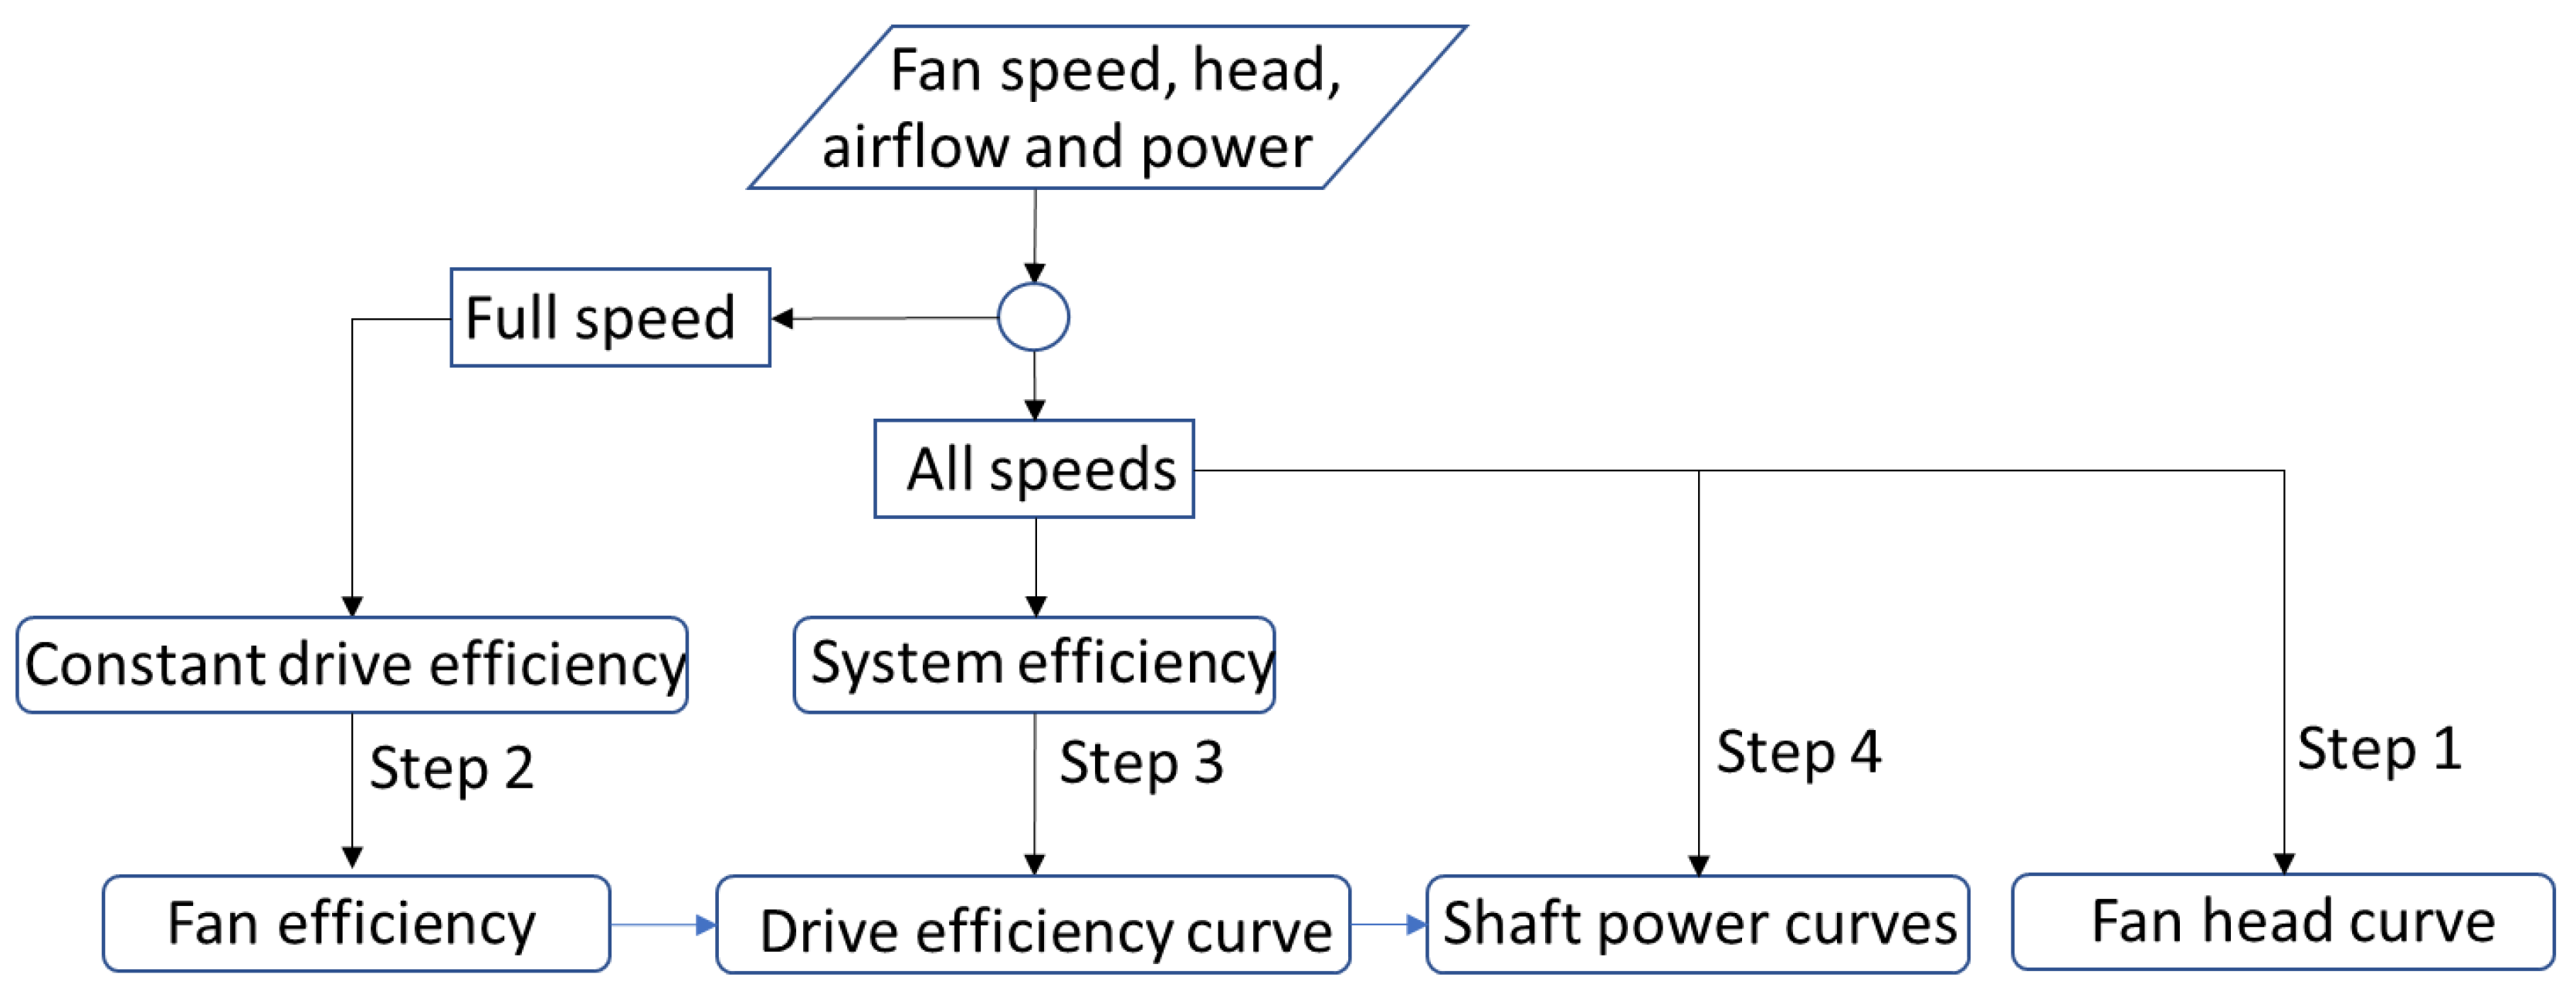
Figure 2 shows the flow chart of the four-step identification approach.
Step 1: Fan head curve at the full design speed
The fan head curve at the full design speed is directly obtained by measuring the fan speed, head, and airflow rate at all the speeds and applying the affinity laws, defined by Equations (4a) and (4b). The intention to use the data at all the speeds is to make a fan head curve at the full design speed with a wider airflow range.
Step 2: Fan efficiency function
Since the fan shaft power is not measurable, it must be converted from the measured system power input using the drive efficiency. The fan efficiency needs to be determined first and then applied to separate the drive efficiency from the system efficiency, which can be directly obtained without measuring the fan shaft power.
If the fan efficiency is expressed as a function of the ratio of the fan head to the airflow rate squared, as shown in Equation (8), the fan efficiency is independent with the fan speed. Consequently, the fan efficiency curve can be identified using the performance data at the full design speed only.
Since the drive efficiency is a function of the fan speed, the drive efficiency at the full design speed is an unknown constant. Thus, the system efficiency at the full design speed becomes the product of the fan efficiency and the unknown constant drive efficiency and is defined as the equivalent fan efficiency ( η f a n , e ) that is defined by Equation (12). The equivalent fan efficiency curve can be regressed using the measured fan airflow rate, head, and system power input at the full design speed:
η s y s @ ω = 1 = Q H W s y s = η d r i v e ( 1 ) · η f a n ( H Q 2 ) = η f a n , e ( H Q 2 )
Step 3: Drive efficiency function
The equivalent fan efficiency curve is then applied to obtain the drive efficiency versus fan speed curve by using the performance data at all fan speeds.
η d r i v e ω = Q H η f a n ( H Q 2 ) W s y s = Q H · η d r i v e ( 1 ) η f a n , e ( H Q 2 ) W s y s
To consolidate the unknown constant drive efficiency at the full design speed in Equation (13), the equivalent drive efficiency is defined as the ratio of the drive efficiency at any fan speed to the drive efficiency at the full design speed. Thus, the equivalent drive efficiency curve ( η d r i v e , e ) can be regressed using the measured fan airflow rate, head, and system power input at all fan speeds as well as the identified equivalent fan efficiency curve, Equation (12), in Step 2.
η d r i v e , e ω = η d r i v e ω η d r i v e 1 = Q H η f a n , e H Q 2 W s y s
According to equations (12) and (14), the equivalent fan efficiency and equivalent drive efficiency can be identified without measuring the fan shaft power. More importantly, even though they are not true fan efficiency and true drive efficiency, the product of them is the true system efficiency, which can correlate the measurable fan head and airflow rate to the measurable system power input.
η f a n , e ( H Q 2 ) η d r i v e , e ω = η s y s = Q H W s y s
As a result, the challenge with unmeasurable fan shaft power is solved by:
  • Using the available system efficiency
  • Defining the equivalent fan efficiency and equivalent drive efficiency.
  • Expressing them by two uncorrelated functions, the equivalent fan efficiency function of the ratio of fan head to airflow rate squared and the equivalent drive efficiency function of the fan speed, to separate the equivalent fan efficiency and equivalent drive efficiency from the system efficiency.
Step 4: Fan shaft power curve at the full design speed
According to Equation (11), the fan shaft power ( W s h ) at all fan speeds can be calculated from the measured system power input ( W s y s ) along with the drive efficiency curve ( η d r i v e ), which is the product of the equivalent drive efficiency ( η d r i v e , e ) and the unknown constant drive efficiency at the full design speed:
W s h = W s y s η d r i v e ( ω ) = W s y s η d r i v e , e ω η d r i v e ( 1 )
To consolidate the unknown drive efficiency at the full design speed in Equation (16), the equivalent fan shaft power is defined as the ratio of the fan shaft power to the drive efficiency at the full design speed.
W s h , e = W s h / η d r i v e ( 1 ) = W s y s η d r i v e , e ω
Two equivalent shaft power-related curves, including an equivalent fan shaft power-airflow curve and a fan head-equivalent shaft power curve, at the full design speed can be created with the calculated equivalent fan shaft power, and measured airflow rate and fan head using affinity laws.
Note that Equation (11) that correlates the measured fan head, airflow, and system power inputs is still valid with equivalent fan efficiency, equivalent drive efficiency, and equivalent shaft power.

3. Model Identification Demonstration

3.1. Test System

The experiments were conducted on a VFD-motor-fan system in an AHU serving a portion of an institution building. The total serving area is about 214 m2 (2,300 ft2) and the total cooling capacity of the AHU is 28 kW (8 ton). The supply fan with a design flow rate of 1,200 L/s (2,500 CFM) is a forward curve blade centrifugal fan and is equipped with a 2.2 kW (3 hp) motor powered by a VFD which connects the fan through a cogged belt.
The fan speed is modulated through the VFD to maintain the supply air duct static pressure at its setpoint, normally 248 Pa (1.0 inch of water). The squared ratio voltage control was set at the VFD. During the experiments, the supply fan was almost operated under routine control sequences except a few control overrides for other research projects, which made the operation more dynamic. During a period when the fan is speeding up, the additional system power input is required to accelerate the air movement while the increased fan airflow and head are recorded with a time delay due to the sensor time constant.
An air DP sensor was installed across the supply fan to measure the fan head. A factory-mounted and pre-piped duct mounted airflow duct airflow station (with accuracy within 2% of the actual flow rate) was installed on the 356 mm by 559 mm (14 inch by 22 inch) supply duct. It is noted that for AHUs without a physical airflow meter, multiple air velocity probes need to be temporarily installed to traverse the supply air duct to measure the airflow rate.
Moreover, one VFD analog output channel was assigned to the motor power input using MODBUS connection, a popular communication protocol, and a conventional power meter was installed upstream of the VFD to measure the system power input. Since the VFD analog output channel only has one decimal place, the motor power input reading jumps up and down among serval discrete readings from 0.5 to 1.3 kW for this small-sized 2.2 kW (3 hp) motor. As a result, the motor power input reading from the VFD cannot be used to identify the energy model. The case with accurate motor power input reading from VFDs for large-sized motors will be discussed at the end of the paper.
A computer, serving as a server, was connected to the experimental system through a universal control network for control, real-time monitoring, data collection, and storage purposes. The collected data include the fan speed command in addition to the fan airflow, fan head, and system power input with a sampling time of one minute, which is the shortest sampling for this control system.

3.2. Measured Raw Performance Data

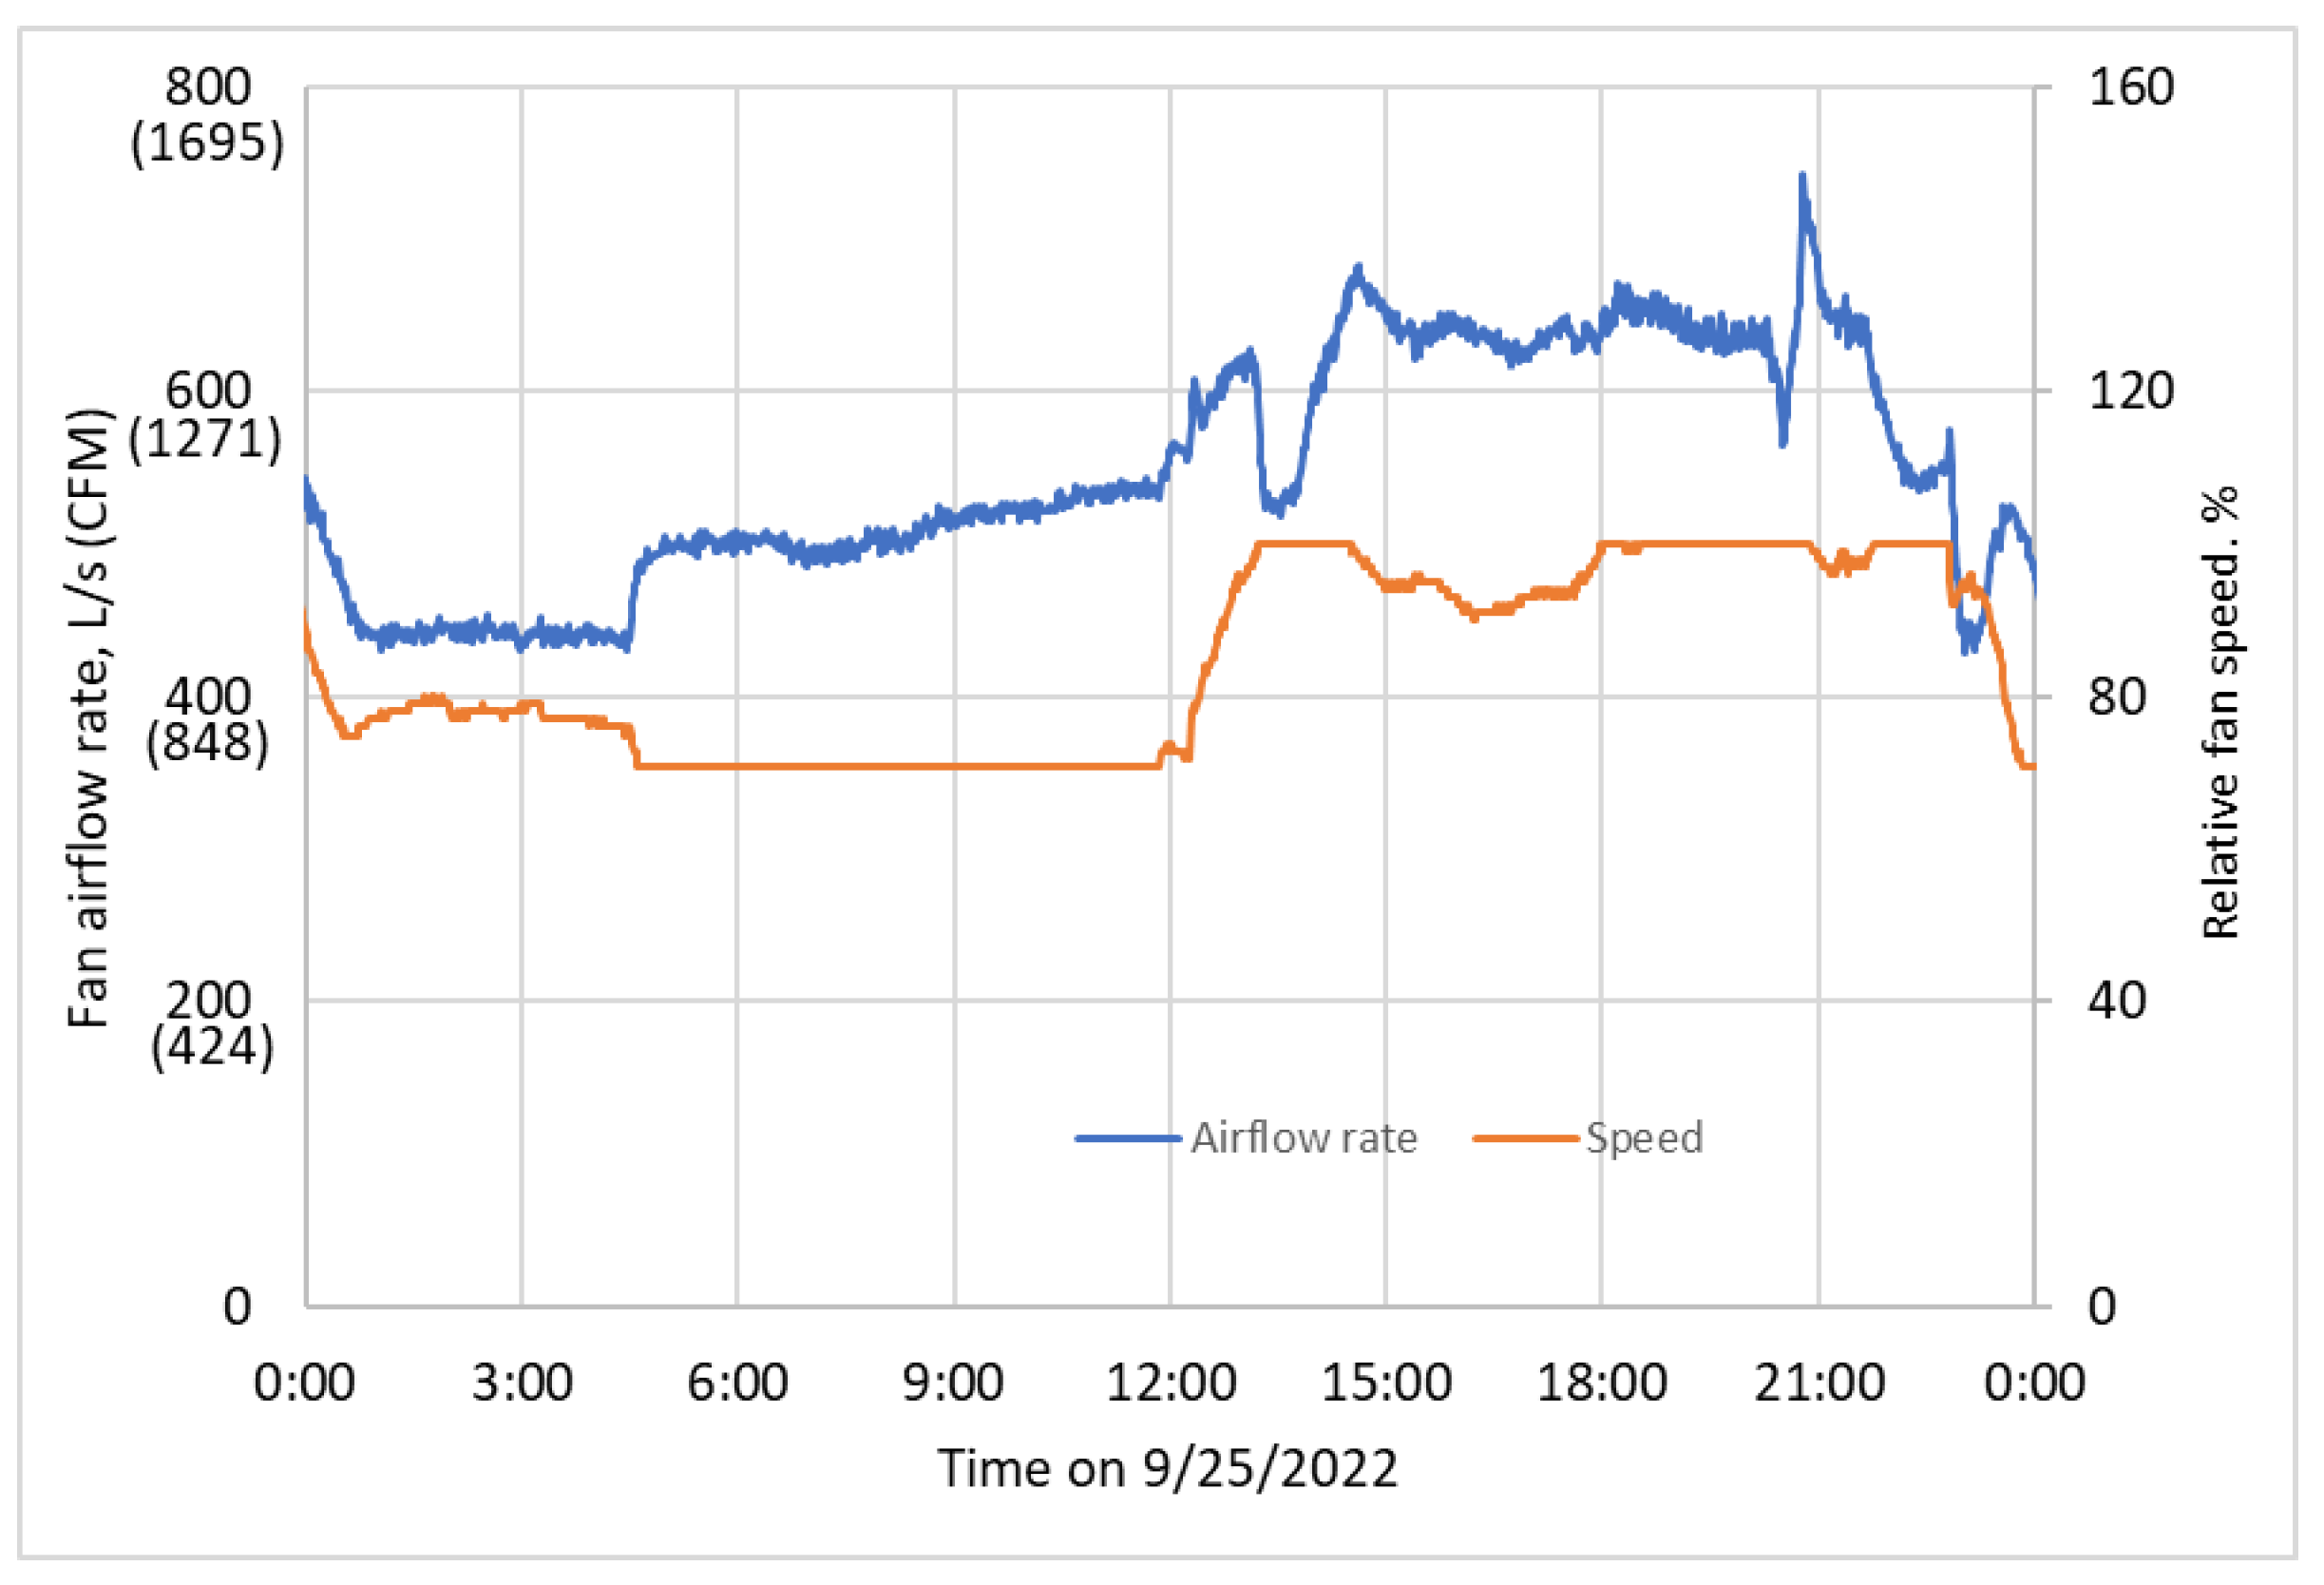
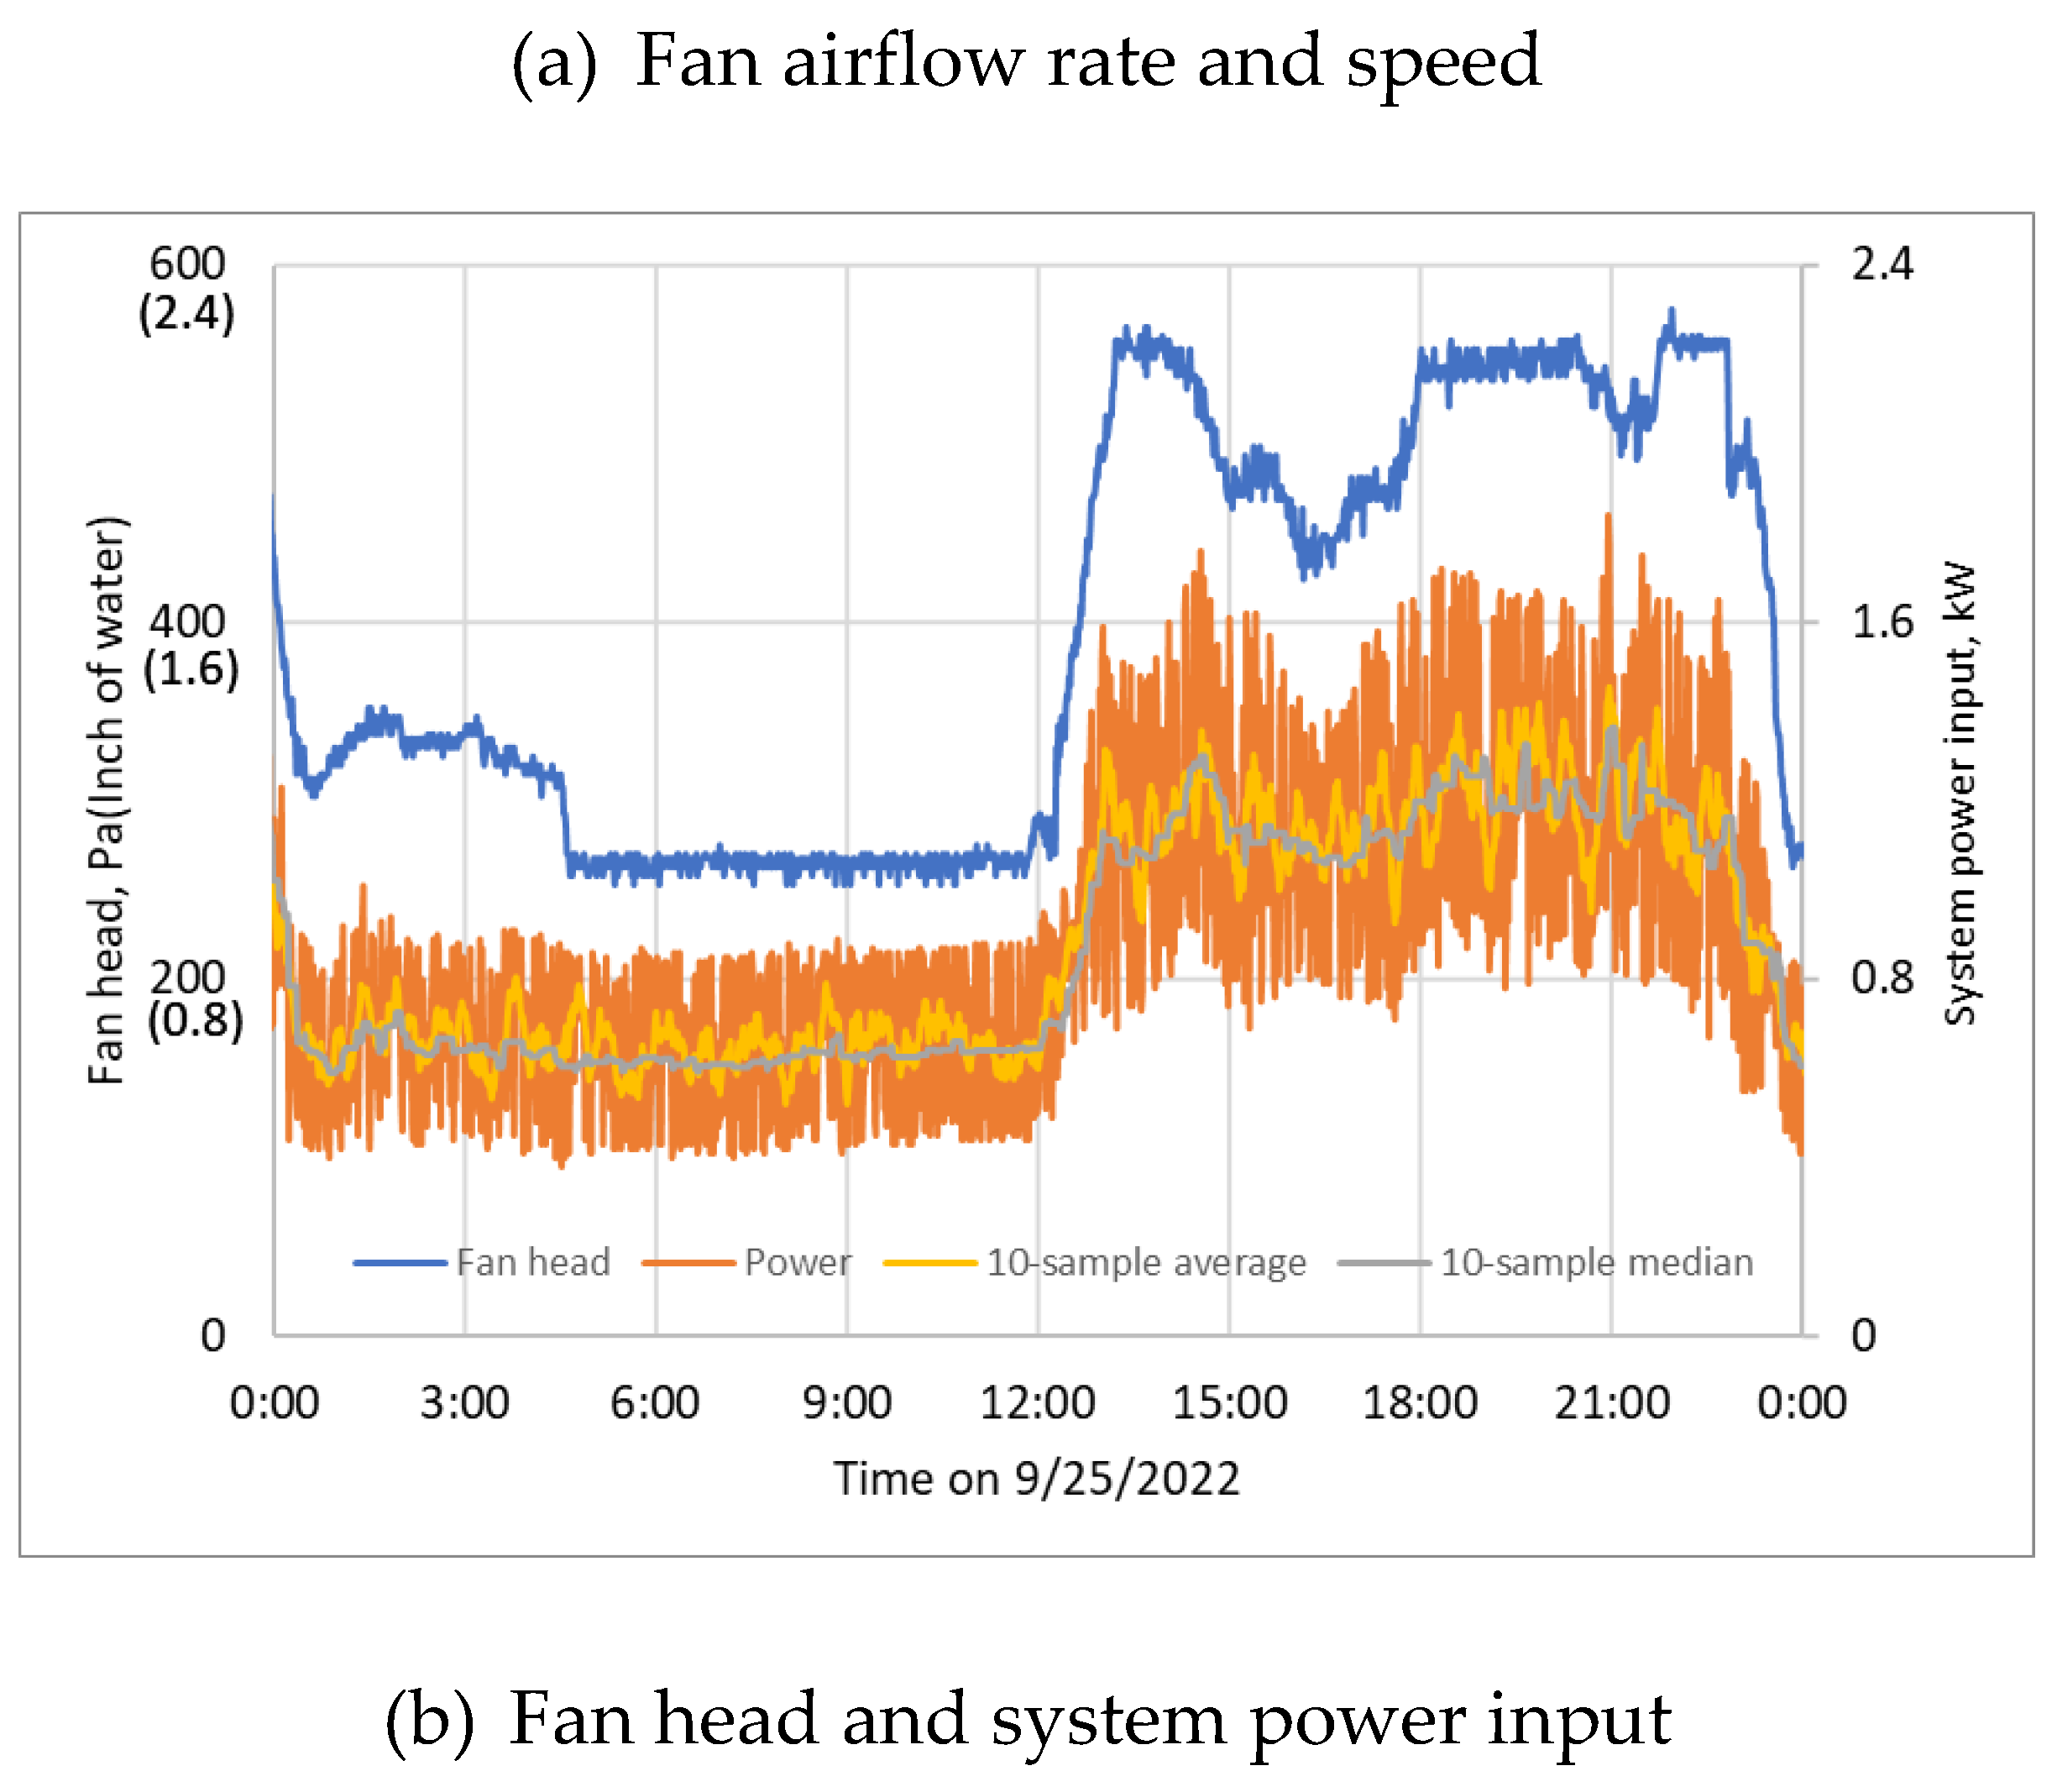
The performance data from September 11 to October 17, 2022, are applied to identify the VFD-motor-fan system model. Figure 3(a) shows the measured fan airflow rate and percentage speed, while Figure 3(b) shows the measured fan head and system power input over a one-day period. As observed, the fan airflow, speed, and head measurements are relatively stable, while the power measurement (orange curve) has significant oscillations due to the VFD PWM power output. It is important to process the power data before using them to identify the VFD-motor-fan system model. Two data processing measures were conducted to eliminate the oscillations in this study, i.e., using the 10-sample average (yellow) and median (gray) values. The two manipulated power values are also shown in Figure 3(b). Since the median power input shows a better match with the fan speed, the 10-sample median power value was applied afterward. To further improve the accuracy of the power measurement, it is recommended to record the system power input with a shorter sampling time, such as 5 second, using a data logger outside the control system, to accurately catch the system dynamics.
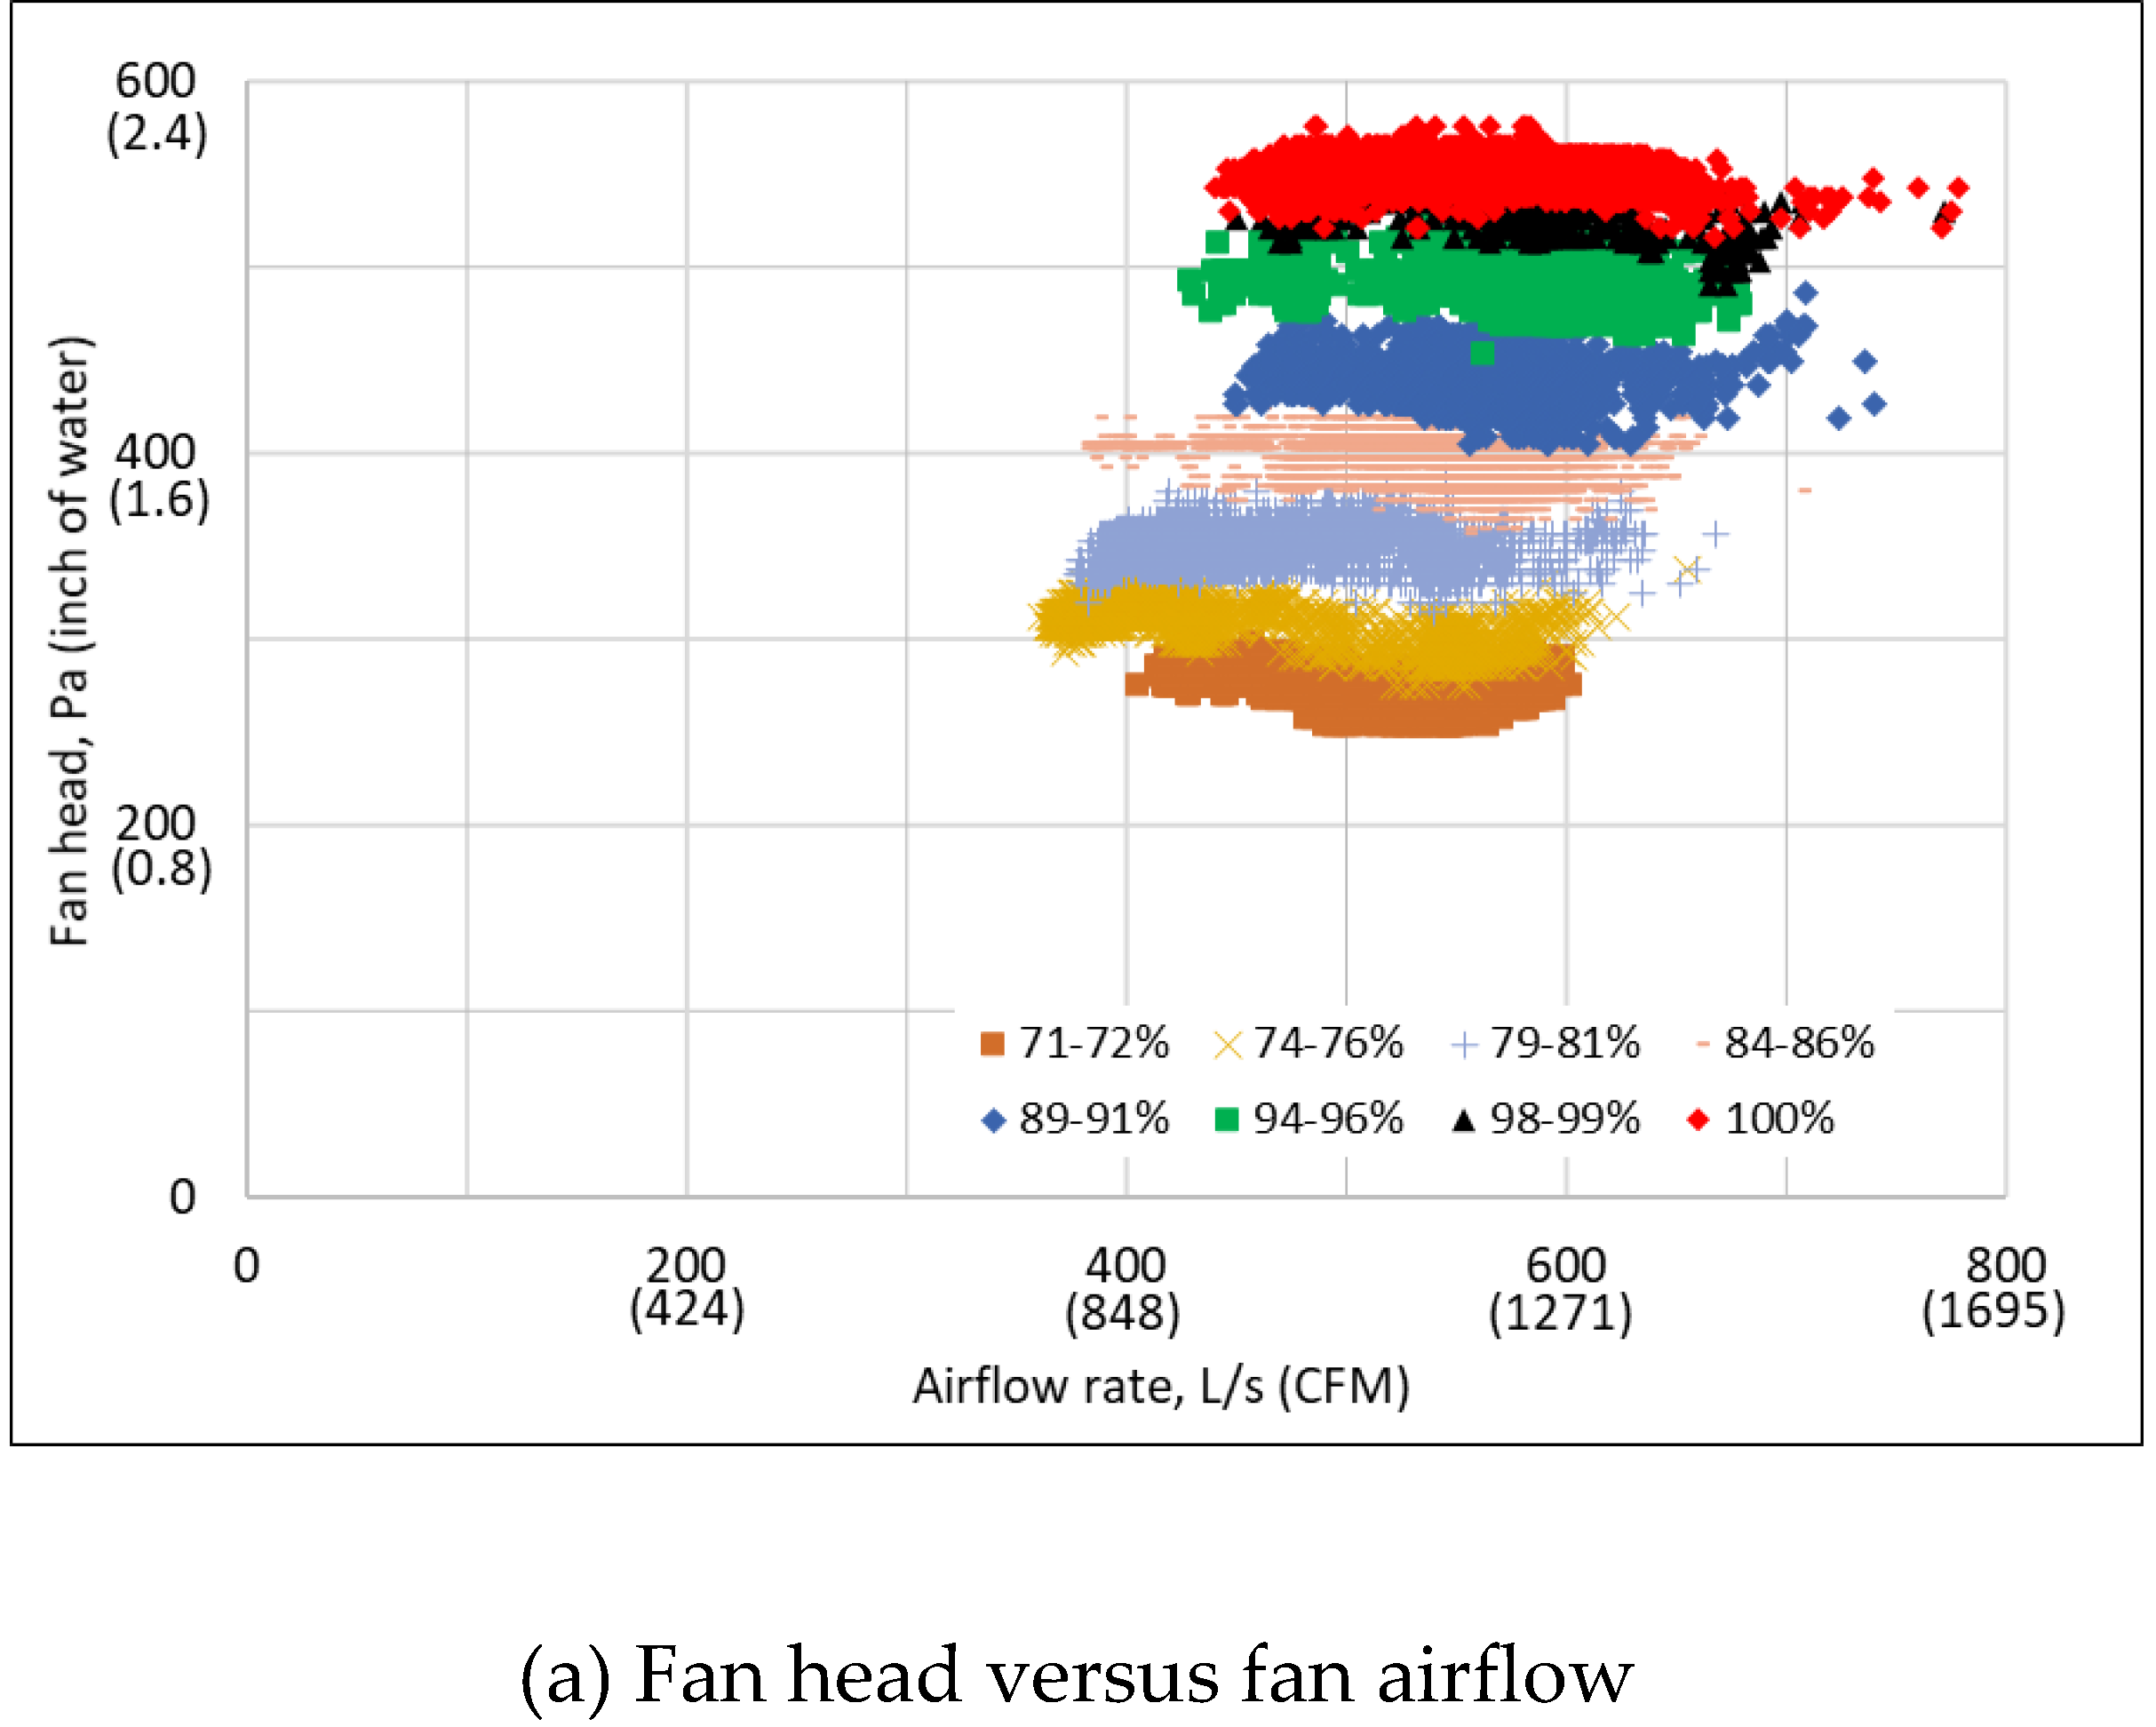
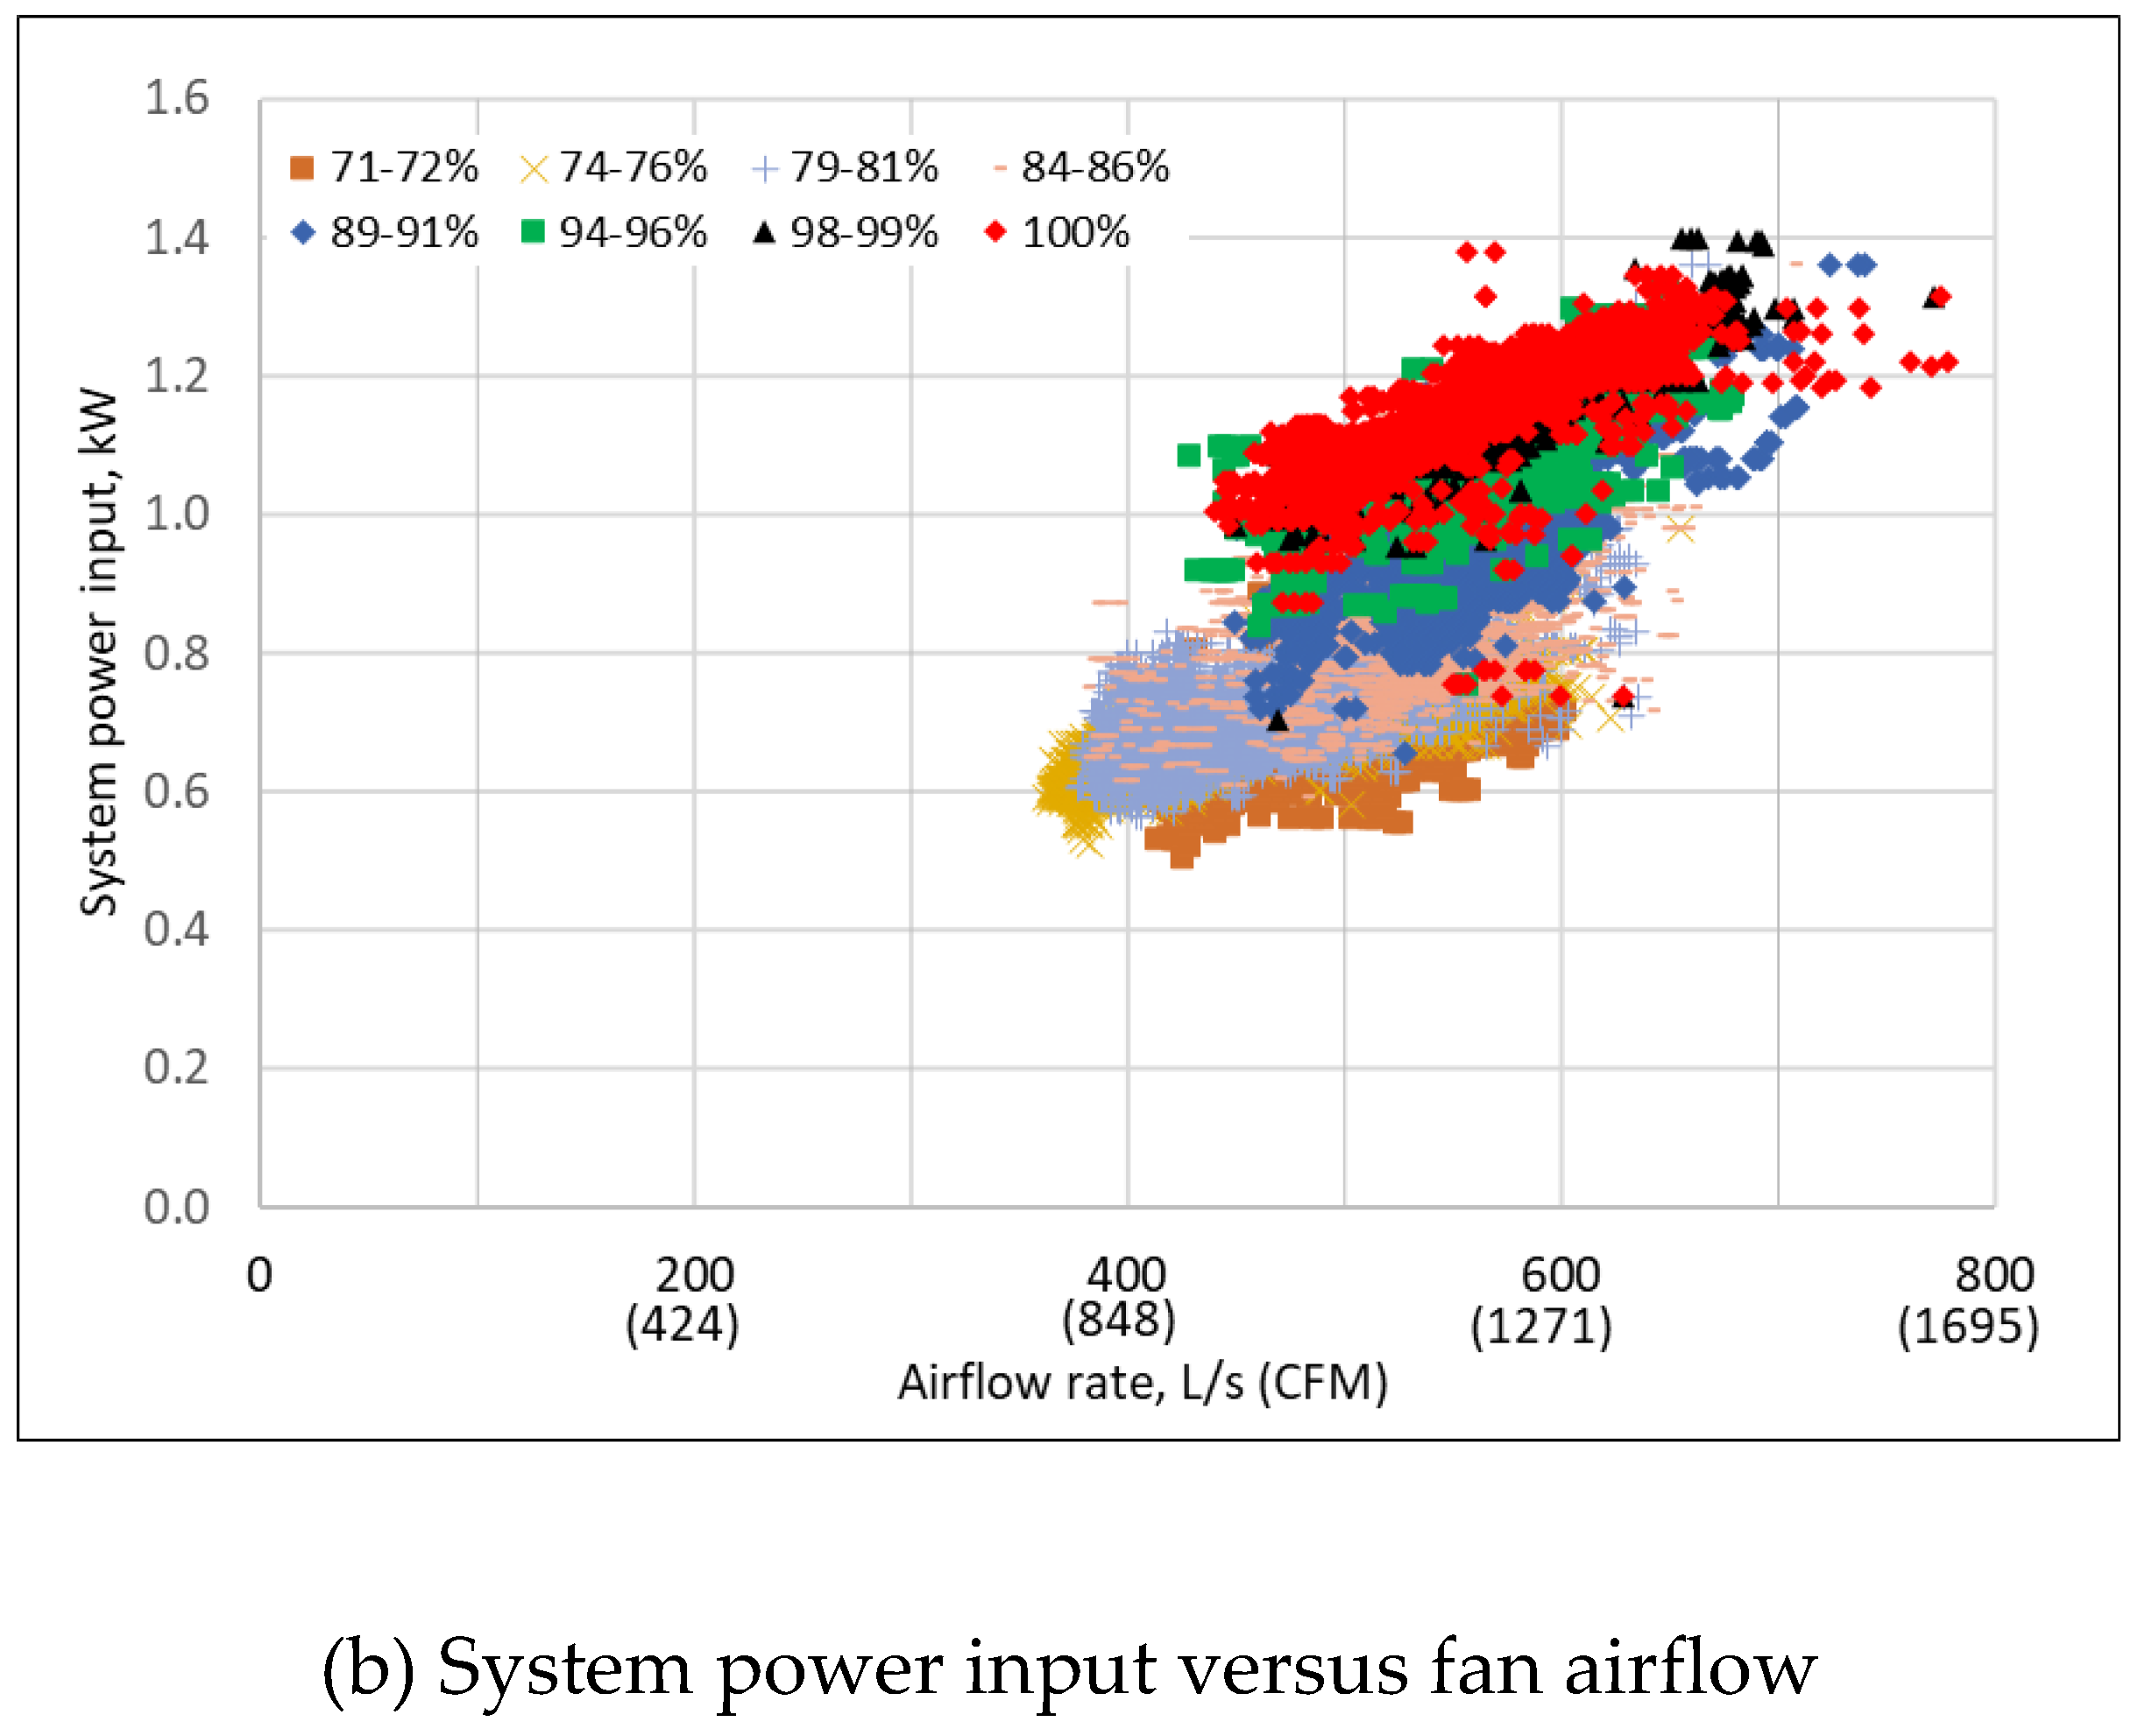
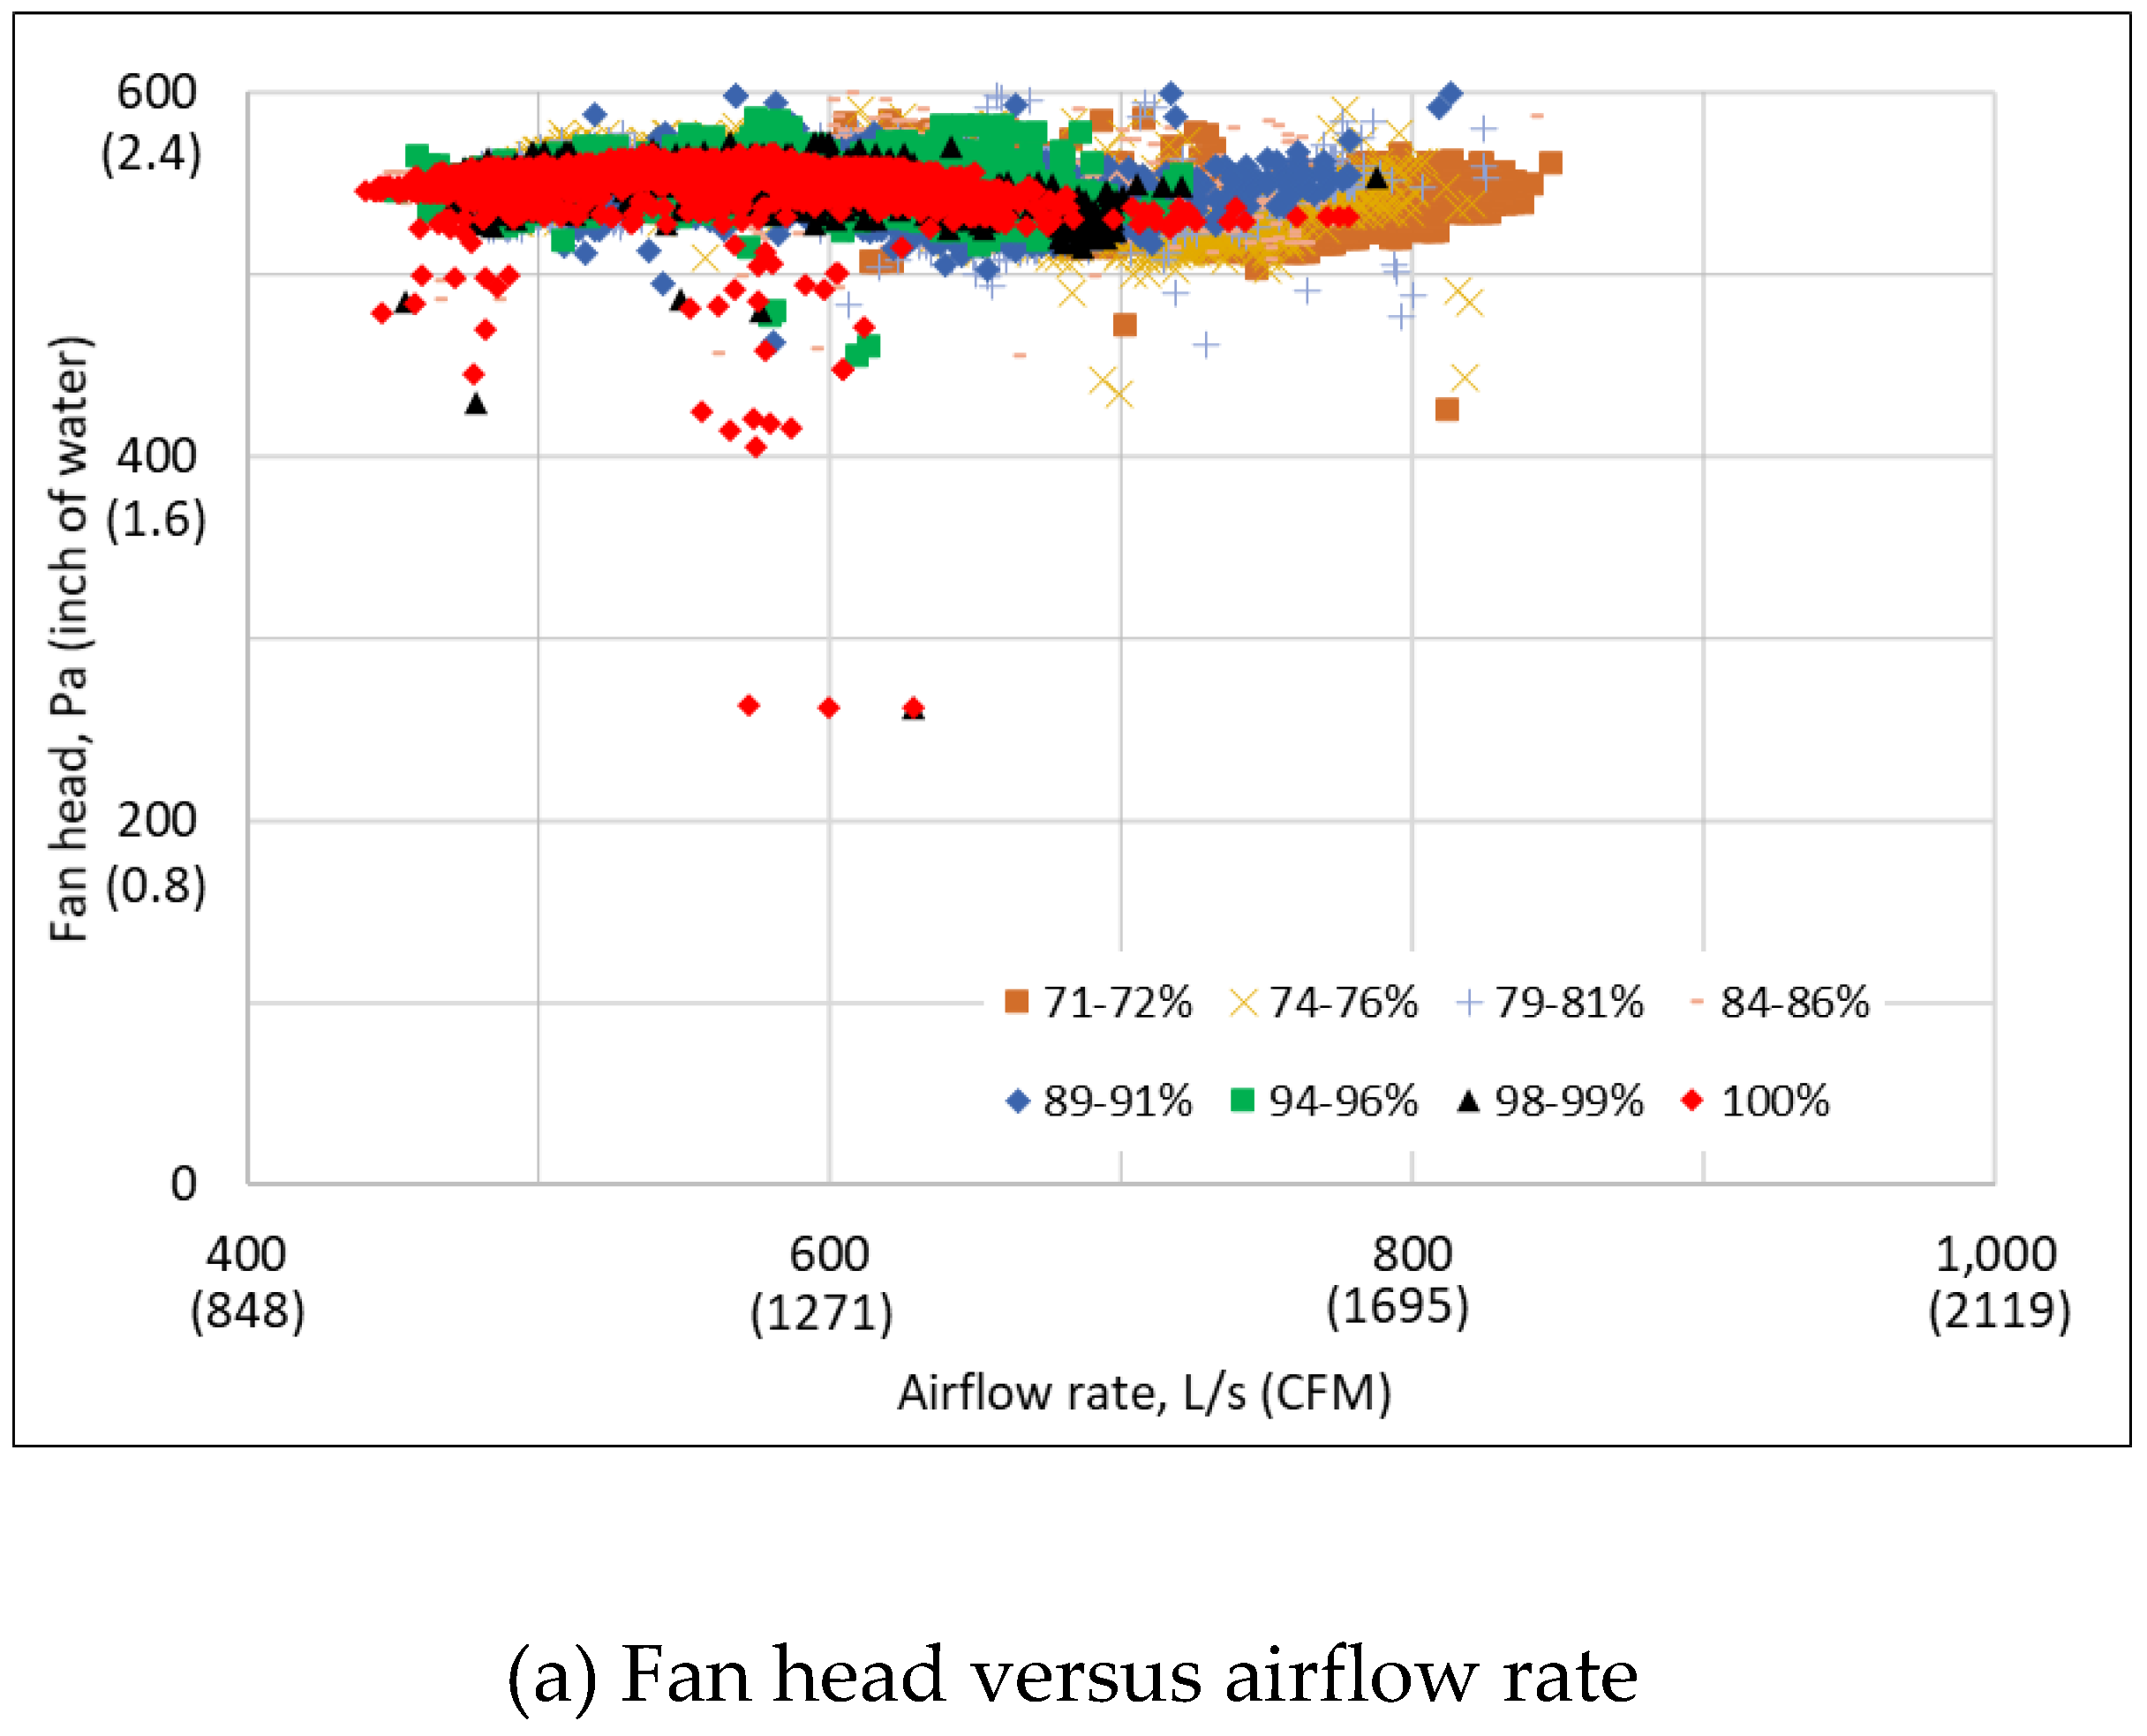
The measured system performance data is presented as the fan head-airflow correlation and the system power input-airflow correlation at various fan speeds. Figure 4(a) shows the measured fan head versus airflow rate, while Figure 4(b) shows the measured median system power input versus airflow rate in eight different fan speed ranges, i.e., 71-72%, 74-76%, 79-81%, 84-86%, 89-91%, 94-96%, 98-99%, and 100%, differentiated by different colors. It should be noted that the performance data at all fan speeds were applied in the identification in Figures 6, 8(a) and 9 even though only the data in eight fan speed ranges are shown in Figures 4, 5, 7 and 8b.
As discussed previously, the fan speed not only directly impacts the fan head curve and system power input curve based on the affinity laws but also indirectly impacts the system power input through the fan speed-related drive efficiency. Figure 4 clearly reveals the direct impacts of the fan speed on the fan head (a) and both the direct and indirect impacts of the fan speed on the system power input (b).

3.3. Manipulated Performance Data at the Full Design Speed

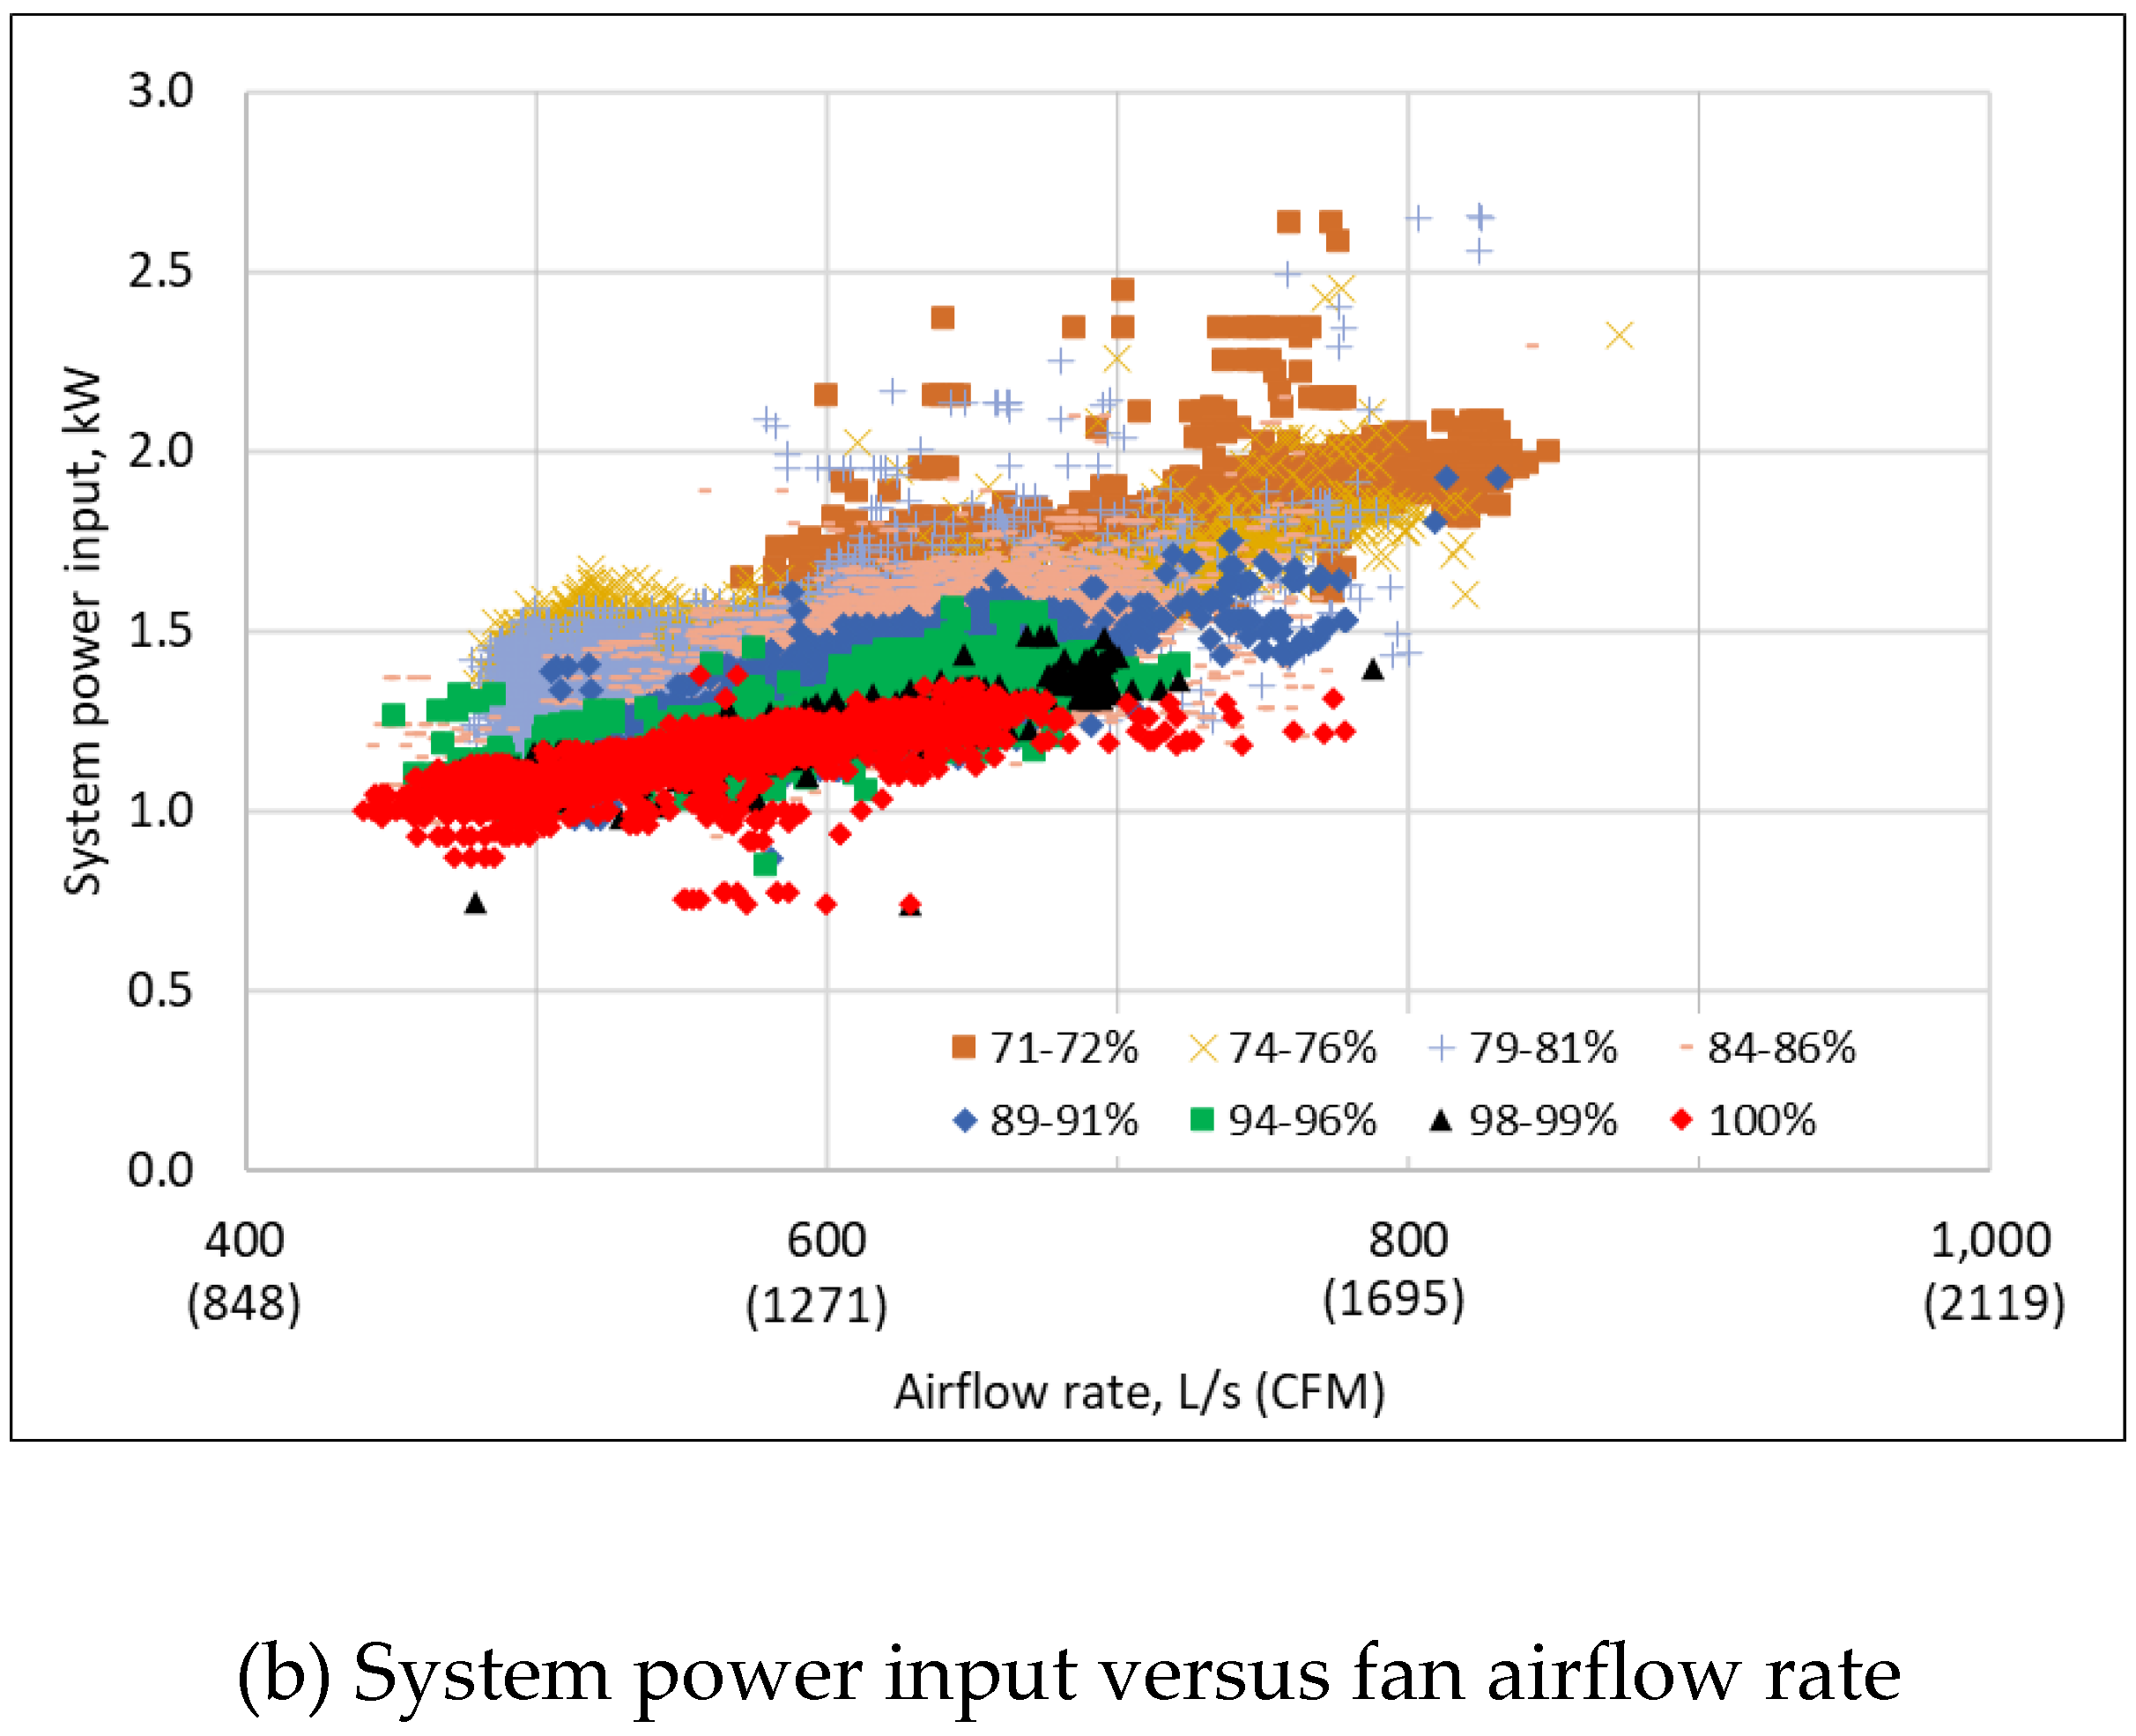
To intentionally eliminate the direct impacts of the variable fan speed, the affinity laws, defined by Equations (4), were applied to convert the raw fan performance data at all fan speeds to the fan performance data at the full design speed. Figure 5(a) shows the converted fan head versus airflow rate data and Figure 5(b) shown the converted system power input versus airflow rate data at the full design speed.
As results, the converted fan head versus fan airflow rate data at the full design speed in Figure 5(a) becomes more consistent and the converted system power input versus fan airflow rate data at the full design speed in Figure 5(b) is still slightly impacted by the fan speed indirectly through the fan speed-related drive efficiency.
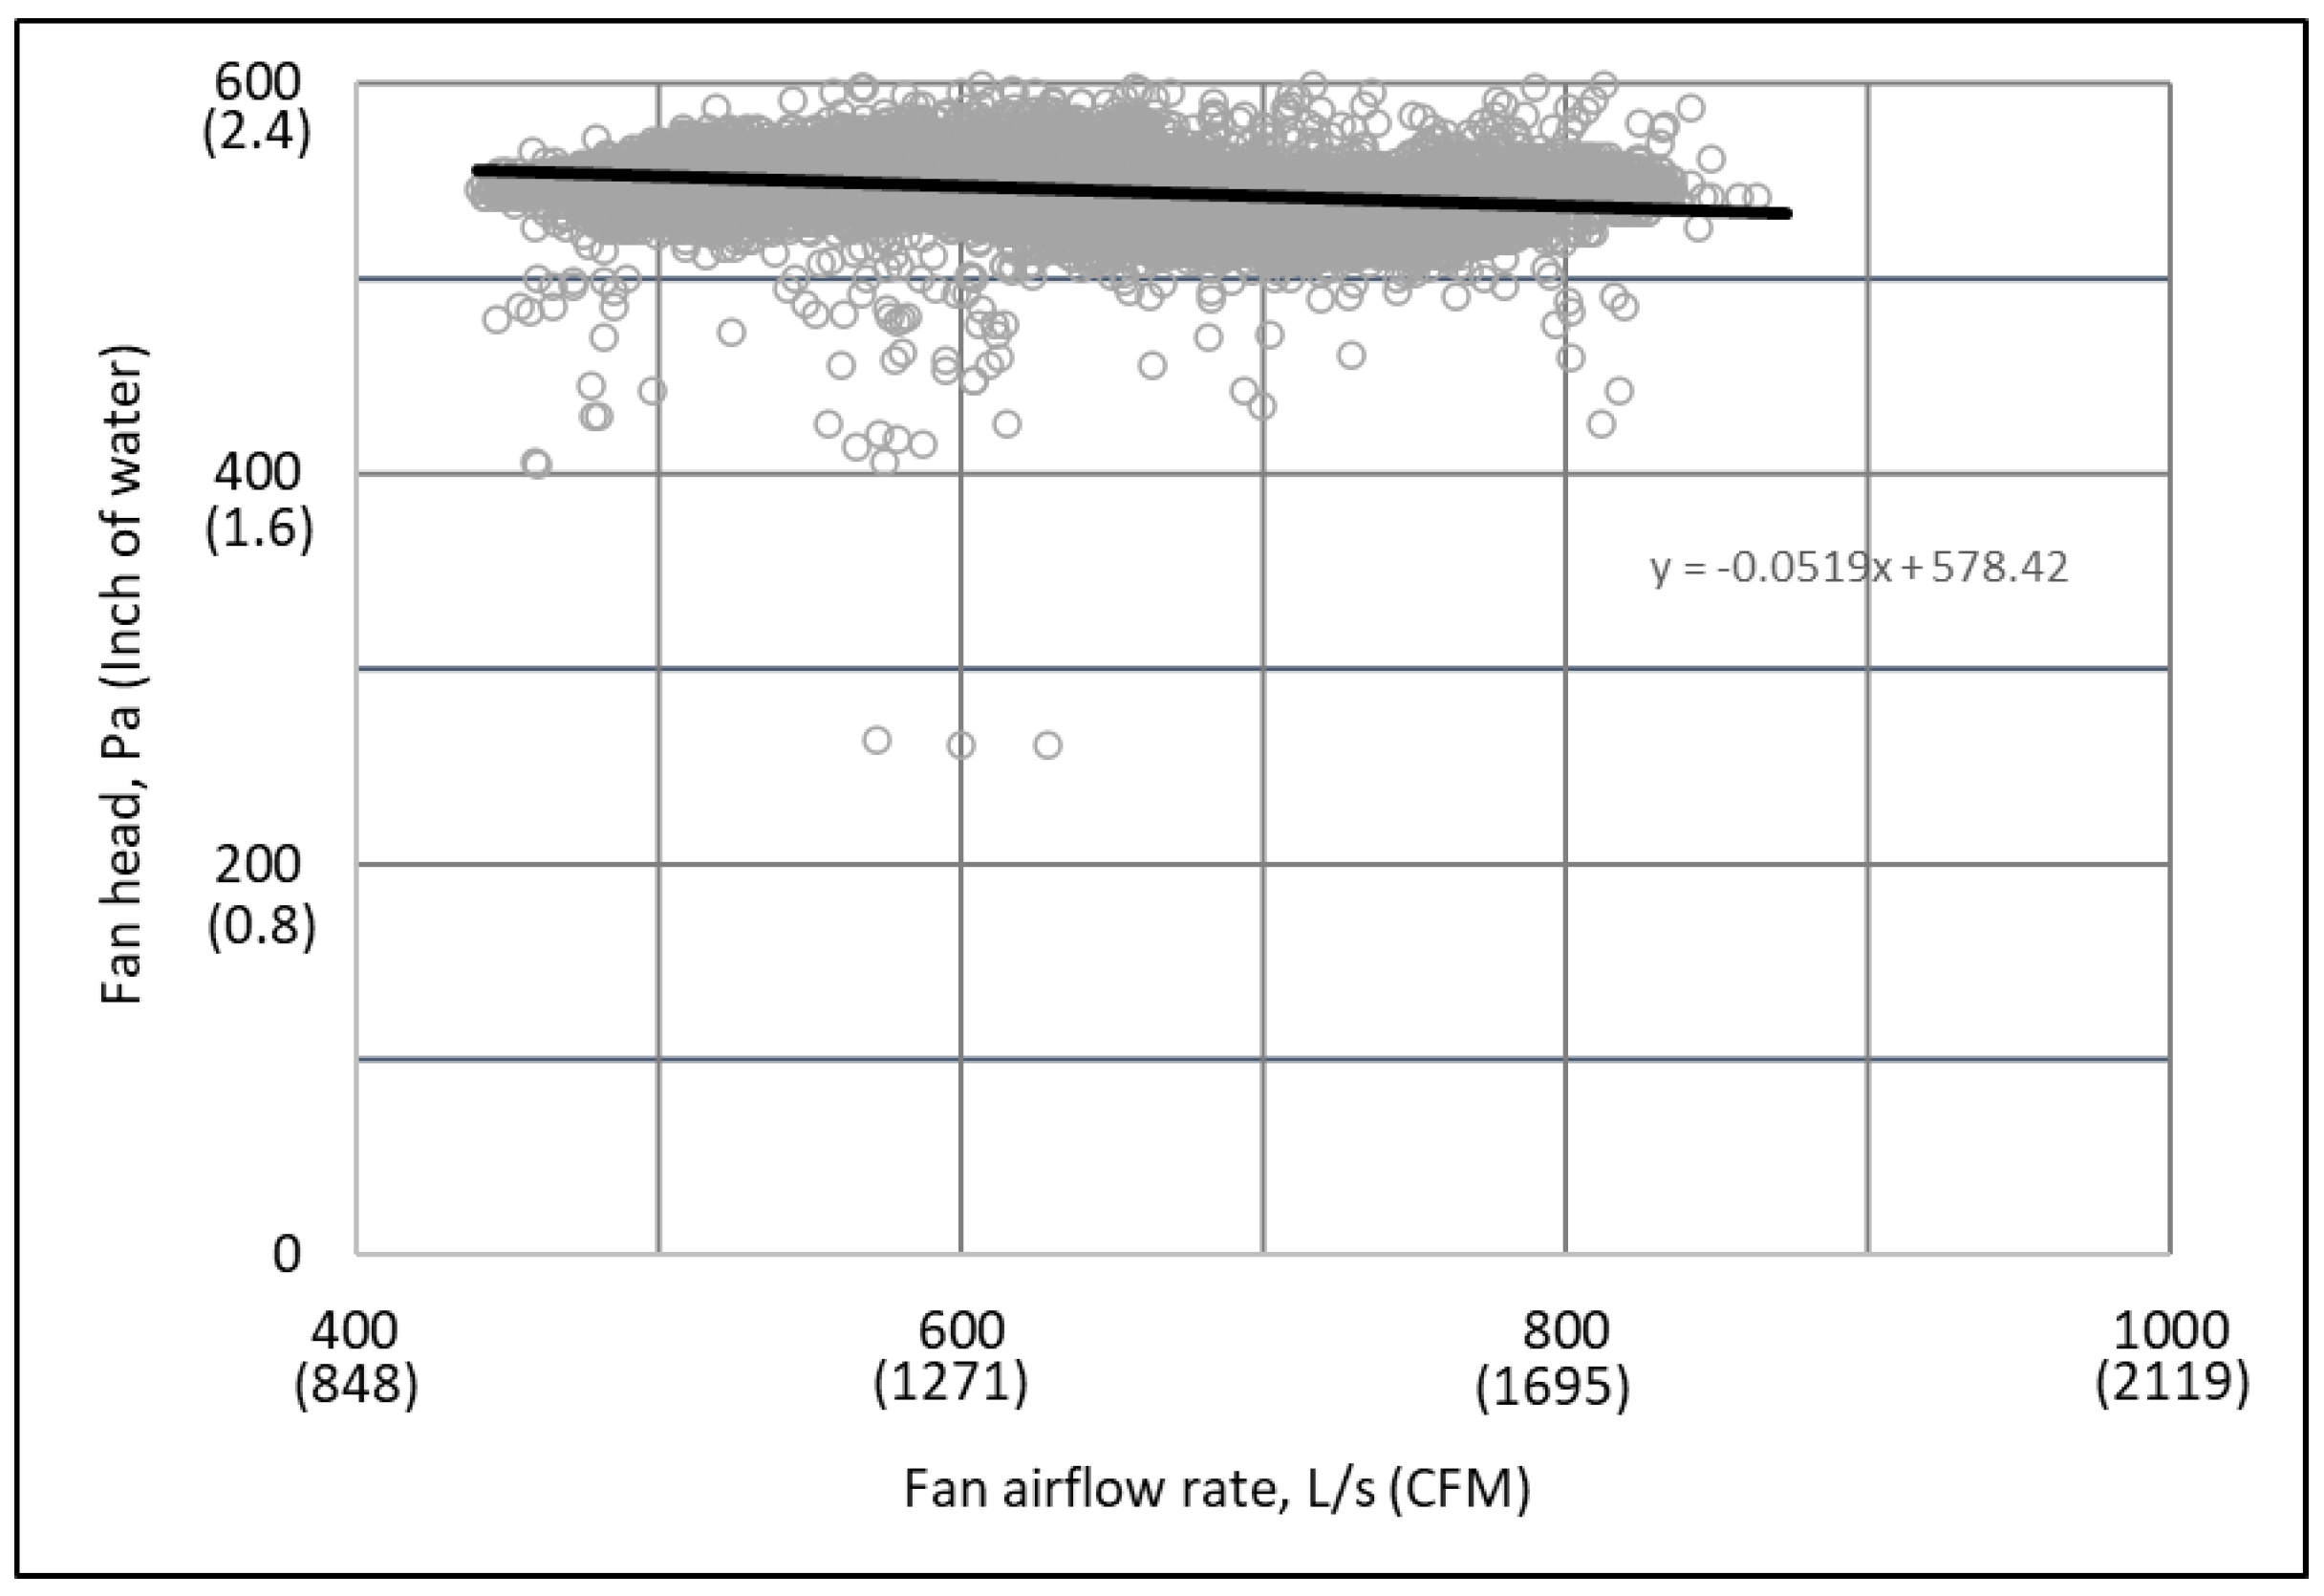
The fan head-airflow curve at the full design speed converted from the data at all the fan speeds is shown in Figure 6. The first step in the identification approach can be done by regressing this fan head curve in Figure 6:
H d = 0.0519 · Q d + 578.42
where the fan airflow is in L/s and the fan head is in Pa.
Figure 5(a) also shows that the fan head curve converted from the data at lower fan speeds locates on the right and the fan head curve converted from the data at higher fan speeds locates on the left. This is the reason to use the operation data at all speeds with affinity laws to create the fan head curve. Moreover, it is noted that the regressed linear fan head curve is an actual operational curve limited by system design and operation condition, which is only a part of the entire fan head curve.
On the other hand, the converted system power input versus fan airflow rate data at the full design speed in Figure 5(b) are differentiated by the fan speed. Before the fan shaft power curve can be identified, the drive efficiency needs to be identified and applied to further covert the system power input to the fan shaft power by eliminating the indirect impact of the fan speed.

3.4. Speed-Independent Fan Efficiency Curve

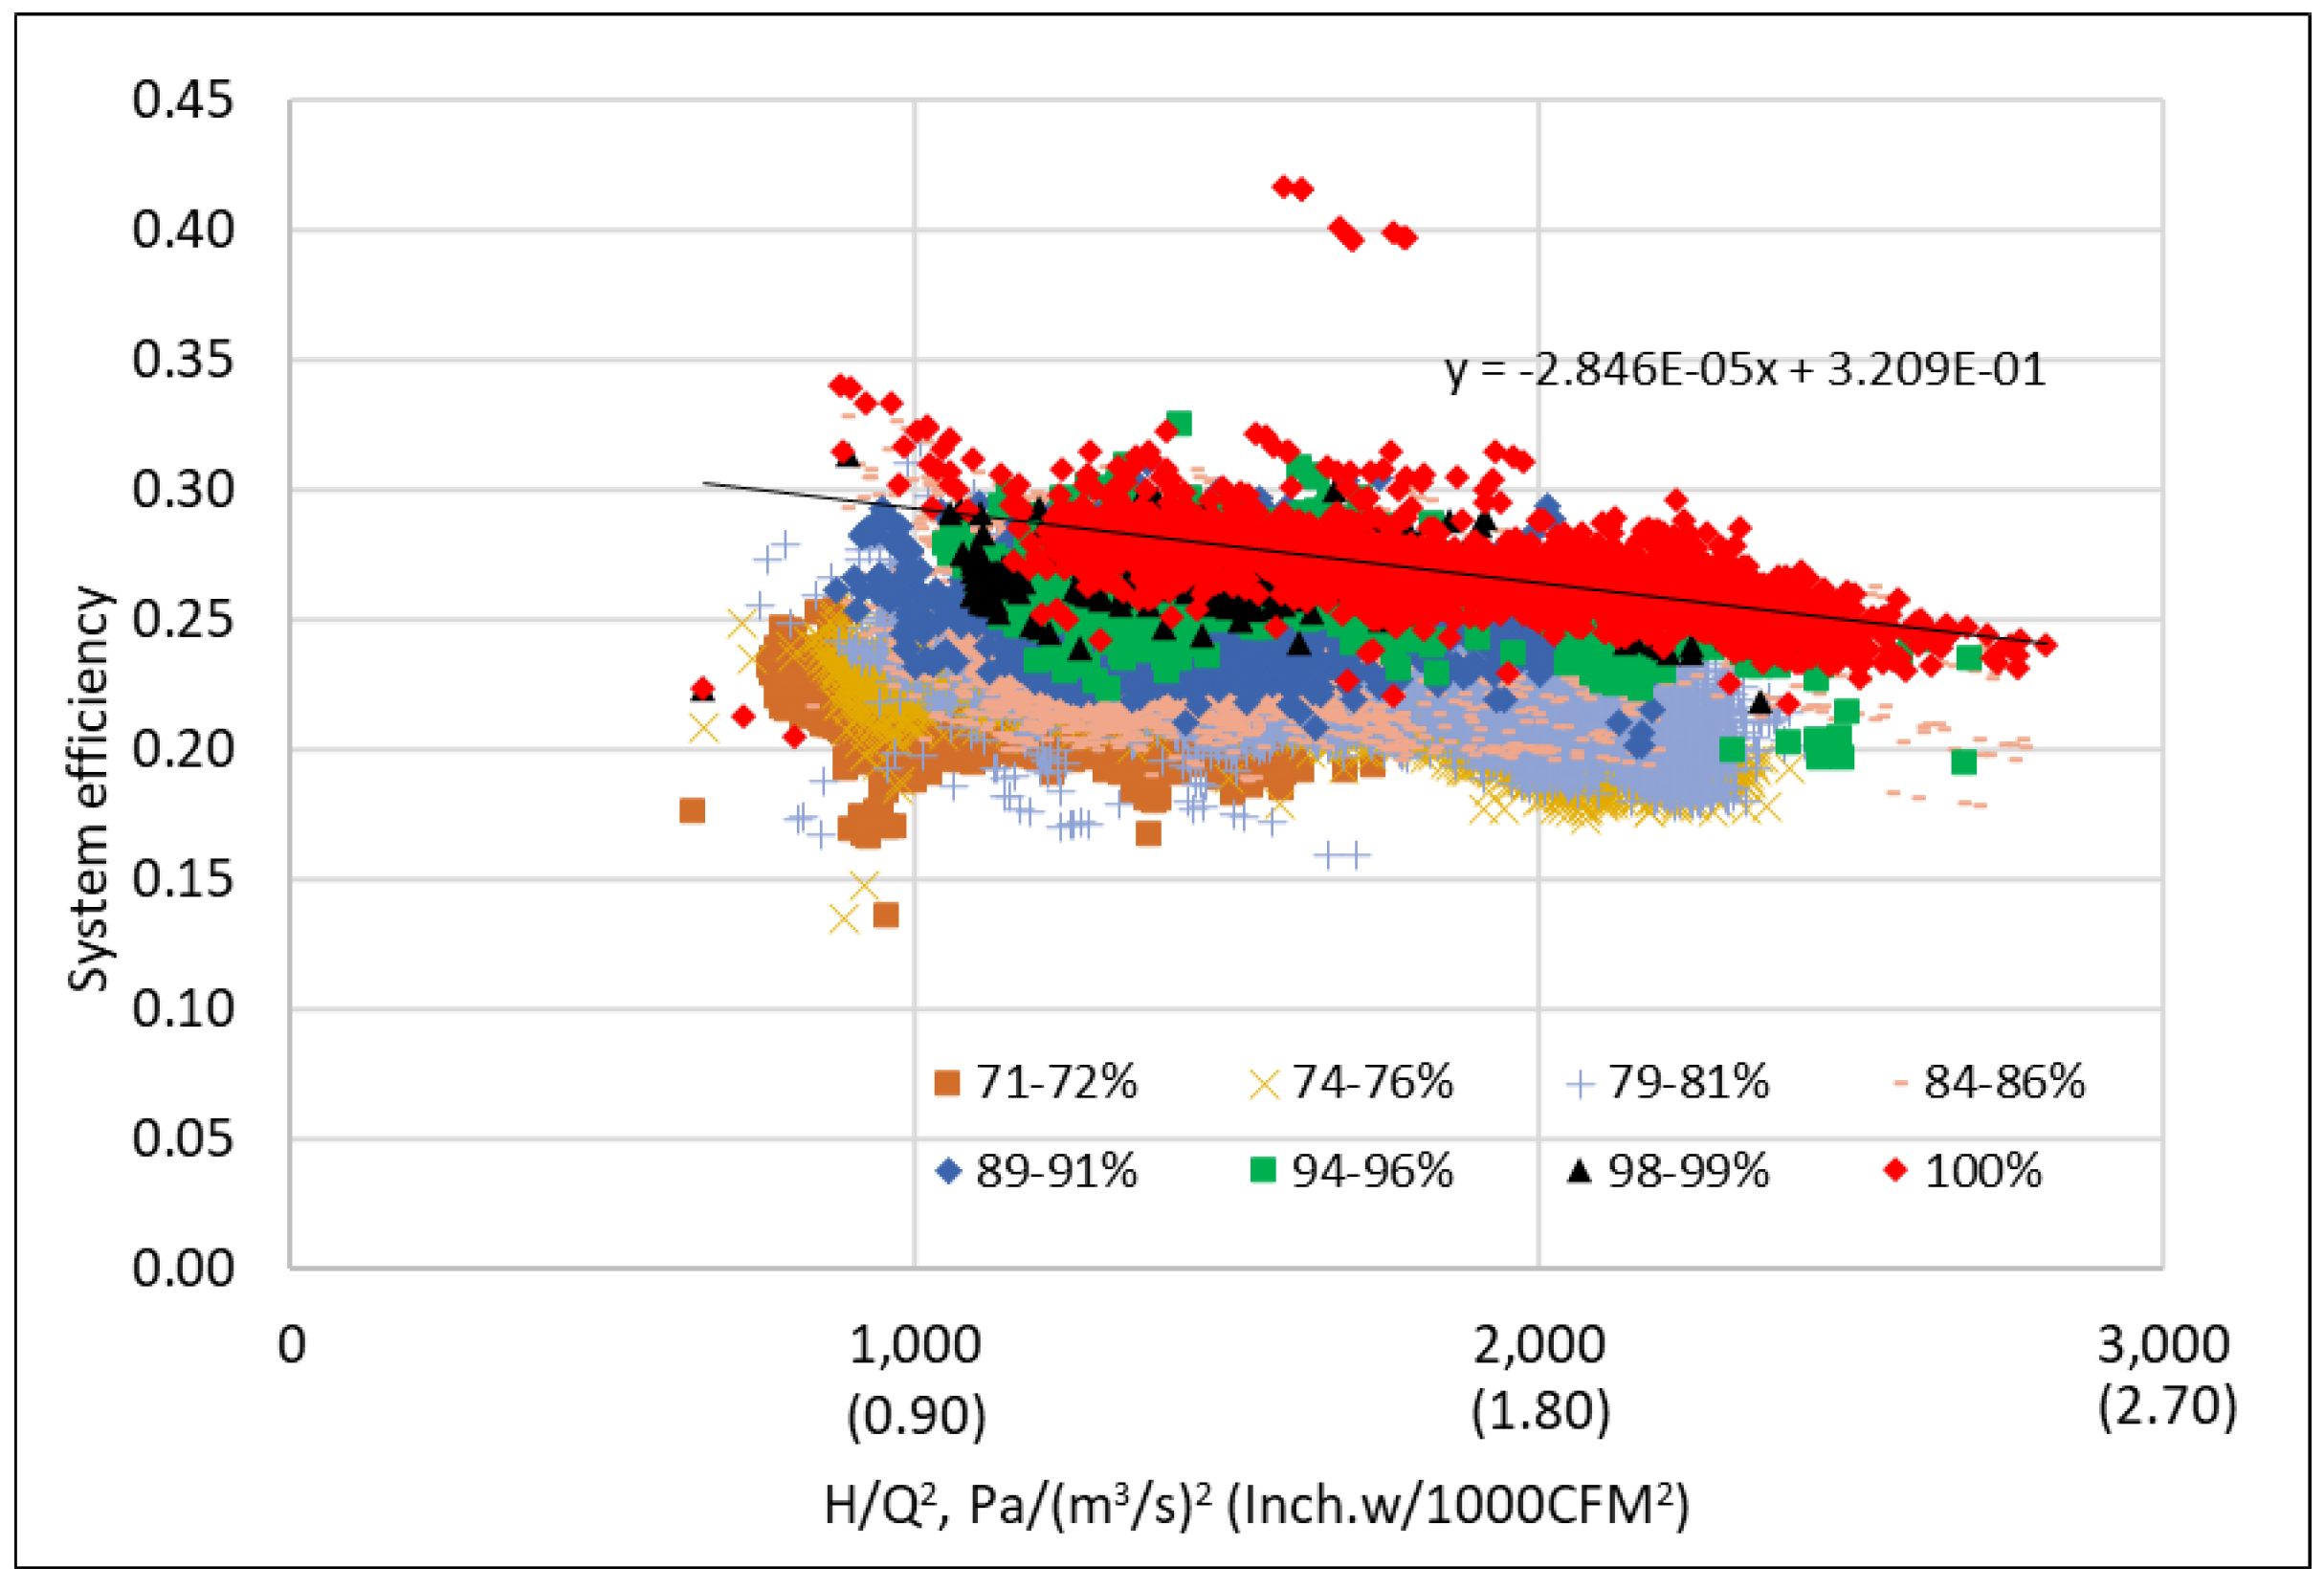
First, to obtain the fan speed-independent equivalent fan efficiency, the system efficiency was calculated based on Equation (11) and is presented versus the ratio of the fan head to fan airflow rate squared in Figure 7. The increased system efficiency at higher fan speeds means that the drive efficiency increases as the fan speed increases.
Second, the system efficiency (red markers) at the full design speed represents the equivalent fan efficiency according to Equation (12). The second step in the identification approach can be done by regressing the equivalent fan efficiency curve as a function of the ratio of the fan head to fan airflow squared:
η f a n , e = η s y s @ ω = 1 = 2.846 × 10 5 · H Q 2 + 0.3209
where the fan airflow rate (Q) is in L/s and the fan head (H) is in Pa.
Like the fan head curve at the full design speed, the equivalent fan efficiency curve is regressed as a linear curve limited by system design and operation condition, which is only a part of the entire equivalent fan efficiency curve.
It is important to highlight that the fan efficiency in Equation (19) is independent with the fan speed and Equation (19) can be applied to calculate the fan efficiency at any fan speed even though it is obtained from the test data at the full design speed.

3.5. Drive Efficiency Curve

Since the system efficiency is the product of the equivalent fan efficiency and the equivalent drive efficiency, the equivalent drive efficiency can be readily calculated using Equation (14), in which the system efficiency is shown in Figure 7 and the equivalent fan efficiency is defined by Equation (19).
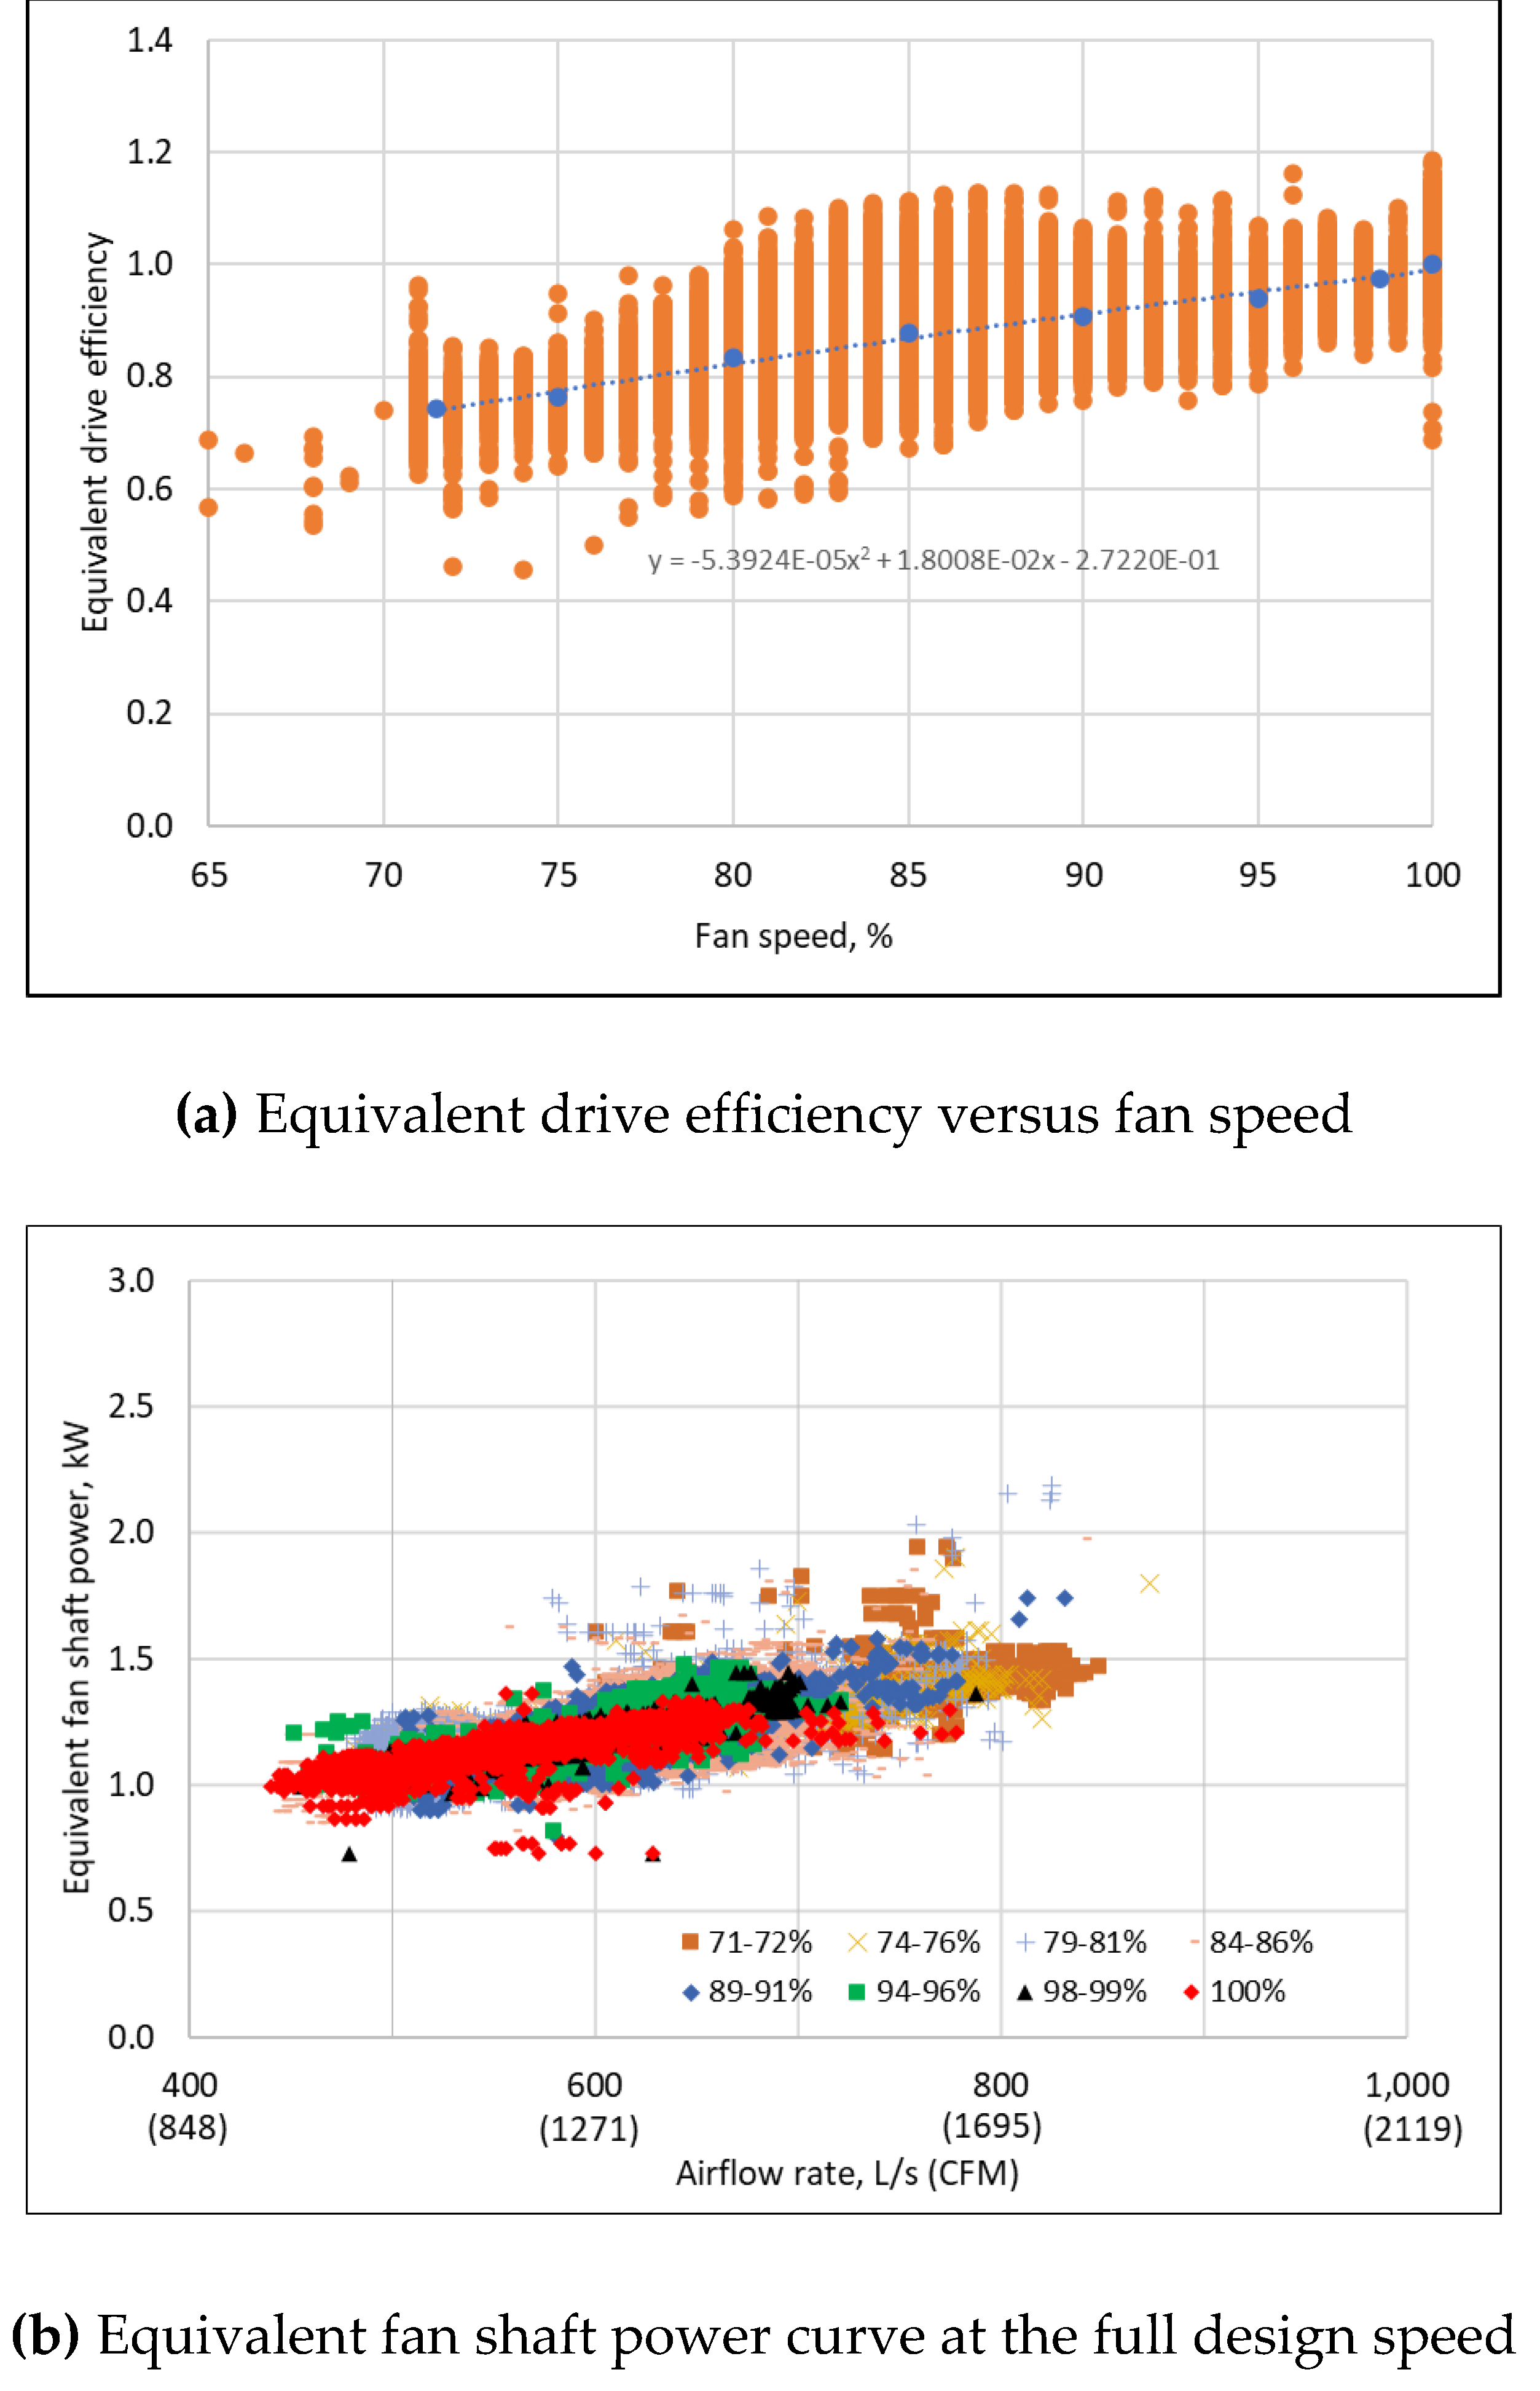
Figure 8 (a) shows the equivalent drive efficiency (orange markers) calculated using the data at all fan speeds and the average equivalent drive efficiencies calculated using the data at eight fan speed ranges in Figure 4, Figure 5 and Figure 7. Thus, the third step in the identification approach can be done by regressing the average equivalent drive efficiency curve as a function of the fan speed.
η d r i v e , e = 5.3924 × 10 5 ω 2 + 1.8008 × 10 2 ω 0.27220
where the fan speed ( ω ) is in percentage.
It should be noted that not only the system dynamics but also the oscillations of the VFD PWM output power result in the wide band of the equivalent drive efficiency curve in Figure 8(a).

3.6. Fan Shaft Power Curve

With the regressed equivalent drive efficiency, defined by Equation (20), the system power input in Figure 5(b) can be converted to the equivalent fan shaft power using Equation (17). Figure 8(b) shows the equivalent fan shaft power versus airflow rate curve at the full design speed. Like the converted fan head versus fan airflow rate data at the full design speed in Figure 5(a), the converted equivalent fan shaft power versus airflow rate data in Figure 8(b) becomes more consistent after eliminating the indirect impact of the variable fan speed through the fan speed-related drive efficiency.
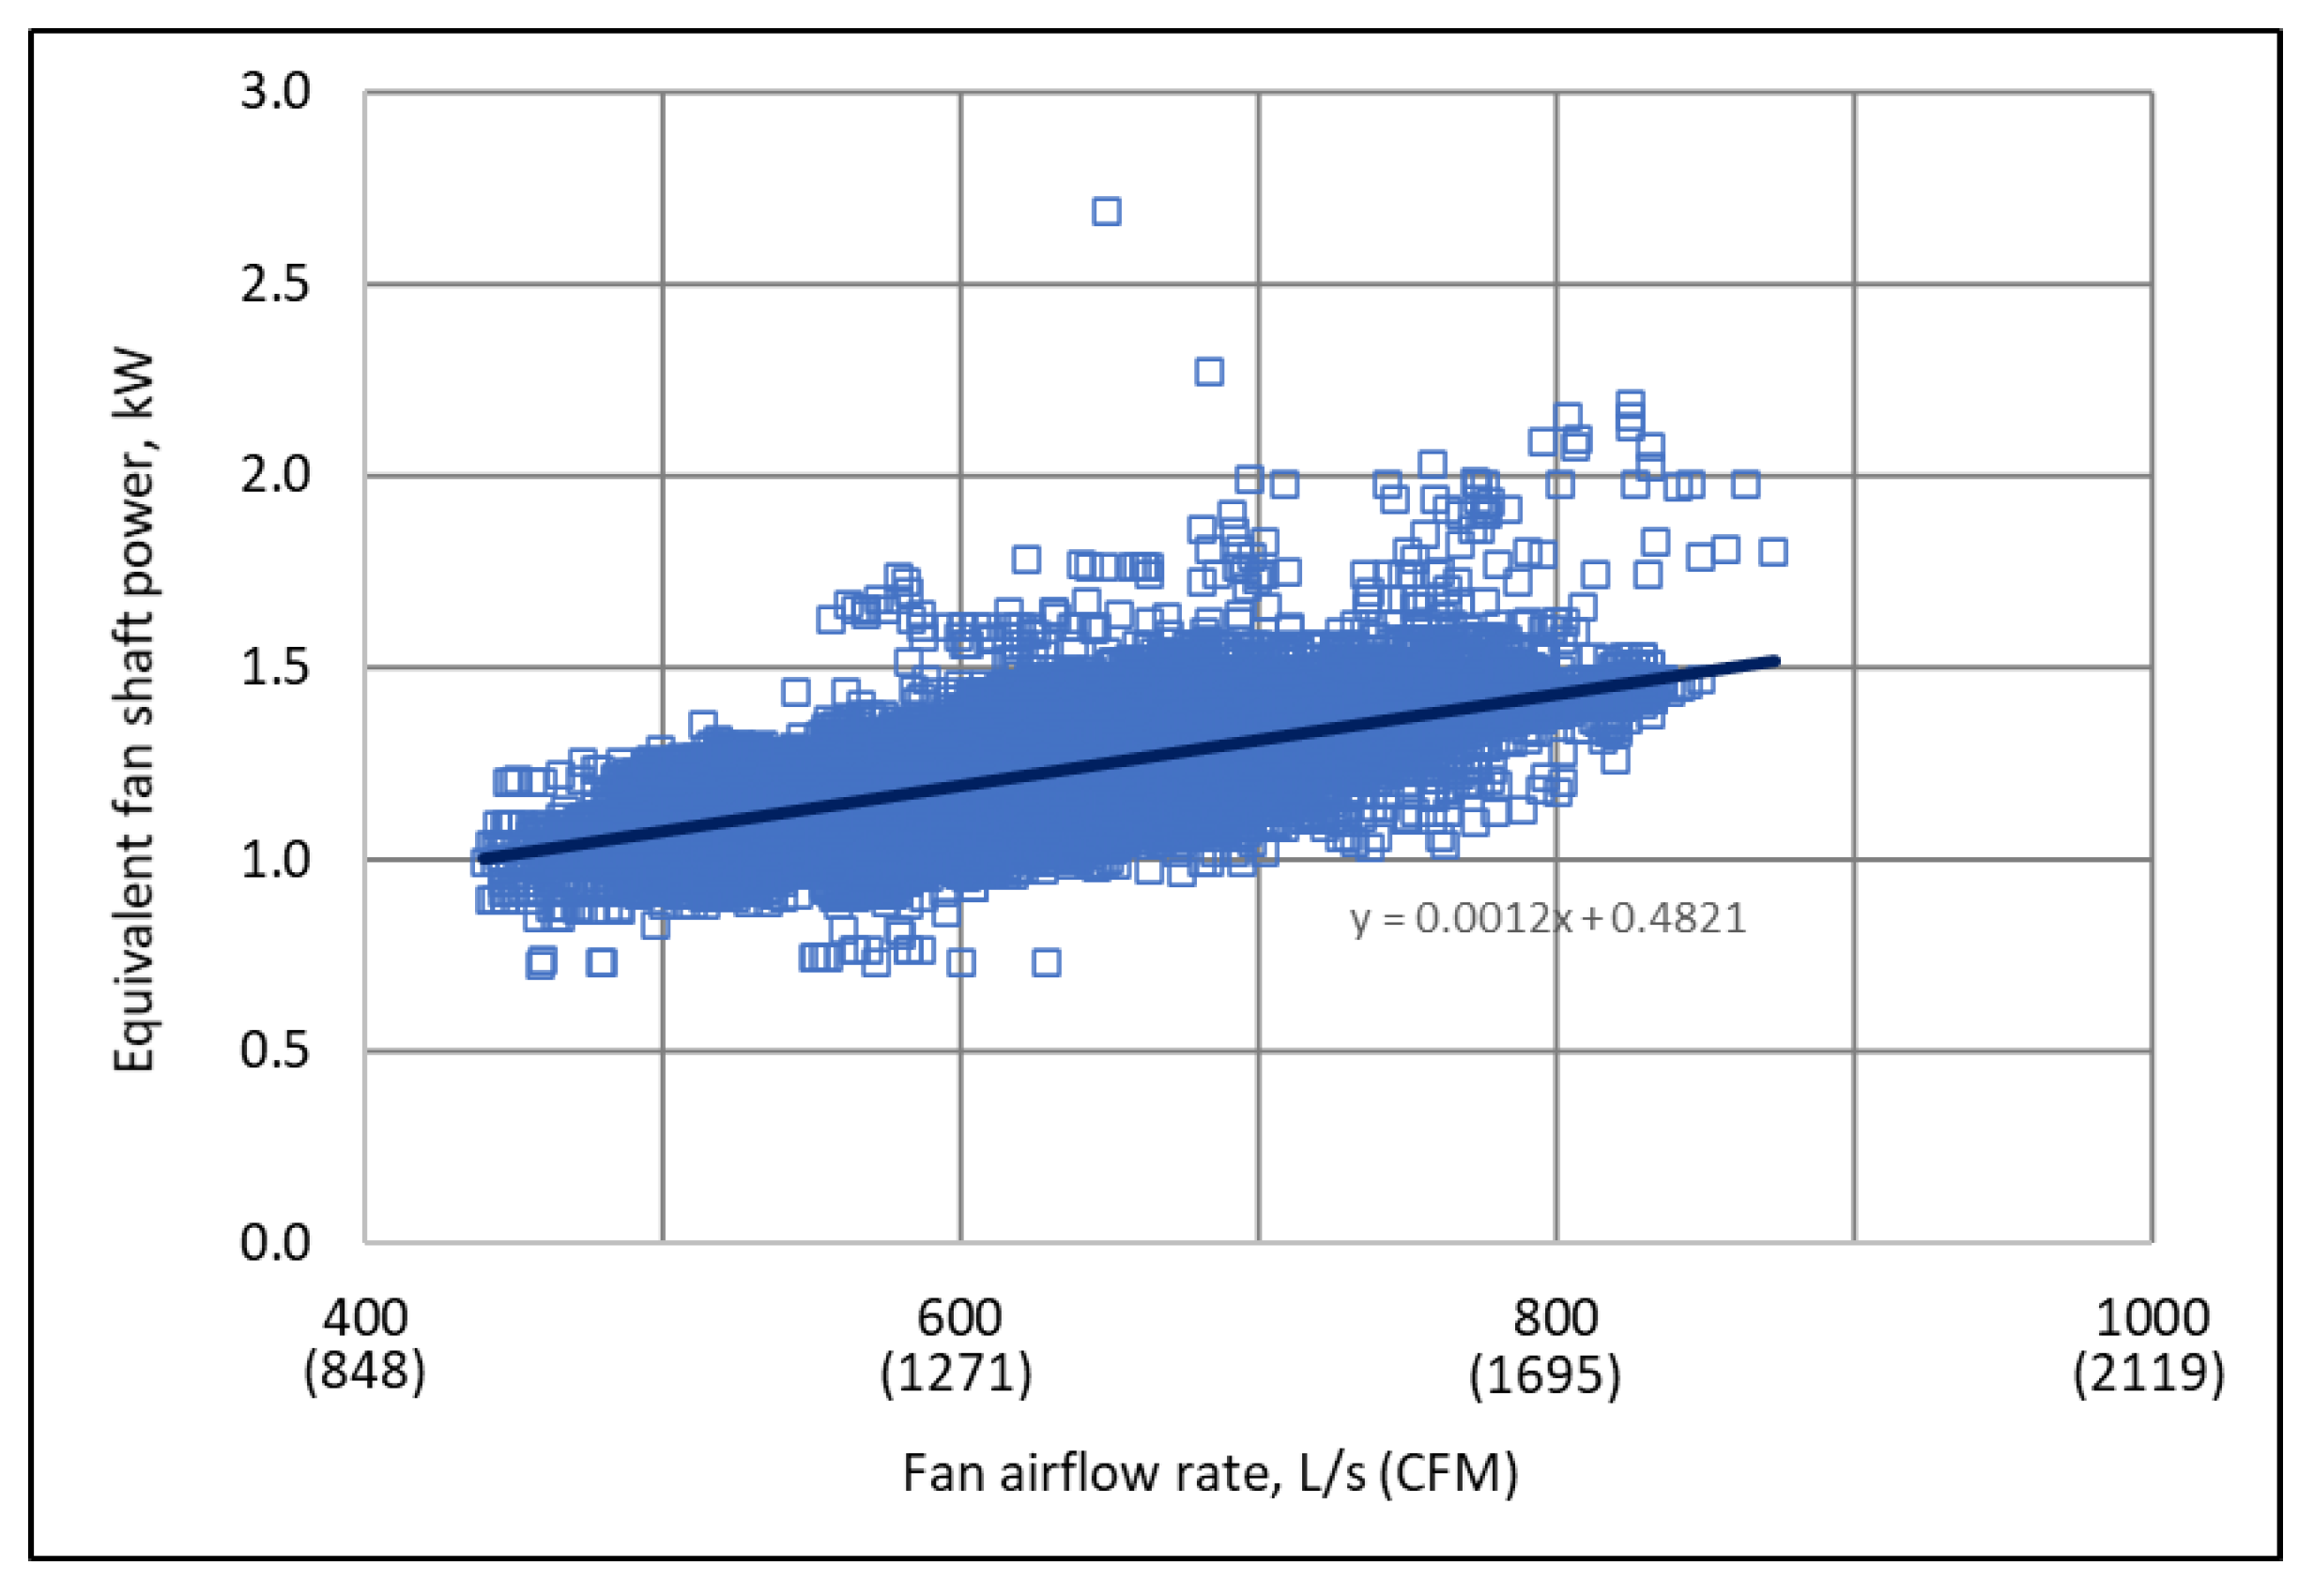
The equivalent fan shaft power versus airflow rate curve at the full design speed converted from the data at all the fan speeds is shown in Figure 9 and can be regressed as:
W s h , e = 0.0012 · Q + 0.482
where the fan airflow rate is in L/s and the equivalent fan shaft power is in kW. The fourth step in the identification approach is completed.

3.7. Energy Model and Overall Error Evaluation

Overall, the fan head curve defined by Equation (18), the equivalent fan efficiency curve defined by Equation (19), and the equivalent drive efficiency curve defined by Equation (20) configure the energy model of the studied VFD-motor-fan system. The equivalent fan shaft power curve defined by Equation (21) is dependent on the fan head curve and the equivalent fan efficiency curve. The system efficiency can be obtained from the equivalent drive efficiency curve and equivalent fan efficiency curve and is applied to model the system power input based on the fan airflow and head using Equation (15).
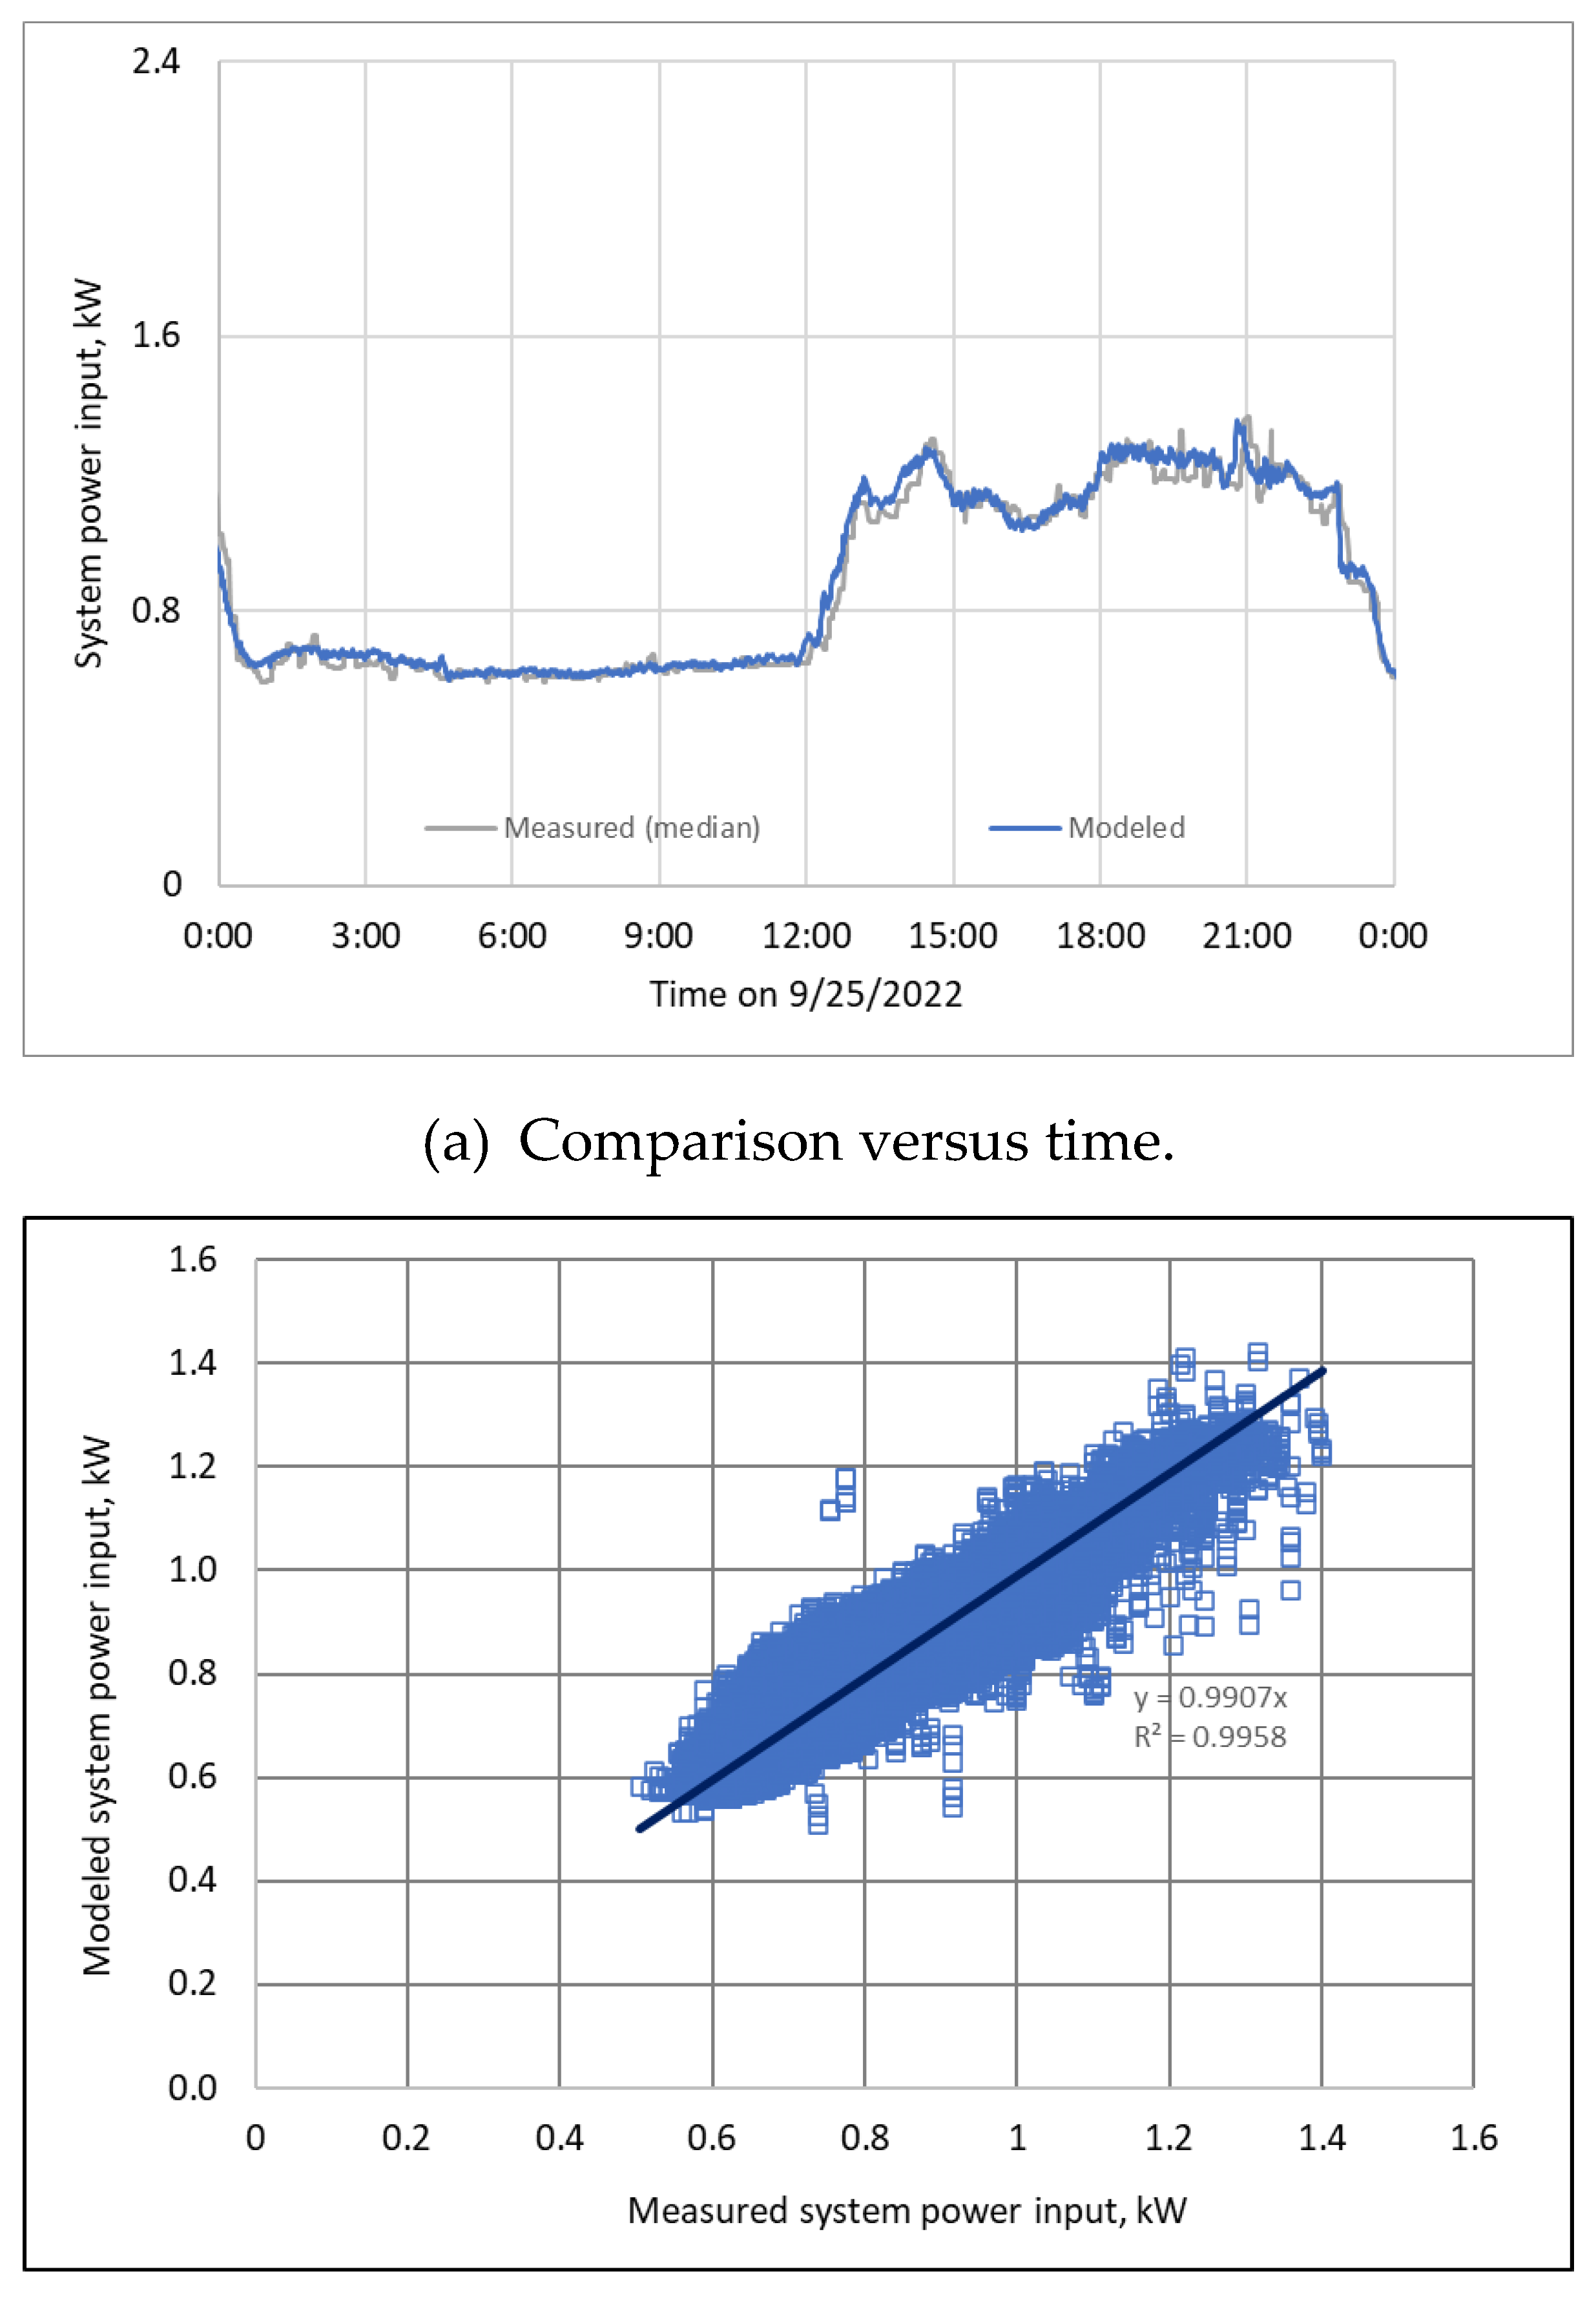
The overall error of the identified energy model can be evaluated by comparing the modeled system power input and the measured system power input. Figure 10(a) shows the comparison over a one-day period and Figure 10(b) shows the modeled system input versus the measured system power input over the entire identification period. The root mean squared error is 55W or 4% with respect to the maximum median system power input, 1.3kW.

4. Applications

The identified energy model of the studied system is applied to detect the slipped belt faults and to develop a virtual fan airflow meter with the measurements of the fan head, speed, and system power input. To demonstrate general applications, the fan airflow rate was not treated as an input in these applications since most AHUs do not have a permanently installed airflow meter even though the test AHU has one. The system performance data from August 1 to September 13, 2022, are applied to demonstrate the slipped belt fault detection, while the system performance data from October 26 to October 31, 2022, are applied to demonstrate the virtual fan flow meter development. Besides these two applications, the developed energy model can be potentially applied for the system power input simulation, as calculated system power input in Figure 10.

4.1. Fault Detection

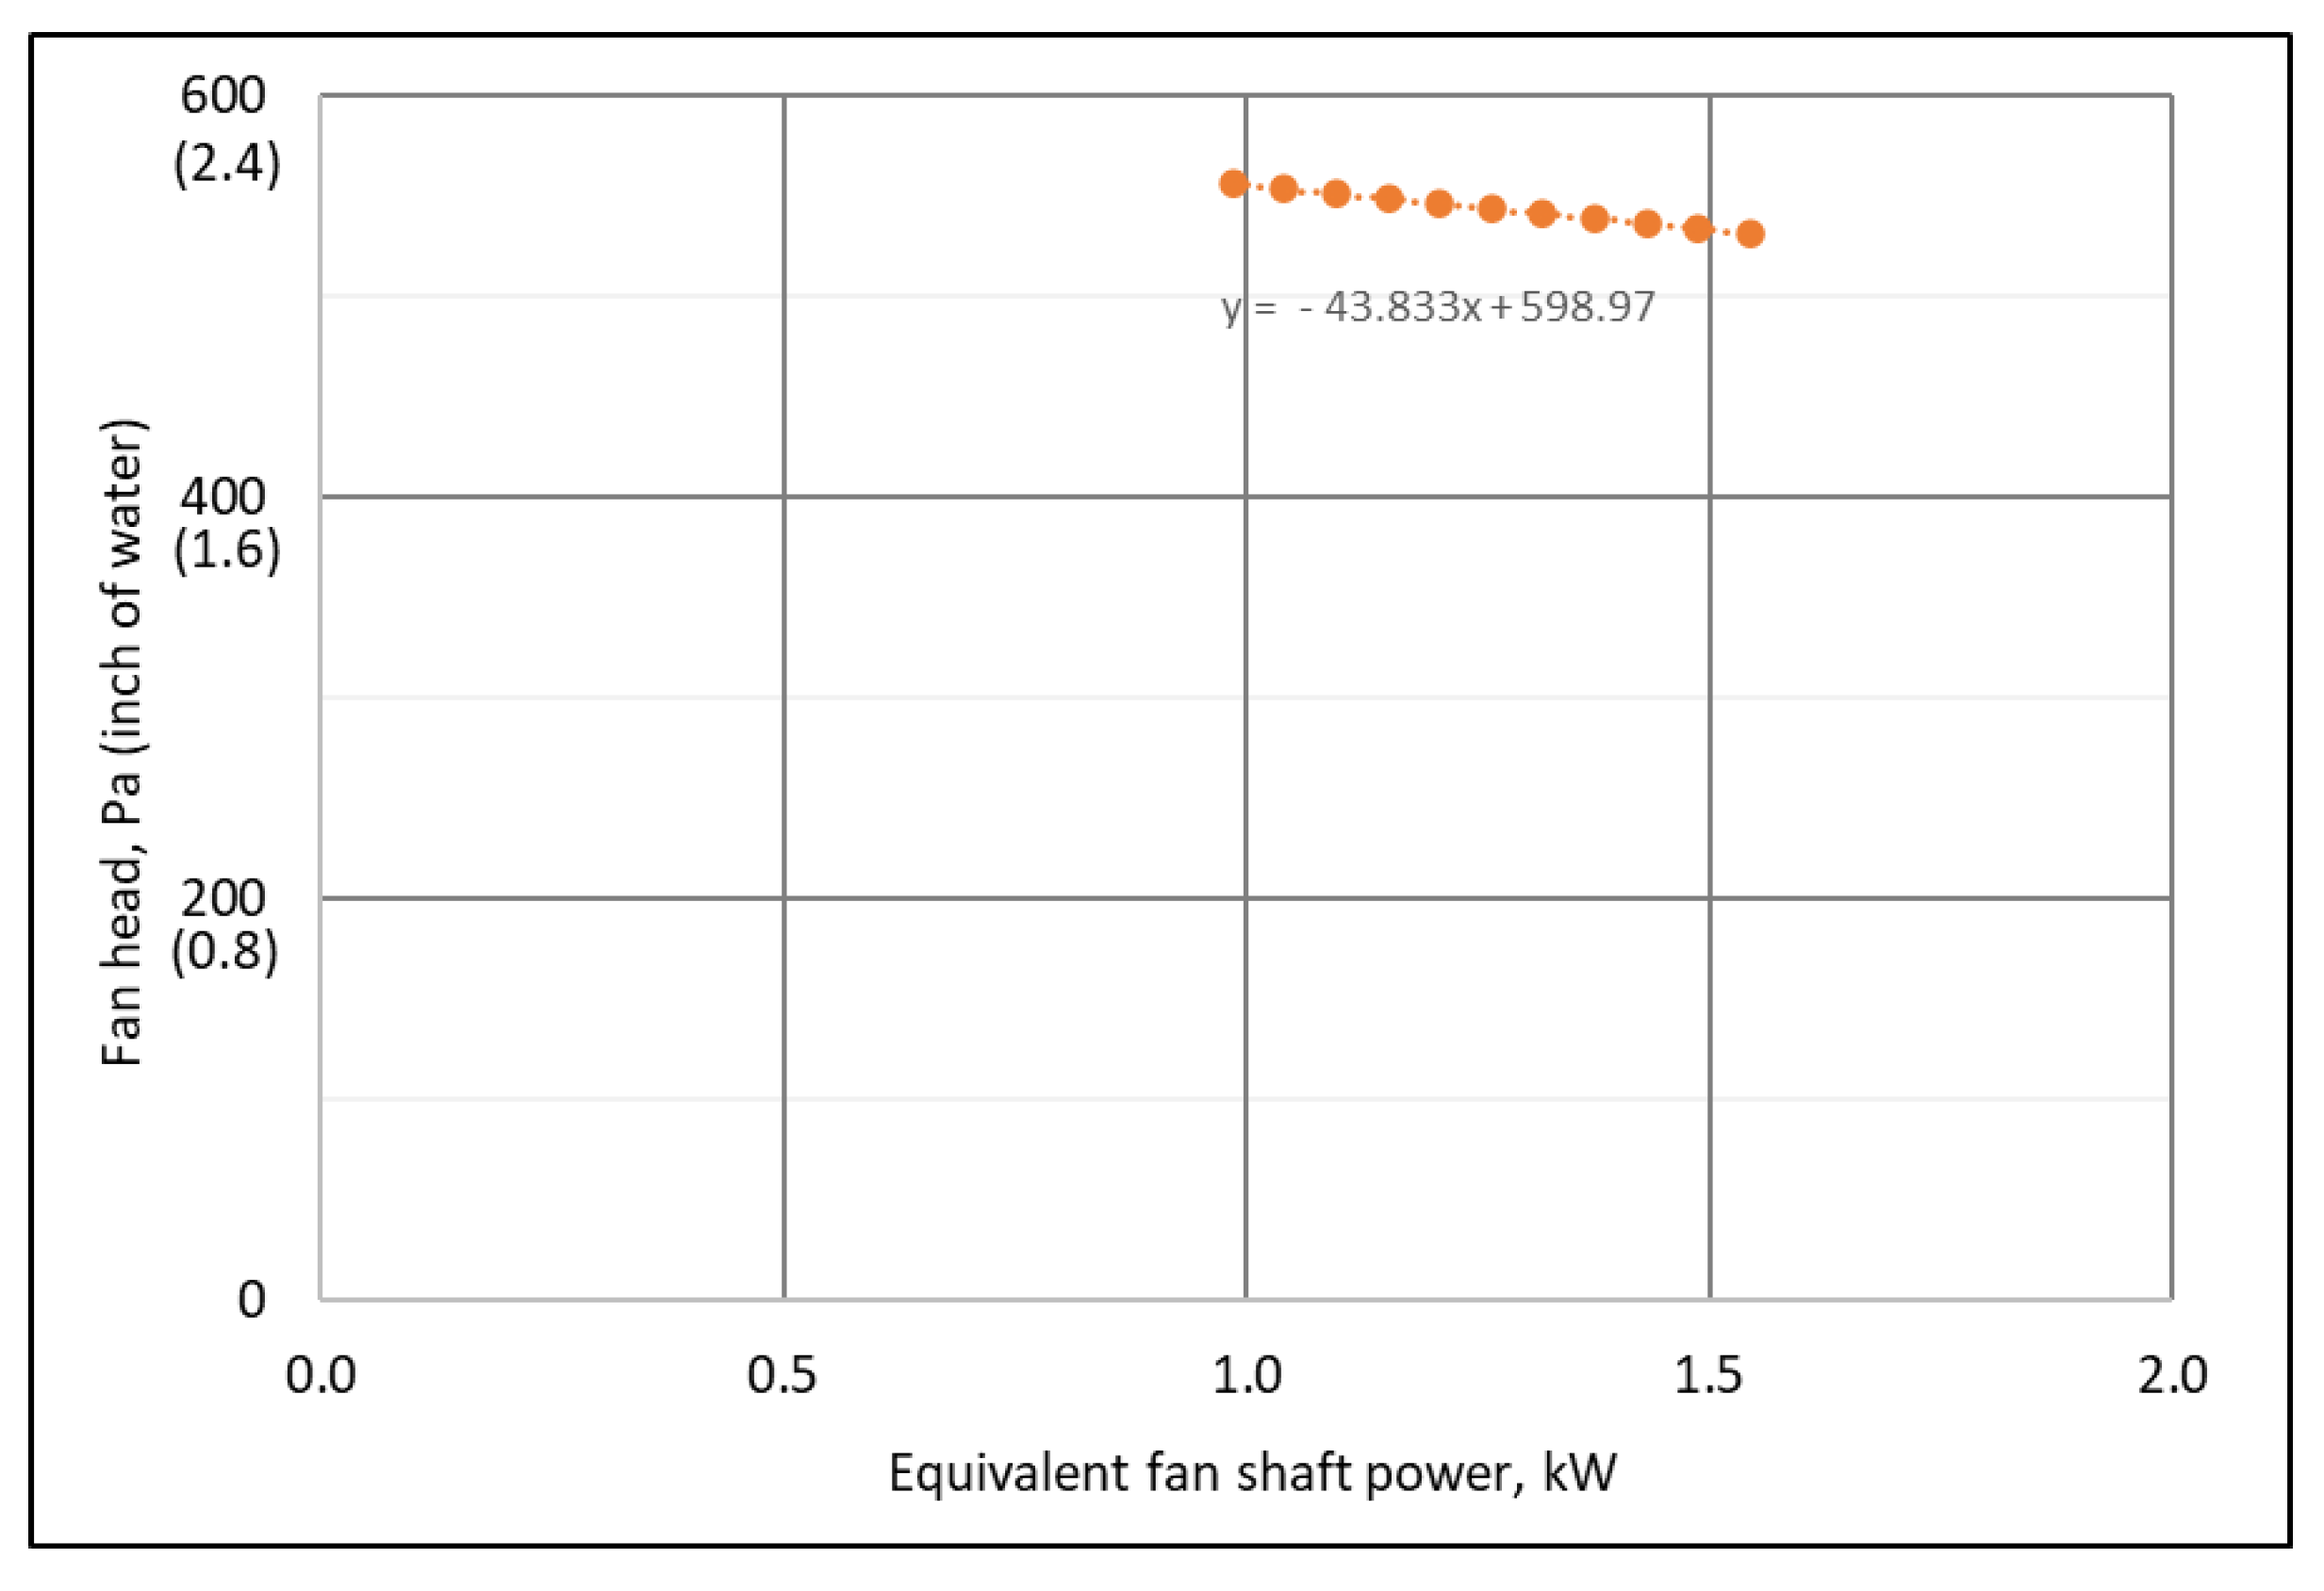
The fault-free fan head versus equivalent shaft power curve at the full design speed, associated with Equation (7), can be obtained from the identified fan head and equivalent shaft power curves, defined by Equations (18) and (21), and is shown in Figure 11. The fault-free fan head versus equivalent shaft power curve at the full design speed can be regressed as:
H d = 43.833 W s h , e   +   598.97
where the equivalent fan shaft power is in kW and the fan head is in Pa.
A two-step slipped belt fault detection approach is developed. First, at an operation condition defined by the fan head, speed, and system power input, the fault-free fan head in Equation (23) can be predicted by applying Equations (7) to Equation (22) along with the equivalent drive efficiency curve, defined by Equation (20), based on available fan speed and system power input.
H = 43.833 · W s y s · η d r i v e , e ( ω ) ω 3 + 598.97 · ω 2
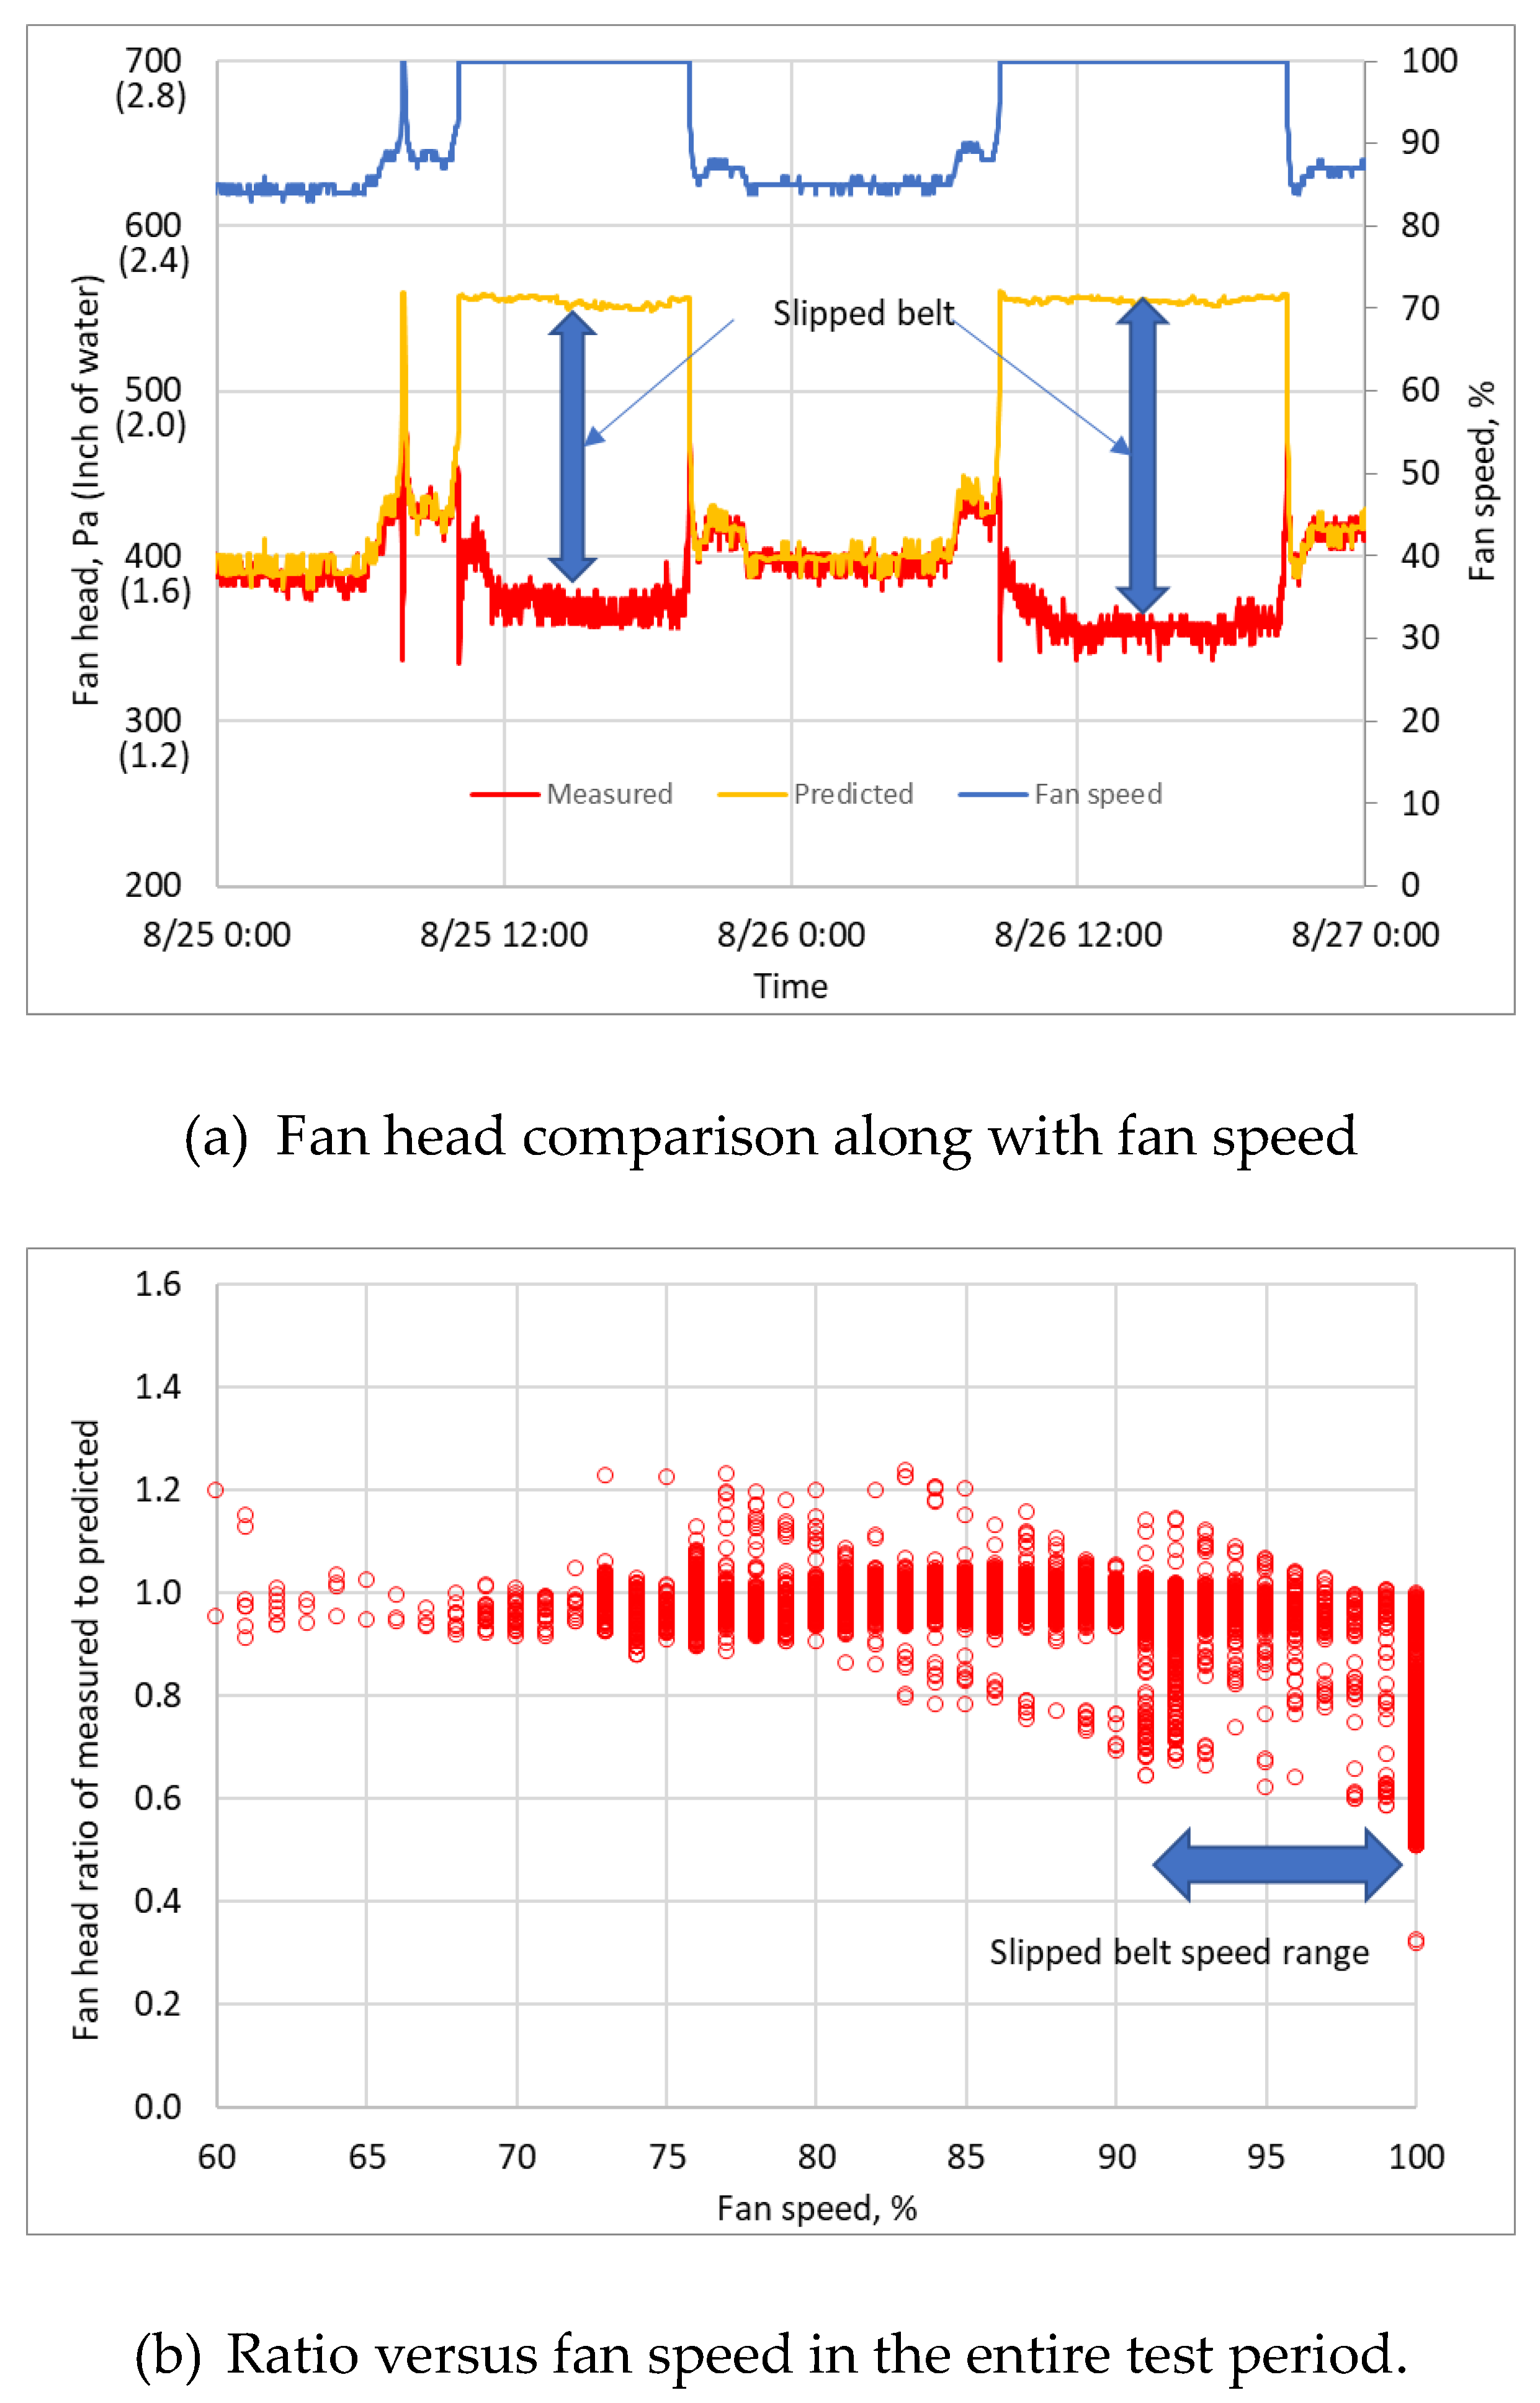
Second, the fault-free fan head is compared with the measured fan head. The ratio of the measured fan head to the predicted fan head indicates the operation status of the belt. The fault-free ratio should be close to unity. On the other hand, the slipped belt will result in the ratio less than a threshold, such as 80%.
The developed slipped belt fault detection algorithm is applied to the performance data. Figure 12(a) compares the predicted (yellow) and measured (red) fan head along with the fan speed (blue) in a two-day period and Figure 12(b) shows the ratio of the measured predicted fan head to the predicted measured fan head versus the fan speed in the entire test period. The deviation of the predicted fan head from the measured fan head in Figure 12(a) and the deviation of the fan head ratio from unity in Figure 12(b) indicate the slipped belt. Moreover, Figure 12(b) also reveals that the slipped belt status only occurred at the high fan speed from 90% to 100% full design speed even though the belt was slipped. This means that the slipped belt detection needs to be conducted at higher fan speeds.

4.2. Virtual Flow Meter Development

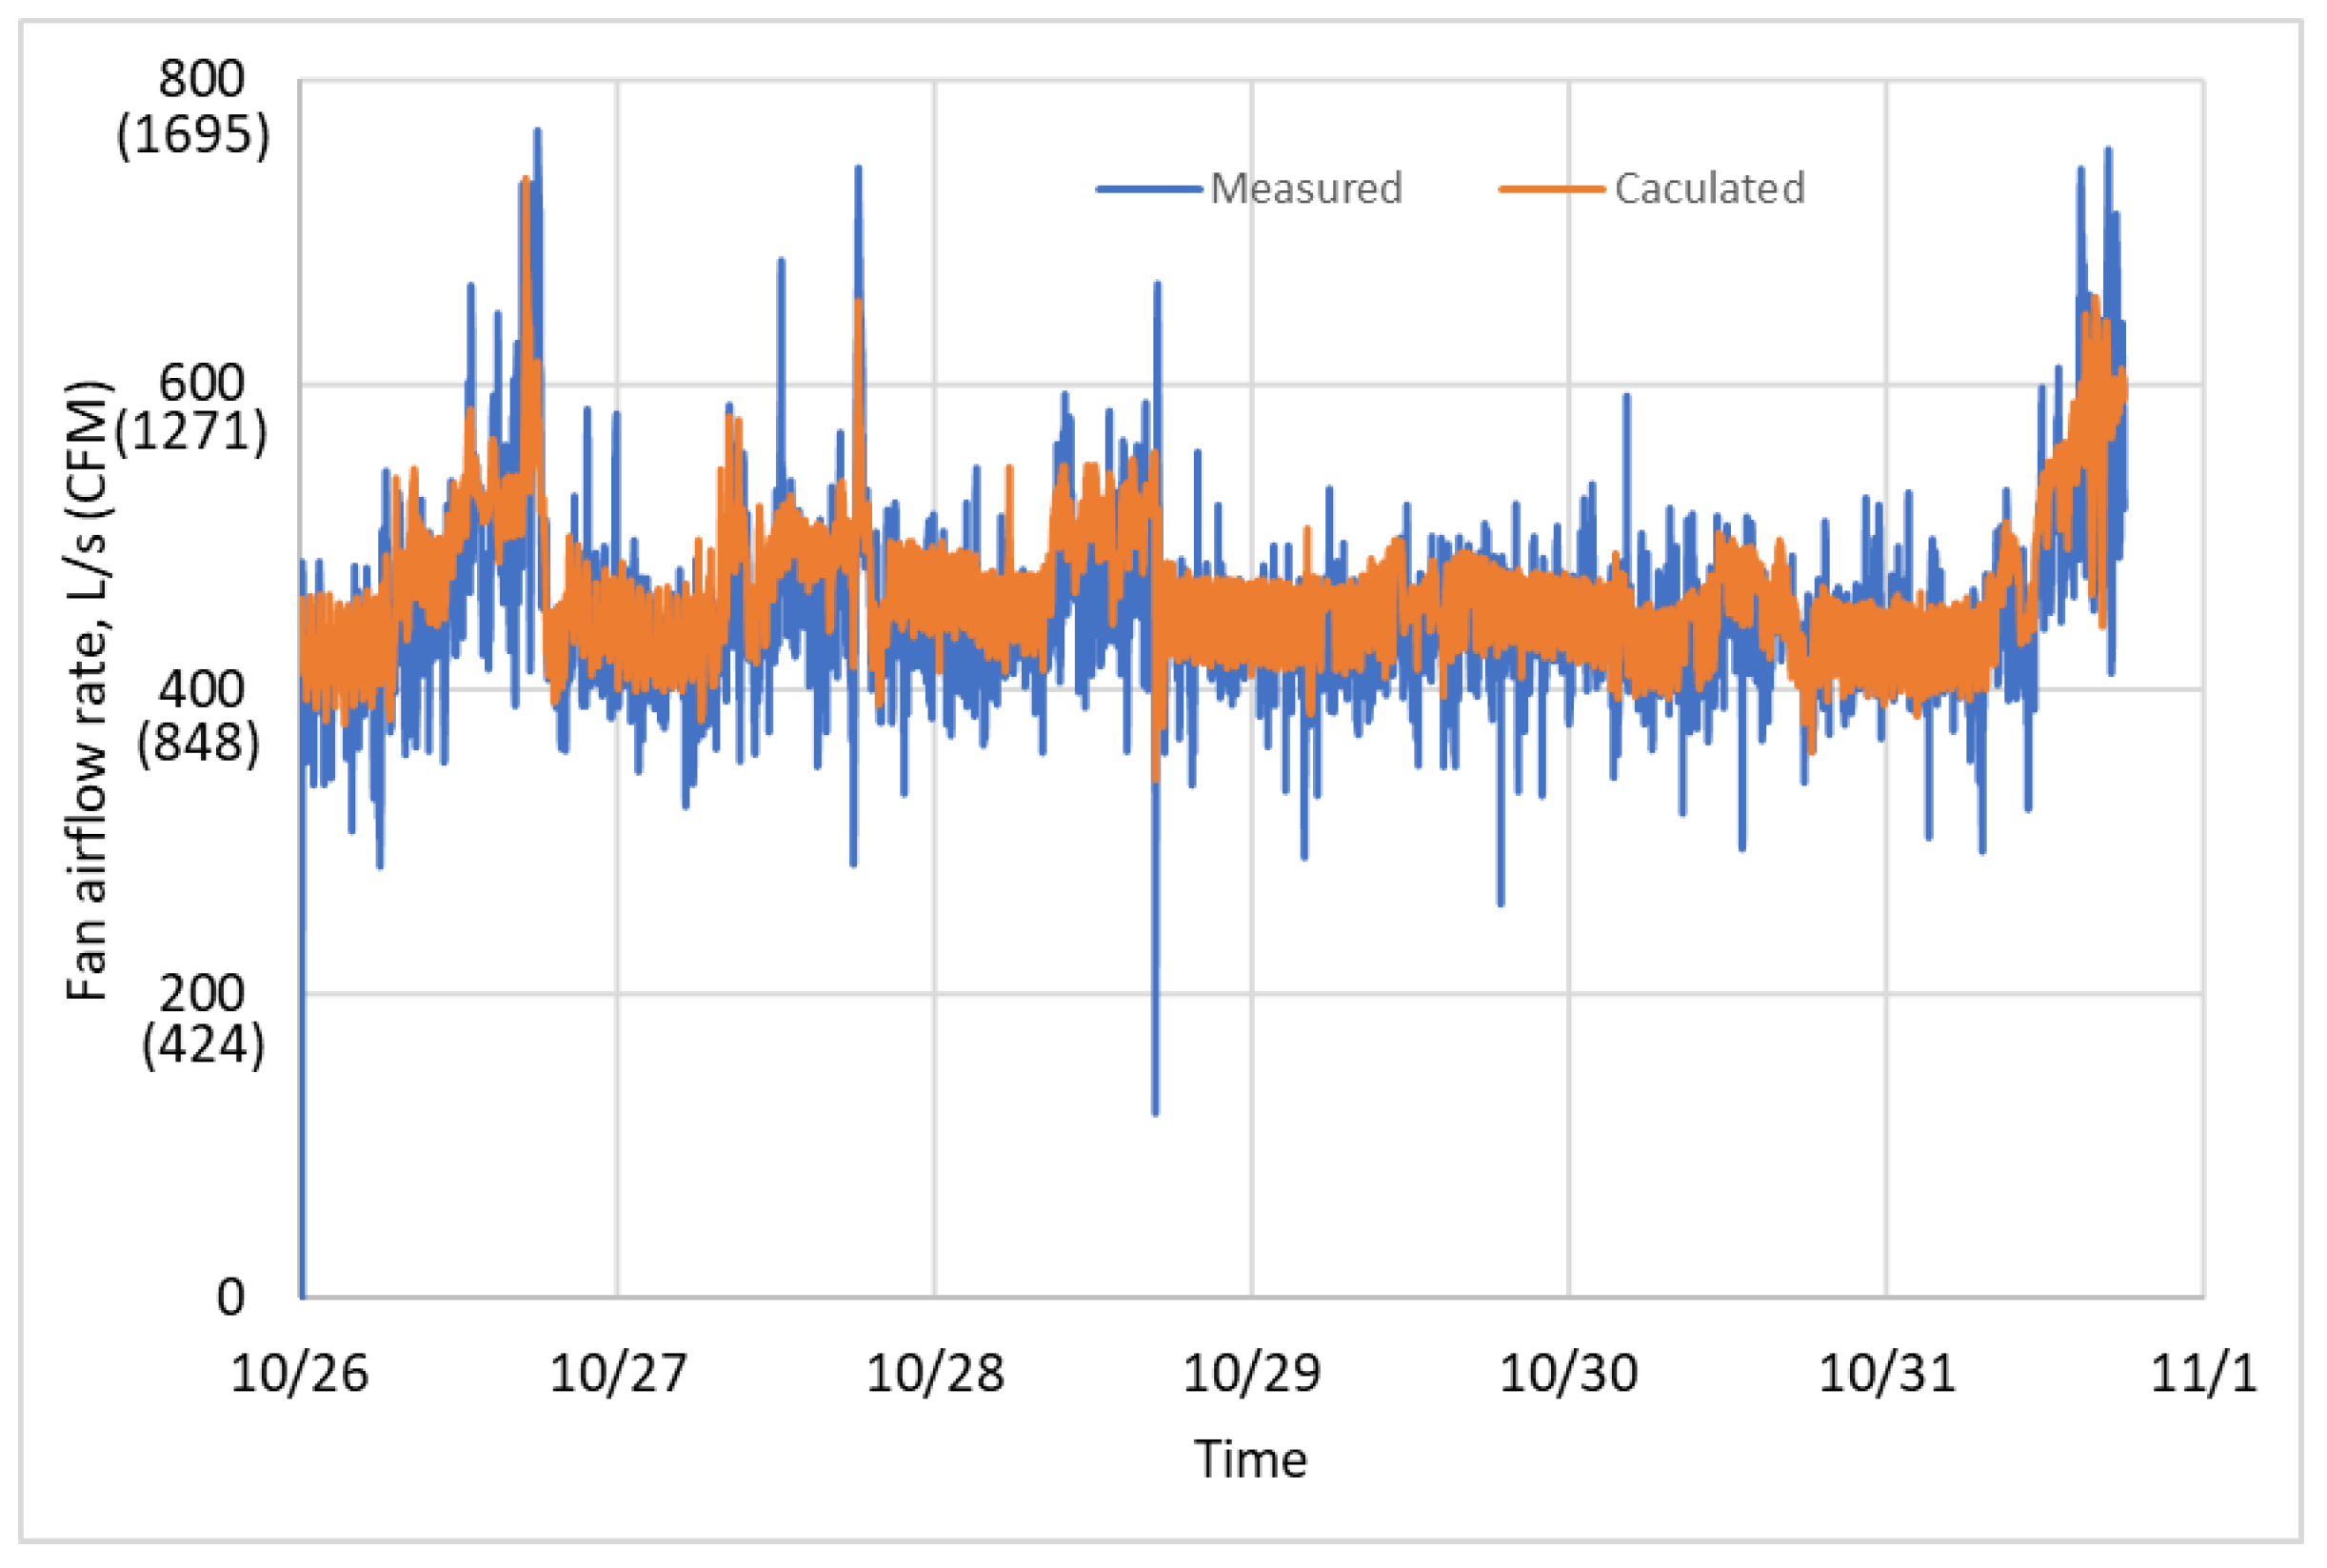
The airflow rate is required at AHUs for optimal operation on duct static pressure control, building pressure control, outdoor air control, and cooling demand control. However, in general, the airflow meter is not a conventional meter installed at AHUs. With the identified energy model defined by the fan head and equivalent fan shaft power curves along with the equivalent drive efficiency curve, a virtual fan flow meter can be developed to calculate the fan airflow rate based on the measured fan head, speed, and system power input. A three-step approach is followed:
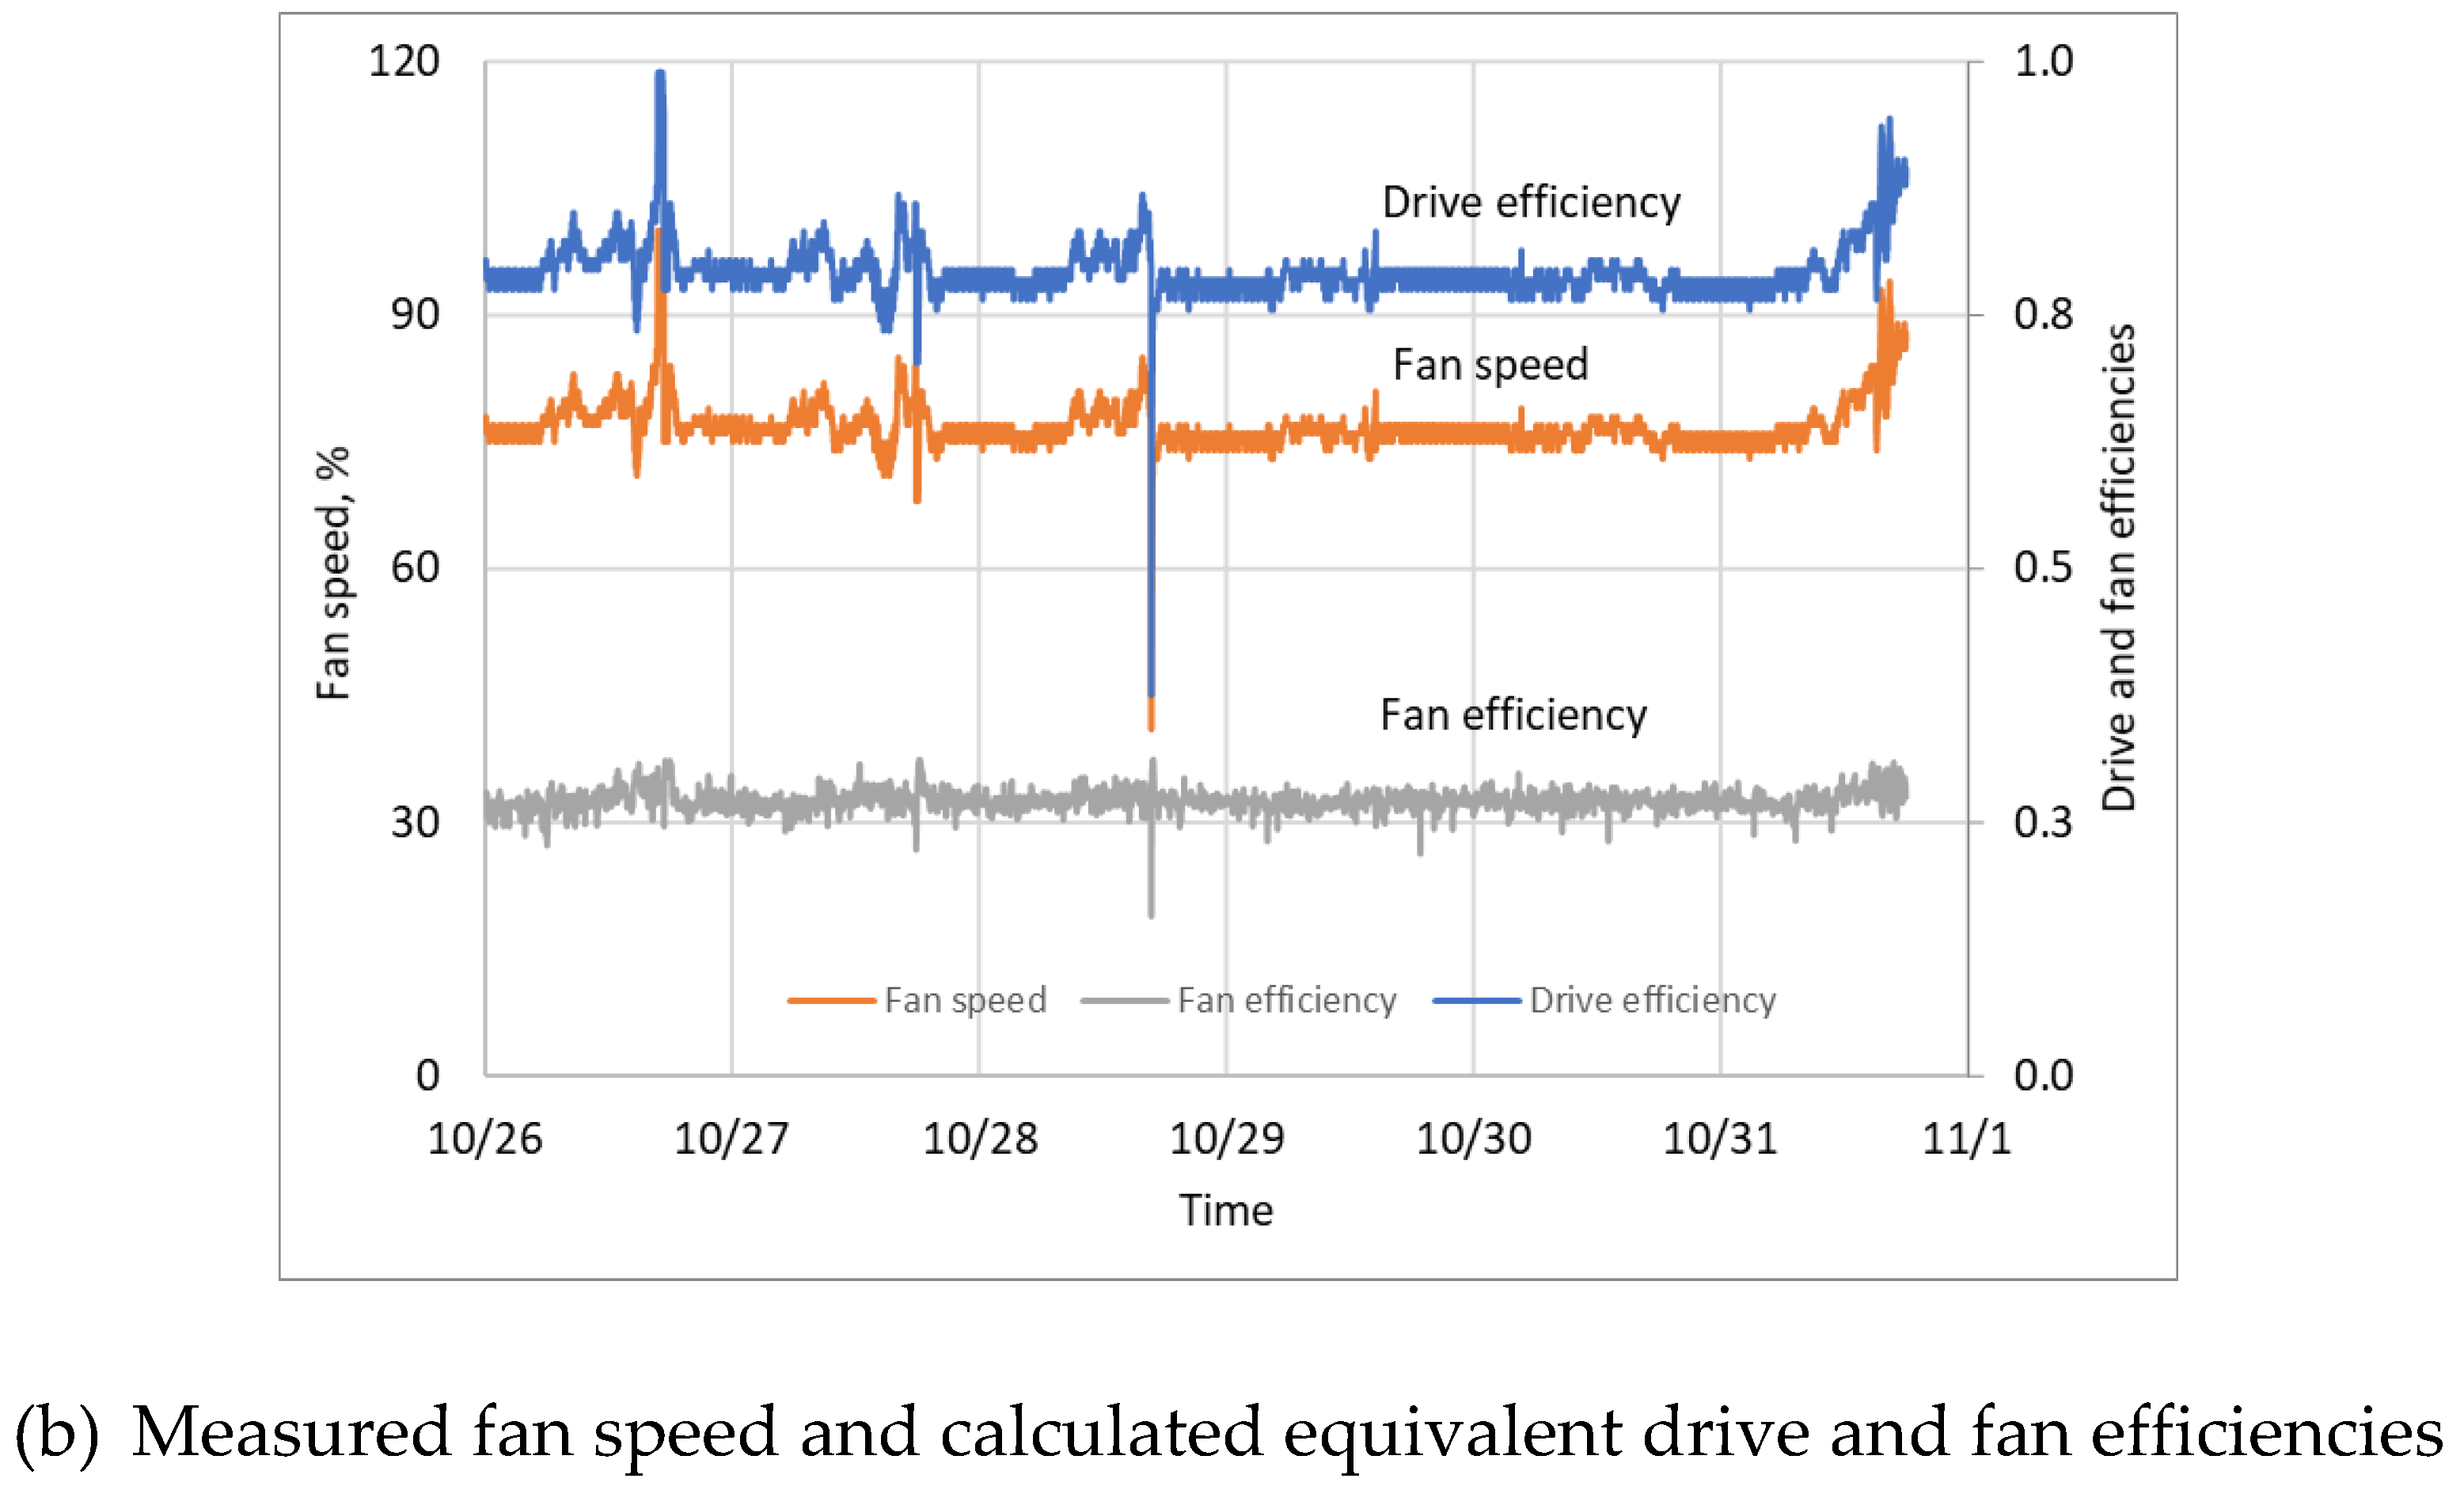
  • The equivalent drive efficiency is determined by the available fan speed using Equation (20) and is applied to calculate the equivalent fan shaft power using Equation (17).
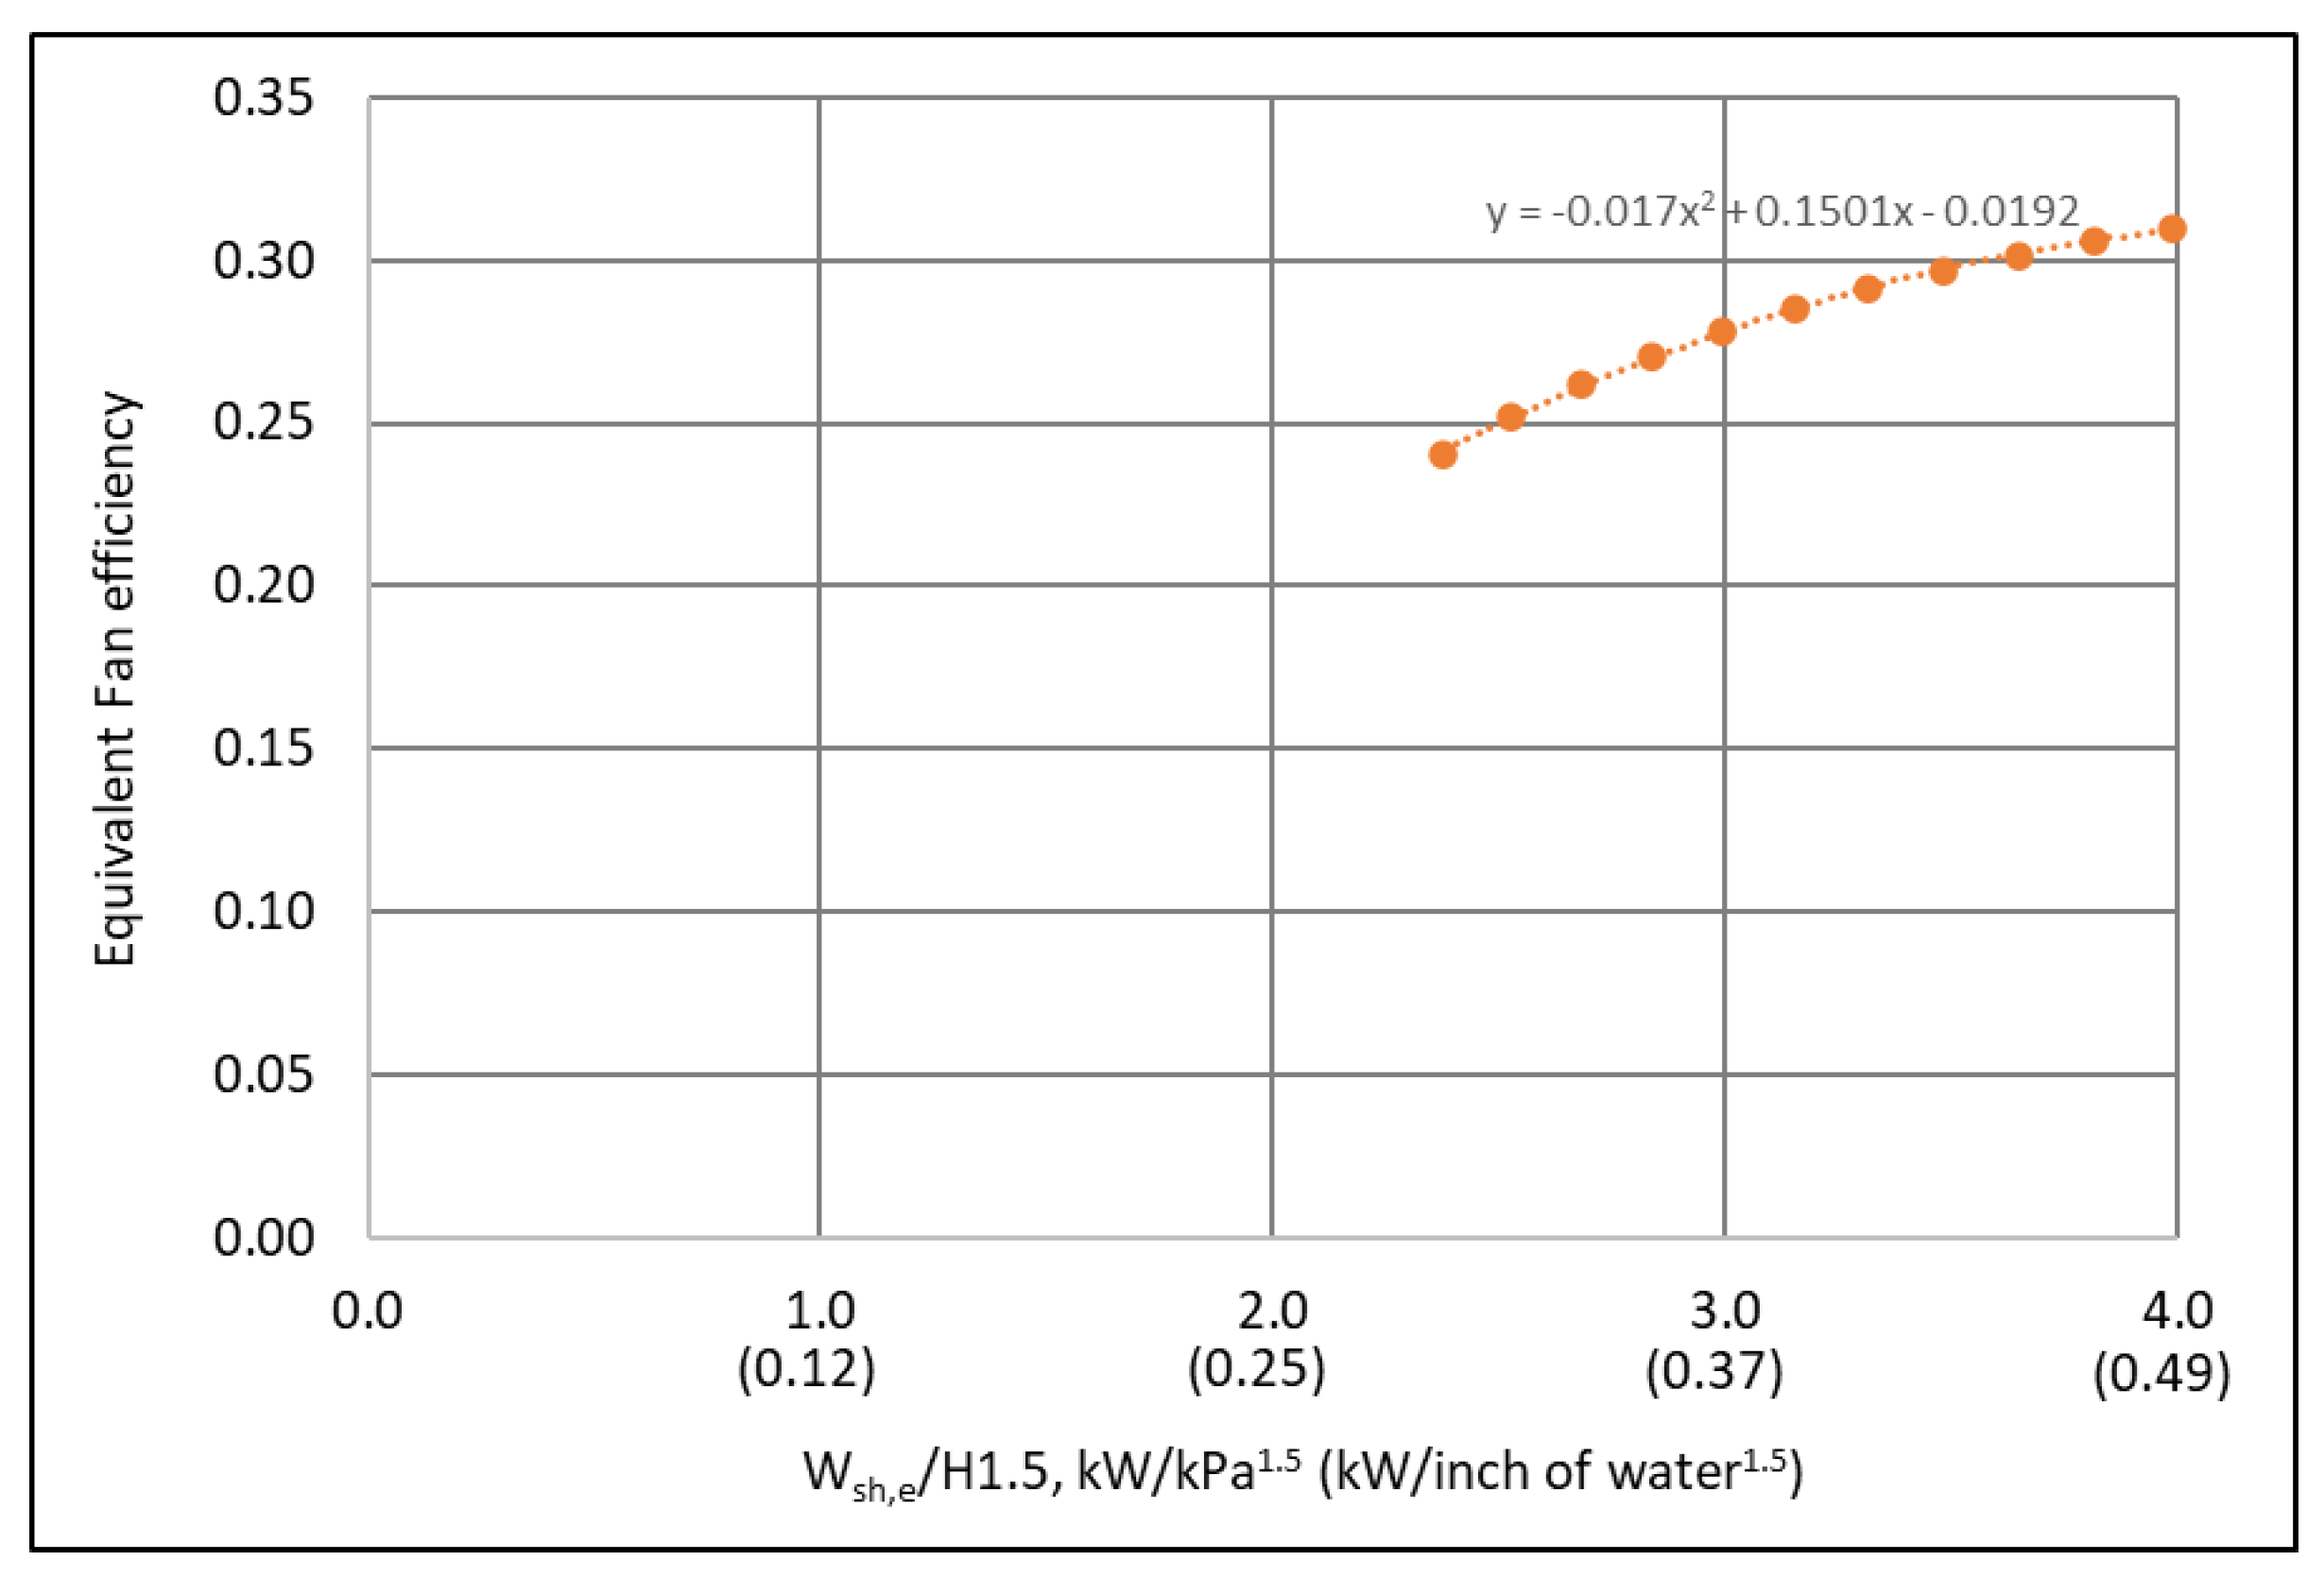
  • According to the affinity laws, the equivalent fan efficiency can be represented as a function of the ratio of the equivalent shaft power to the fan head to the power of 1.5, as shown by Equation (9), independent with the fan airflow rate. Based on the identified fan head and equivalent shaft power curves shown in Figure 6 and Figure 9, the equivalent fan efficiency is presented in Figure 13 and is regressed as:
    η f a n , e = 0.017 · W s h , e H 1.5 2 + 0.1501 · W s h , e H 1.5 0.0192
    where the equivalent fan shaft power is in kW and the fan head is in kPa.
  • The fan airflow rate can be virtually calculated from the measured fan head, speed, and system power input.
    Q = W s y s · η d r i v e , e ( ω ) · η f a n , e ( W s y s · η d r i v e , e / H 1.5 ) H
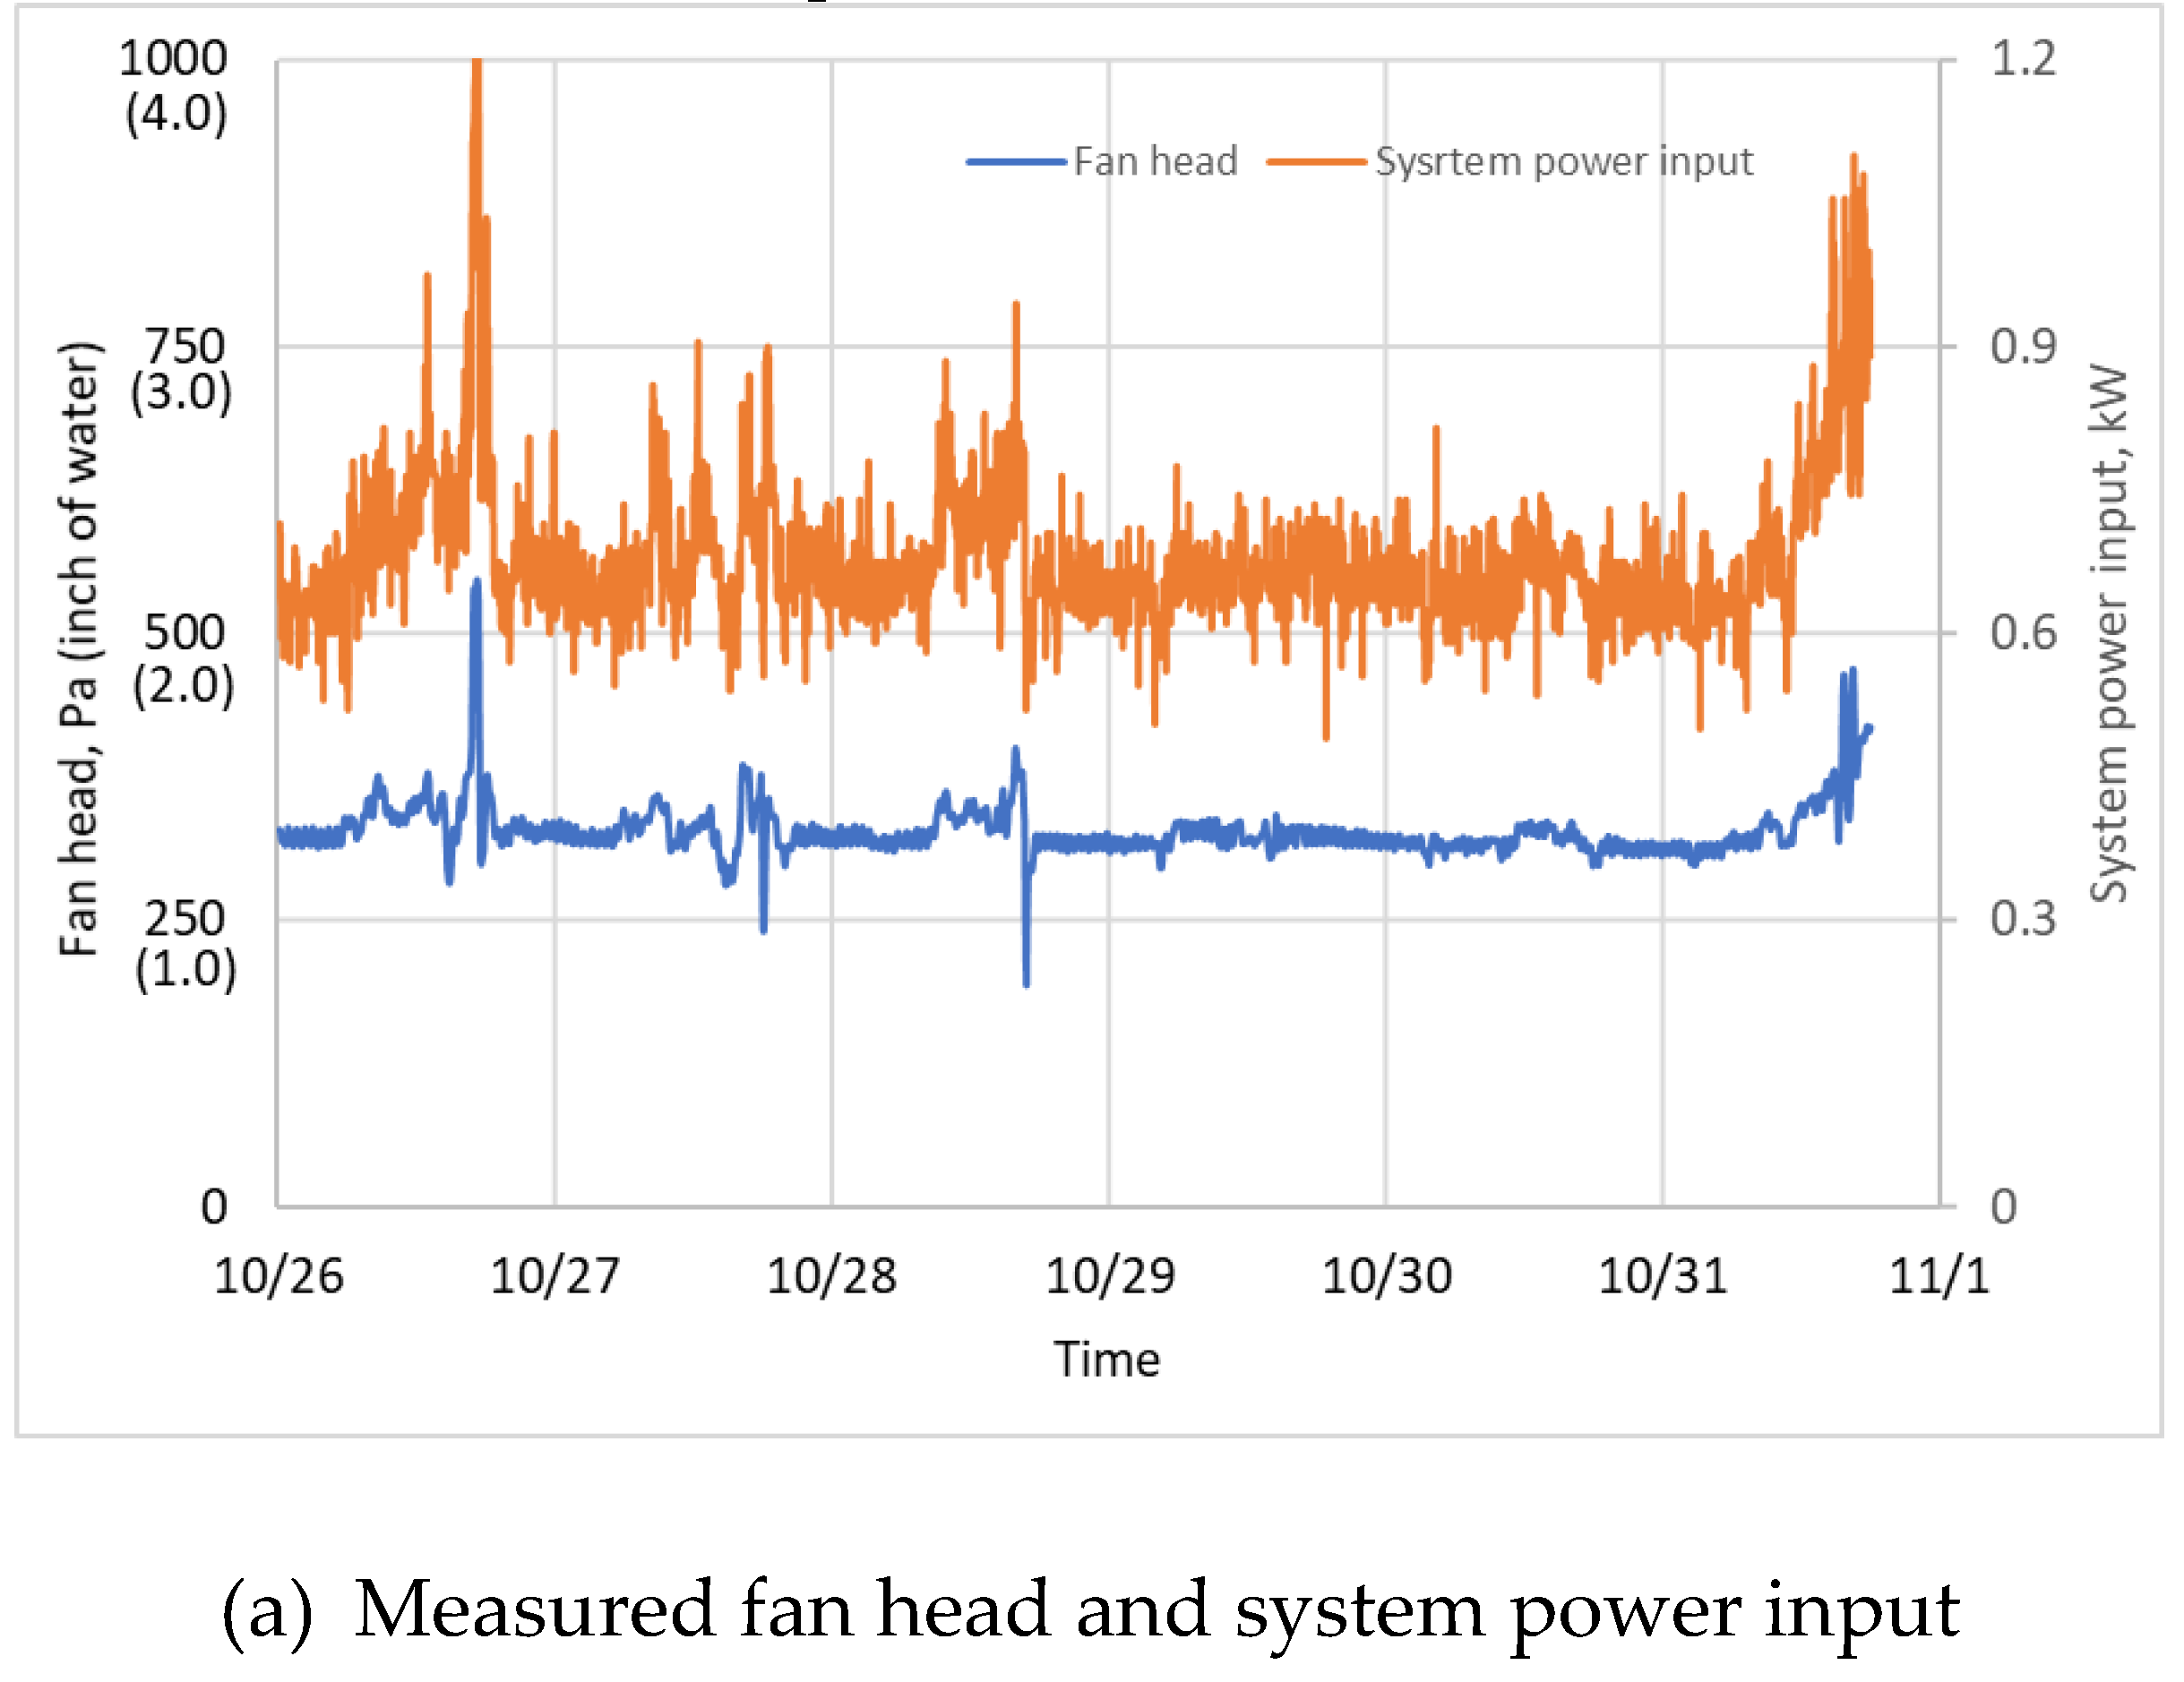
Figure 14 (a) shows the measured fan head (blue) and system power input (orange) and Figure 14(b) shows the measured fan speed (orange) as well as the calculated equivalent drive efficiency (blue) using Equation (20) and the calculated equivalent fan efficiency (gray) using Equation (24) in the virtual fan flow meter demonstration period.
Figure 15 compares the fan airflow rates measured by the physical airflow meter (blue) and calculated by the developed virtual airflow meter (orange) using Equation (25). The root mean squared error is 42 L/s (90 CFM) or 4% with respect to the design fan airflow rate, which majorly results from the oscillations of the VFD PWM output power.

4.3. Discussion

The VFD can provide accurate output power for large-sized motors, which has a stable value by the filter inside the VFD and results in accurate results. In this case, the VFD output power can replace the system power input without the need of a conventional power meter. The developed identification and application approaches can be applied in this case except that the drive efficiency must be replaced by the motor-belt efficiency.

5. Conclusions

In this paper, a four-step identification approach was developed to obtain the energy model of an existing VFD-motor-fan system without measuring the fan shaft power. With the developed approach, the fan head-airflow rate curve and the equivalent fan shaft power-airflow rate curve at the full design speed, the two speed-independent equivalent fan efficiency curves and the equivalent drive efficiency-fan speed curve were identified for an existing VFD-motor-fan system with the design fan airflow rate of 1,200L/s (2,500CFM) based on the measured fan head, speed, and system power input as well as temporarily measured airflow rate. The root mean squared error of the energy model is 55W or 4% with respect to the maximum system power input, 1.3kW.
Three techniques play a key role to identify the fan efficiency and drive system curves without the fan shaft power measurement. The first one is to use the system efficiency, which can always be calculated based on available fan head, speed, and system power input, to avoid the fan shaft power. The second one is to introduce the equivalent fan efficiency and equivalent drive efficiency. The unknown constant drive efficiency at the full speed is merged into both the equivalent efficiencies. The third one is to express the equivalent fan efficiency as a function of the ratio of the fan head to the fan airflow squared using the affinity laws and the equivalent drive efficiency as a function of the fan speed by consolidating three influencing factors (i.e., the fan shaft power, VFD output voltage and frequency). Two efficiency functions are uncorrelated.
The identified energy model was then applied to detect the slipped belt faults by a two-step fault detection approach and to develop a virtual fan flow meter by a three-step approach using the measured fan speed, head, and system power input. The developed fault detection algorithm can effectively detect the slipped belt faults by comparing the fault-free fan head with the measured fan head and the developed virtual flow meter can accurately calculate the fan supply airflow rate based on the measured fan speed and head and system power input with the root mean squared error of 42L/s (90CFM) in the studied system.

Acknowledgments

Omitted for peer-review.

Nomenclature

  • f = general function or VFD output frequency
  • H = fan head, Pa, kPa or inch of water
  • Q = fan airflow rate, L/s, m3/s or CFM
  • W = power, kW
  • ω = fan speed, %
  • η = efficiency

Subscripts: 

  • d = full design speed
  • e = equivalent
  • sh = shaft
  • sys = drive system

References

  1. DOE, Energy Savings Potential and Opportunities for High-Efficiency Electric Motors in Residential and Commercial Equipment. 2013, The U.S. Department of Energy Building Technologies Office: Washington, DC.
  2. Friedman, H., et al., Building Commissioning: Innovation to Practice Technical Report. California Energy Commission, PIER Energy-Related Environmental Research Program. 2007, CEC-500-2008-074.
  3. Dong, J., et al., Development and calibration of an online energy model for AHU fan. 2019, Oak Ridge National Lab.(ORNL), Oak Ridge, TN (United States).
  4. DOE, A sourcebook for industry: improving motor and drive system performance. 2008, Washington D.C.: The U.S. Department of Energy (DOE) Office of Energy Efficiency and Renewable Energy.
  5. Tukur, A. and K.P. Hallinan, Statistically informed static pressure control in multiple-zone VAV systems. Energy and Buildings, 2017. 135: p. 244-252. [CrossRef]
  6. Pang, X., M. Liu, and B. Zheng. Building pressure control in VAV system with relief air fan. in the Fifth International Conference for Enhanced Building Operations 2005. Pittsburgh, Pennsylvania, October 11-13, 2005.
  7. Phalak, K. and G. Wang, Minimum outdoor air control and building pressurization with lack of airflow and pressure sensors in air-handling units. Journal of Architectural Engineering, 2016. 22(2): p. 04015017. [CrossRef]
  8. Hurt, R., et al., Preliminary Investigation of Active Demand Flexibility Control at Air-Handling Units Using Energy Feedback Control. ASHRAE Transactions, 2022. 128(1).
  9. Hughes, A., Electric Motors and Drives: Fundamentals, Types and Applications. 2nd ed. 2006, Burlington, MA: Newnes.
  10. McQuiston, F.C., J.D. Parker, and J.D. Spitler, Heating, ventilating, and air conditioning: analysis and design. 2004: John Wiley & Sons.
  11. IEEE, IEEE Std 112™-2017: IEEE Standard Test Procedure for Polyphase Induction Motors and Generators. 2017, Institute of Electrical and Electronics Engineers: New York, NY, USA.
  12. Stein, J. and M.M. Hydeman, Development and Testing of the Characteristic Curve Fan Model. ASHRAE transactions, 2004. 110(1).
  13. Wildi, T., Electrical machines, drives and power systems, ed. t. Edition. 2002: Upper Saddle River: Pearson Education, Inc.
  14. Domijan, A., A. Abu-aisheh, and D. Czarkowski, Efficiency and separation of losses of an induction motor and its adjustable-speed drive at different loading/speed combinations. ASHRAE Transactions, 1997. 103(1): p. 228-234.
  15. Gao, X., S.A. McInerny, and S.P. Kavanaugh, Efficiencies of an 11.2 kW variable speed motor and drive. ASHRAE Transactions, 2001. 107.
  16. Burt, C.M., et al., Electric motor efficiency under variable frequencies and loads. Journal of irrigation and drainage engineering, 2008. 134(2): p. 129-136. [CrossRef]
  17. Wang, F., H. Yoshida, and M. Miyata, Total Energy Consumption Model of Fan Subsystem Suitable for Continuous Commissioning. ASHRAE Transactions, 2004. 110(1).
  18. Han, Z., L. Ding, and G. Wang, Experimental Investigation of Induction Motor Power Factor and Efficiency Impacted by Pulse Width Modulation Power and Voltage Controls of Variable-Frequency Drives. ASHRAE Transactions, 2021. 127: p. 817-828.
  19. DOE, Energy Tips: Motor Systems (Tip Sheet #11). 2012, The U.S. Department of Energy Advanced Manufacturing Office of Energy Efficiency and Renewable Energy: Washington, DC. .
  20. Krukowski, A. and C.P. Wray, Standardizing data for VFD. ASHRAE Journal, 2013. 55(12): p. 8-10.
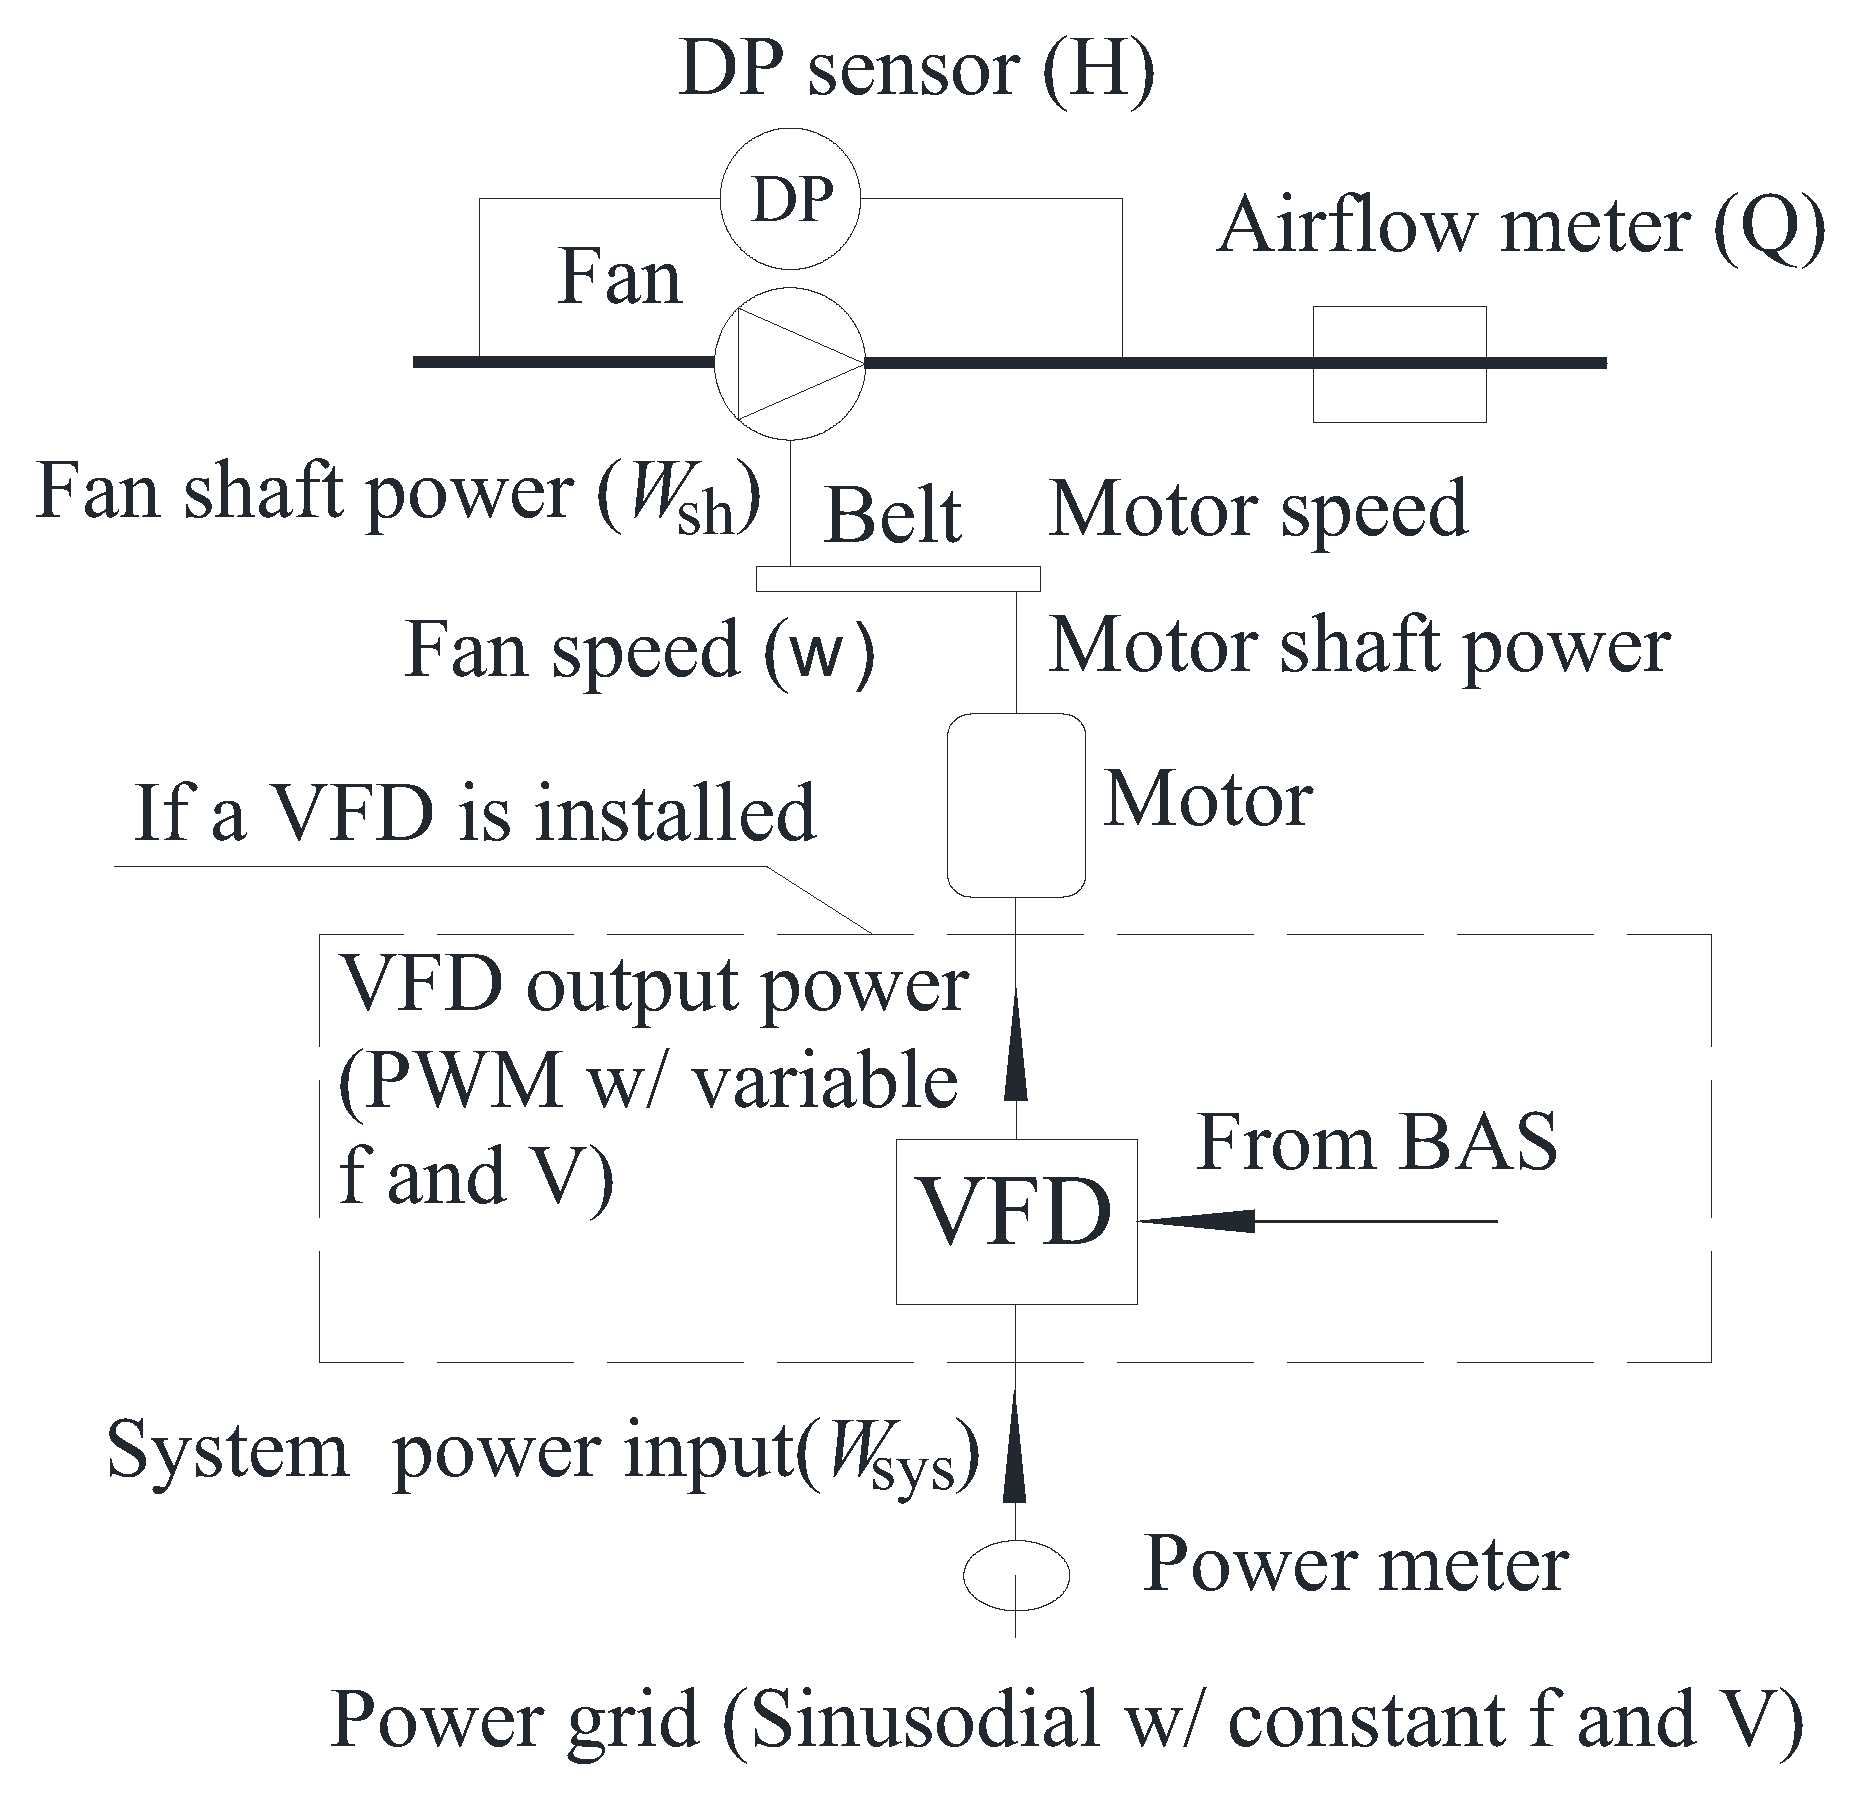
Figure 1. Schematic of a VFD-motor-fan system.
Preprints 76423 g001
Figure 2. Identification flow chart.
Preprints 76423 g002
Figure 3. Measured fan performance data versus time.
Preprints 76423 g003aPreprints 76423 g003b
Figure 4. Fan head and system power input versus airflow at various fan speed ranges.
Preprints 76423 g004aPreprints 76423 g004b
Figure 5. Fan head and system power input versus airflow rate at the full design speed.
Preprints 76423 g005aPreprints 76423 g005b
Figure 6. Fan head curve at the full design speed.
Preprints 76423 g006
Figure 7. System efficiency versus the ratio of fan head to fan airflow squared.
Preprints 76423 g007
Figure 8. Equivalent drive efficiency and equivalent fan shaft power curve.
Preprints 76423 g008
Figure 9. Equivalent shaft power curves at the full design speed.
Preprints 76423 g009
Figure 10. Comparison of modeled and measured system power input.
Preprints 76423 g010
Figure 11. Fan head versus equivalent shaft power curve at the full design speed.
Preprints 76423 g011
Figure 12. Slipped belt fault detection.
Preprints 76423 g012
Figure 13. Fan efficiency versus the ratio of fan shaft power to fan head to the power of 1.5.
Preprints 76423 g013
Figure 14. Inputs and efficiencies for the virtual flow meter.
Preprints 76423 g014aPreprints 76423 g014b
Figure 15. Validation of the virtual flow meter.
Preprints 76423 g015
Disclaimer/Publisher’s Note: The statements, opinions and data contained in all publications are solely those of the individual author(s) and contributor(s) and not of MDPI and/or the editor(s). MDPI and/or the editor(s) disclaim responsibility for any injury to people or property resulting from any ideas, methods, instructions or products referred to in the content.
Copyright: This open access article is published under a Creative Commons CC BY 4.0 license, which permit the free download, distribution, and reuse, provided that the author and preprint are cited in any reuse.
Prerpints.org logo

Preprints.org is a free preprint server supported by MDPI in Basel, Switzerland.

Subscribe

© 2024 MDPI (Basel, Switzerland) unless otherwise stated