Submitted:
13 June 2023
Posted:
14 June 2023
You are already at the latest version
Abstract
Keywords:
1. Introduction
2. Materials and Methods
2.1. Study Area
2.2. Collection of Tree Information
2.3. Evaluation of Crown Variables
2.4. UAV Multispectral Images
2.5. Vegetation Indices
2.6. Health Condition
2.7. Data Anaslysis
3. Results
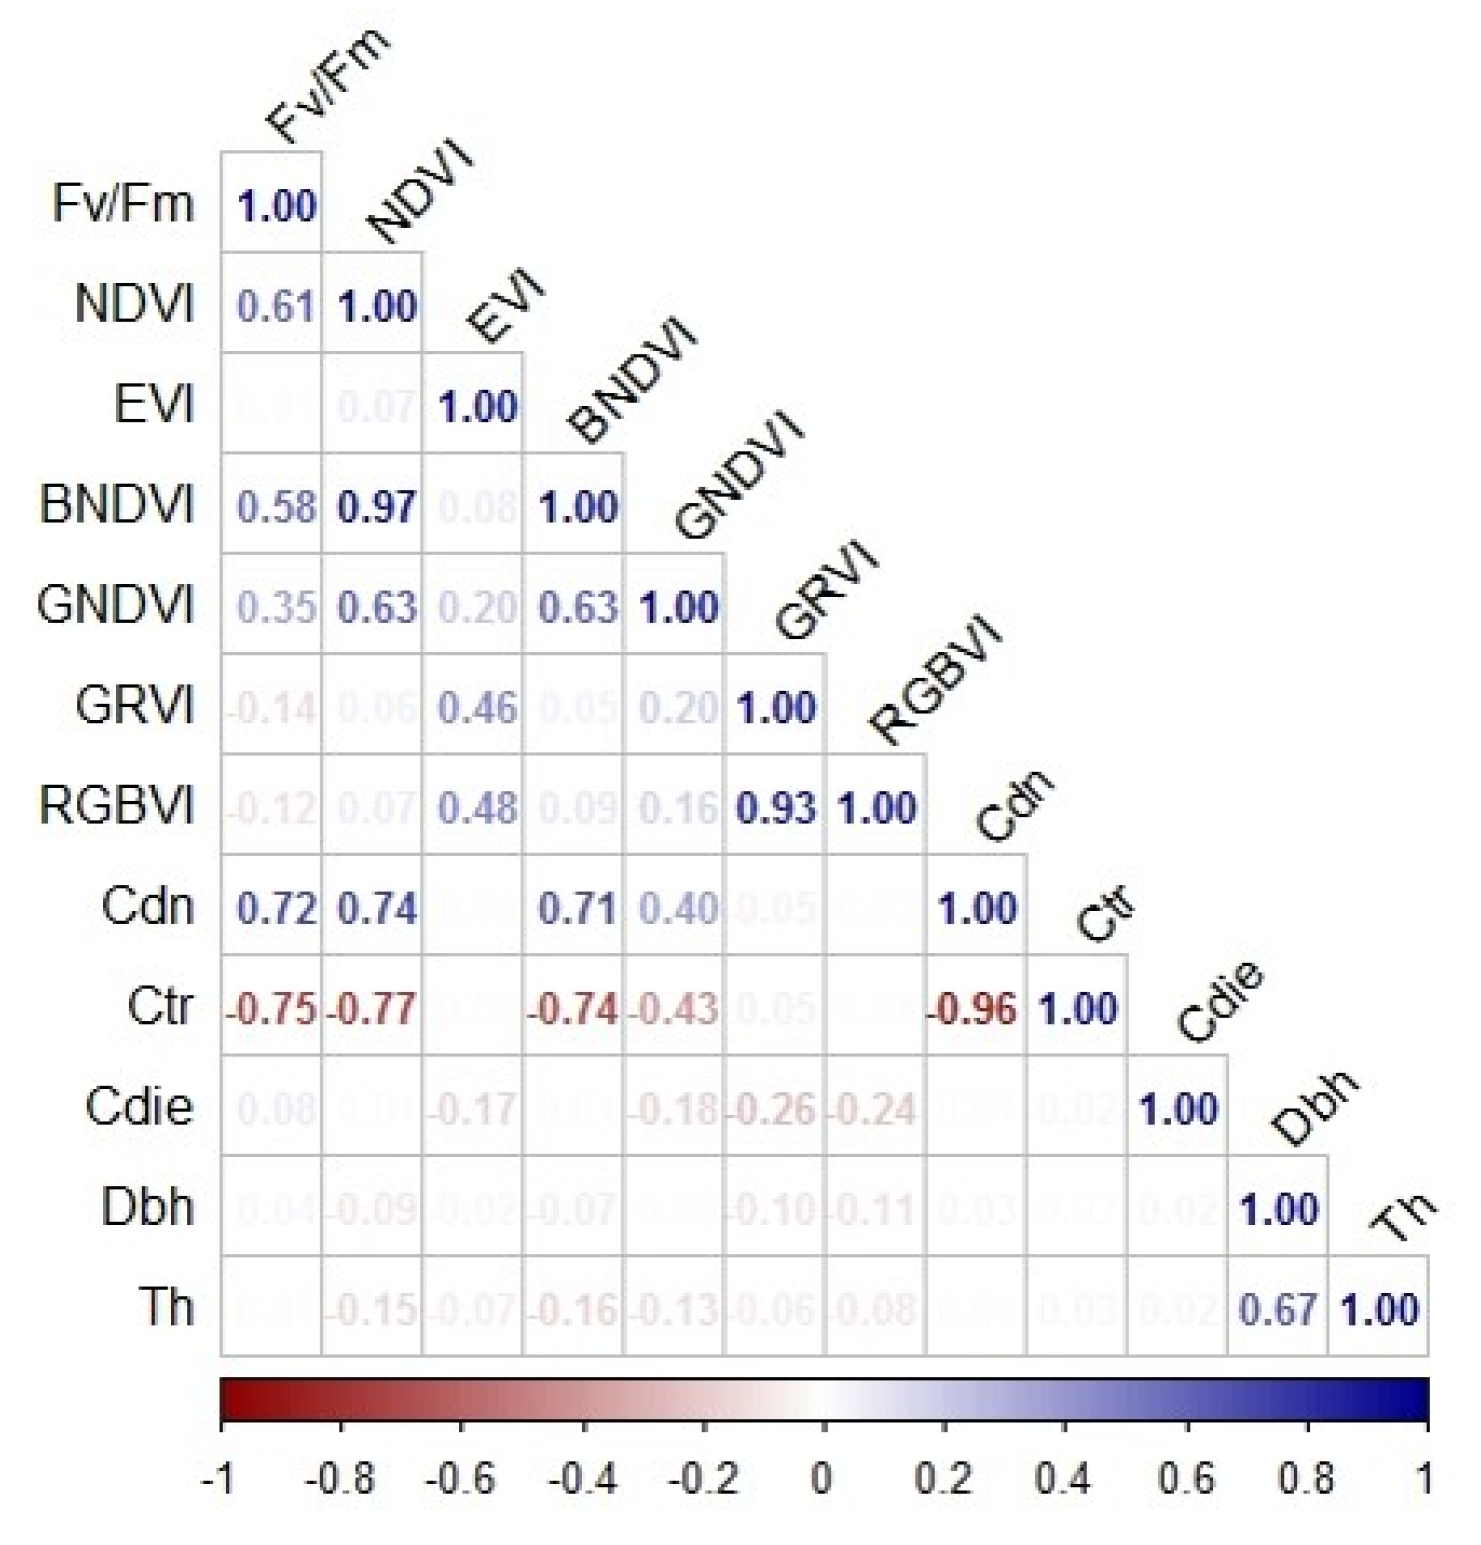
3.1. Correlations between the Variables Studied
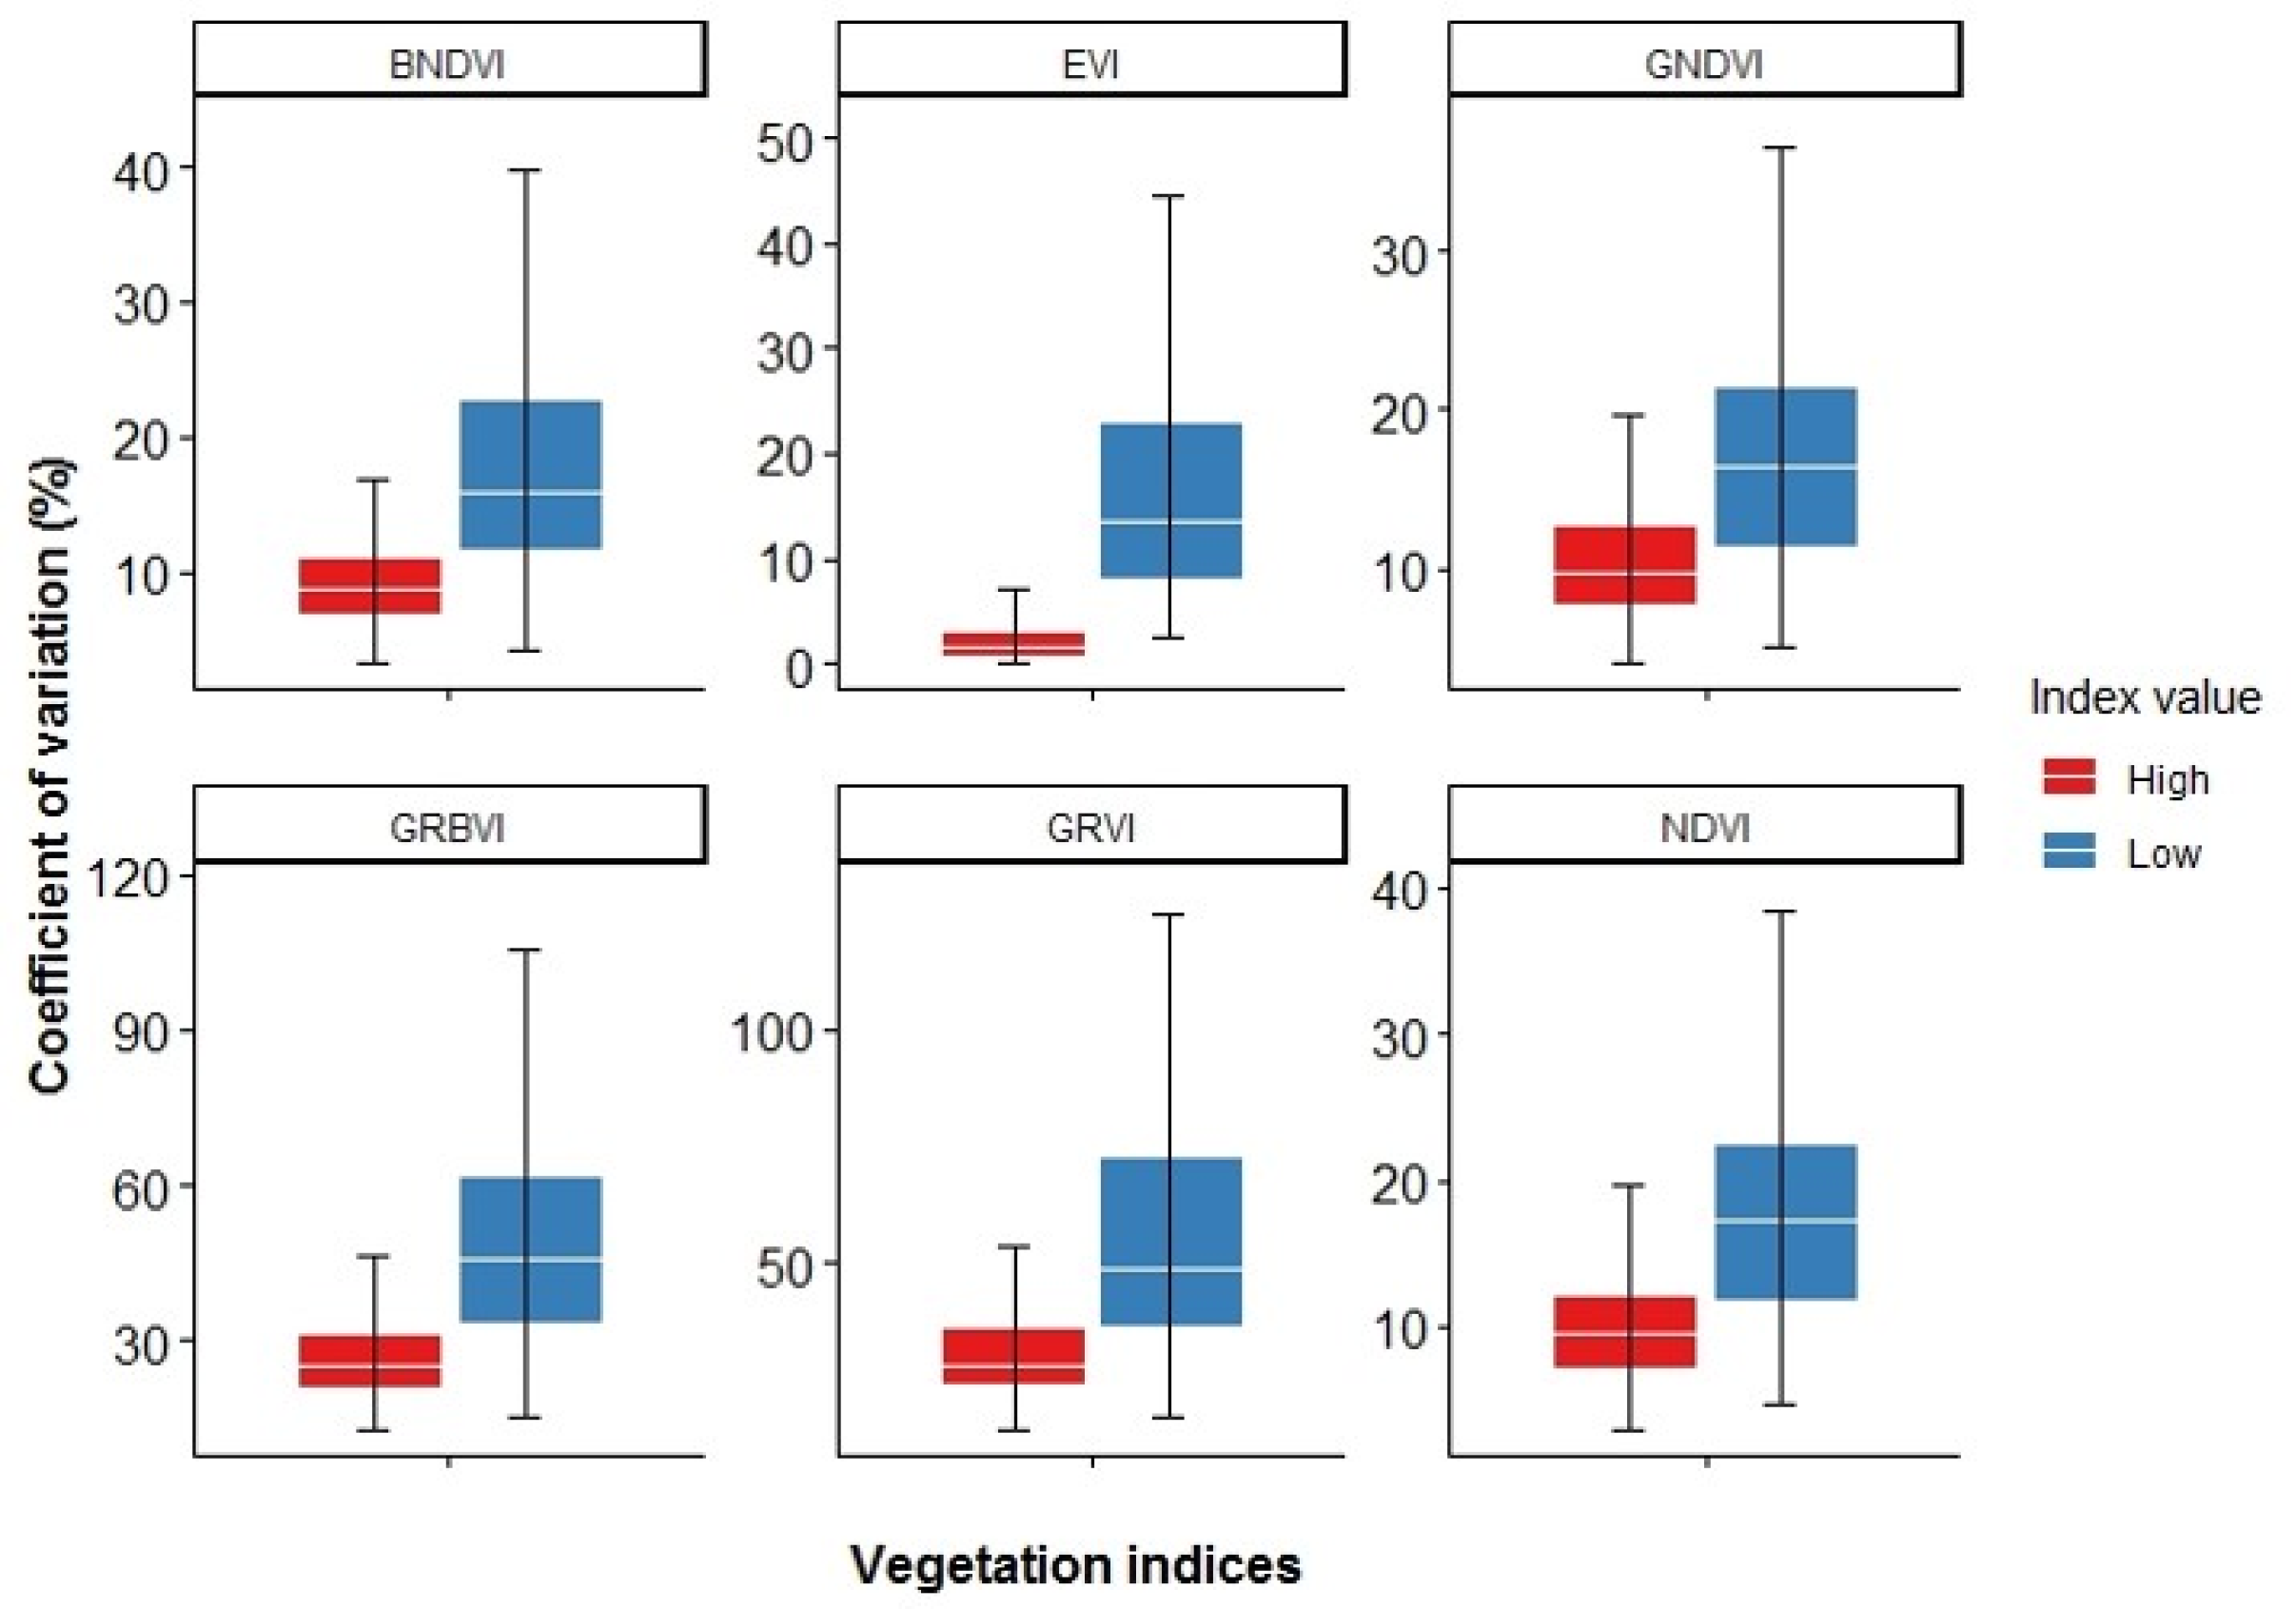
3.2. Coefficient of Variation (CV) of Vegetation Indices
4. Discussion
5. Conclusions
Author Contributions
Funding
Acknowledgments
Conflicts of Interest
References
- Blood, A.; Starr, G.; Escobedo, F.; Chappelka, A.; Staudhammer, C. How do urban forests compare? Tree diversity in urban and periurban forests of the Southeastern US. Forests 2016, 7, 120. [Google Scholar] [CrossRef]
- Kim, H.W.; Kim, J.H.; Li, W.; Yang, P.; Cao, Y. Exploring the impact of green space health on runoff reduction using NDVI. Urban For. Urban Green. 2017, 28, 81–87. [Google Scholar] [CrossRef]
- Morales-Gallegos, L.M.; Martínez-Trinidad, T.; Mohedano-Caballero, L. The urban wasteland as an alternative to create green areas in Texcoco, Mexico. Cuban Journal of Agricultural Science 2021, 9, 423–439. [Google Scholar]
- Zaragoza, H.A.Y.; Cetina, A.V.M.; López, L.M.; Chacalo, H.A.; De la Isla, D.M.L.; González, R.H. Indicador condición de copa y su aplicación en tres parques del Distrito Federal. Rev. Mex. Cienc. For. 2014, 5, 34–51. [Google Scholar]
- Feng, X.; Li, P. A tree species mapping method from UAV images over urban area using similarity in tree-crown object histograms. Remote Sens. 2019, 11, 1982. [Google Scholar] [CrossRef]
- Saavedra-Romero, L.; Alvarado-Rosales, D.; Hernández-De la Rosa, P.; Martínez-Trinidad, T.; Mora-Aguilera, G.; Villa-Castillo, J. Condición de copa, indicador de salud en árboles urbanos del Bosque San Juan de Aragón, Ciudad de México. Madera y Bosques 2016, 22, 15–27. [Google Scholar] [CrossRef]
- Winn, M.F. Urban tree Crown Health assessment system: A tool for communities and citizen foresters, Atlanta, Georgia, USA, 9-12 April 2007; Proceedings, Emerging Issues Along Urban/Rural Interfaces II: Linking Science and Society, Sheraton Atlanta.
- Chun-Ming, H.; Hsin-Chiao, H. Mitigating urban heat islands: A method to identify potential wind corridor for cooling and ventilation. Comput. Environ. Urban Syst. 2016, 57, 130–143. [Google Scholar] [CrossRef]
- Suab, S.A.; Bin, S.M.S.; Avtar, R.; Korom, A. Unmanned aerial vehicle (UAV) derived normalized difference vegetation index (NDVI) and crown projection area (CPA) to detect health conditions of young oil palm trees for precision agriculture. Int. Arch. Photogramm. Remote Sens. Spatial Inf. Sci. 2019, 42, 611–614. [Google Scholar] [CrossRef]
- Westfall, J.A.; Nowak, D.J.; Henning, J.H.; Lister, T.W.; Edgar, C.B.; Majewsky, M.A.; Sonti, N.F. Crown width models for woody plant species growing in urban areas of the U.S. Urban Ecosyst. 2020, 23, 905–917. [Google Scholar] [CrossRef]
- Zarnoch, S.J.; Bechtold, W.A.; Stolte, K.W. Using crown condition variables as indicators of forest health. Can. J. For. Res. 2004, 34, 1057–1070. [Google Scholar] [CrossRef]
- Martínez-Trinidad, T.; Watson, W.T.; Arnold, M.A.; Lombardini, L.; Appel, D.N. Comparing various techniques to measure tree vitality of live oaks. Urban For. Urban Green. 2010, 9, 199–203. [Google Scholar] [CrossRef]
- Flores, A.; Velasco-García, M.V.; Muñoz-Gutiérrez, L.; Martínez-Trinidad, T.; Gómez-Cárdenas, M.; Román-Castillo, C. Especies arbóreas para conservar la biodiversidad en zonas urbanas [Tree species for conservating the biodiversity at urban zones]. Mitigación del Daño Ambiental Agroalimentario y Forestal de México 2018, 4, 136–151. [Google Scholar]
- Cisneros, A.B.; Moglia, J.G.; Álvarez, J.A. Morfometría de copa en Prosopis alba Griseb [Crown morfometry in Prosopis alba Griseb]. Ciencia Florestal. 2019, 29, 1–22. [Google Scholar] [CrossRef]
- Núñez-Florez, R.; Pérez-Gómez, U.; Fernández-Méndez, F. Functional diversity criteria for selecting urban trees. Urban For. Urban Green. 2019, 38, 251–266. [Google Scholar] [CrossRef]
- Musio, M.; Von, W.K.; Agustin, N.H. Crown condition as a function of soil, site and tree characteristics. Eur. J. For. Res. 2007, 126, 91–100. [Google Scholar] [CrossRef]
- Forest Inventory and Analysis National Core Field Guide. Version 9.2. Available online: https://www.fia.fs.usda.gov/library/field-guides-methods-proc/docs/2022/core_ver9-2_9_2022_SW_HW%20table_rev_12_13_2022.pdf (accessed on 23 January 2023).
- Comisión Nacional Forestal. Inventario Nacional Forestal y de Suelos [National Forest and Soil Inventory]. Zapopan, Jalisco, México. Available online: https://biblioteca.semarnat.gob.mx/janium/Documentos/Ciga/libros2018/CD002905.pdf. (accessed on 20 may 2021).
- Macías-Muro, A.; Martínez-Trinidad, T.; Valdez-Lazalde, J.R.; Romero-Sánchez, M.E.; Vaquera-Huerta, H. Assessment fo urban tree health through satellite imagery in Guadalajara, Mexico. Entreciencias: Diálogos en la Sociedad del Conocimiento 2022, 10, 1–12. [Google Scholar] [CrossRef]
- Zulkafli, R.S. Tree crown density analysis from hyperspectral image. IOP Conf. Ser.: Mater. Sci. Eng. 2019, 705, 012035. [Google Scholar] [CrossRef]
- Callow, D.; May, P.; Johnstone, D.M. Tree vitality assessment in urban landscapes. Forests 2018, 9, 279. [Google Scholar] [CrossRef]
- Morales-Gallegos, L.M.; Martínez-Trinidad, T.; Gómez-Guerrero, A.; Razo-Zarate, R.; Suárez-Espinosa, J. Glucose Inyections in Jacaranda mimosifolia D. Don in urban áreas of Texcoco de Mora. Rev. Mex. Cienc. For. 2019, 10, 79–98. [Google Scholar] [CrossRef]
- Mohd, N.N.; Abdullah, A.; Hashim, M. Remote sensing UAV/drones and its applications for urban areas: a review. Conf. Ser. Earth Environ. Sci. 2018, 169, 012003. [Google Scholar] [CrossRef]
- Ashapure, A.; Jung, J.; Chang, A.; Oh, S.; Maeda, M.; Landivar, J. A comparative study of RGB and multispectral sensor-based cotton canopy modelling using multi-temporal UAS data. Remote Sens. 2019, 11, 11–2757. [Google Scholar] [CrossRef]
- Weinstein, B.G.; Marconi, S.; Bohlman, S.A.; Zare, A.; White, E.P. Cross-site learning in deep learning RGB tree crown detection. Ecol. Inform. 2020, 56, 101061. [Google Scholar] [CrossRef]
- Lee, G.; Hwang, J.; Cho, S. A novel index to detect vegetation in urban areas using UAV-based multispectral images. Appl. Sci. 2021, 11, 3472. [Google Scholar] [CrossRef]
- Harris, R.C.; Kennedy, L.M.; Pingel, T.J.; Thomas, V.A. Assessment of canopy health with drone-based orthoimagery in a Southern Appalachian red spruce forest. Remote Sens. 2022, 14, 1341. [Google Scholar] [CrossRef]
- Taddeo, S.; Dronova, I.; Depsky, N. Spectral vegetation indices of wetland greenness: Responses to vegetation structure, composition, and spatial distribution. Remote Sens. Environ. 2019, 234, 111467. [Google Scholar] [CrossRef]
- Khadanga, G.; Jain, K. Tree census using circular Hough Transform and GRVI. Procedia Computer Science 2020, 171, 389–394. [Google Scholar] [CrossRef]
- Zhe, M.; Zhang, X. Time-lag effects of NDVI responses to climate change in the Yamzhog Yumco Basin, South Tibet. Ecol. Indic. 2021, 124, 1–7. [Google Scholar] [CrossRef]
- Zi-chen, G.; Tao, W.; Shu-Lin, L.; Wen-Ping, K.; Xiang, C.; Kun, F.; Xue-Qin, Z.; Ying, Z. Biomass and vegetation coverage survey in the Mu Us sandy land - based on unmanned aerial vehicle RGB images. Int. J. Appl. Earth Obs. Geoinf. 2021, 94, 102239. [Google Scholar] [CrossRef]
- Kleefeld, A.; Gypser, S.; Herppich, W.B.; Bader, G.; Veste, M. Identification of spatial pattern of photosynthesis hotspots in moss-and lichen-dominated biological soil crusts by combining chlorophyll fluorescence imaging and multispectral BNDVI images. Pedobiologia-Journal of Soil Ecology. 2018, 68, 1–11. [Google Scholar] [CrossRef]
- Fang, F.; McNeil, B.; Warner, T.; Dahle, G.; Eutsler, E. Street tree health from space? An evaluation using WorldView-3 data and the Washington D.C. Street Spatial Database. Urban For. Urban Green. 2020, 49, 126634. [Google Scholar] [CrossRef]
- Haghighian, F.; Yousefi, S.; Keesstra, S. Identifying tree health using Sentinel-2 images: a case study on Tortrix viridana L. infected Oak trees in Western Iran. Geocarto Int. 2020, 37, 304–314. [Google Scholar] [CrossRef]
- Maldonado-Enríquez, D.; Ortega-Rubio, A.; Breceda-Solís, A.M.; Díaz-Castro, S.C.; Sosa-Ramírez, J.; Martínez-Rincón, R.O. Trend and variability of NDVI of the main vegetation types in the Cape Region of Baja California Sur. Rev. Mex. Biodiv. 2020, 91, e913213. [Google Scholar] [CrossRef]
- Dixon, D.J.; Callow, J.N.; Duncan, J.M.A.; Setterfield, S.A.; Pauli, N. Satellite prediction of forest flowering phenology. Remote Sens. Environ. 2021, 255, 112197. [Google Scholar] [CrossRef]
- Moreno, S.E. Características territoriales, ambientales y sociopolíticas del municipio de Texcoco, Estado de México [Territorial, environmental and sociopolitical characteristics of the municipality of Texcoco, State of Mexico]. Quivera. 2007, 9, 177–206. [Google Scholar]
- Benavides, M.H.M.; Fernández, G.D.Y. Estructura del arbolado y caracterización dasométrica de la segunda sección del Bosque de Chapultepec [Tree structure and dasometric characterization of the second section of the Chapultepec Forest]. Madera y Bosques 2012, 18, 51–71. [Google Scholar]
- Velasco, E.; Cortés, A.; González, E.N.; Moreno, F.; Benavidez, M.H.M. Diagnóstico y caracterización del arbolado del bosque de San Juan de Aragón [Diagnosis and characterization of the trees of the forest of San Juan de Aragón]. Rev. Mex. Cienc. For. 2013, 4, 1–10. [Google Scholar]
- Sosa-Martínez, A.; Narchi, N.E.; Leal-Bautista, R.M.; Frausto-Martínez, O.; Casas-Beltrán, D.A. Percepción y uso del agua de lluvia por usuarios en una comunidad del Caribe mexicano [Perception and use of rainwater by users in a community of the Mexican Caribbean]. Sociedad y Ambiente 2020, 23, 1–27. [Google Scholar] [CrossRef]
- Saavedra-Romero, L.; Hernández-de la Rosa, P.; Alvarado-Rosales, D.; Martínez-Trinidad, T.; Villa-Castillo, J. Diversity, tree structure and importance value index in an urban park in Mexico City. Polibotánica 2019, 47, 25–37. [Google Scholar] [CrossRef]
- Alanís-Rodríguez, E.; Mora, A.; Marroquín, J.S. Muestreo ecológico de la vegetación [Ecological samplig of vegetation], 1era ed.; Universidad Autónoma de Nuevo León: Monterrey, Nuevo León, México, 2020; pp. 59–91. [Google Scholar]
- Morgenroth, J.; Nowak, D.J.; Koeser, A.K. DBH Distributions in America’s Urban Forest-An Overview of Structural Diversity. Forests 2020, 11, 135. [Google Scholar] [CrossRef]
- Schomaker, M.E.; Zarnoch, S.J.; Bechtold, A.W.; Latelle, J.D.; Burkman, G.W.; Cox, S.M. Crown-condition classification: A guide to data collection and analysis. USDA Forest Service. In General Technical Report SRS-102; 2007; p. 78. [Google Scholar]
- Forest Inventory and Analysis National Core Field Guide (Phase 2 and 3), version 4.0. Available online: https://www.fia.fs.usda.gov/library/field-guides-methods-proc/index.php (accessed on 21 October 2022).
- Garza, B.N.; Ancona, V.; Enciso, J.; Perotto-Baldivieso, H.L.; Kunta, M.; Simpson, C. Quantifying Citrus Tree Health Using True Color UAV Images. Remote Sens. 2020, 12, 170. [Google Scholar] [CrossRef]
- Yang, Y.; Wu, T.; Wang, S.; Li, J.; Muhanmmad, F. The NDVI-CV method for mapping evergreen trees in complex urban areas using reconstructed Landsat 8 time-series data. Forests 2019, 10, 139. [Google Scholar] [CrossRef]
- Solís-Pino, A.F.; Revelo-Luna, D.A.; Campo-Ceballos, D.A.; Gaviria-López, C.A. Correlación del contenido de clorofila foliar de la especie Coffea arabica con índices espectrales en imágenes. Biotecnología en el Sector Agropecuario y Agroindustrial 2021, 19, 57–68. [Google Scholar] [CrossRef]
- Zhang, C.J.; Lim, S.H.; Kim, J.W.; Nah, G.; Fischer, A.; Kim, D.S. Leaf chlorophyll fluorescence discriminates herbicide resistance in Echinochloa species. Weed Res. 2016, 56, 424–433. [Google Scholar] [CrossRef]
- Martínez-Trinidad, T.; Plascencia-Escalante, F.O.; Islas-Rodríguez, L. Relationship between carbohydrates and vitality in urban trees. Rev. Chapingo Ser. Cienc. For. Ambiente. 2013, 19, 459–468. [Google Scholar] [CrossRef]
- The R project for statistical computing. Available online: https://www.R-project.org/. (accessed on 18 March 2022).
- Canizales, P.A.; Alanís, E.; Holguín, V.A.; García, S.; Chávez, A.C. Description of urban trees of Montemorelos city, Nuevo León. Rev. Mex. For. Cienc. 2020, 11, 111–135. [Google Scholar] [CrossRef]
- Razali, S.M.; Nuruddin, A.A.; Lion, M. Mangrove vegetation health assessment based on remote sensing indices for Tanjung Piai Malay Peninsular. J. Landsc. Ecol. 2019, 12, 26–40. [Google Scholar] [CrossRef]
- Gypser, S.; Herppich, W.B.; Fischer, T.; Lange, P.; Veste, M. Photosynthetic characteristics and their spatial variance of biological soil crust covering initial soils of post-mining sites in Lower Lusatia, NE Germany. Flora-Morphology, Distribution, Functional Ecology of Plants 2016, 220, 103–116. [Google Scholar] [CrossRef]
- Motohka, T.; Nasahara, K.N.; Oguma, H.; Tsuchida, S. Applicability of Green-Red vegetation index for remote sensing of vegetation phenology. Remote Sens. 2010, 2, 2369–2387. [Google Scholar] [CrossRef]
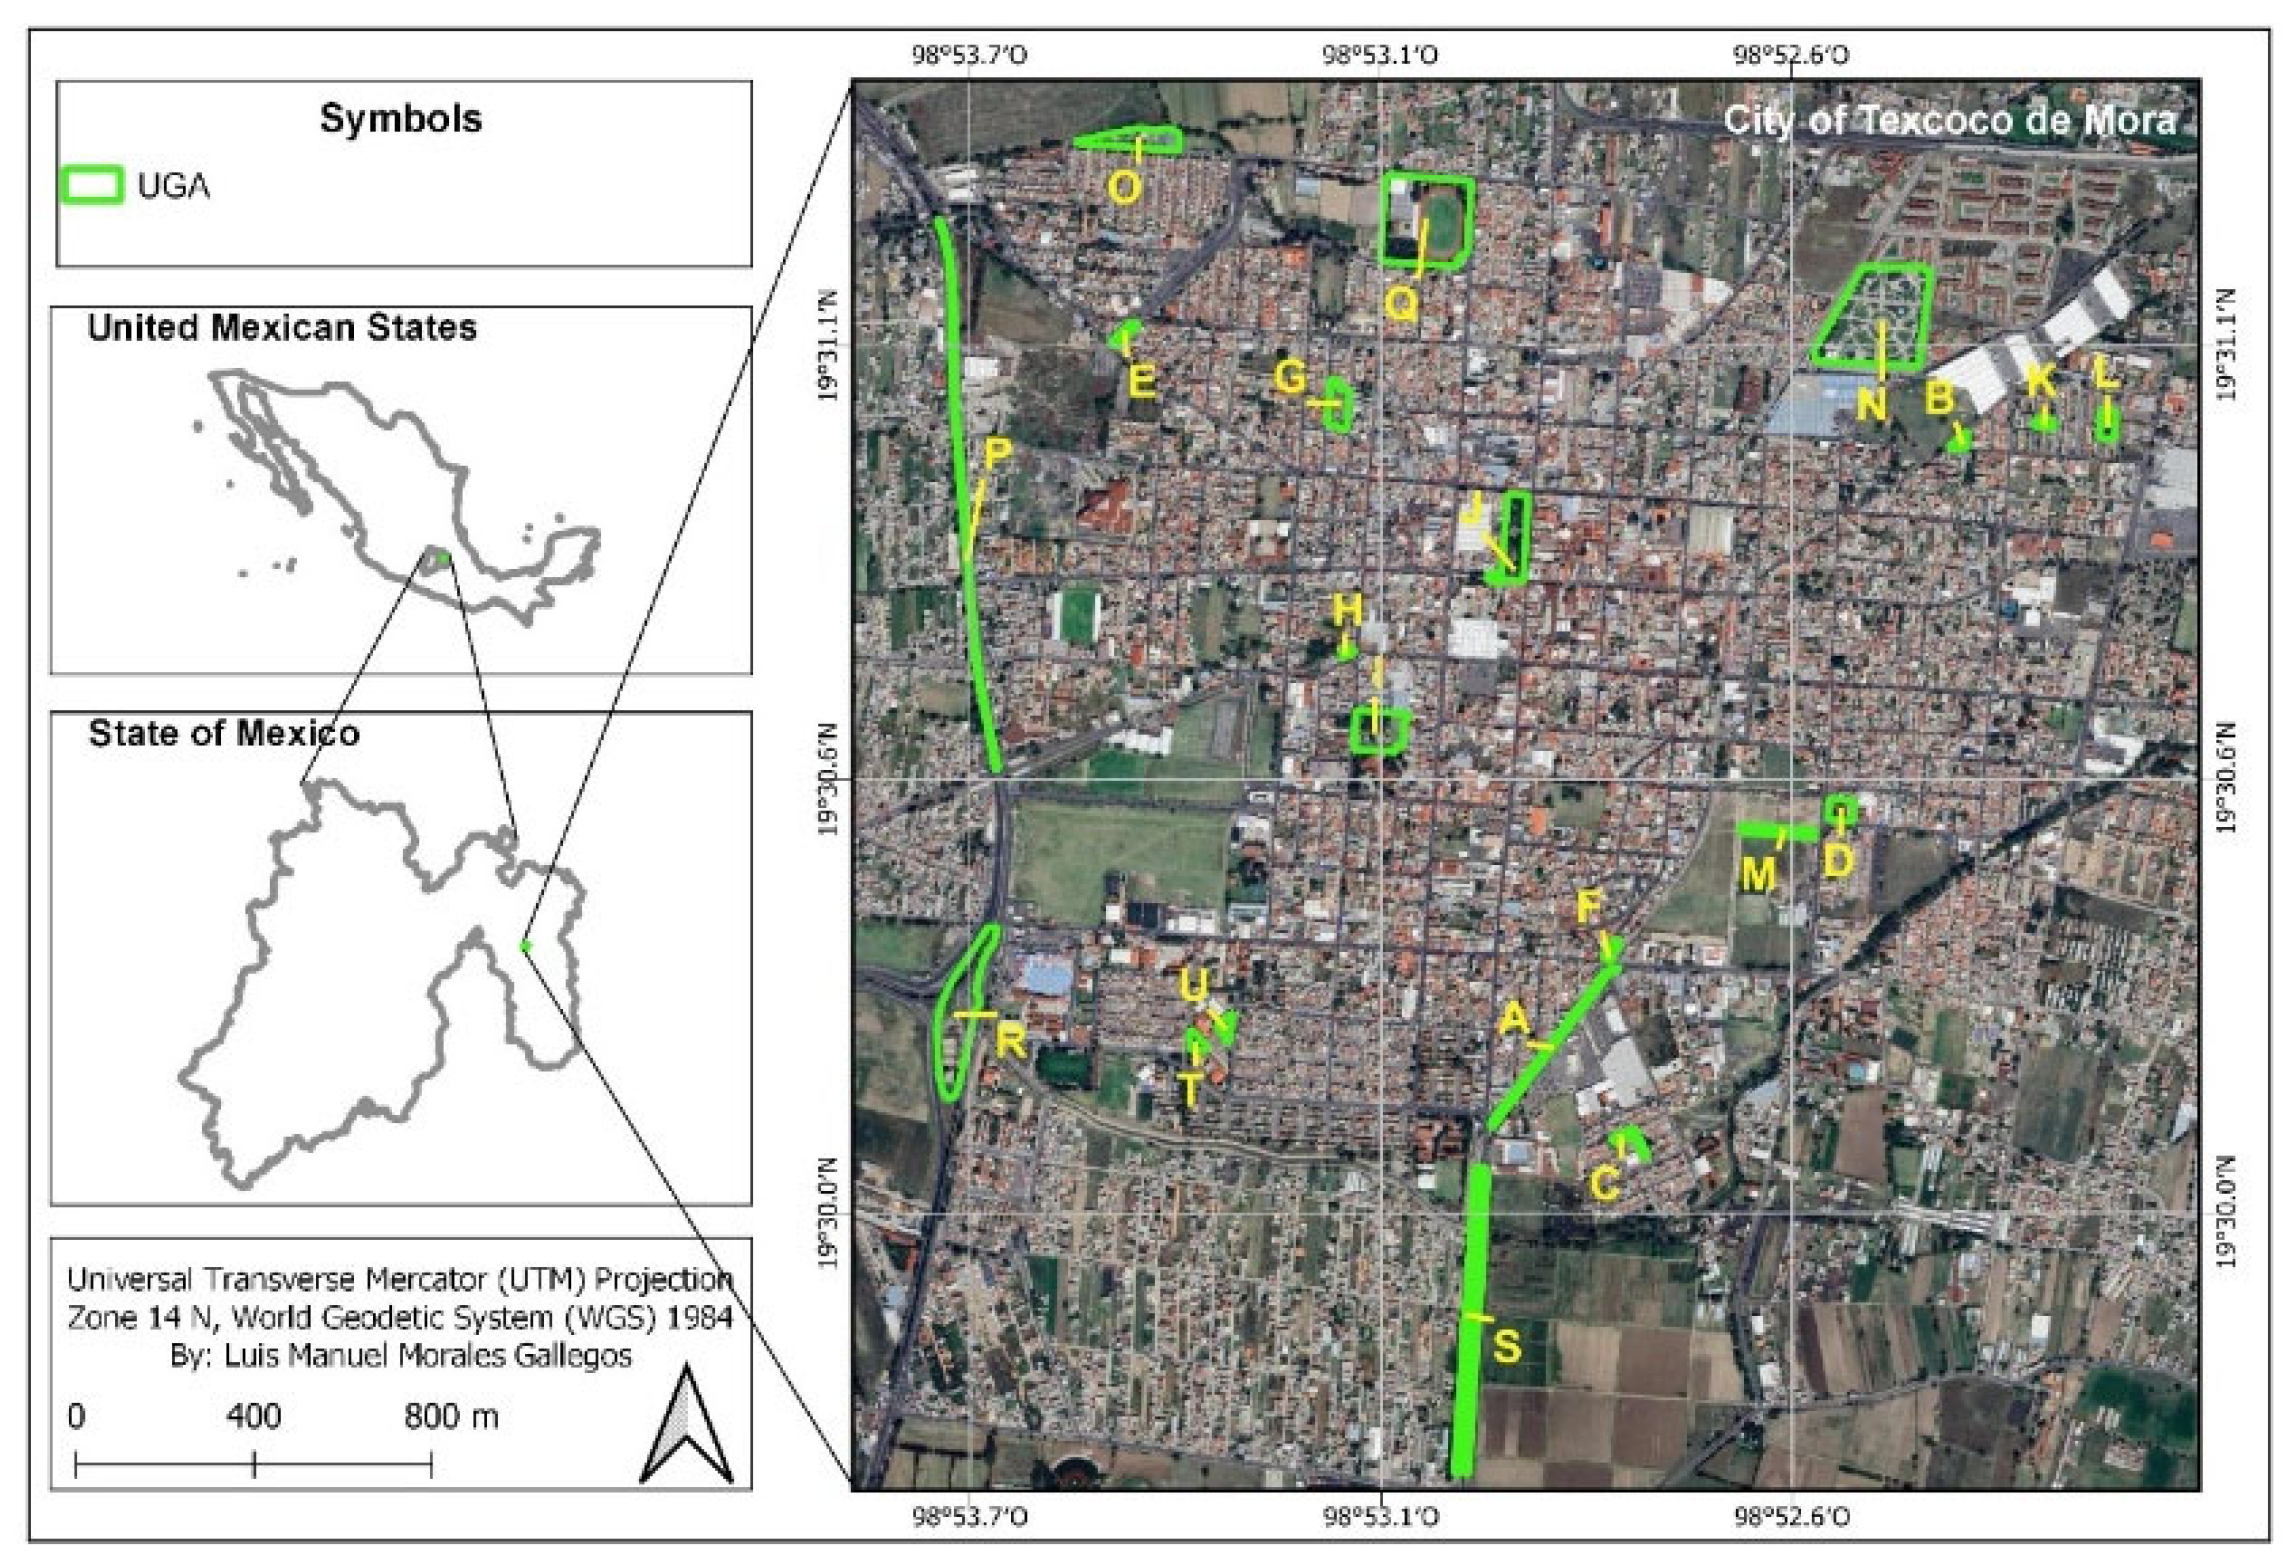
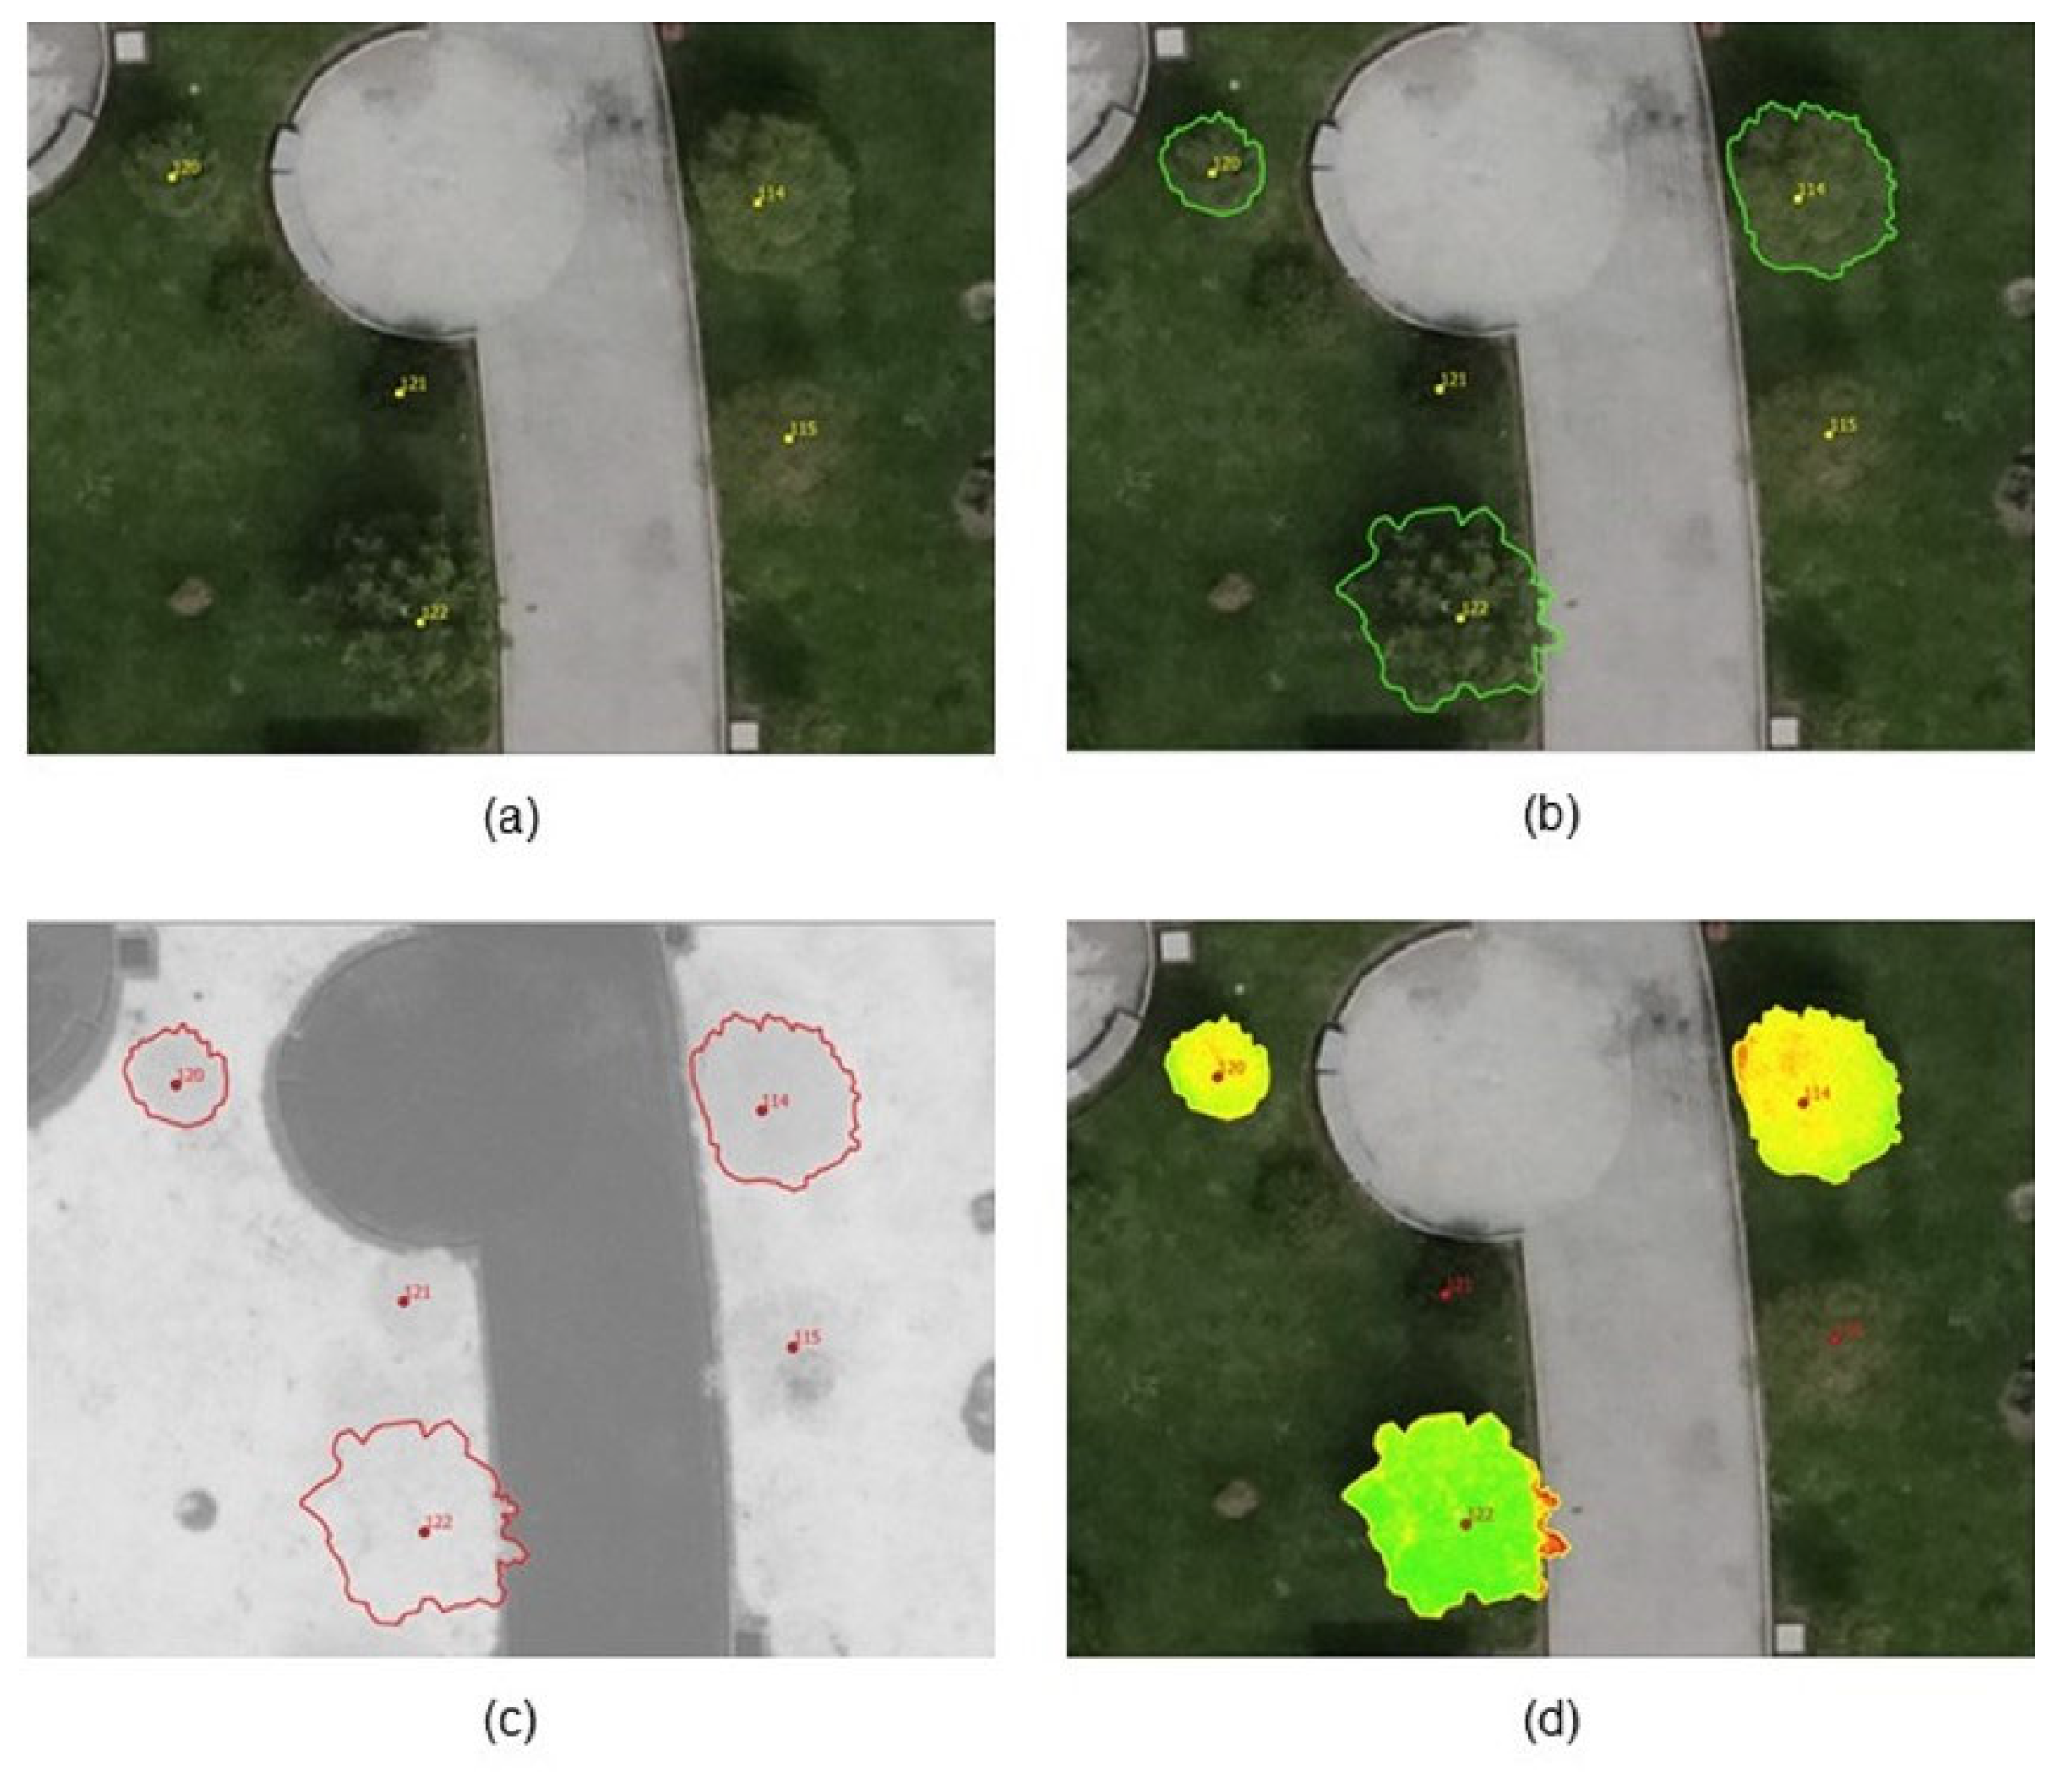

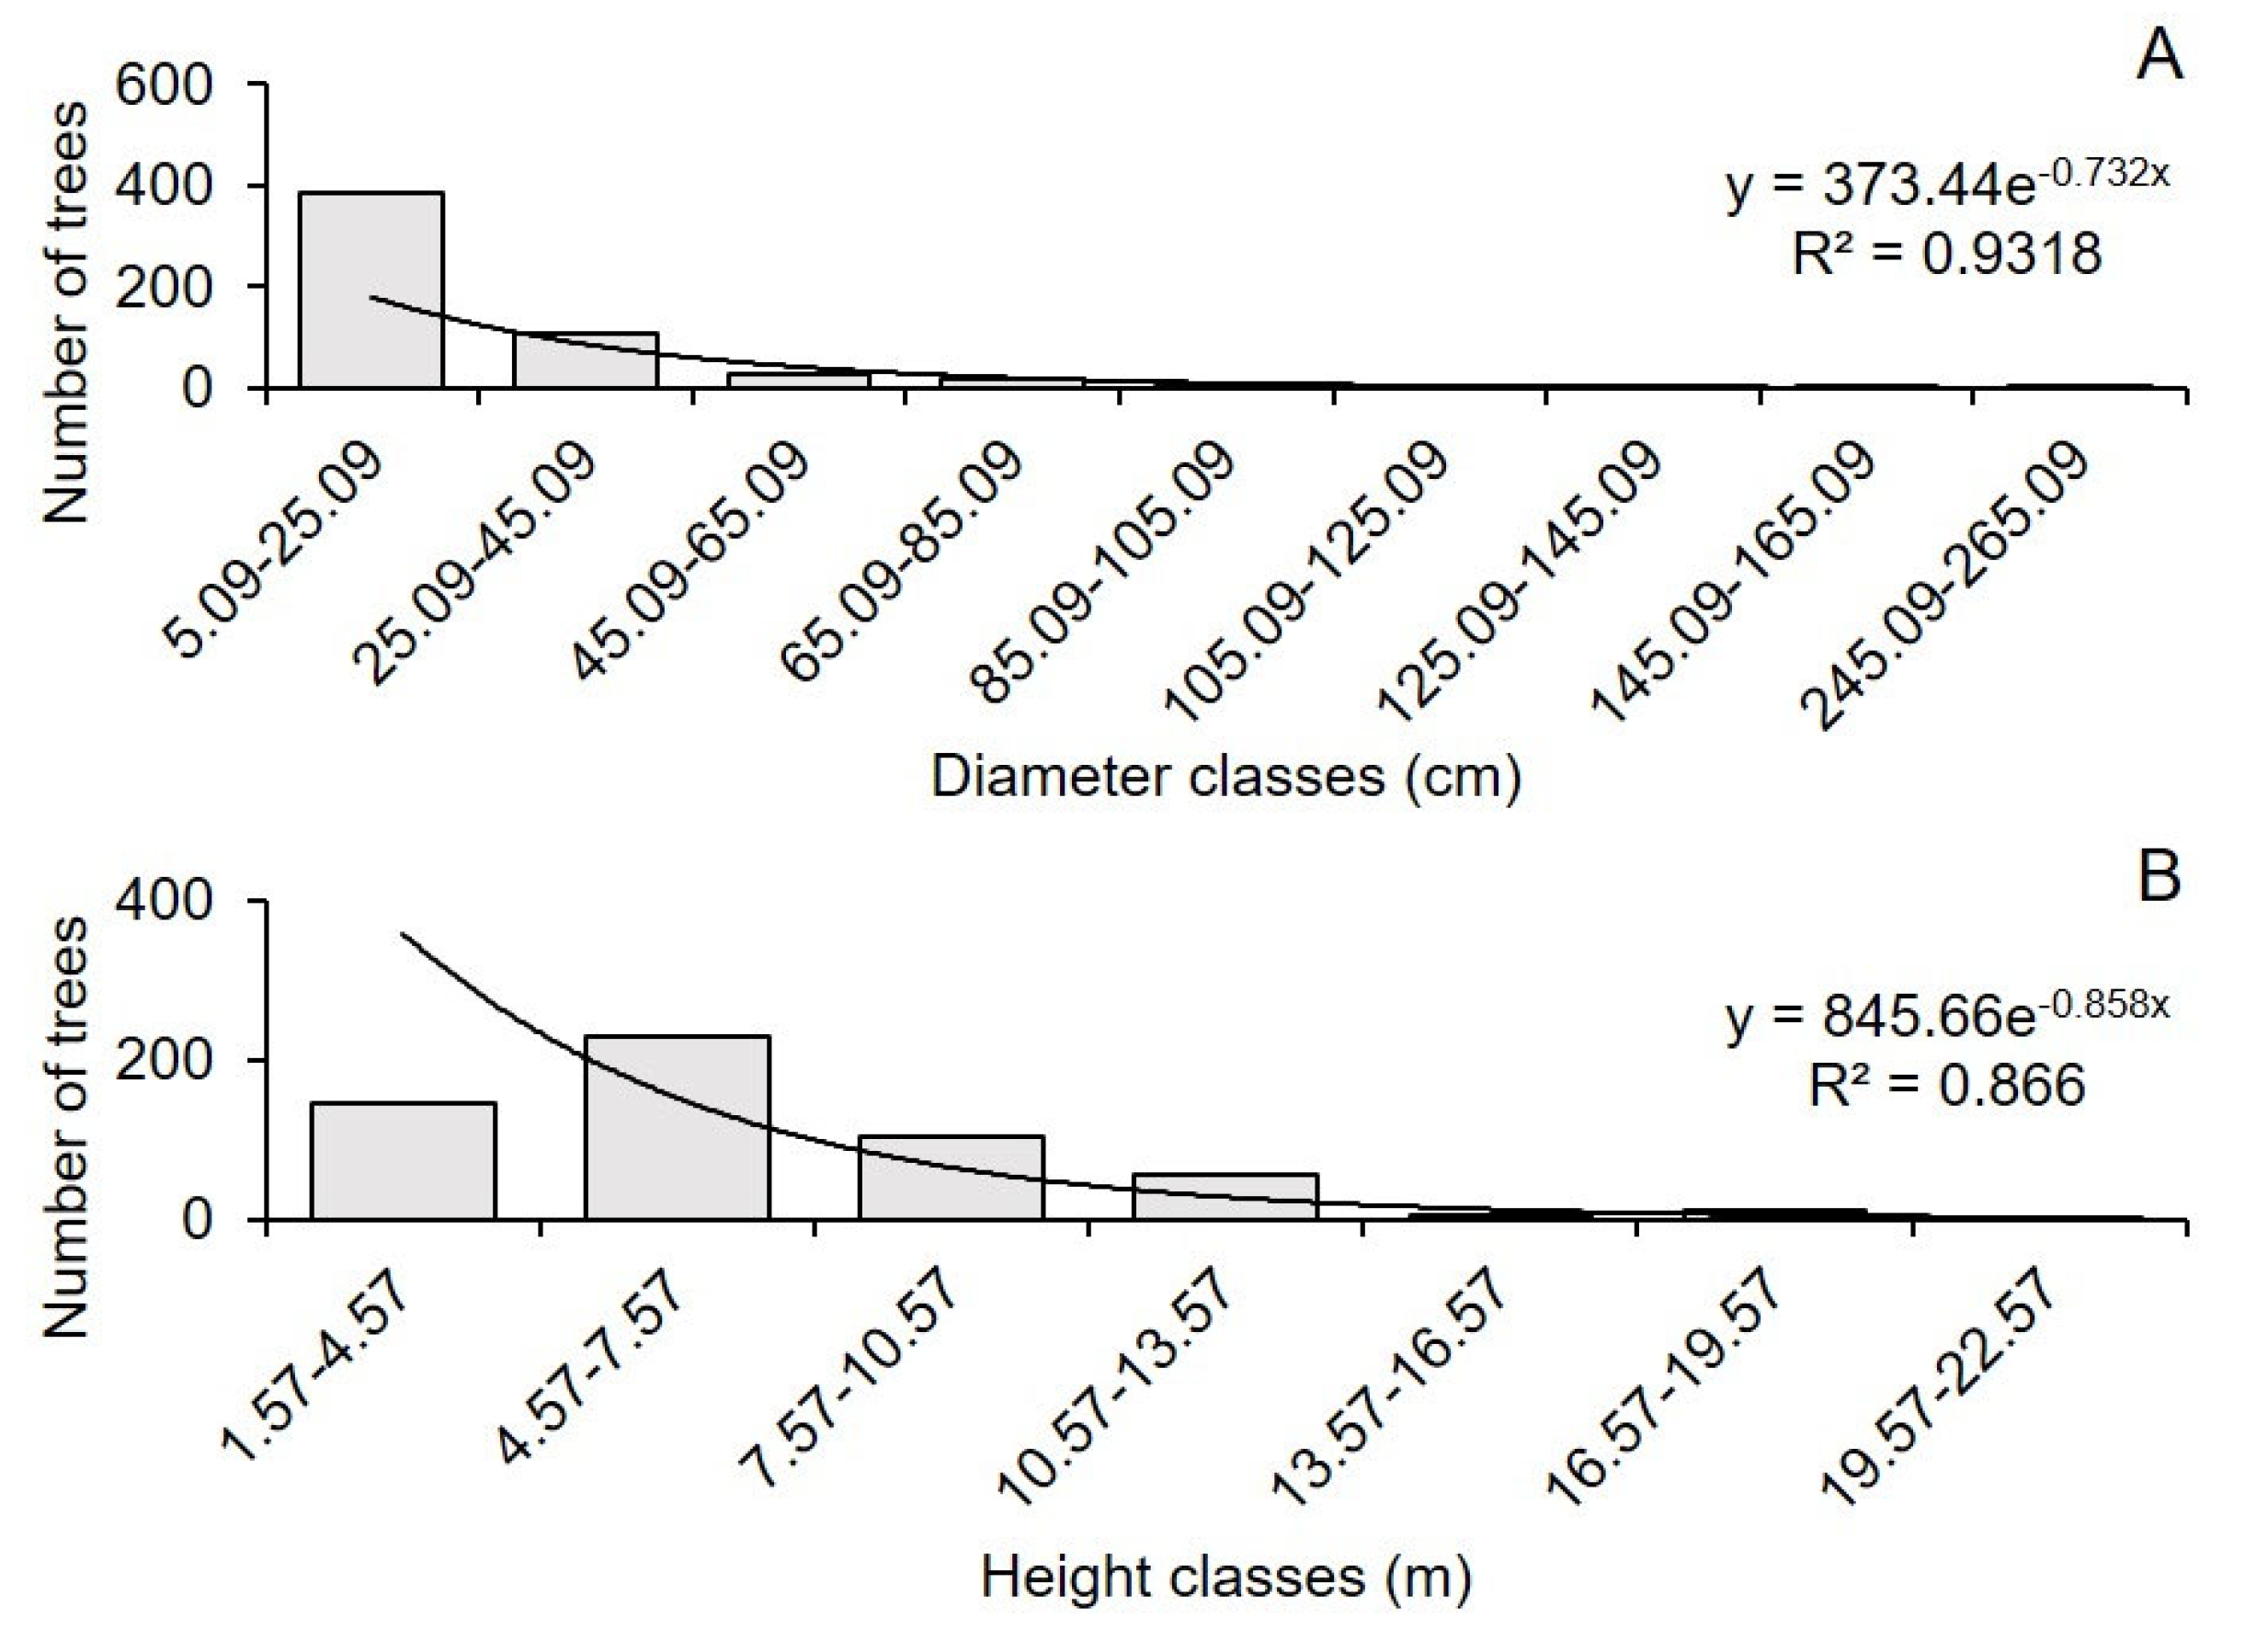
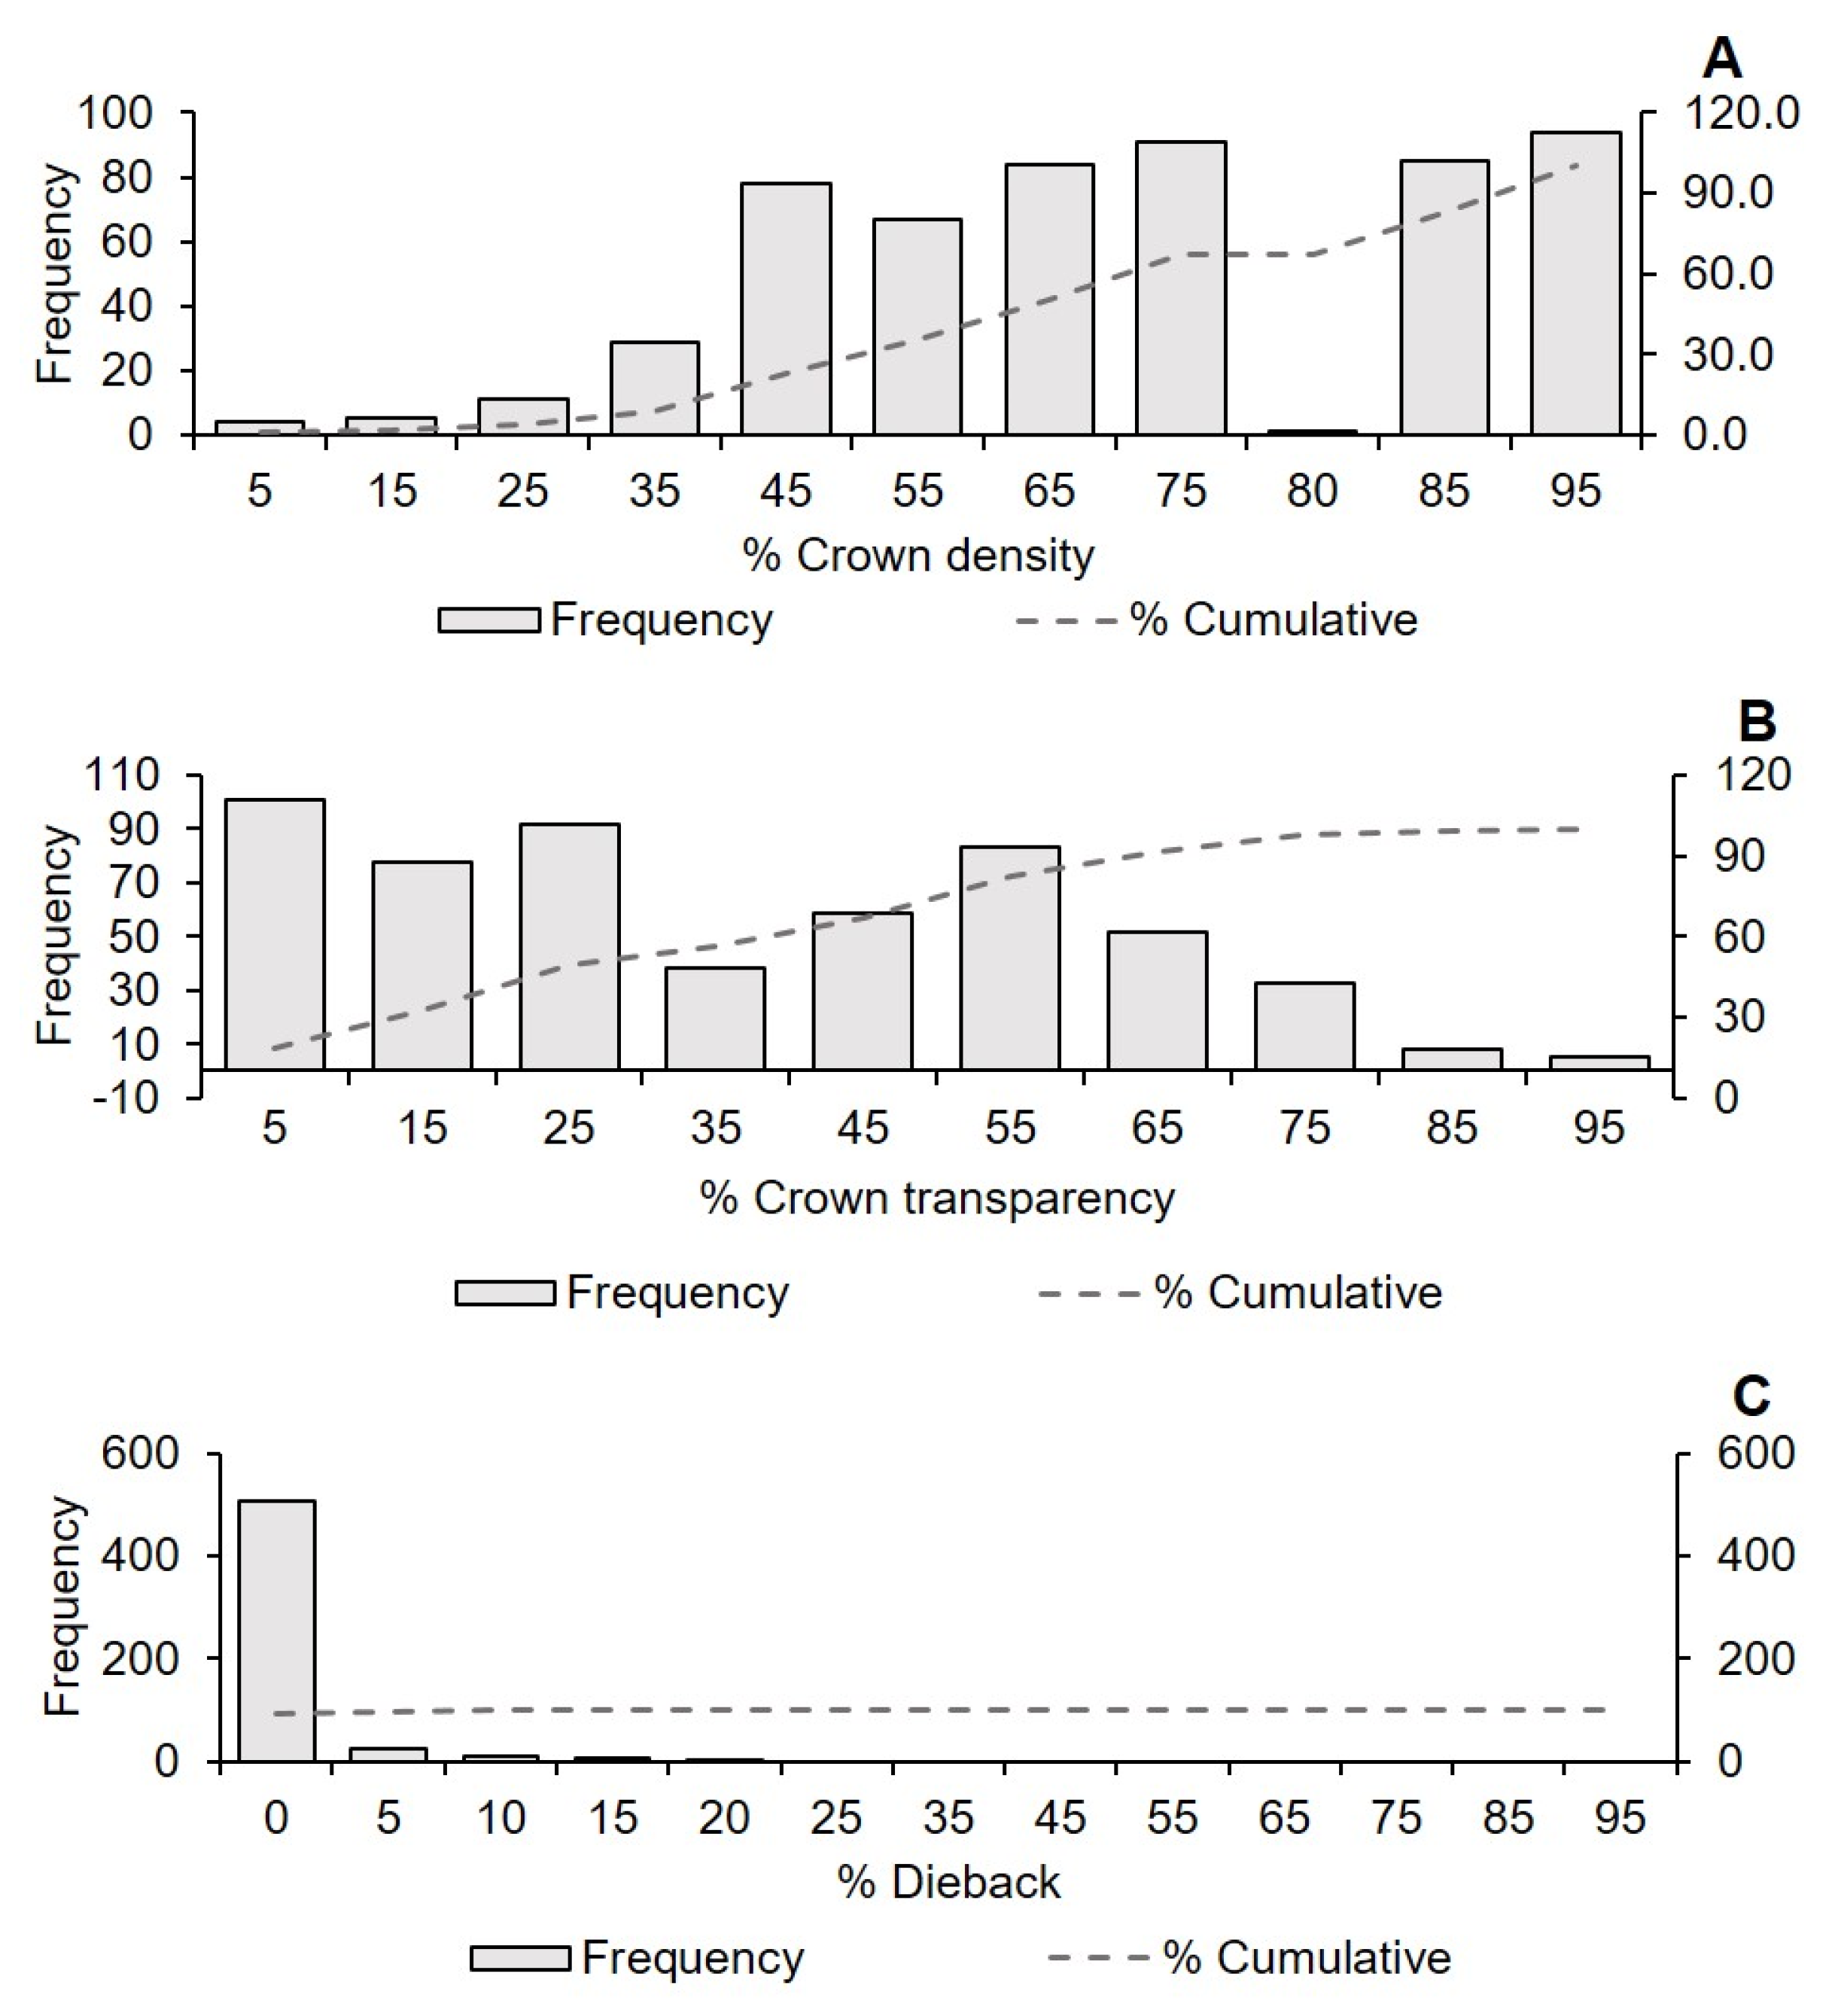
| ID | Name | Perimeter (m) | Area (m2) |
|---|---|---|---|
| A | Boulevard Jiménez Cantú | 940.53 | 4,687.21 |
| B | Valle de Santa Cruz 2 | 141.72 | 848.98 |
| C | Jardín San Martín | 259.84 | 1,379.92 |
| D | Parque Niños Héroes | 205.03 | 2,632.24 |
| E | Parque las Américas | 174.75 | 1,123.34 |
| F | Parque del Ahuehuete | 132.96 | 876.11 |
| G | Parque Heberto Castillo | 304.93 | 4,167.78 |
| H | Parque Arteaga | 92.05 | 435.07 |
| I | Parque de la Tercera Edad | 406.05 | 9,478.5 |
| J | Jardín Municipal | 549.66 | 9,765.82 |
| K | Valle de Santa Cruz 3 | 118.35 | 717.83 |
| L | Valle de Santa Cruz 1 | 192.78 | 2,128.93 |
| M | Parque Municipal | 366.93 | 2,694.09 |
| N | Alameda Texcoco | 849.57 | 43,898.99 |
| O | Parque Xolache | 517.07 | 7,436.39 |
| P | Camellón Lechería | 2,505.49 | 7,554.33 |
| Q | Deportivo Silverio Pérez | 765.46 | 37,159.45 |
| R | Parque Bicentenario | 859.26 | 21,397.46 |
| S | Boulevard Chapingo | 2,801.45 | 16,347.42 |
| T | Las vegas 1 | 151.56 | 1,105.62 |
| U | Las vegas 2 | 167.91 | 1,173.21 |
| Formulas | Where |
|---|---|
| NDVI |
NDVI = Normalized difference vegetation index Nir = Near infrared Red = Red band |
| EVI2 = |
EVI2 = Enhanced Vegetation Index Nir = Near infrared Green = Green band |
| GNDVI= |
GNDVI = Green normalized difference vegetation index Nir = Near infrared Green = Green band |
| BNDVI= |
BNDVI = Blue normalized difference vegetation index Nir = Near infrared Blue = Blue band |
| GRVI = |
GRVI = Green-red vegetation index Red = Red band Green = Green band |
| RGBVI= |
RGBVI = Red-green-blue vegetation index Red = Red band Green = Green band Blue = Blue band |
| Species | # of trees | Diameter (cm) | Height (m) |
|---|---|---|---|
| Cupressus lusitanica Mill. | 53 | 24.76bc | 6.84bc |
| Fraxinus uhdei (Wenz.) Lingelsh. | 48 | 25.57bcd | 7.38ab |
| Jacaranda mimosifolia D. Don | 44 | 22.38de | 7.46b |
| Cupressus sempervirens L. | 41 | 13.54e | 6.92b |
| Ligustrum lucidum W.T. Aiton | 40 | 16.39cde | 4.94d |
| Ficus microcarpa L.f. | 38 | 20.60bcd | 6.27bc |
| Cupressus macrocarpa Hartw. | 38 | 15.40de | 5.20cd |
| Schinus molle L. | 31 | 52.65a | 8.40a |
| Casuarina equisetifolia L. | 28 | 28.26b | 9.38a |
| Ficus benjamina L. | 27 | 21.53bc | 4.53d |
Disclaimer/Publisher’s Note: The statements, opinions and data contained in all publications are solely those of the individual author(s) and contributor(s) and not of MDPI and/or the editor(s). MDPI and/or the editor(s) disclaim responsibility for any injury to people or property resulting from any ideas, methods, instructions or products referred to in the content. |
© 2024 by the authors. Licensee MDPI, Basel, Switzerland. This article is an open access article distributed under the terms and conditions of the Creative Commons Attribution (CC BY) license (https://creativecommons.org/licenses/by/4.0/).


