Submitted:
16 September 2023
Posted:
18 September 2023
You are already at the latest version
Abstract
Keywords:
1. Introduction
2. Materials and Methods
2.1. Preparation of Tail/Ear Fibroblasts (TEFs)
2.2. Suspension Culture Methods Causing Cell-Cell Contact
2.3. Time-Lapse Image Acquisition of Sphere Growth
2.4. Flow Cytometry
2.5. Immunofluorescence (IF) Staining
2.6. Self-Renewal Assay
2.7. In Vitro Differentiation Assays Mouse adipogenic or osteogenic differentiation
2.8. Single-cell RNA library preparation and sequencing
2.9. Bioinformatics analysis
2.10. Human Hepatocyte Differentiation
2.11. Tumorigenic Assessment of TEF-derived Spheroids
2.12. Statistics
3. Results
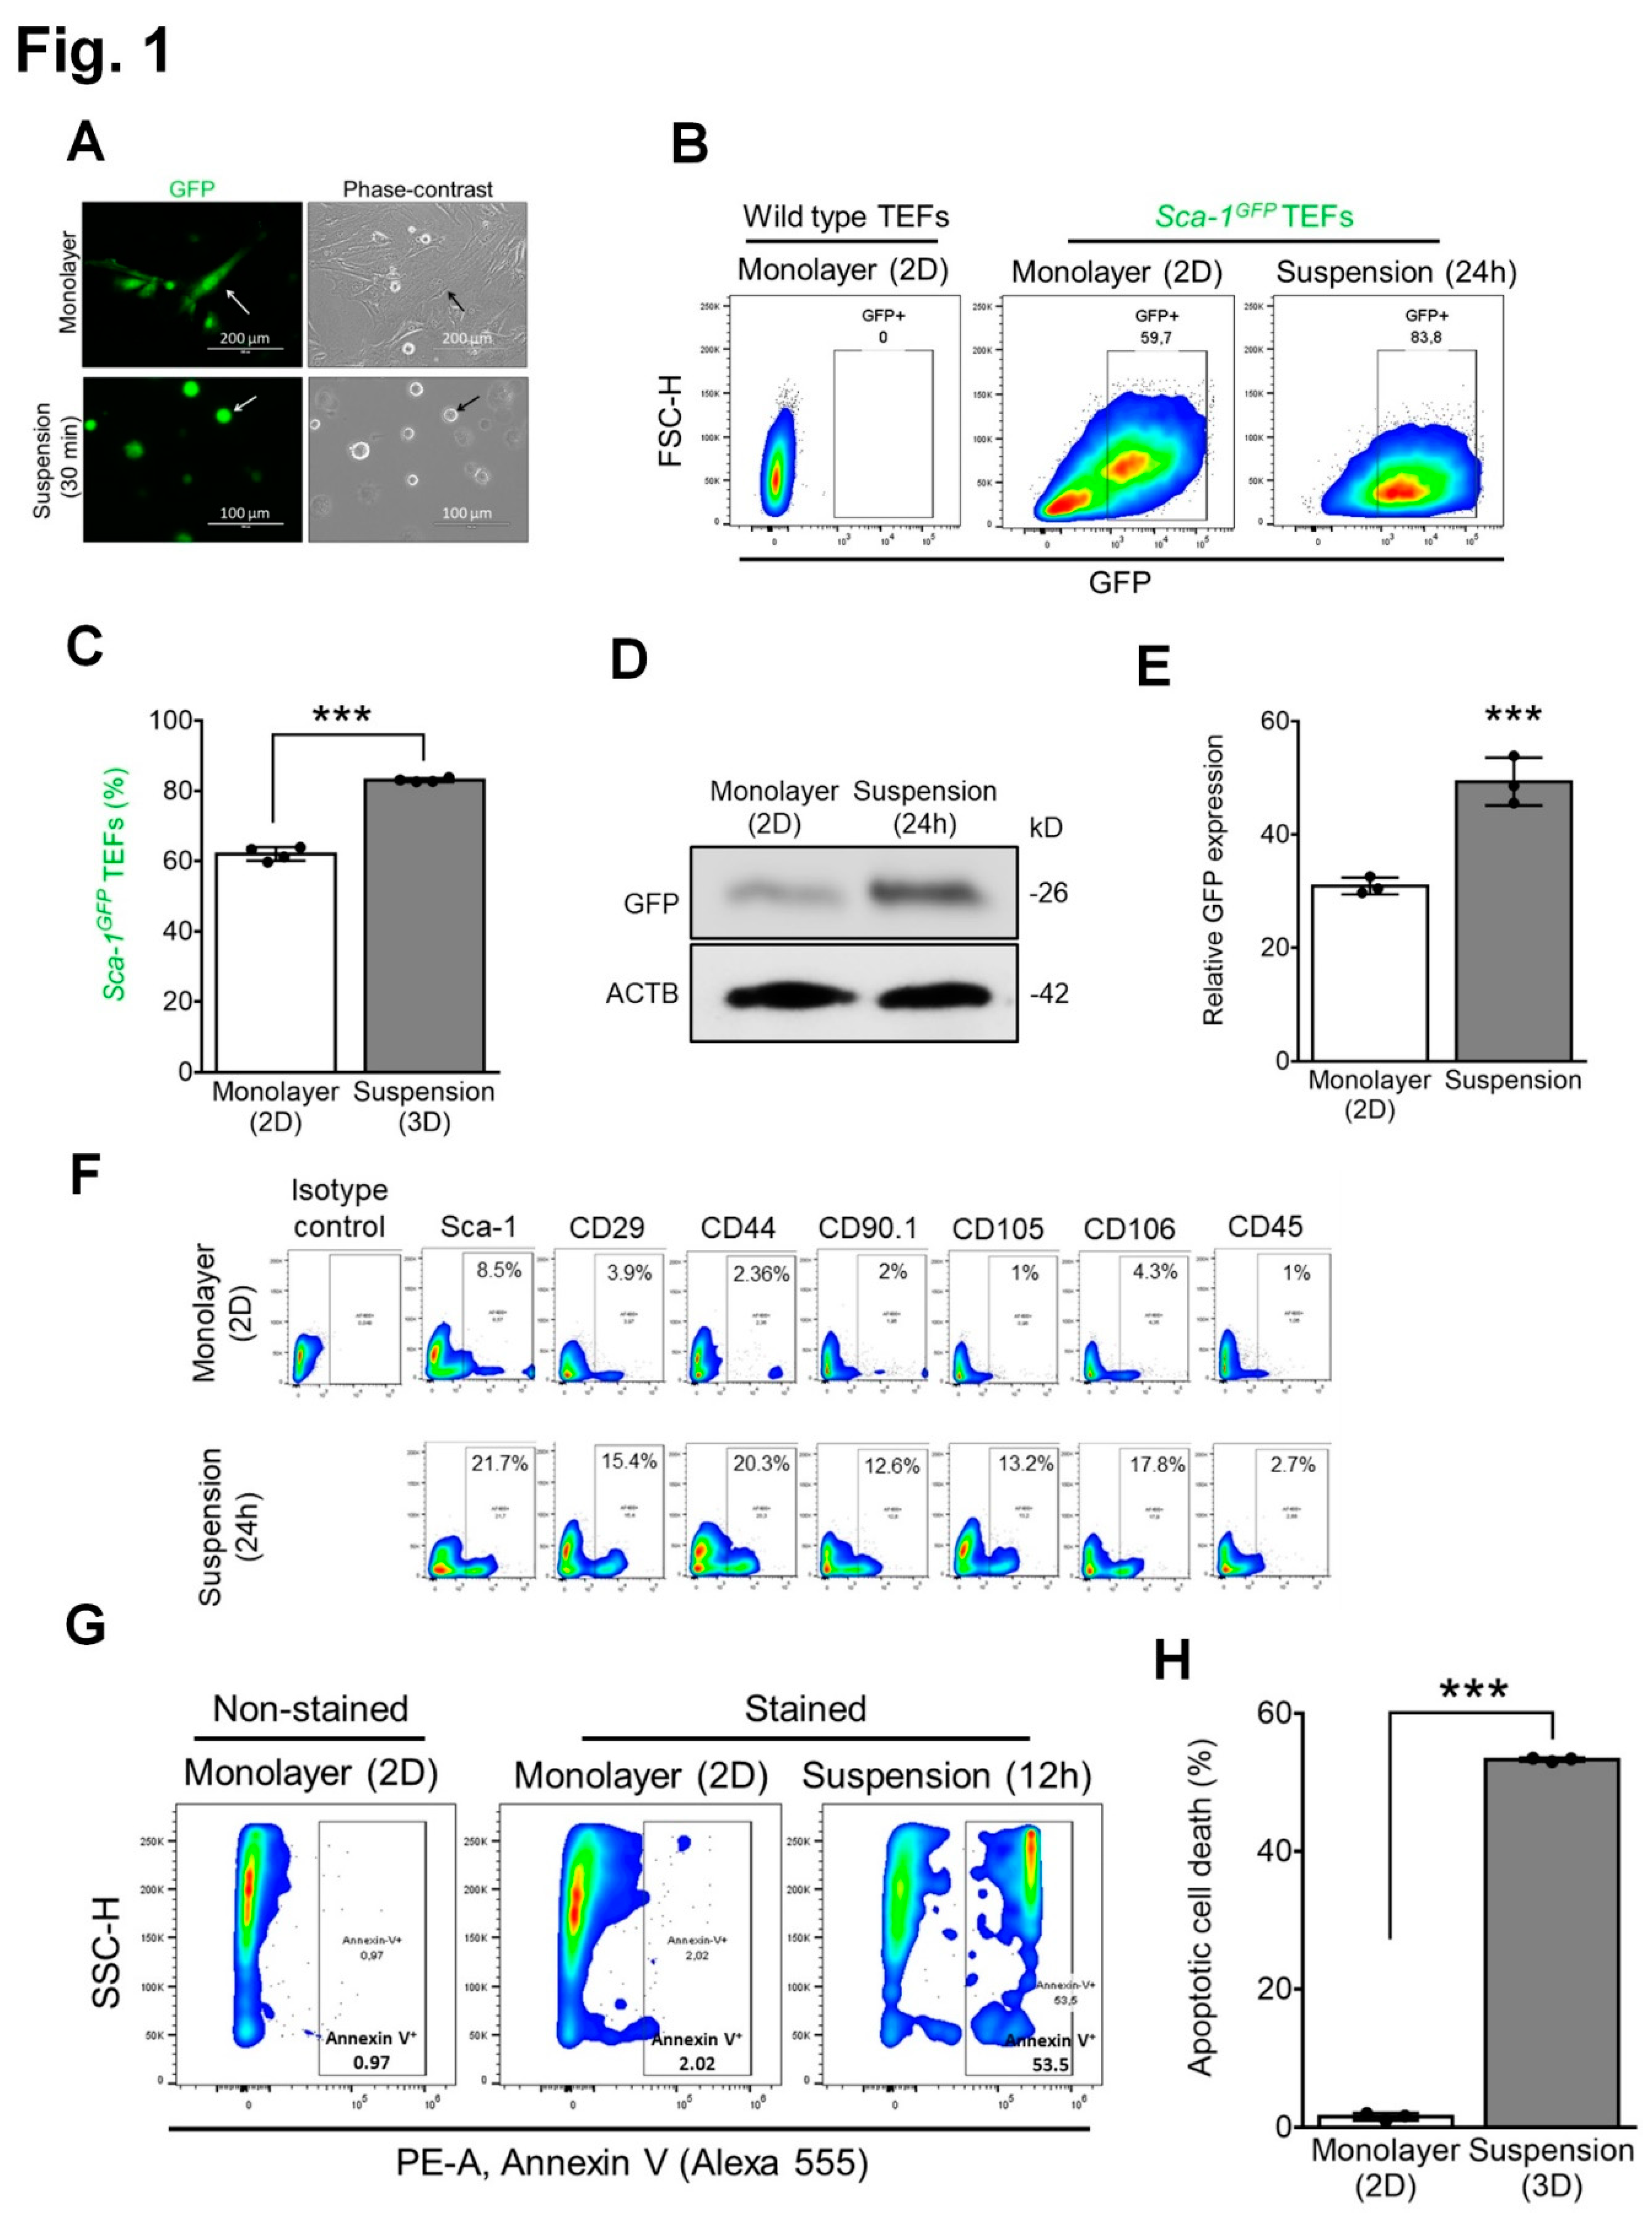
3.1. Expression of MSC surface markers by mouse TEFs grown in suspension culture while undergoing detachment-induced apoptosis (anoikis)
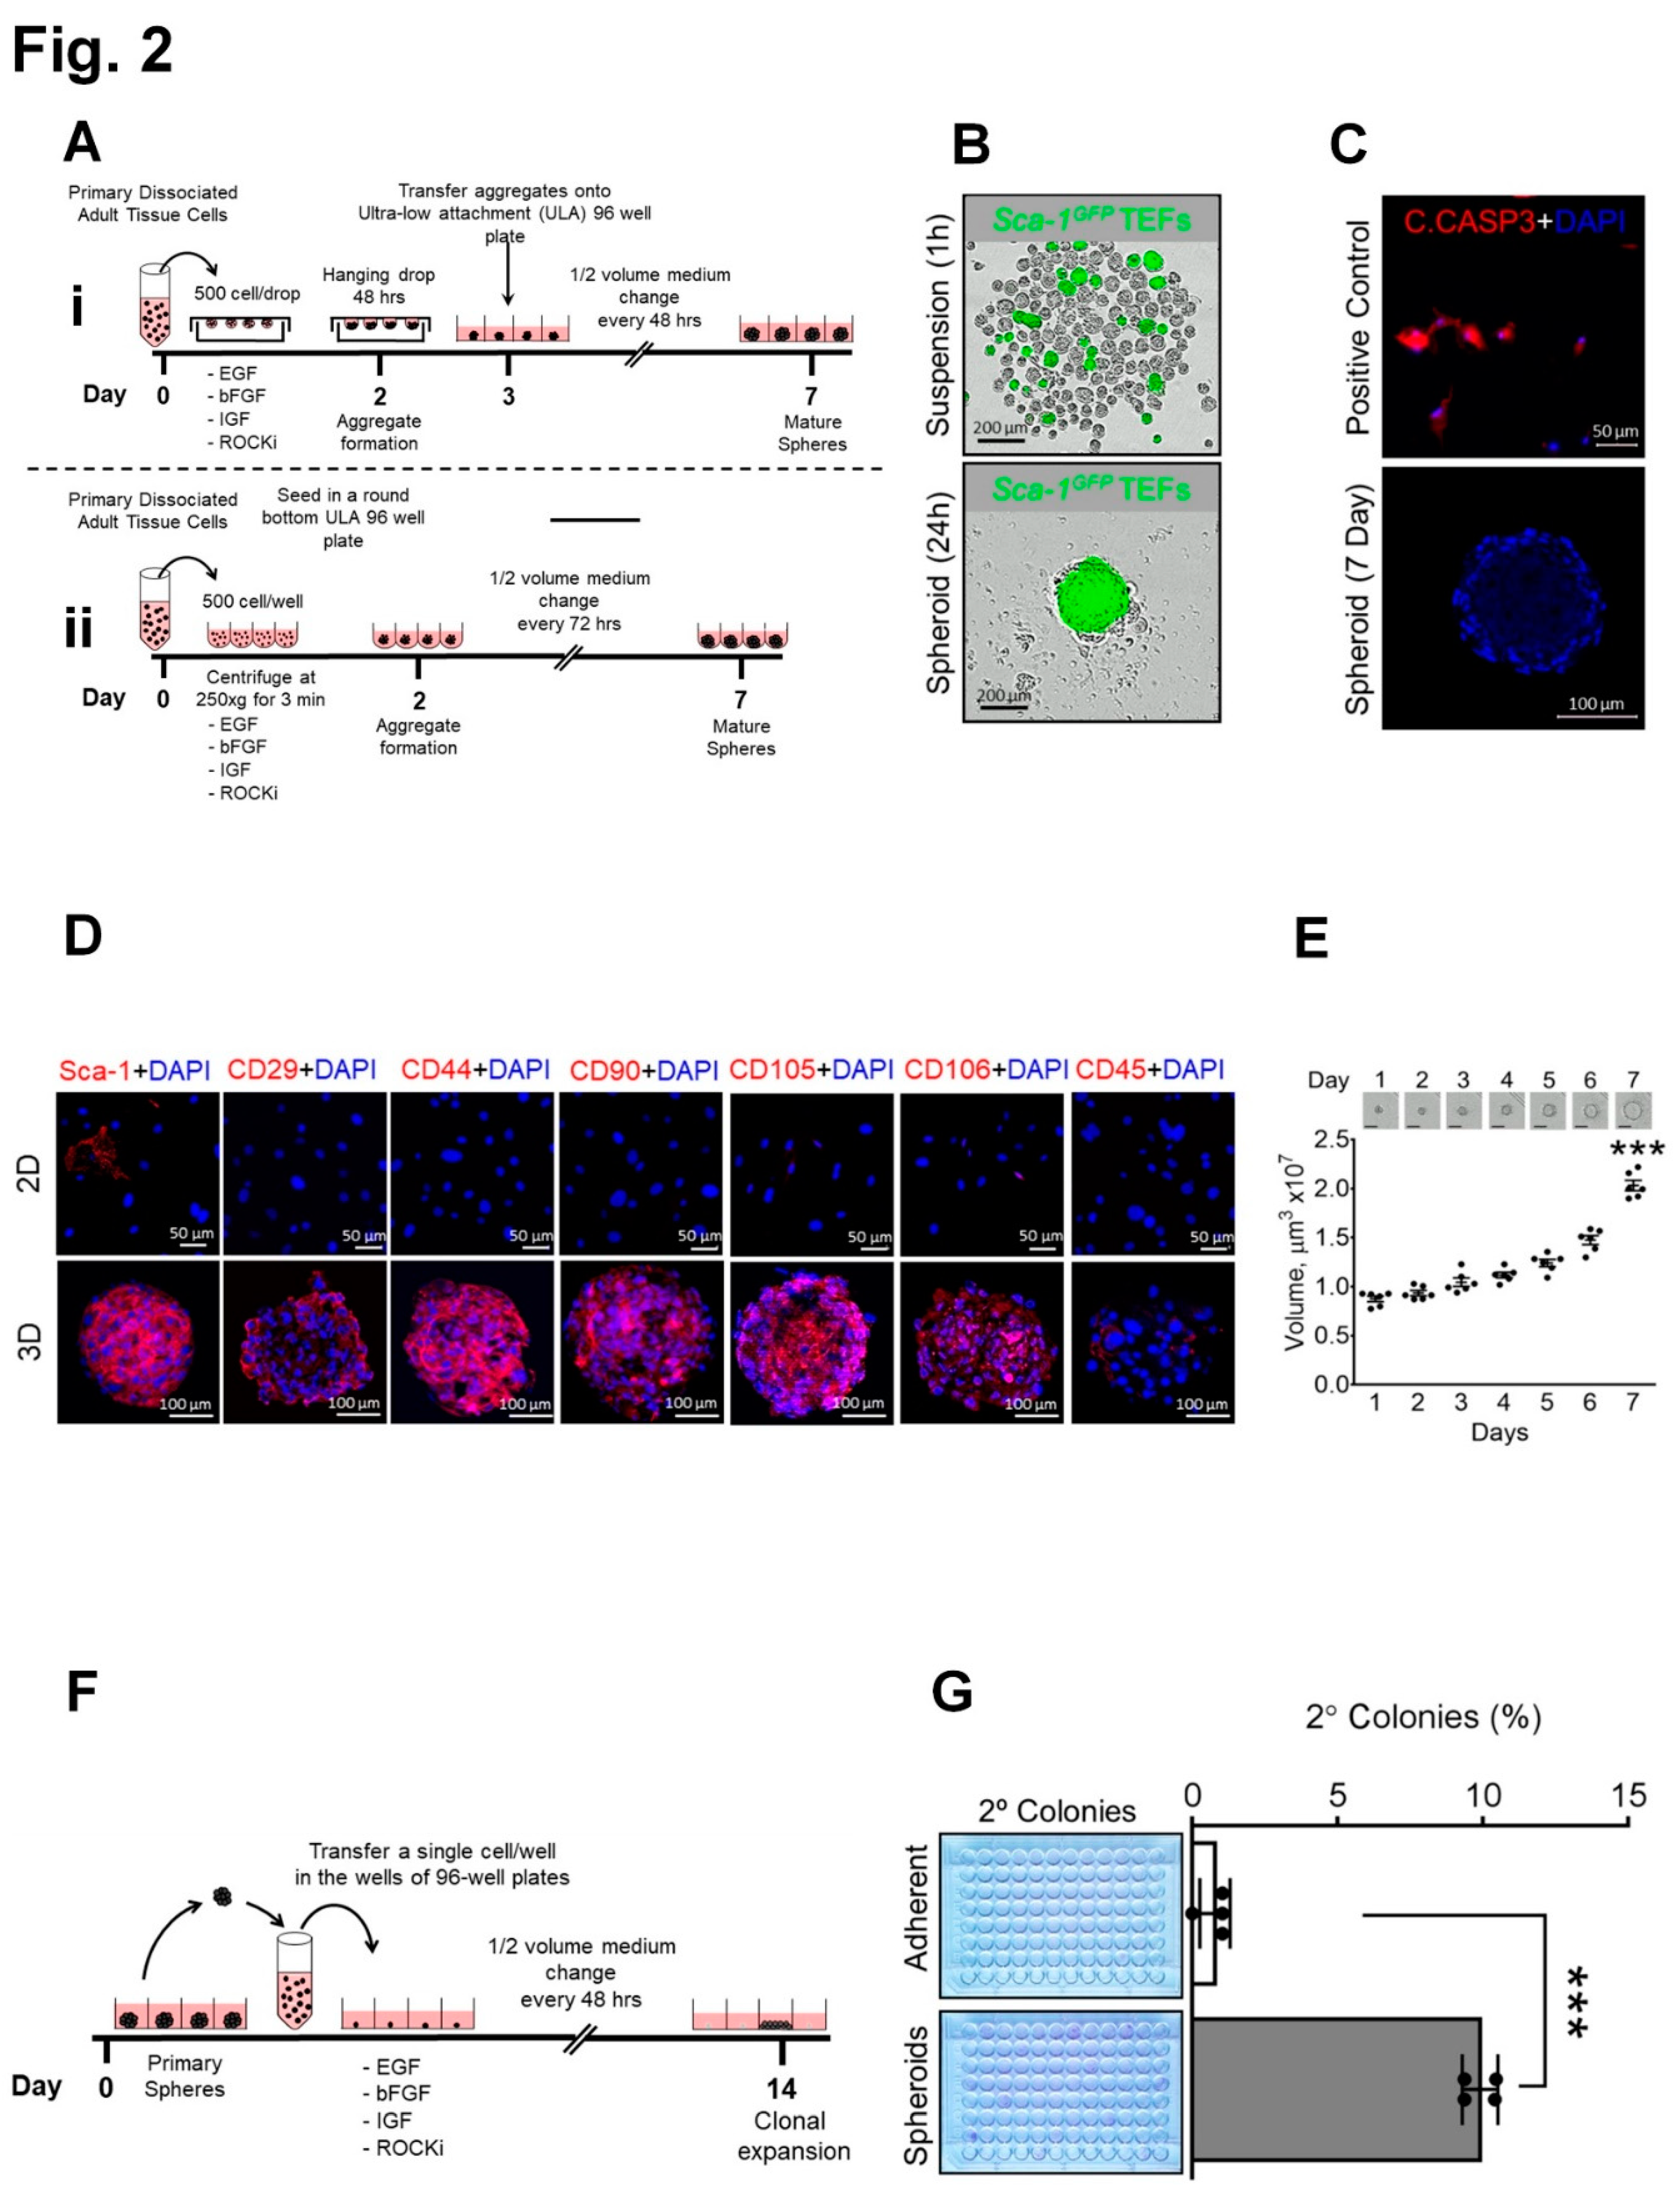
3.2. Overcoming anoikis with generation of proliferative mouse TEF-derived spheroids expressing MSC markers with self-renewal capacity
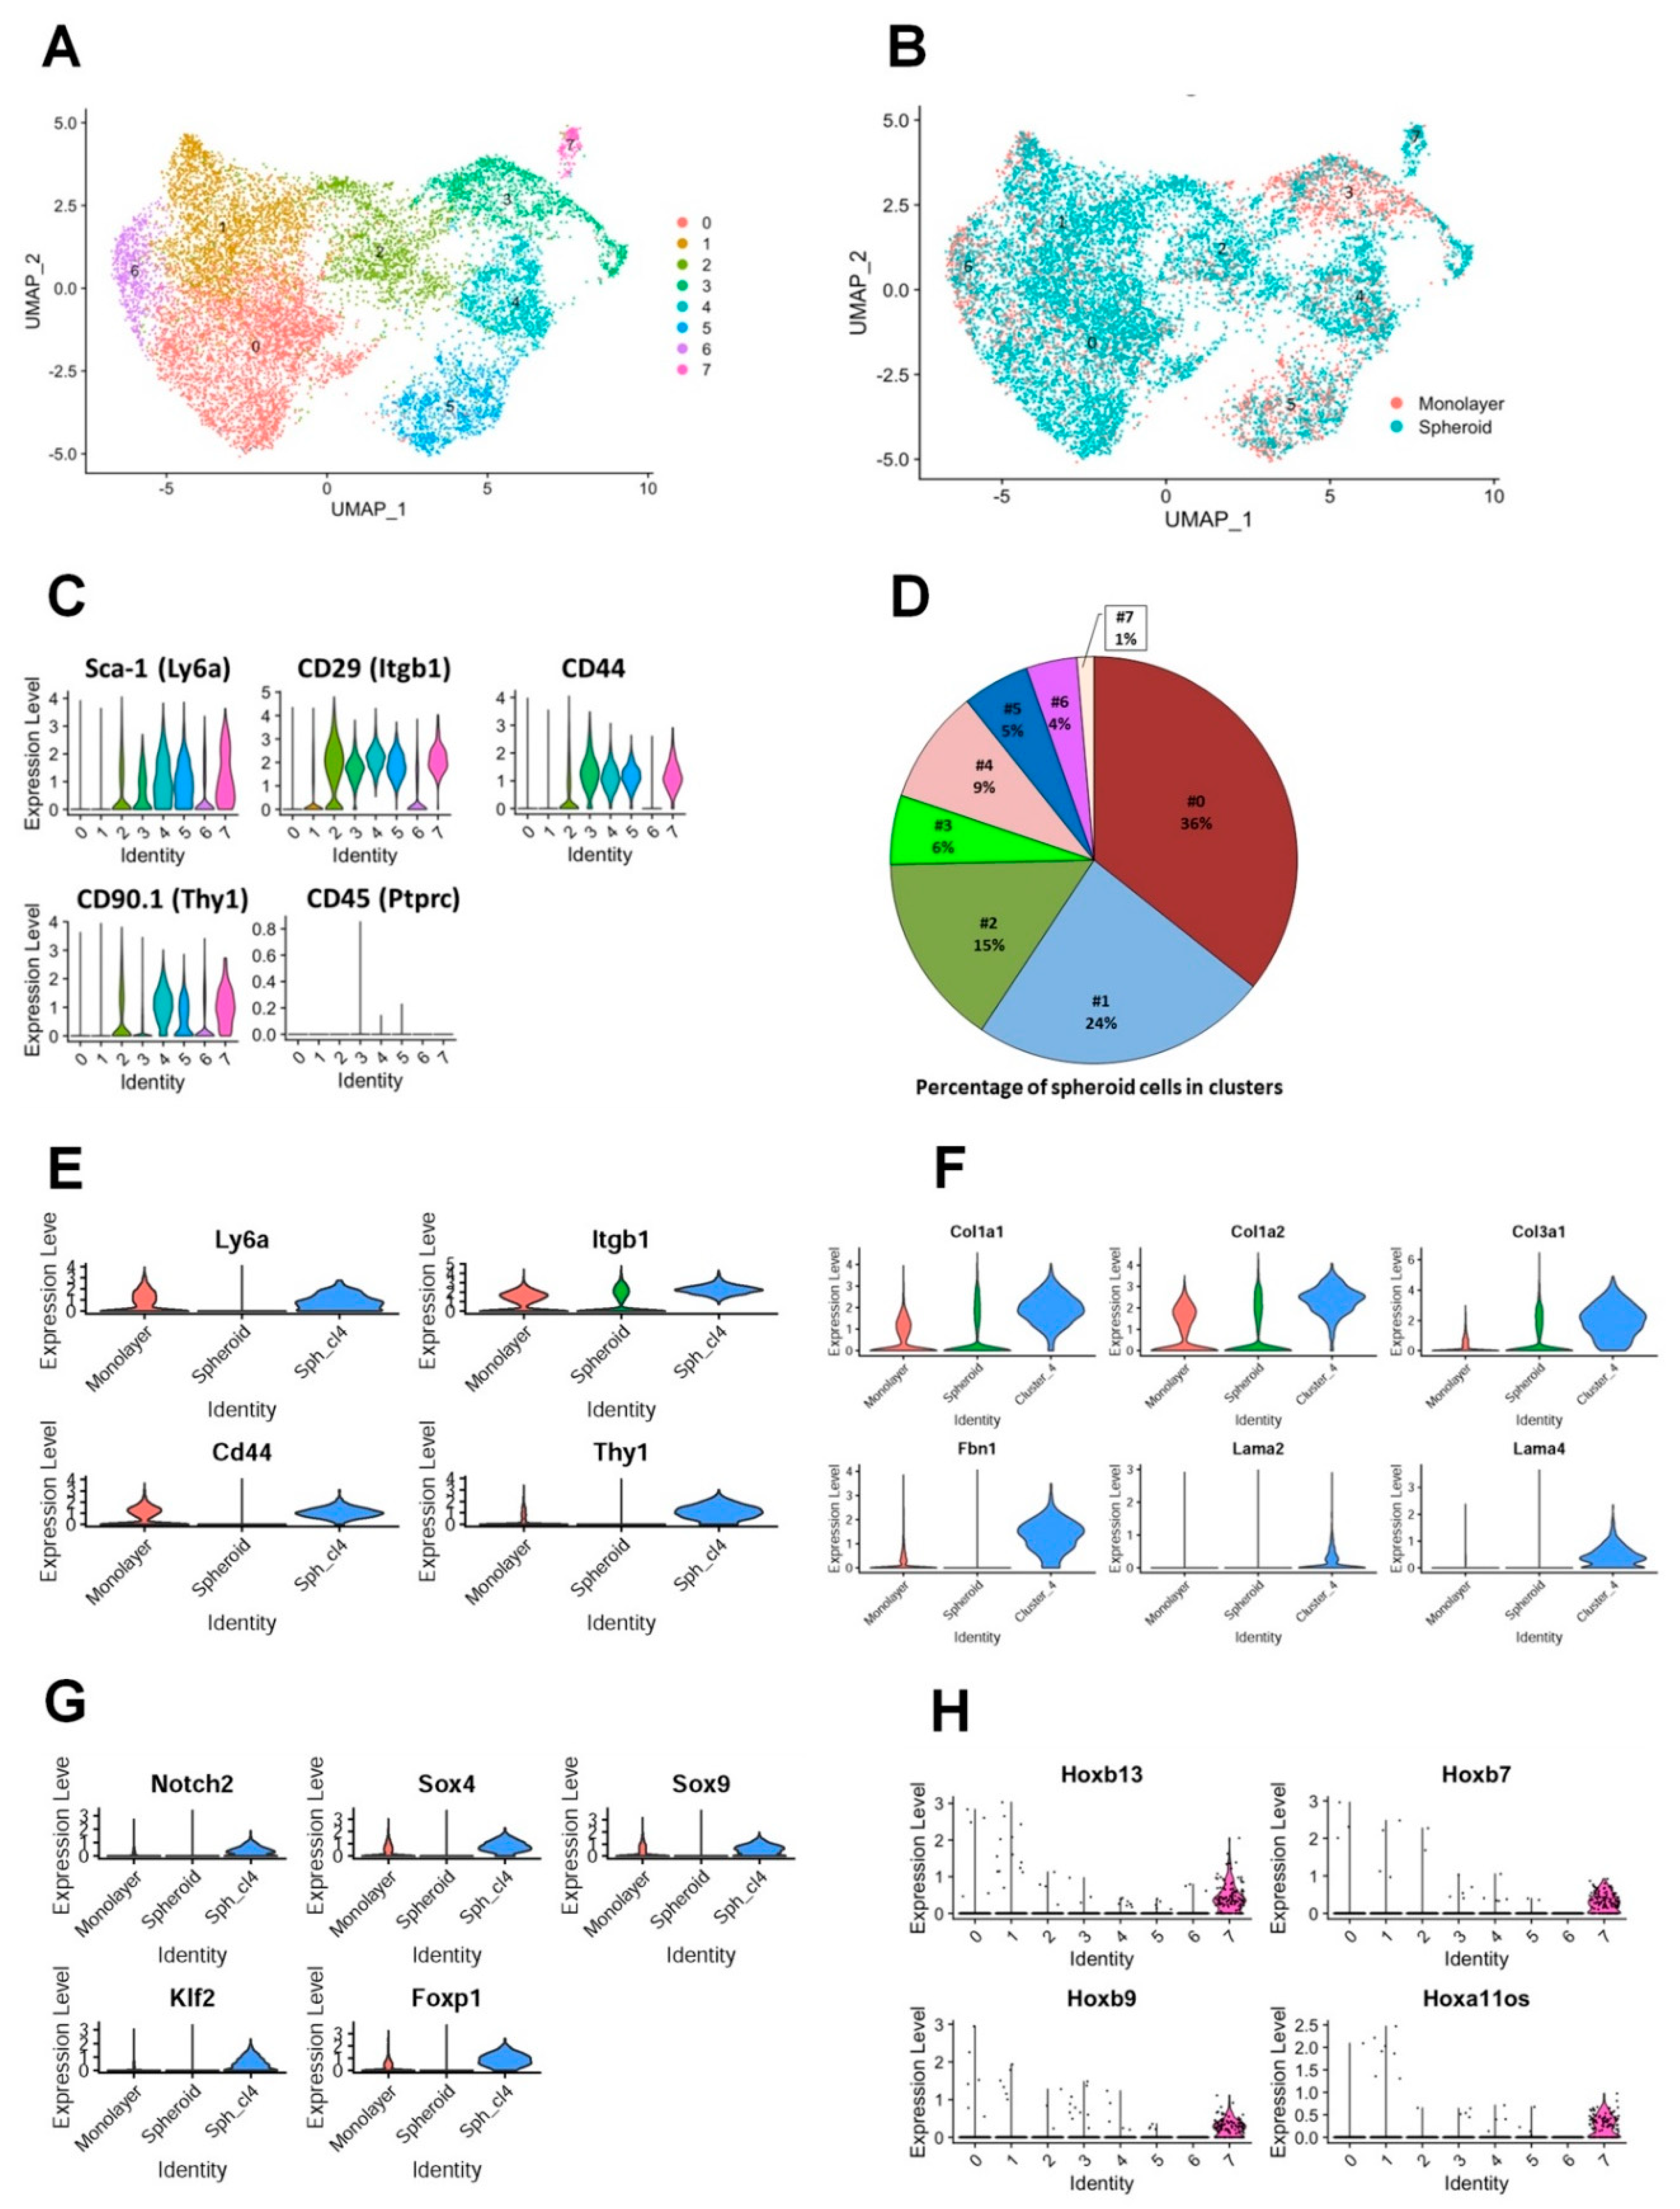
3.3. Characterizing the global gene expression profile of mouse TEF-derived spheroids compared to monolayer culture
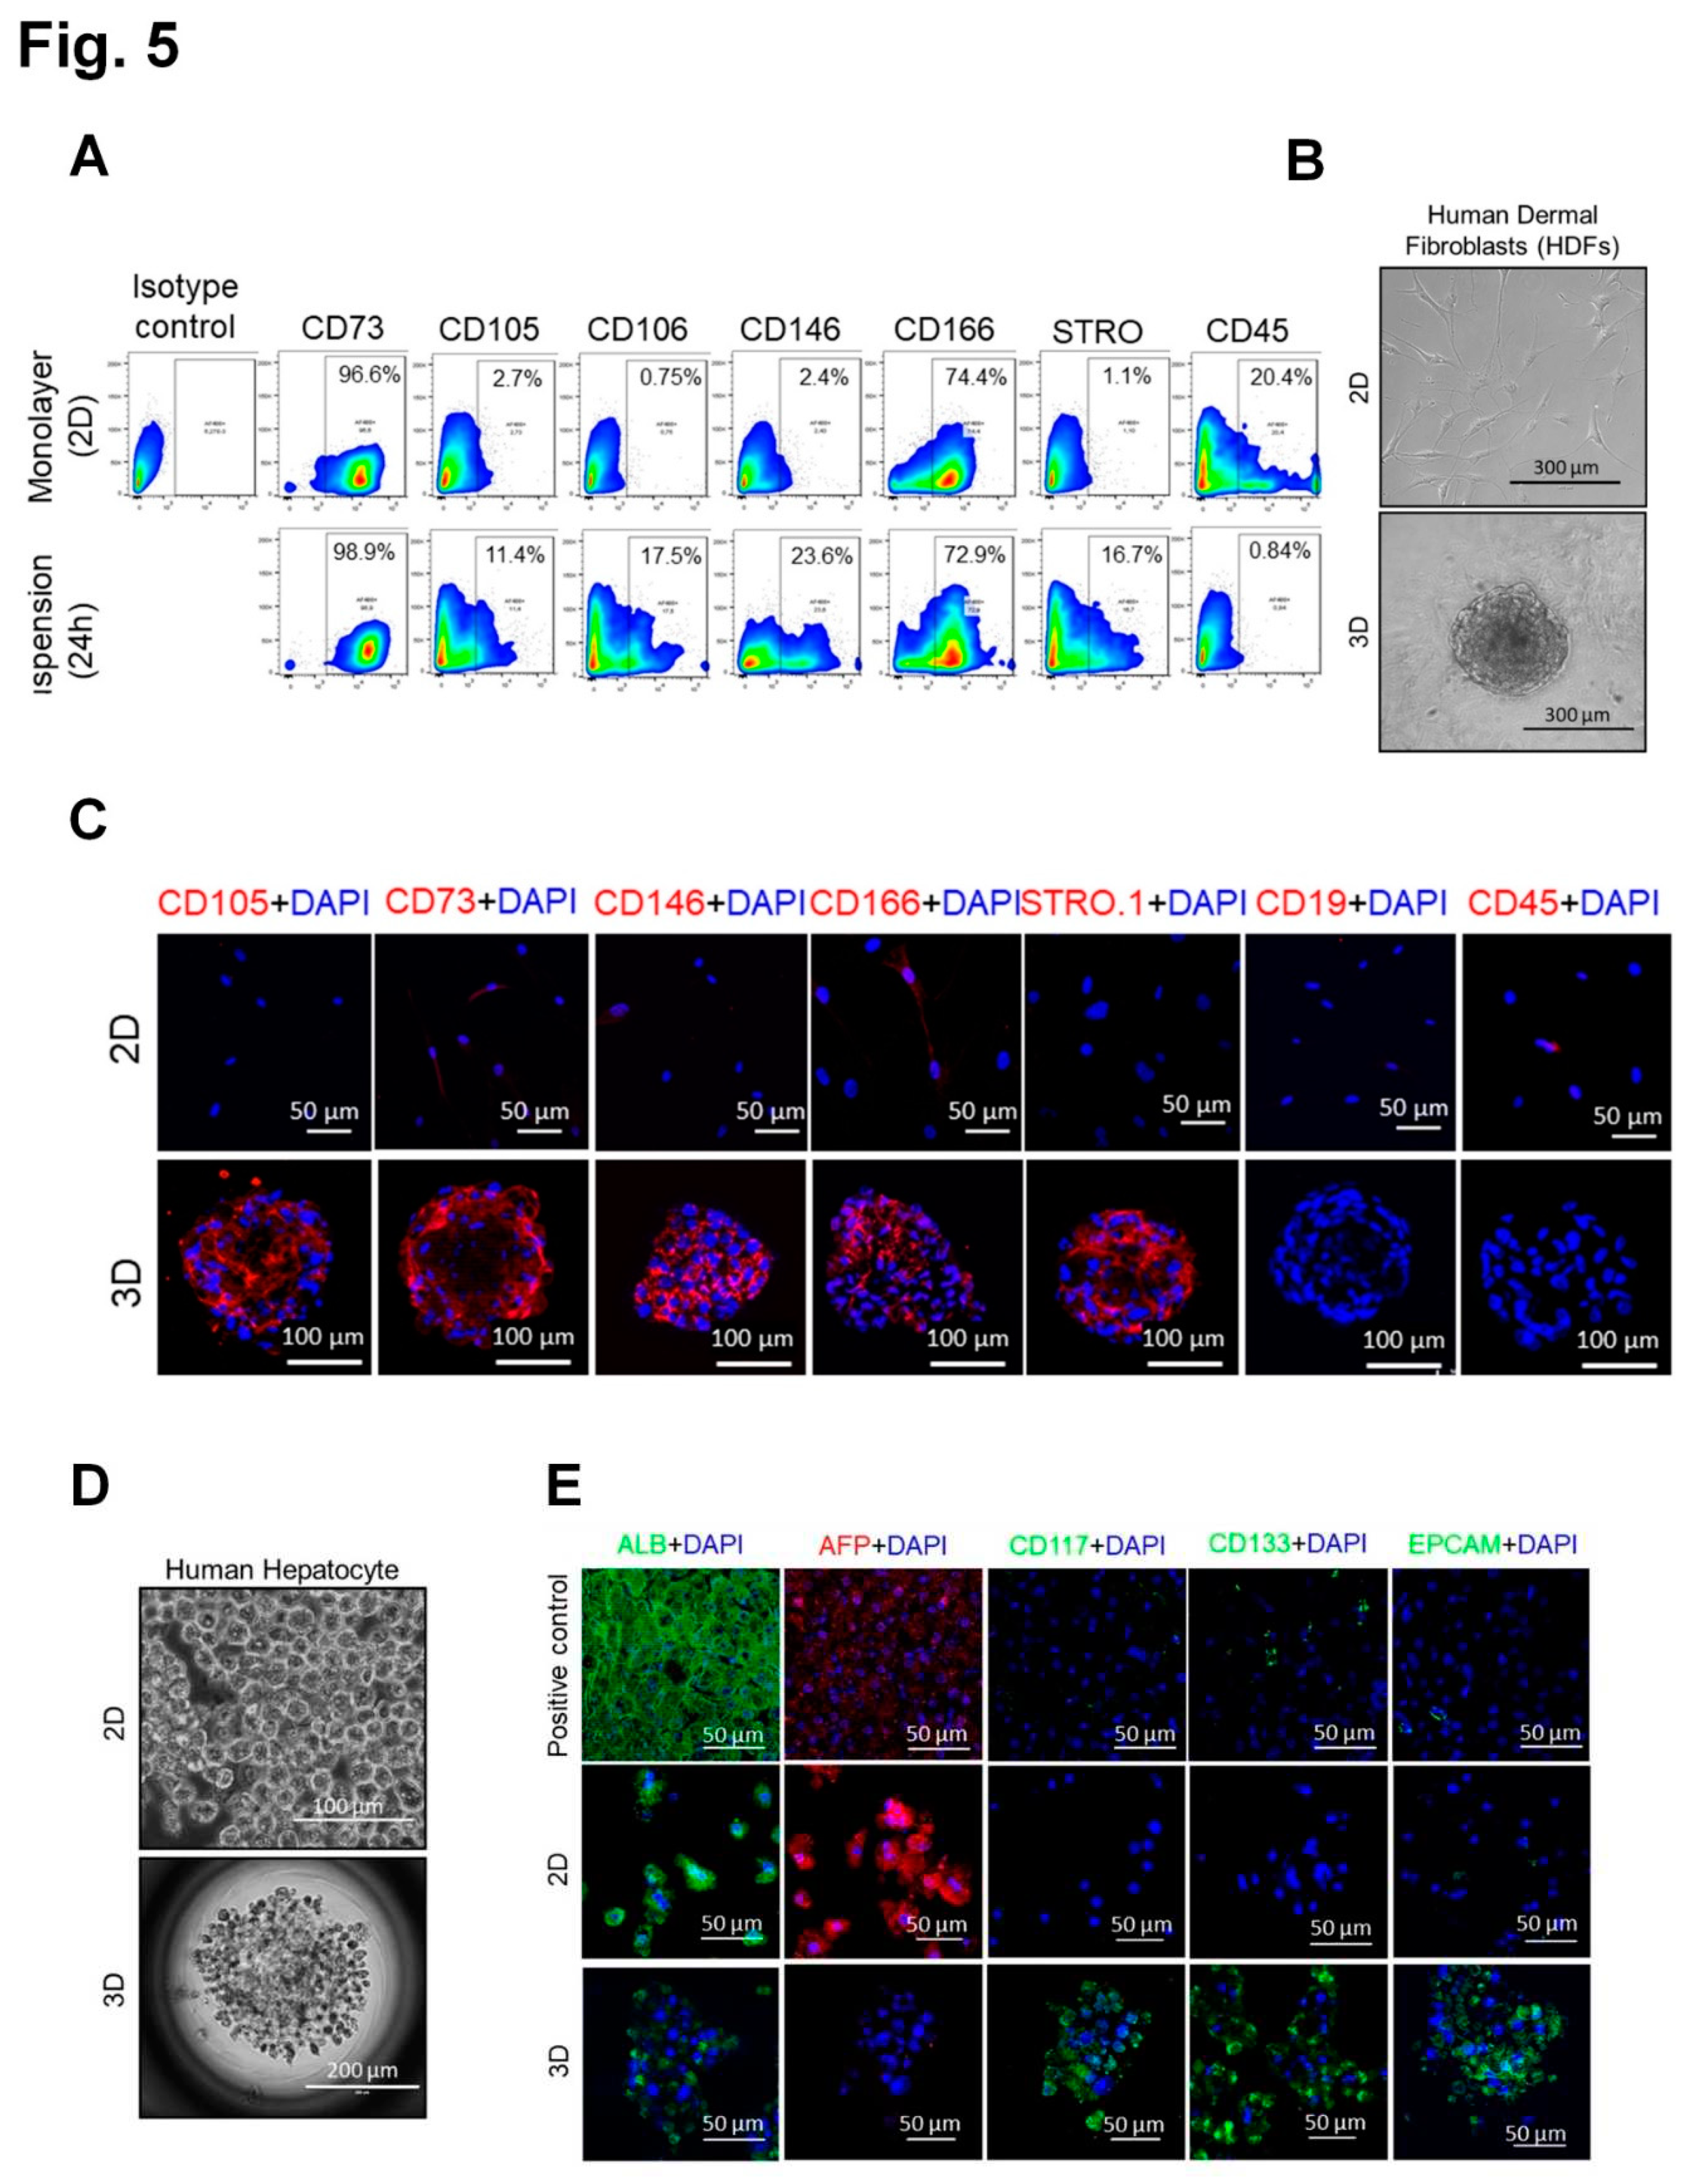
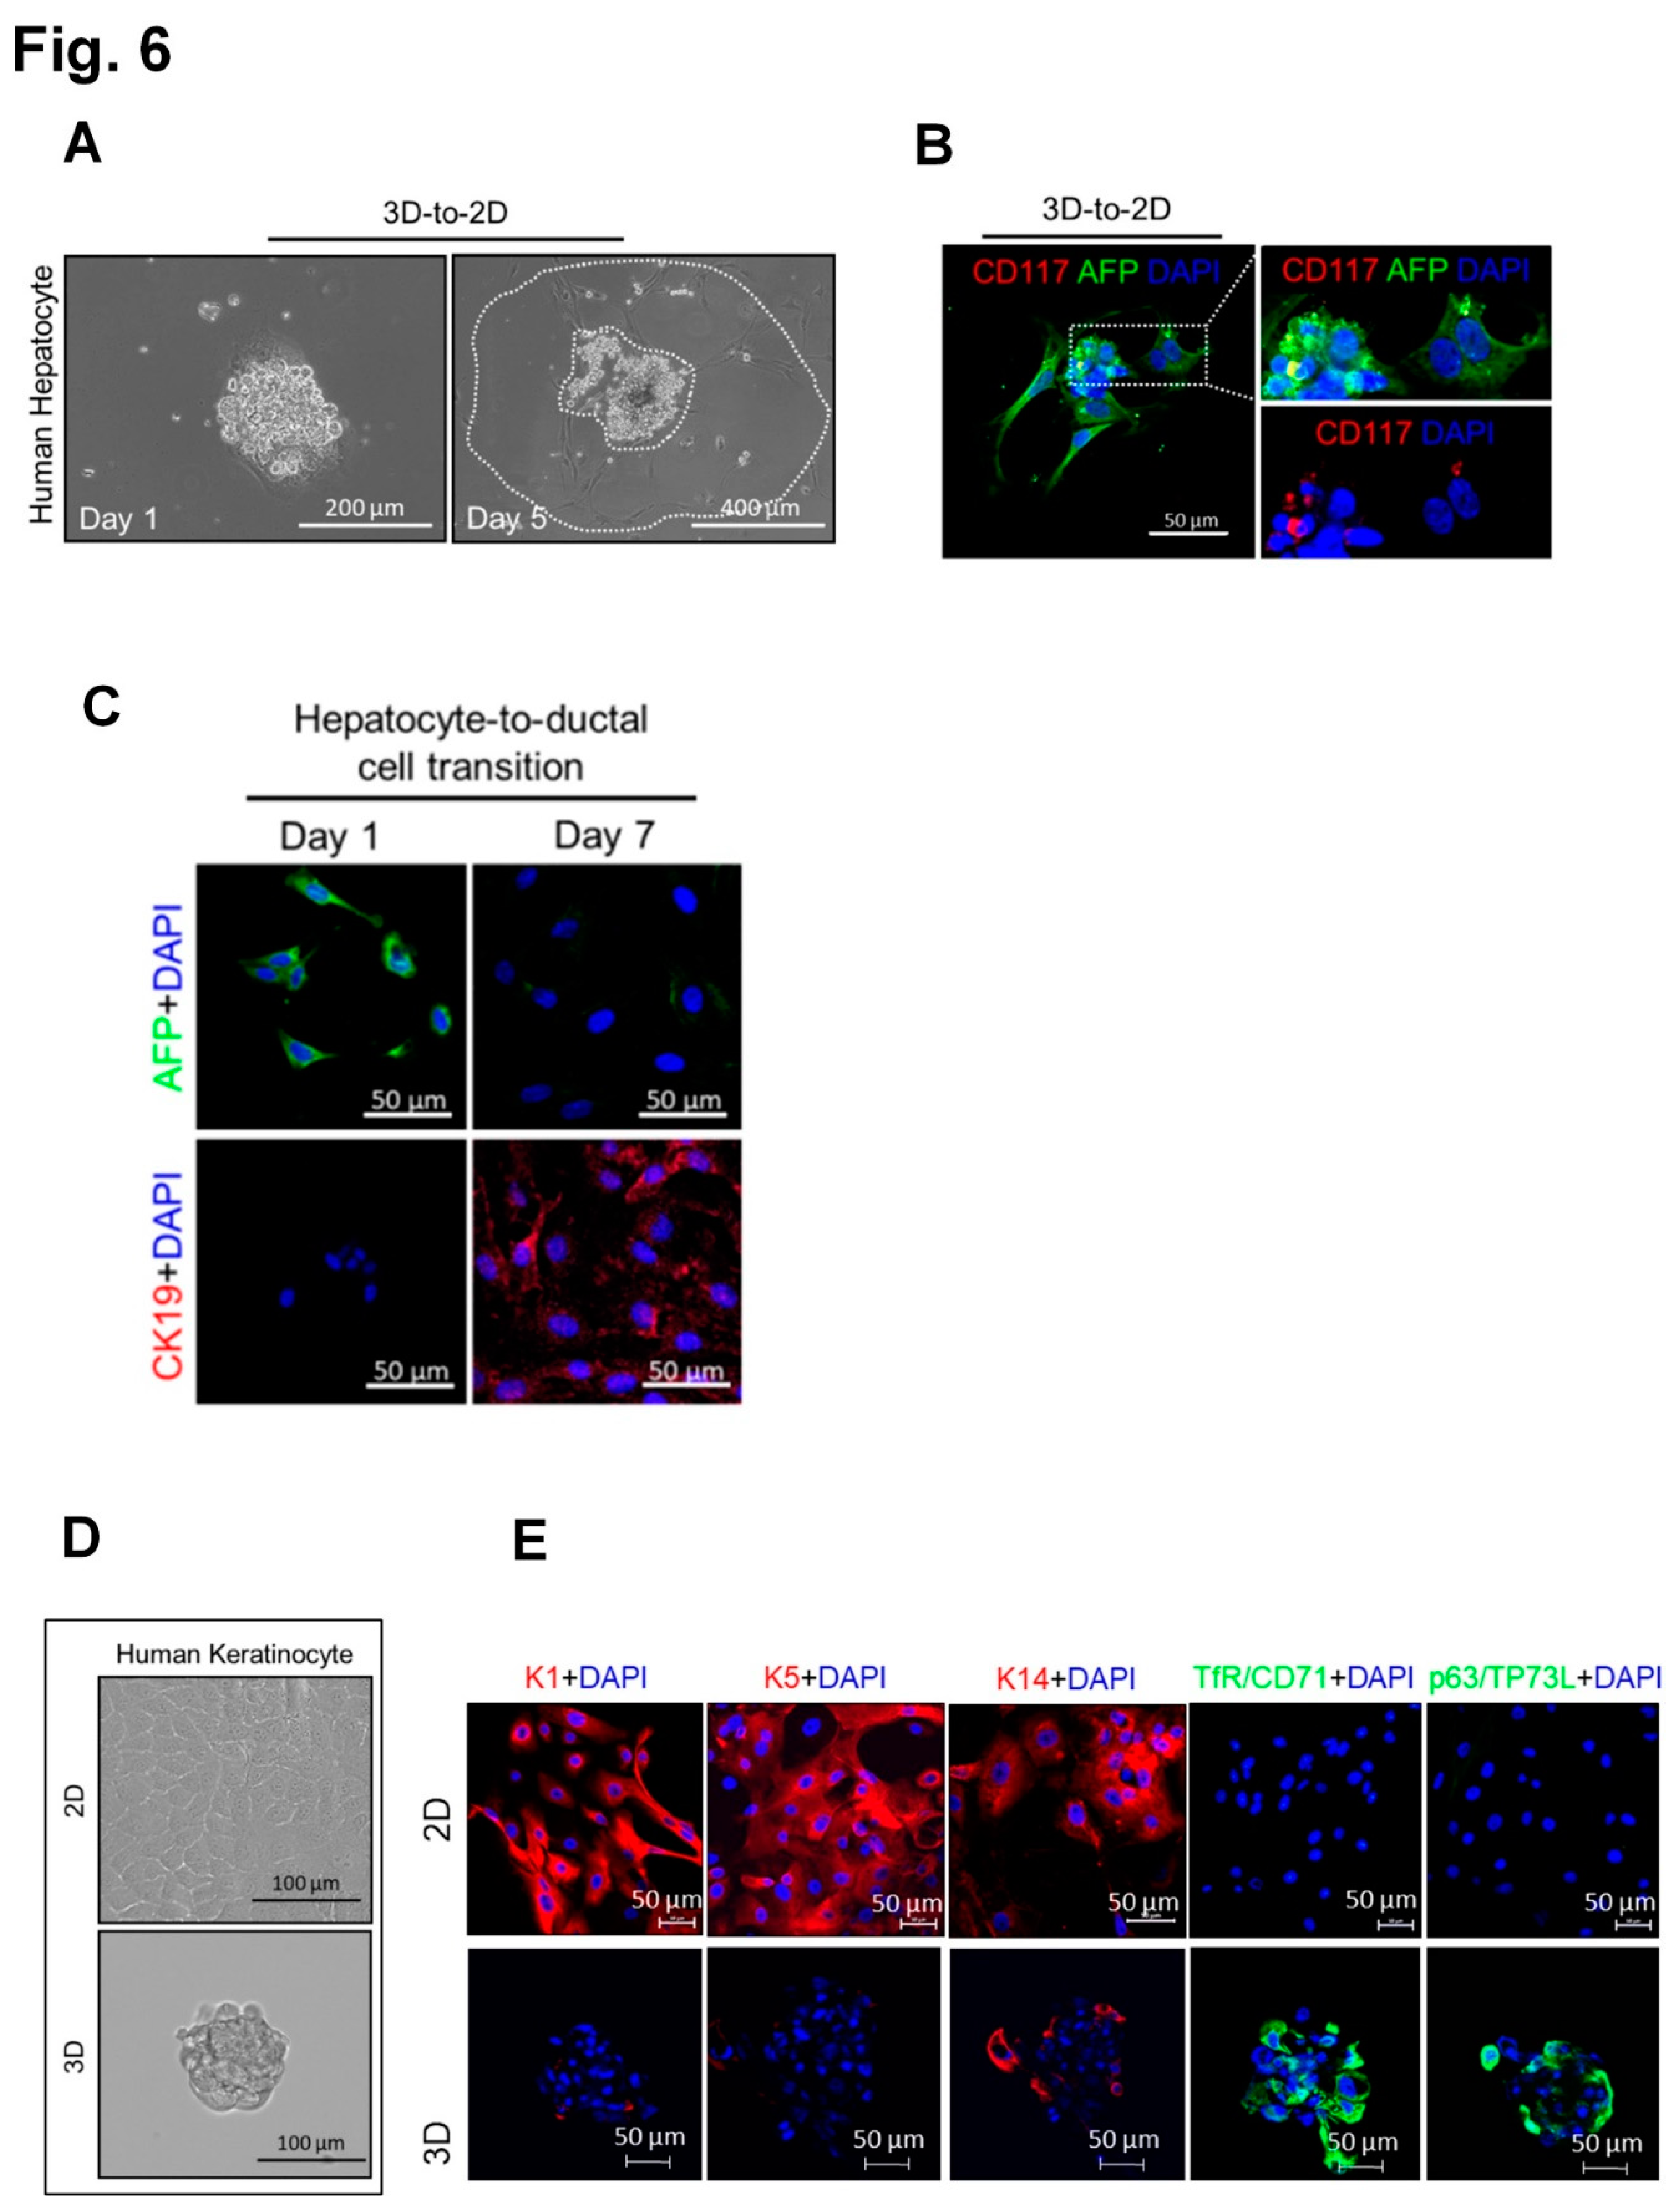
3.4. Generation of spheroids with SC properties from cells of all three human germ layers, mesoderm, endoderm and ectoderm (human dermal fibroblasts, hepatocytes and keratinocytes, respectively.
4. Discussion
Supplementary Materials
Funding
Institutional Review Board Statement
Acknowledgments
Conflicts of Interest
References
- Slack, J.M.W. Origin of Stem Cells in Organogenesis. Science 2008, 322, 1498–1501. [Google Scholar] [CrossRef] [PubMed]
- Clevers, H. STEM CELLS. What is an adult stem cell? Science 2015, 350, 1319–1320. [Google Scholar] [CrossRef] [PubMed]
- Reynolds, B.A.; Weiss, S. Generation of Neurons and Astrocytes from Isolated Cells of the Adult Mammalian Central Nervous System. Science 1992, 255, 1707–1710. [Google Scholar] [CrossRef] [PubMed]
- Toma, J.G.; Akhavan, M.; Fernandes, K.J.L.; Barnabé-Heider, F.; Sadikot, A.; Kaplan, D.R.; Miller, F.D. Isolation of multipotent adult stem cells from the dermis of mammalian skin. Nature 2001, 3, 778–784. [Google Scholar] [CrossRef]
- Dontu, G.; Abdallah, W.M.; Foley, J.M.; Jackson, K.W.; Clarke, M.F.; Kawamura, M.J.; Wicha, M.S. In vitro propagation and transcriptional profiling of human mammary stem/progenitor cells. Minerva Anestesiol. 2003, 17, 1253–1270. [Google Scholar] [CrossRef]
- Beltrami, A.P.; Barlucchi, L.; Torella, D.; Baker, M.; Limana, F.; Chimenti, S.; Kasahara, H.; Rota, M.; Musso, E.; Urbanek, K.; et al. Adult Cardiac Stem Cells Are Multipotent and Support Myocardial Regeneration. Cell 2003, 114, 763–776. [Google Scholar] [CrossRef]
- Takahashi, J.; Mizutani, T.; Sugihara, H.Y.; Nagata, S.; Kato, S.; Hiraguri, Y.; Takeoka, S.; Tsuchiya, M.; Kuno, R.; Kakinuma, S.; et al. Suspension culture in a rotating bioreactor for efficient generation of human intestinal organoids. Cell Rep. Methods 2022, 2. [Google Scholar] [CrossRef]
- Capeling, M.M.; Huang, S.; Childs, C.J.; Wu, J.H.; Tsai, Y.-H.; Wu, A.; Garg, N.; Holloway, E.M.; Sundaram, N.; Bouffi, C.; et al. Suspension culture promotes serosal mesothelial development in human intestinal organoids. Cell Rep. 2022, 38, 110379–110379. [Google Scholar] [CrossRef]
- Boonekamp, K.E.; Kretzschmar, K.; Wiener, D.J.; Asra, P.; Derakhshan, S.; Puschhof, J.; López-Iglesias, C.; Peters, P.J.; Basak, O.; Clevers, H. Long-term expansion and differentiation of adult murine epidermal stem cells in 3D organoid cultures. Proc. Natl. Acad. Sci. 2019, 116, 14630–14638. [Google Scholar] [CrossRef]
- Takahashi, K. and S. Yamanaka, Induction of pluripotent stem cells from mouse embryonic and adult fibroblast cultures by defined factors. Cell 2006, 126, 663–676. [Google Scholar] [CrossRef]
- Bafico, A. and S.A. Aaronson, Classification of Growth Factors and Their Receptors. 6th ed. Holland-Frei Cancer Medicine, ed. D.W. Kufe, et al. 2003, Hamilton (ON): BC Decker Inc.
- Watanabe, K. , et al., A ROCK inhibitor permits survival of dissociated human embryonic stem cells. Nat Biotechnol. 2007, 25. [Google Scholar] [CrossRef] [PubMed]
- Yeganeh, B.; Lee, J.; Ermini, L.; Lok, I.; Ackerley, C.; Post, M. Autophagy is required for lung development and morphogenesis. J. Clin. Investig. 2019, 129, 2904–2919. [Google Scholar] [CrossRef] [PubMed]
- Weiss, S.; Dunne, C.; Hewson, J.; Wohl, C.; Wheatley, M.; Peterson, A.C.; Reynolds, B.A. Multipotent CNS Stem Cells Are Present in the Adult Mammalian Spinal Cord and Ventricular Neuroaxis. J. Neurosci. 1996, 16, 7599–7609. [Google Scholar] [CrossRef]
- Keating, A. Mesenchymal Stromal Cells: New Directions. Cell Stem Cell 2012, 10, 709–716. [Google Scholar] [CrossRef] [PubMed]
- Wu, H. , et al., Reversible transition between hepatocytes and liver progenitors for in vitro hepatocyte expansion. Cell Res 2017, 27, 709–712. [Google Scholar] [CrossRef]
- Bonyadi, M. , et al., Mesenchymal progenitor self-renewal deficiency leads to age-dependent osteoporosis in Sca-1/Ly-6A null mice. Proc Natl Acad Sci U S A 2003, 100, 5840–5845. [Google Scholar] [CrossRef]
- Miles, C.; Sanchez, M.-J.; Sinclair, A.; Dzierzak, E. Expression of the Ly-6E.1 (Sca-1) transgene in adult hematopoietic stem cells and the developing mouse embryo. Development 1997, 124, 537–547. [Google Scholar] [CrossRef]
- McGill, G.; Shimamura, A.; Bates, R.C.; Savage, R.E.; Fisher, D.E. Loss of Matrix Adhesion Triggers Rapid Transformation-Selective Apoptosis in Fibroblasts. J. Cell Biol. 1997, 138, 901–911. [Google Scholar] [CrossRef]
- Frisch, S.M. and R.A. Screaton, Anoikis mechanisms. Curr Opin Cell Biol 2001, 13, 555–562. [Google Scholar] [CrossRef]
- Frisch, S.; Francis, H. Disruption of epithelial cell-matrix interactions induces apoptosis. J. Cell Biol. 1994, 124, 619–626. [Google Scholar] [CrossRef]
- Yartseva, V. , et al., Heterogeneity of Satellite Cells Implicates DELTA1/NOTCH2 Signaling in Self-Renewal. Cell Rep 2020, 30, 1491–1503. [Google Scholar] [CrossRef] [PubMed]
- Larsimont, J.-C.; Youssef, K.K.; Sánchez-Danés, A.; Sukumaran, V.; Defrance, M.; Delatte, B.; Liagre, M.; Baatsen, P.; Marine, J.-C.; Lippens, S.; et al. Sox9 Controls Self-Renewal of Oncogene Targeted Cells and Links Tumor Initiation and Invasion. Cell Stem Cell 2015, 17, 60–73. [Google Scholar] [CrossRef] [PubMed]
- Wang, H.; Zhou, Y.; Yu, D.; Zhu, H. Klf2 contributes to the stemness and self-renewal of human bone marrow stromal cells. Cytotechnology 2014, 68, 839–848. [Google Scholar] [CrossRef]
- Pearson, C.A.; Moore, D.M.; Tucker, H.O.; Dekker, J.D.; Hu, H.; Miquelajáuregui, A.; Novitch, B.G. Foxp1 Regulates Neural Stem Cell Self-Renewal and Bias Toward Deep Layer Cortical Fates. Cell Rep. 2020, 30, 1964–1981. [Google Scholar] [CrossRef] [PubMed]
- Zhang, L.; Chen, S.; Bao, N.; Yang, C.; Ti, Y.; Zhou, L.; Zhao, J. Sox4 enhances chondrogenic differentiation and proliferation of human synovium-derived stem cell via activation of long noncoding RNA DANCR. Histochem. J. 2015, 46, 467–473. [Google Scholar] [CrossRef]
- Leclerc, K.; Remark, L.H.; Ramsukh, M.; Josephson, A.M.; Palma, L.; Parente, P.E.L.; Sambon, M.; Lee, S.; Lopez, E.M.; Morgani, S.M.; et al. Hox genes are crucial regulators of periosteal stem cell identity. Development 2023, 150. [Google Scholar] [CrossRef]
- Stamenkovic, I. Extracellular matrix remodelling: the role of matrix metalloproteinases. J. Pathol. 2003, 200, 448–464. [Google Scholar] [CrossRef]
- Nowak, G.; Ericzon, B.-G.; Nava, S.; Jaksch, M.; Westgren, M.; Sumitran-Holgersson, S. Identification of expandable human hepatic progenitors which differentiate into mature hepatic cells in vivo. Gut 2005, 54, 972–979. [Google Scholar] [CrossRef]
- Pellegrini, G.; Dellambra, E.; Golisano, O.; Martinelli, E.; Fantozzi, I.; Bondanza, S.; Ponzin, D.; McKeon, F.; De Luca, M. p63 identifies keratinocyte stem cells. Proc. Natl. Acad. Sci. 2001, 98, 3156–3161. [Google Scholar] [CrossRef]
- Li, A.; Simmons, P.J.; Kaur, P. Identification and isolation of candidate human keratinocyte stem cells based on cell surface phenotype. Proc. Natl. Acad. Sci. 1998, 95, 3902–3907. [Google Scholar] [CrossRef]
- Itoh, M.; Kiuru, M.; Cairo, M.S.; Christiano, A.M. Generation of keratinocytes from normal and recessive dystrophic epidermolysis bullosa-induced pluripotent stem cells. Proc. Natl. Acad. Sci. 2011, 108, 8797–8802. [Google Scholar] [CrossRef] [PubMed]
- Zhou, Q.; Kim, S.H.; Pérez-Lorenzo, R.; Liu, C.; Huang, M.; Dotto, G.P.; Zheng, B.; Wu, X. Phenformin Promotes Keratinocyte Differentiation via the Calcineurin/NFAT Pathway. J. Investig. Dermatol. 2020, 141, 152–163. [Google Scholar] [CrossRef] [PubMed]
- Walmsley, G.G.; Rinkevich, Y.; Hu, M.S.; Montoro, D.T.; Lo, D.D.; McArdle, A.; Maan, Z.N.; Morrison, S.D.; Duscher, D.; Whittam, A.J.; et al. Live Fibroblast Harvest Reveals Surface Marker Shift In Vitro. Tissue Eng. Part C: Methods 2015, 21, 314–321. [Google Scholar] [CrossRef]
- Mani, S.A.; Guo, W.; Liao, M.-J.; Eaton, E.N.; Ayyanan, A.; Zhou, A.Y.; Brooks, M.; Reinhard, F.; Zhang, C.C.; Shipitsin, M.; et al. The Epithelial-Mesenchymal Transition Generates Cells with Properties of Stem Cells. Cell 2008, 133, 704–715. [Google Scholar] [CrossRef]
- Samavarchi-Tehrani, P.; Golipour, A.; David, L.; Sung, H.-K.; Beyer, T.A.; Datti, A.; Woltjen, K.; Nagy, A.; Wrana, J.L. Functional Genomics Reveals a BMP-Driven Mesenchymal-to-Epithelial Transition in the Initiation of Somatic Cell Reprogramming. Cell Stem Cell 2010, 7, 64–77. [Google Scholar] [CrossRef] [PubMed]
- Li, R.; Liang, J.; Ni, S.; Zhou, T.; Qing, X.; Li, H.; He, W.; Chen, J.; Li, F.; Zhuang, Q.; et al. A Mesenchymal-to-Epithelial Transition Initiates and Is Required for the Nuclear Reprogramming of Mouse Fibroblasts. Cell Stem Cell 2010, 7, 51–63. [Google Scholar] [CrossRef]
- Saitoh, I.; Sato, M.; Kiyokawa, Y.; Inada, E.; Iwase, Y.; Ibano, N.; Noguchi, H. Induced Tissue-Specific Stem Cells (iTSCs): Their Generation and Possible Use in Regenerative Medicine. Pharmaceutics 2021, 13, 780. [Google Scholar] [CrossRef]
Disclaimer/Publisher’s Note: The statements, opinions and data contained in all publications are solely those of the individual author(s) and contributor(s) and not of MDPI and/or the editor(s). MDPI and/or the editor(s) disclaim responsibility for any injury to people or property resulting from any ideas, methods, instructions or products referred to in the content. |
© 2023 by the authors. Licensee MDPI, Basel, Switzerland. This article is an open access article distributed under the terms and conditions of the Creative Commons Attribution (CC BY) license (http://creativecommons.org/licenses/by/4.0/).


