1. Introduction
The scale of underground engineering construction has increased in recent years with the development of science and technology in China. Due to the vast territory of China, a large number of underground engineering structures have been in a harsh environment for a long time. Especially in the northwest of China, there are a large number of salt marsh soil and salt lakes. Soil and groundwater contain a large amount of SO
42- ions. One of the most serious factors affecting underground engineering’s long-term durability is sulfate erosion [
1]. Additionally, the temperature difference between day and night in this area is large, and freeze-thaw damage contributes to the project’s durability. Cement-based grouting materials have been widely used in underground engineering to control groundwater damage and reinforce soft soil layers [
2]. Therefore, the research on the durability of cement-based grouting materials is extremely important to improve the safety and durability of underground engineering structures.
Zhu et al. [
3] studied the durability and water dispersion resistance of high-performance synchronous grouting materials, and concluded that the reduction of water-binder ratio or the reduction of bentonite content and the incorporation of a certain proportion of functional composite admixtures can significantly improve the durability and water dispersion resistance of grouting materials. Jiao [
4] analyzed the corrosion resistance index of grouting materials with different mix ratios. After 360 days of curing in saturated MgSO4 solution, grouting materials with a water cement ratio of 0.65 had a strength corrosion coefficient greater than 0.80, which had good corrosion resistance. According to Liu et al. [
5], gypsum affects the performance of soda residue-fly ash slurry under compound excitation. According to the findings, gypsum content positively correlated with strength loss during freeze-thaw cycles,and the strength loss was the most significant in the first five freeze-thaw cycles. Zhao et al. [
6] studied the water stability and frost resistance of new grouting materials for foamed lightweight soil. According to the results, the sample strength decreased with the increase of freeze-thaw cycles, and the larger the water-cement ratio, the weaker the frost resistance of the sample. Wang et al. [
7] studied the sulfate resistance of grouting concretion mixed with lead-zinc tailings. The results showed that the increase of sulfate concentration in the early stage of erosion was beneficial to the improvement of strength, but with the extension of soaking time, in general, the higher the concentration of sulfate, the more serious the strength degradation of concrete will be. Wang et al. [
8] studied the effect of metakaolin (MK) on the sulfate and sulfuric acid resistance of grouting repair materials. According to the results, grouting materials with 20% MK are highly durable against erosion caused by sulfates and sulfuric acids.
The above research results show that the research scholars have made a lot of research results on the resistance of grouting materials to sulfate attack and freeze-thaw damage, the performance of cement-based grouting materials under sulfate attack and freeze-thaw cycles has been little studied. Therefore, the freeze-thaw test of cement-based new grouting material mixed with ultra-fine slag powder and silica fume was carried out, and the performance change rule of the sample under different freeze-thaw cycles in aqueous solution and sulfate solution was studied, in order to provide some reference for practical engineering.
2. Materials and Methods
It is P•O42.5 ordinary Portland cement manufactured by Huainan City’s Bagongshan Cement Factory. Ultra-fine ground granulated blast furnace slag (UFS) is produced by Wuhan Huashen Intelligent Technology Co., Ltd. The specific surface area and density of UFS are 976m2/kg and 2.90g/cm3. Henan Yuanheng Environmental Protection Engineering Co., Ltd. produces silica fume (SF), which has a specific surface area of 24.5 m2/g and a density of 2.33 g/cm3. PCE is a polycarboxylate superplasticizer produced by Shanghai Kaiyuan Chemical Technology Co., Ltd., and the mixed water was ordinary tap water.
Figure 1 shows the raw material samples, and
Table 1 shows their chemical composition.
Through the previous orthogonal test and range analysis [
9], the ratio of new cement-based grouting slurry was optimized as water-cement ratio 0.70, UFS 20% (mass fraction), SF 12% (mass fraction) and PCE 0.16% (mass fraction). The performance test results of the optimized ratio slurry are shown in
Table 2.
Test pieces were made using the cement mortar mixer. Firstly, the well-weighed cement, UFS and SF were poured into the mixer, and the mixture was dry for 1-2 minutes until it was evenly mixed. Next, the water reducing agent and water were evenly mixed in the mixer and stirred for 2-3 minutes. The prepared slurry was poured into a three-link plastic mold with a side length of 70.7 mm. Without vibration, it was moved into a standard curing room and stood for 24 h before removing the mold. The sample after removing the mold was placed in the curing room. Frozen-thaw testing was conducted after 90 days of water curing.
Aqueous solution freeze-thaw and salt solution freeze-thaw tests were performed, and the salt solution was 15% Na2SO4. A freeze-thaw cycle test was performed using the slow freezing method of the frost resistance test in the “Test method for long-term performance and durability of ordinary concrete.” (GB/T 50082-2009) [
10]. The test instrument was STDW-40D high and low temperature test chamber. According to the specification requirements, the samples were tested every 25 cycles. Due to the small sample size, the frost resistance of the paste was slightly poor, so the number of freeze-thaw cycles was set at 0, 5, 15, 30 and 50. In each freeze-thaw cycle, a sample was kept at -20 degrees Celsius for 5 hours in a high temperature and low temperature box, then taken out and melted at 20 degrees Celsius for 7 hours at room temperature , that is, each cycle was 12h; after reaching the specified number of times, the mass, compressive strength and ultrasonic velocity of the sample were tested, and the mass loss rate, strength loss rate and relative dynamic elastic modulus of the sample were calculated to judge the frost resistance of the new grouting material.
3. Results
3.1. Appearance damage of specimens
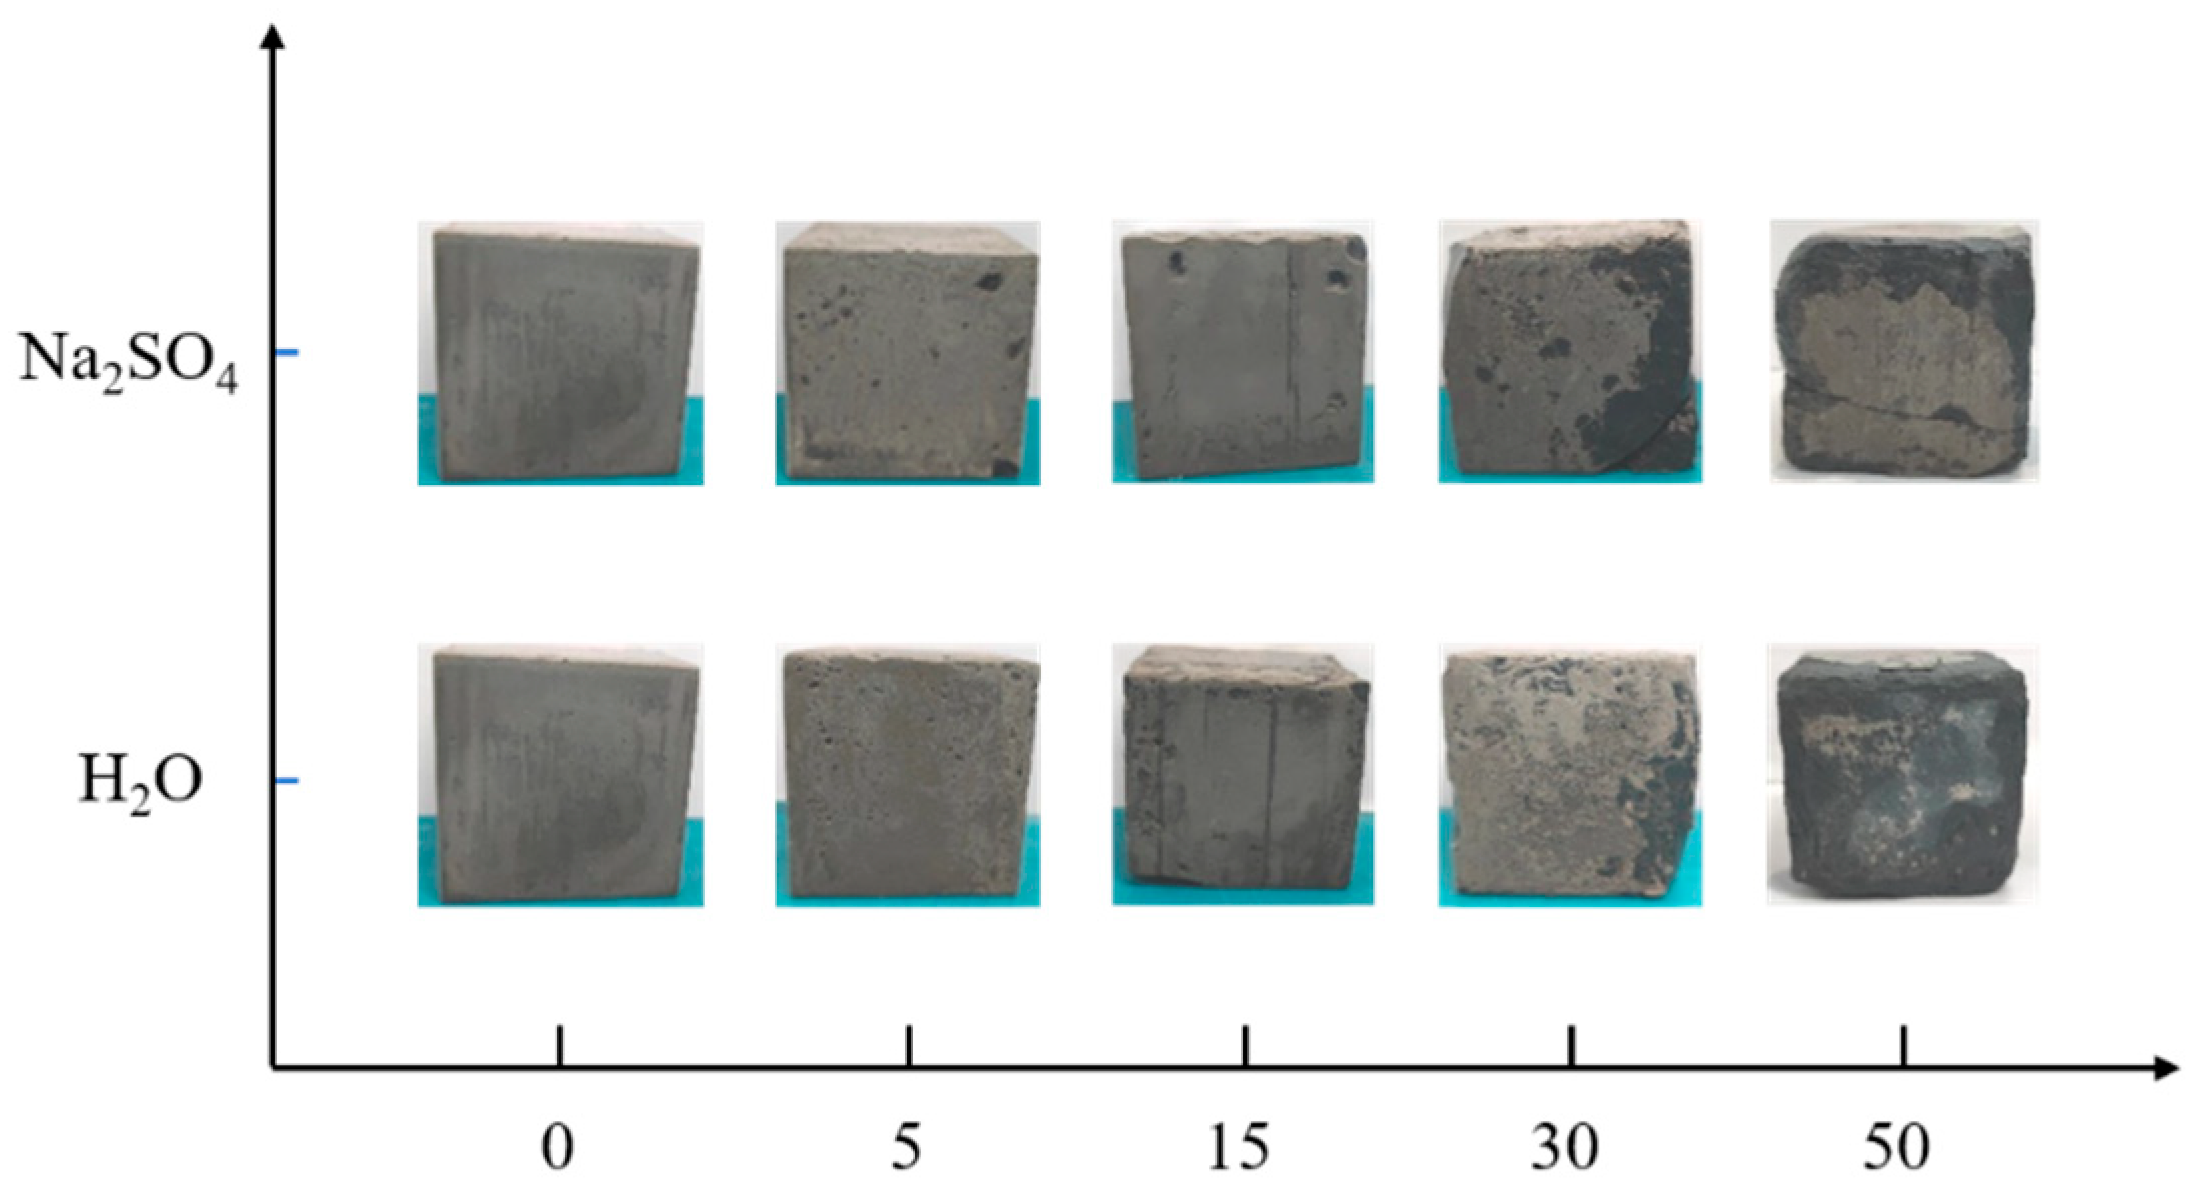
According to
Figure 2, the sample experience different freeze-thaw cycles in aqueous solution and 15% Na
2SO
4 solution resulted in different appearance damages.
Figure 2 shows that before the freeze-thaw cycle reaches 30 cycles, the appearance of the samples in both aqueous solution and Na
2SO
4 solution remains basically intact, and the surface of the sample is intact without damage with a small amount of pitting and holes. Upon reaching 30 freeze-thaw cycles, the surface pits of the sample increase and the local surface layer undergoes peeling, accompanied by an increase in slag formation on the surface of the sample in Na
2SO
4 solution, and the emergence of cracks at the corners. Upon reaching 50 freeze-thaw cycles, the corners of the sample immersed in Na
2SO
4 solution exhibit a highly uniform corrosion, accompanied by the emergence of a penetrating crack on the surface. The surface of the sample in the aqueous solution is peeled off seriously, and the internal aggregate exposure is more obvious, but the original edges and corners are still maintained, and no cracks appear on the surface.
3.2. Mass loss rate
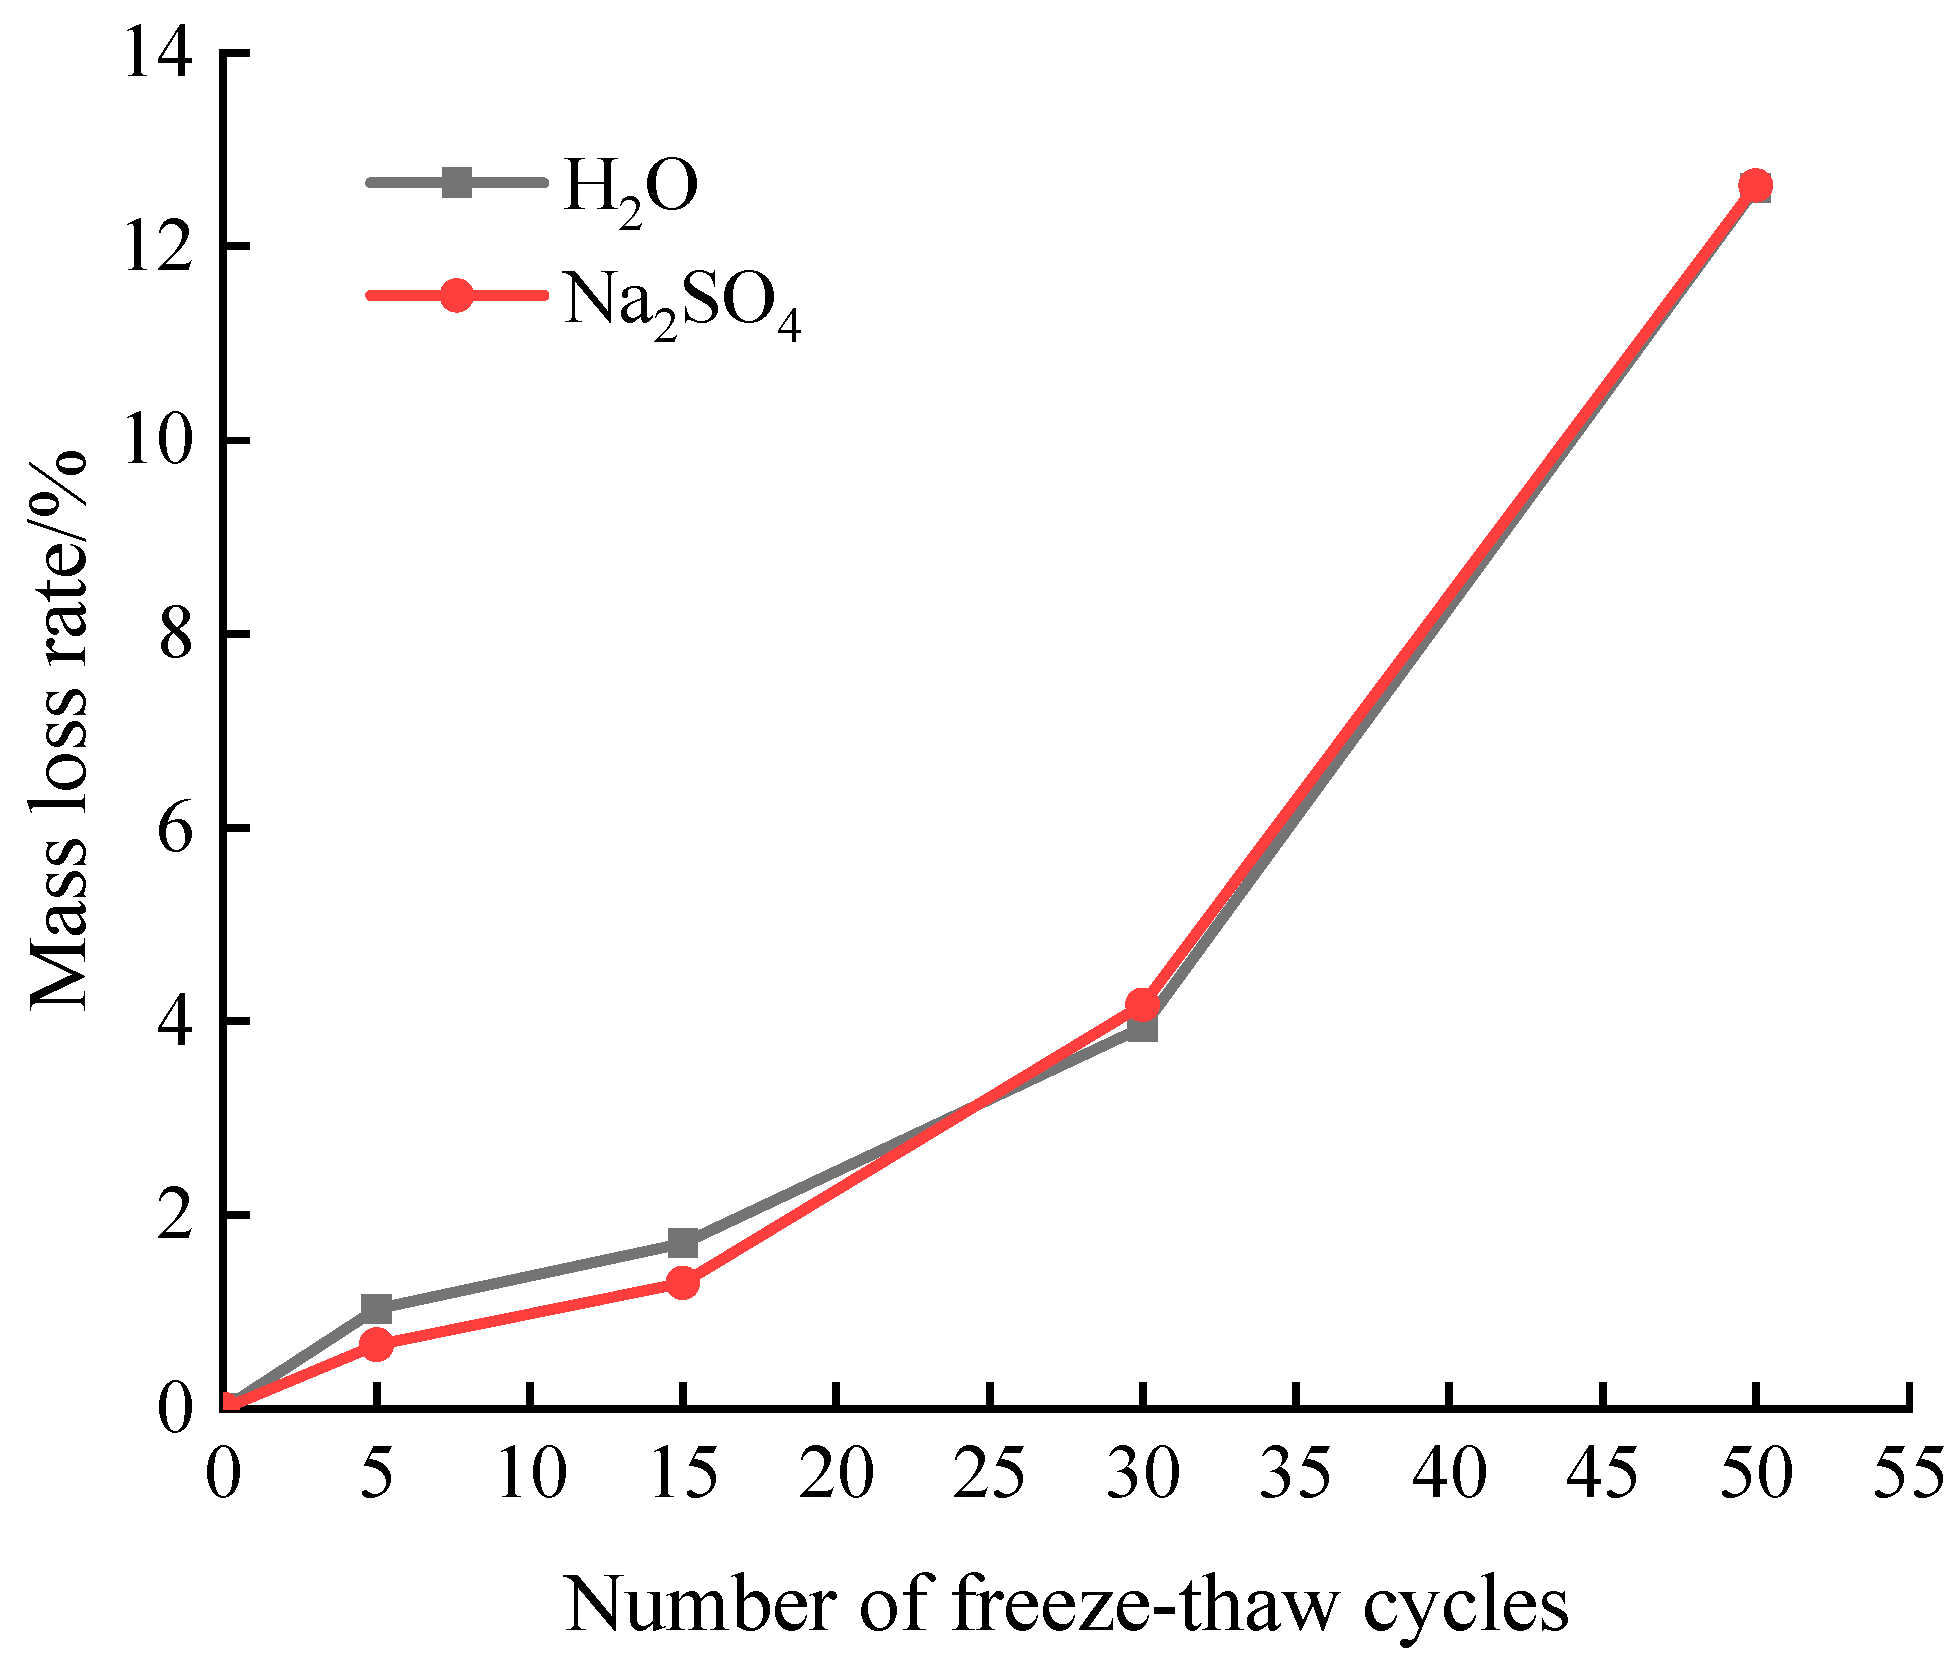
Figure 3 displays the variation trend in sample mass loss following freeze-thaw damage in both aqueous and 15% Na
2SO
4 solutions. The formula used for determining the rate of mass loss is indicated as follows:
The formula comprises three variables: ,which denotes the mass loss rate of the specimen following i freeze-thaw cycles; , which represents the mass of the specimen prior to undergoing freeze-thaw cycles; and, which signifies the mass of the specimen after i freeze-thaw cycles.
The data presented in
Figure 3 indicates a positive correlation between the number of freeze-thaw cycles and the magnitude of mass loss in the sample. When the sample undergoes 30 freeze-thaw cycles, its mass loss rate is found to be lower in Na2SO4 solution compared to that in an aqueous solution. The presence of sulfate is responsible for the occurrence of freeze-thaw damage, as it lowers the freezing point of water to a certain degree, enhances the compressibility of ice, and restrains the freeze-thaw cycle [
11]. When the number of freeze-thaw cycles reached 30, the samples experienced a mass loss rate of 3.94% and 4.17% in aqueous solution and Na2SO4 solution, respectively. After undergoing 30 freeze-thaw cycles, the sample exhibits an increasing mass loss rate in Na2SO4 solution when compared to the damage caused by freeze-thaw in aqueous solution. This is because the high sulfate concentration will greatly shorten the time of freeze-thaw damage inhibition of the sample [
12]. The surface of the sample shows cracks due to the freeze-thaw cycle and sulfate erosion. Additionally, the edges and corners are corroded smoothly, with a higher quantity of slag present. As a result, there is a decrease in mass and an increase in the rate of mass loss. After 50 freeze-thaw cycles, the specimens reached a mass loss rate of 12.6% in aqueous freeze-thaw and 12.63% in combined freeze-thaw and Na2SO4 solution erosion, both with more than 5%, and the freeze-thaw cycle test was completed.
3.3. Relative dynamic modulus of elasticity
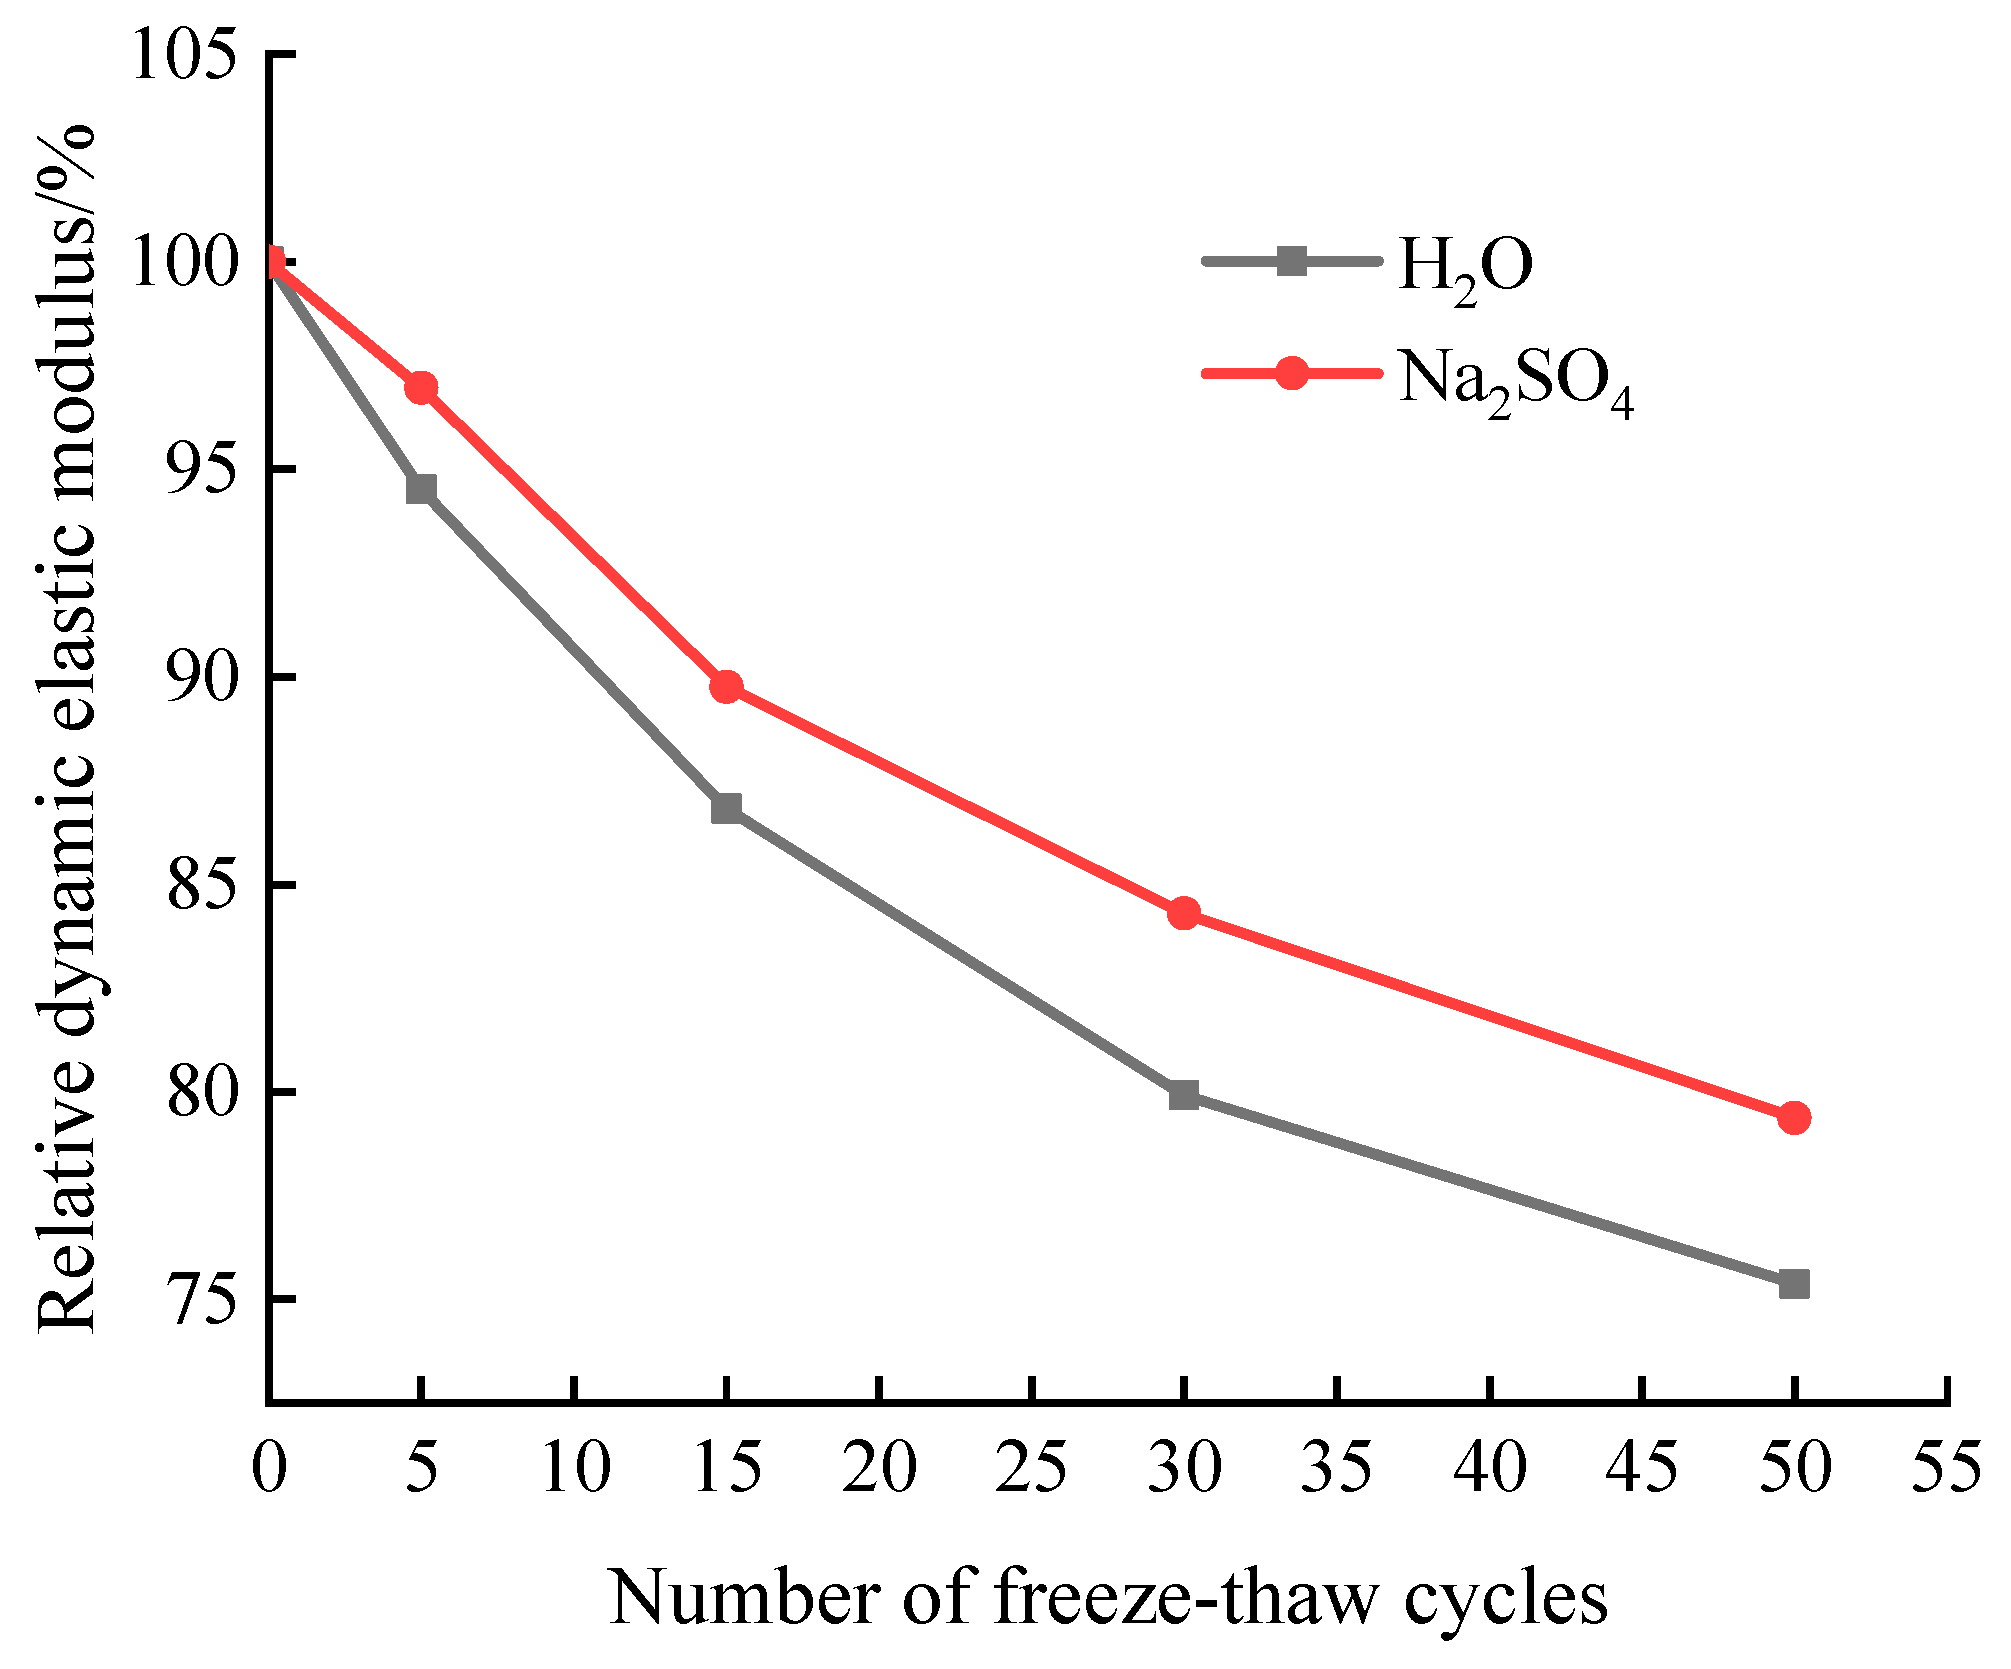
Figure 4 shows the variation pattern of the relative dynamic elastic modulus of the specimen in aqueous solution and 15% Na2SO4 solution. The relative dynamic elastic modulus
[
11] is calculated as follows:
In the formula: V, T, t represent ultrasonic sound velocity (km/s), ultrasonic sound time (us) and freeze-thaw times (times) respectively.
Figure 4 shows that the sample's relative dynamic elastic modulus decreased after being subjected to freeze-thaw cycles in both aqueous solution and Na
2SO
4 solution, with the relative dynamic elastic modulus in the latter being higher. The explanation is that as SO
42- ions penetrate the sample's interior and react with alkaline materials like Ca(OH)
2 created during cement hydration, the resulting erosion products fill the sample's internal pores and increase its density [
13]. The samples’ relative dynamic elastic moduli in aqueous solution and Na
2SO
4 solution were 79.92% and 84.3%, respectively, and the drop was 20.09% and 15.7%, respectively, after the freeze-thaw cycles reached 30. The test is stopped after 50 freeze-thaw cycles since the sample's mass loss rate is greater than 5%. The sample's relative dynamic elastic modulus is currently above 75% of the starting value at 75.38% and 79.38%, respectively. In other words, the erosion damage to the material sample's surface is more severe than the damage to the internal structure. It is evident that the influence of the freeze-thaw cycle on the quality of cement-based grouting material is larger than that on the relative dynamic elastic modulus.
3.4. Compressive strength loss rate
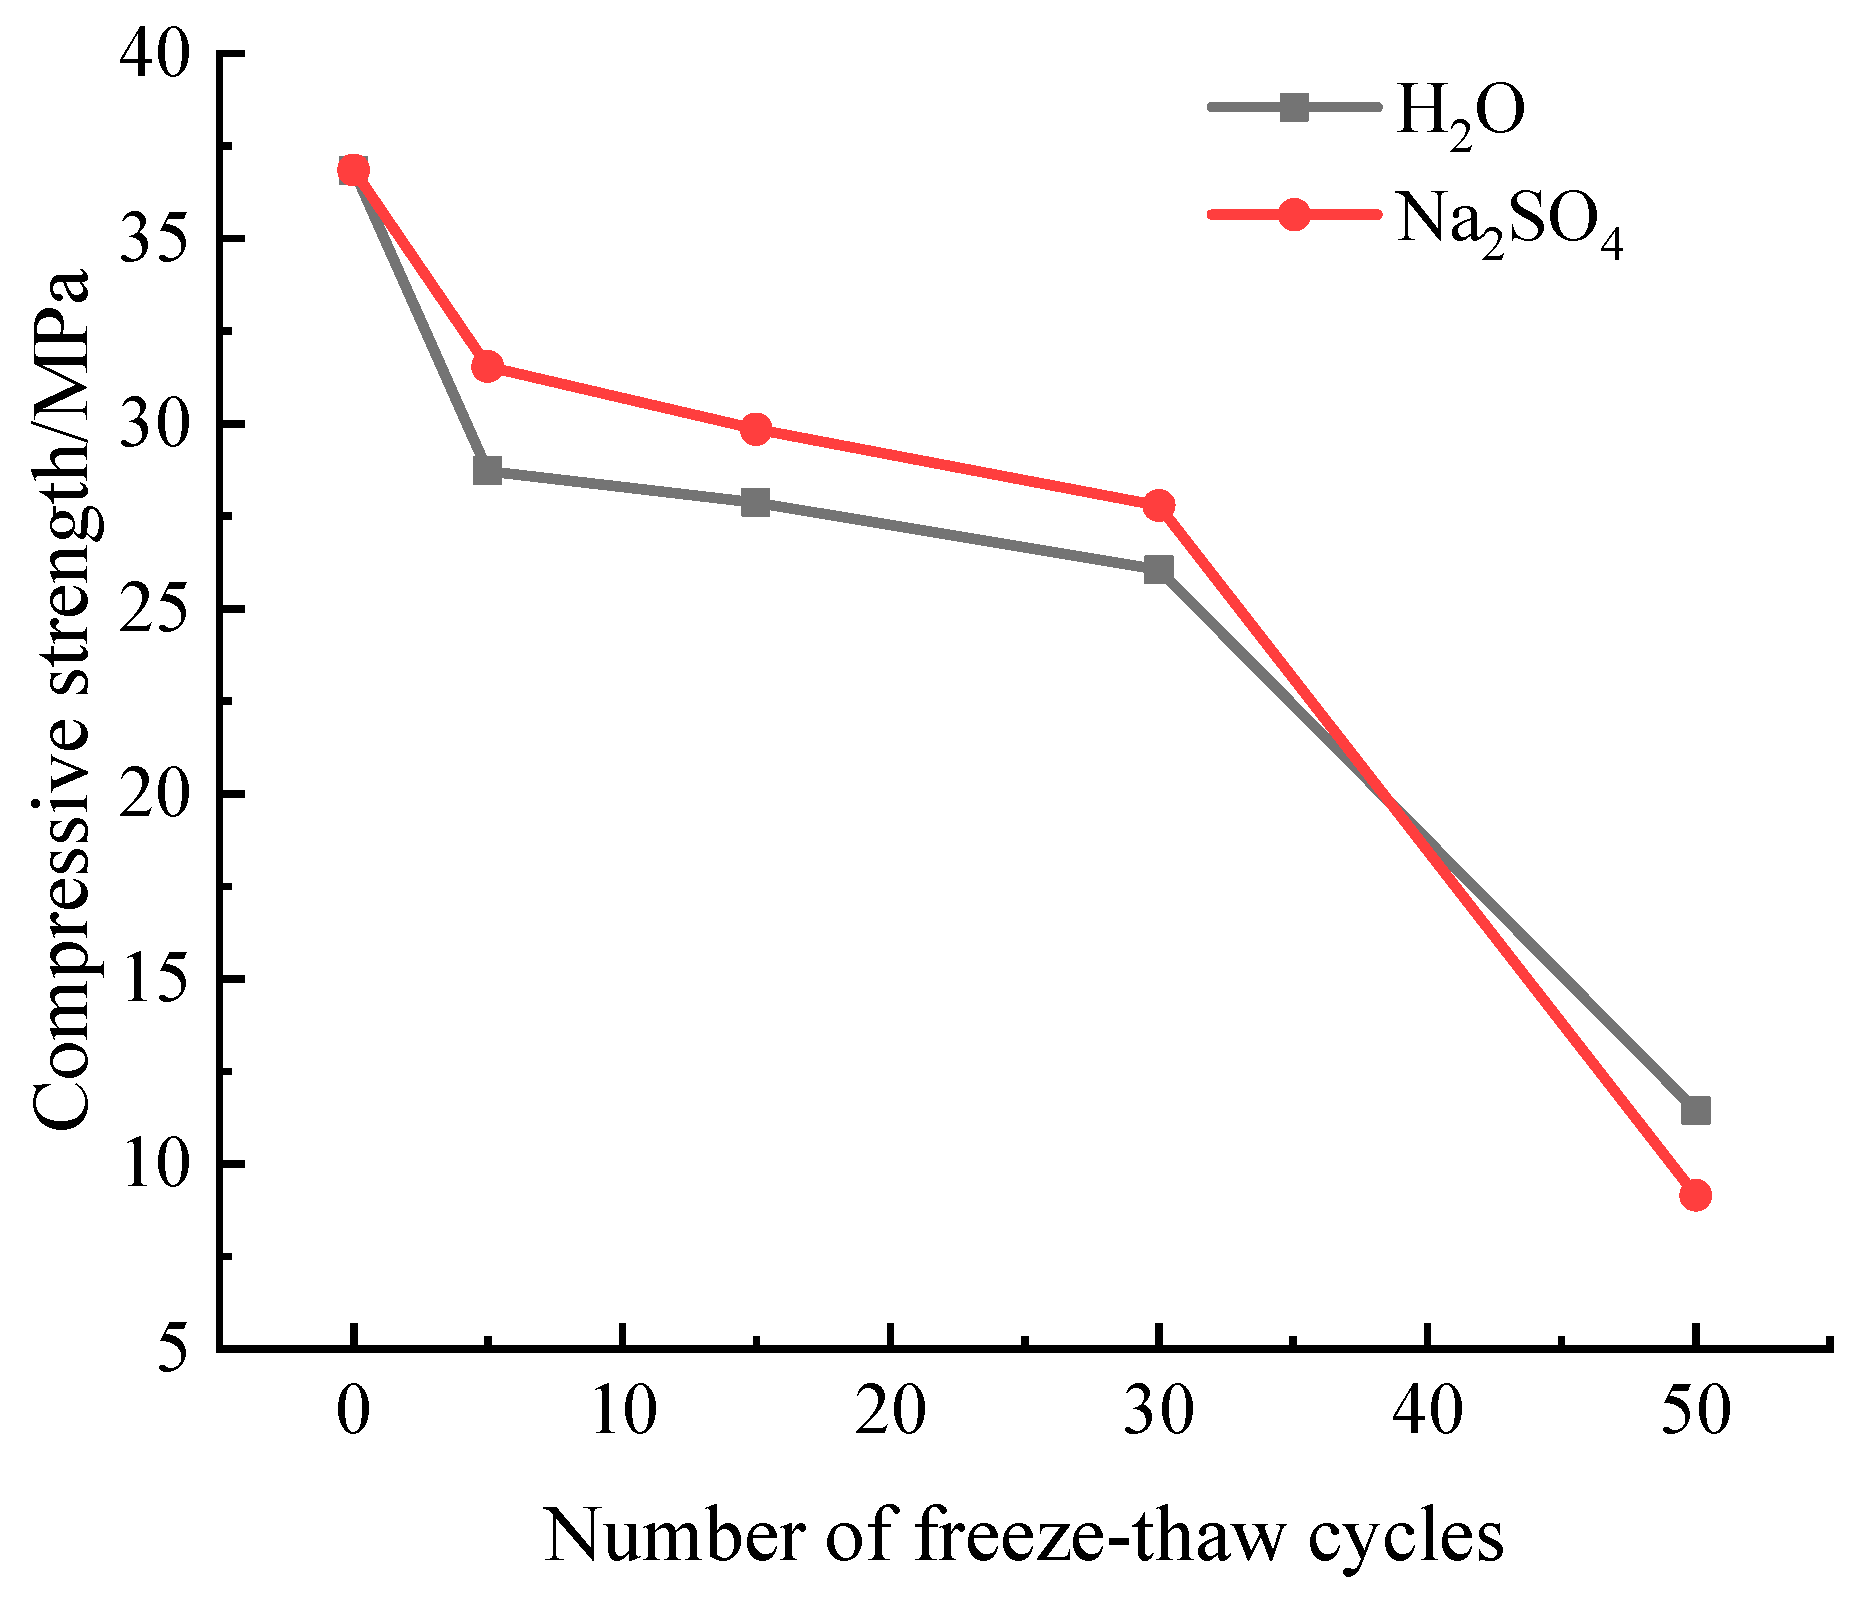
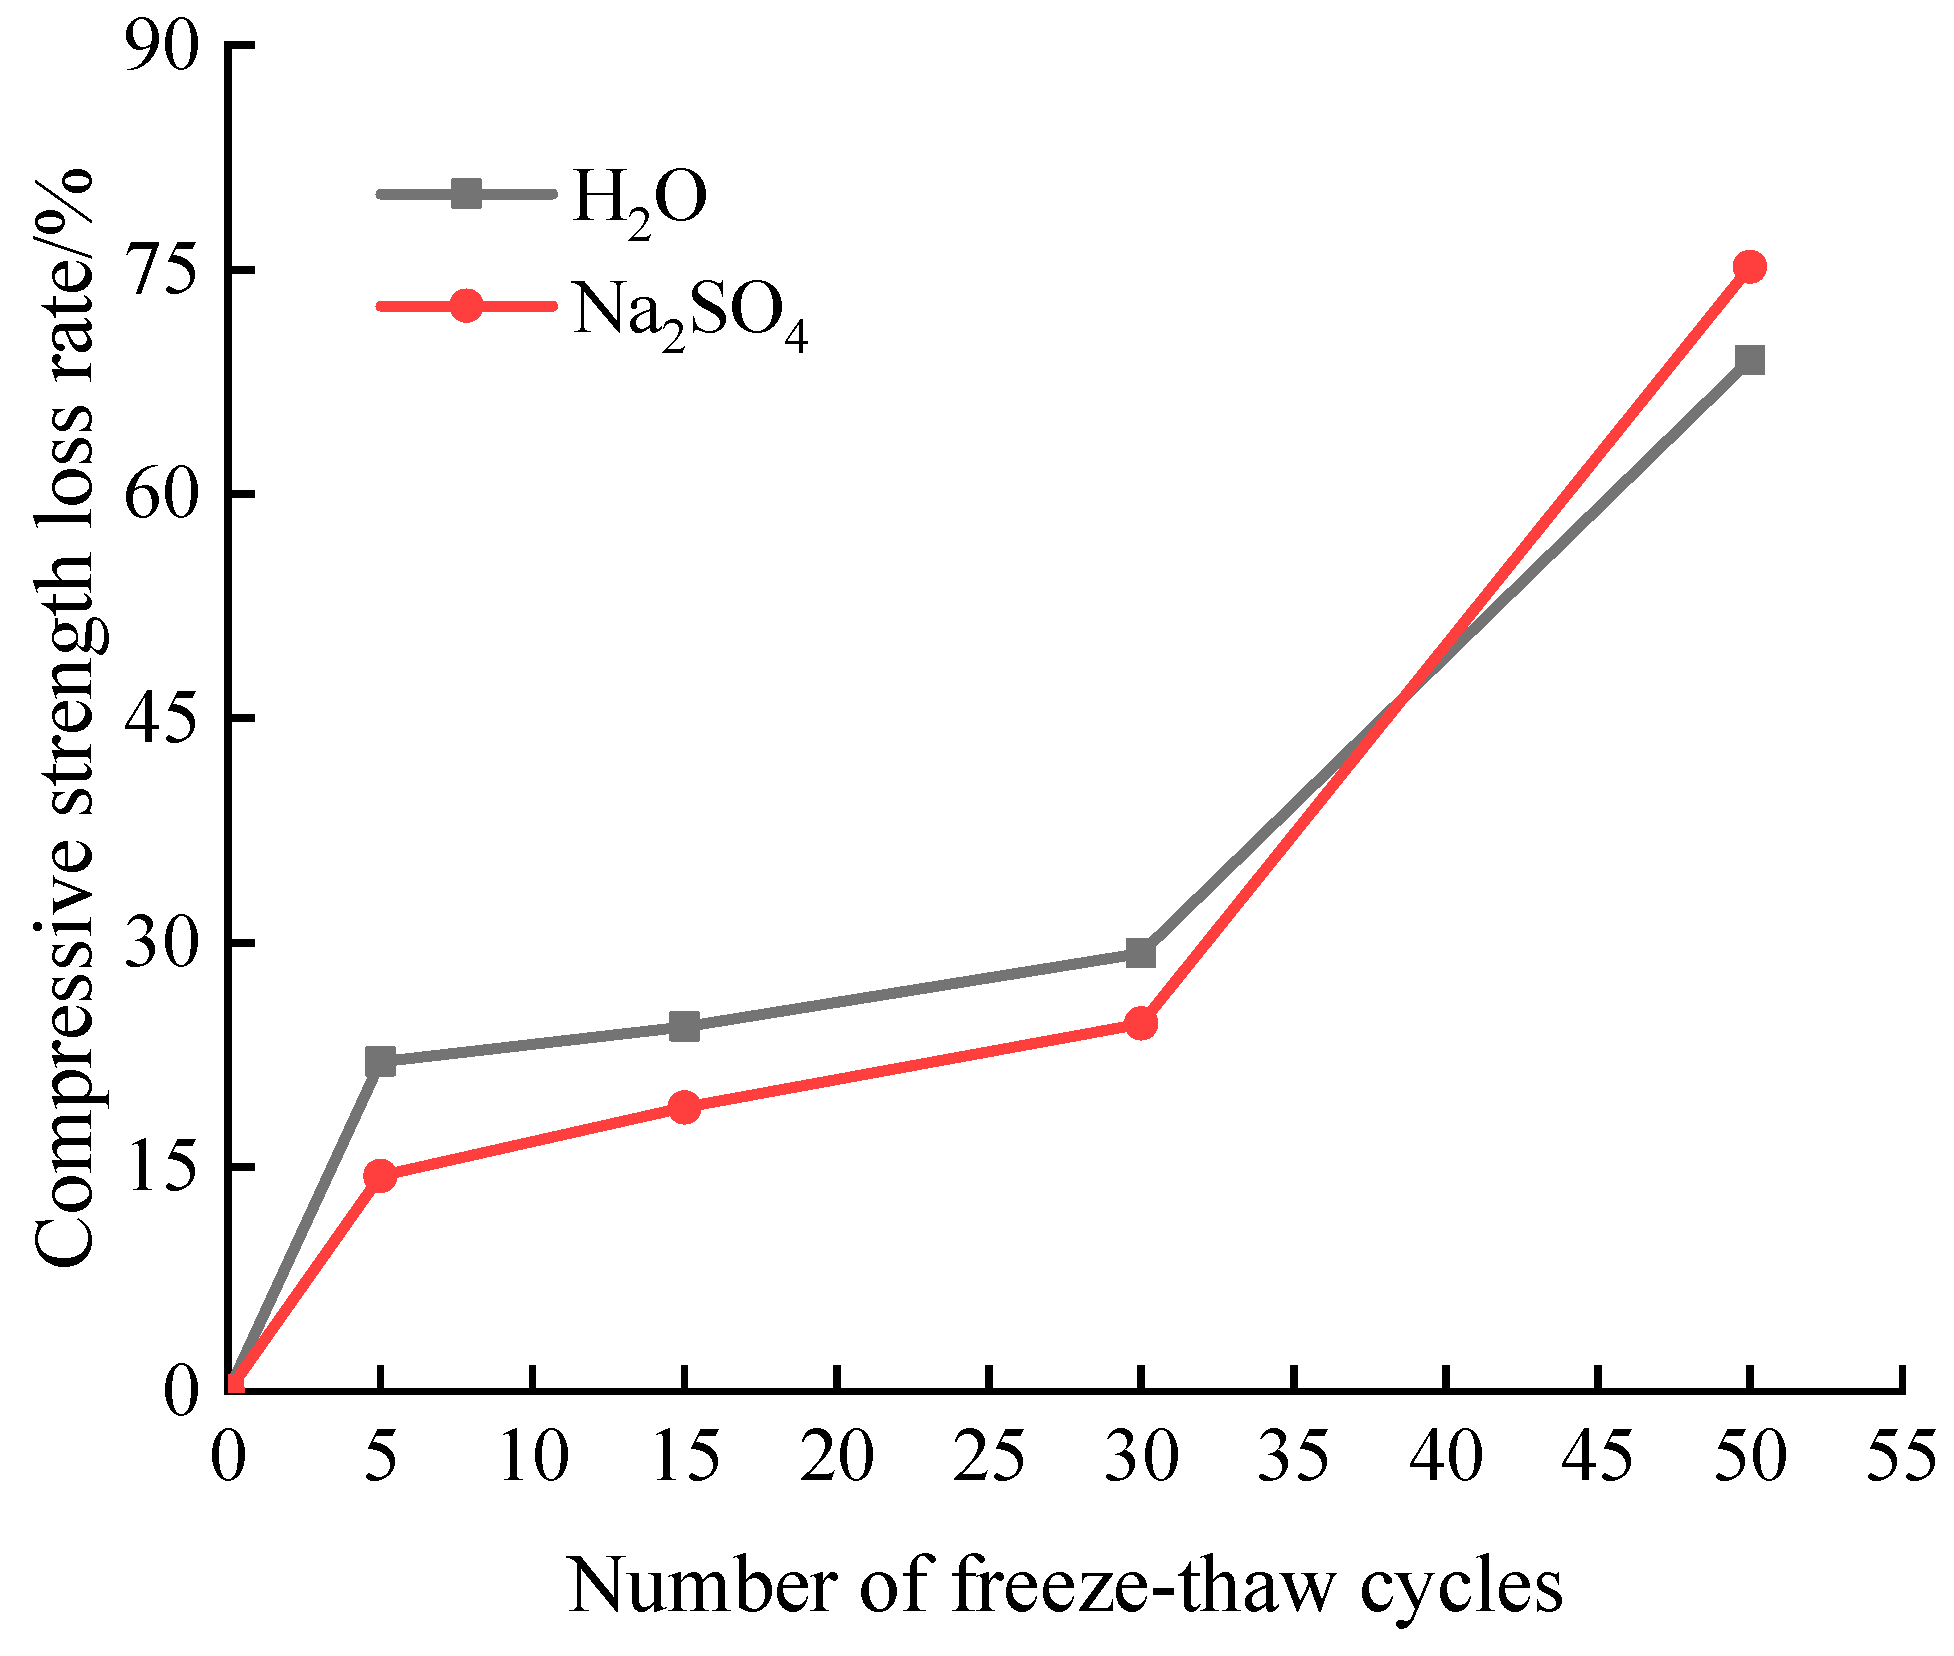
Figure 5 illustrates a change law for the loss of compressive strength of samples after numerous freeze-thaw cycles in aqueous solution and Na
2SO
4 solution.
Figure 5 demonstrates how the sample’s compressive strength decreases as the number of freeze-thaw cycles rises. Before the freeze-thaw cycle has taken place 30 times, the sample’s compressive strength in Na
2SO
4 solution is greater than it is in aqueous solution. After 30 freeze-thaw cycles, the sample’s compressive strength significantly decreases. At a factor of 50, the sample’s compressive strength in aqueous solution and a solution of sodium hydroxide, or Na
2SO
4, falls to 11.45 MPa and 9.15 MPa, respectively.
The change rule for samples' loss of compressive strength following various freeze-thaw cycles in two solutions is shown in
Figure 6. The following is the calculation formula for compressive strength loss rate
[
10]:
In the formula: , are expressed as the compressive strength before the freeze-thaw cycle and the compressive strength after n freeze-thaw cycles.
Figure 6 shows that as the number of freeze-thaw cycles grows, so does the sample’s rate of loss of compressive strength. The sample’s compressive strength loss rate in the aqueous solution is higher than in the Na
2SO
4 solution when the freeze-thaw cycle reaches 30 times. After 30 freeze-thaw cycles, the rate of loss of compressive strength reverses, and the reason is that the presence of sulfate lowers the freezing point of water, makes ice more compressible, and guards against sample interior damage. Additionally, sulfate ions will interact with cement hydration products, and the resulting erosion products will fill the material’s interior pores and increase its density. As a result, the sample in Na
2SO
4 solution loses compressive strength at a slower pace than it does in aqueous solution. However, with the increase of the number of freeze-thaw cycles, the expansion stress caused by sulfate attack products and the freeze-thaw frost heave jointly aggravate the internal deterioration of the material, resulting in an accelerated decrease in compressive strength [
14]. After 50 freeze-thaw cycles, the sample’s compressive strength loss rate was 68.93% for the sample in aqueous solution and 75.17% for the sample in Na
2SO
4 solution. This finding shows that the combination of sulfate and freeze-thaw at the test’s later stage deepened the degree of internal damage to the grouting material.
3.5. Uniaxial compression stress-strain curve
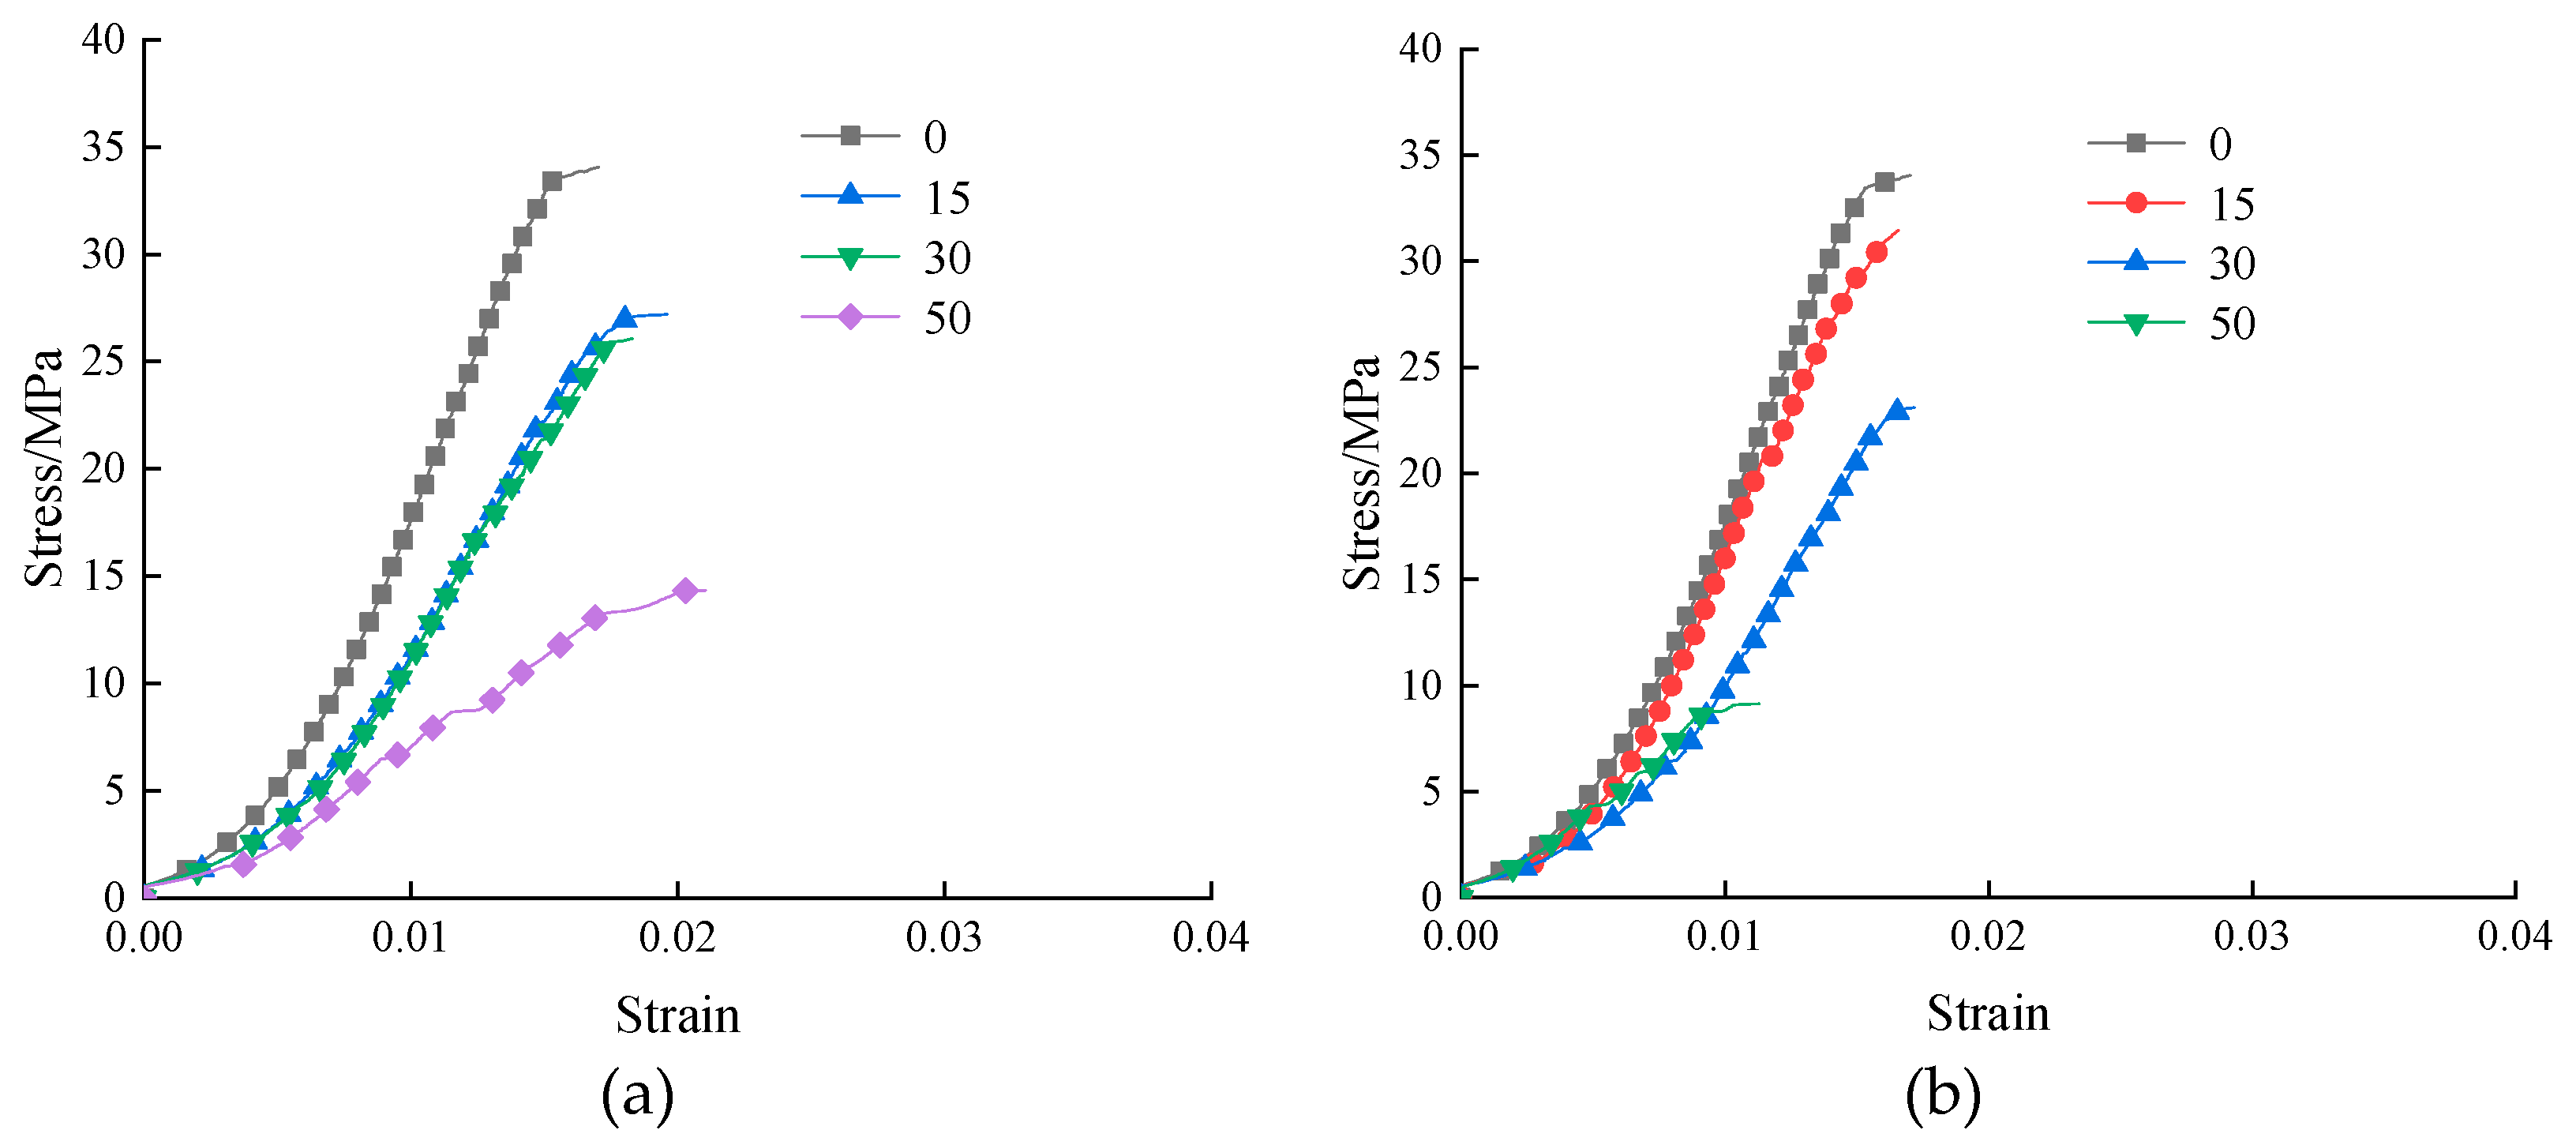
The sample’s uniaxial compressive stress-strain curve as a result of the freezing and thawing of two solutions is shown in
Figure 7. As can be observed, the stress-strain curve of the slurry stone body fundamentally changes in the same way following various freeze-thaw durations in aqueous solution and Na
2SO
4 solution. The stress-strain curve’s peak stress point gradually shifts down as the number of freeze-thaw cycles rises, and the slope of the increasing section eventually flattens out. The strain in the aqueous solution that corresponds to the sample’s peak stress is greater than it is in the Na
2SO
4 solution. The sulfate will react with the products of cement hydration, and the resulting erosion products will fill the pores and make the structure more dense. Because the sample has more holes than usual in an aqueous solution, even a tiny amount of stress will cause significant deformation.
4. Microstructure analysis
4.1. XRD analysis
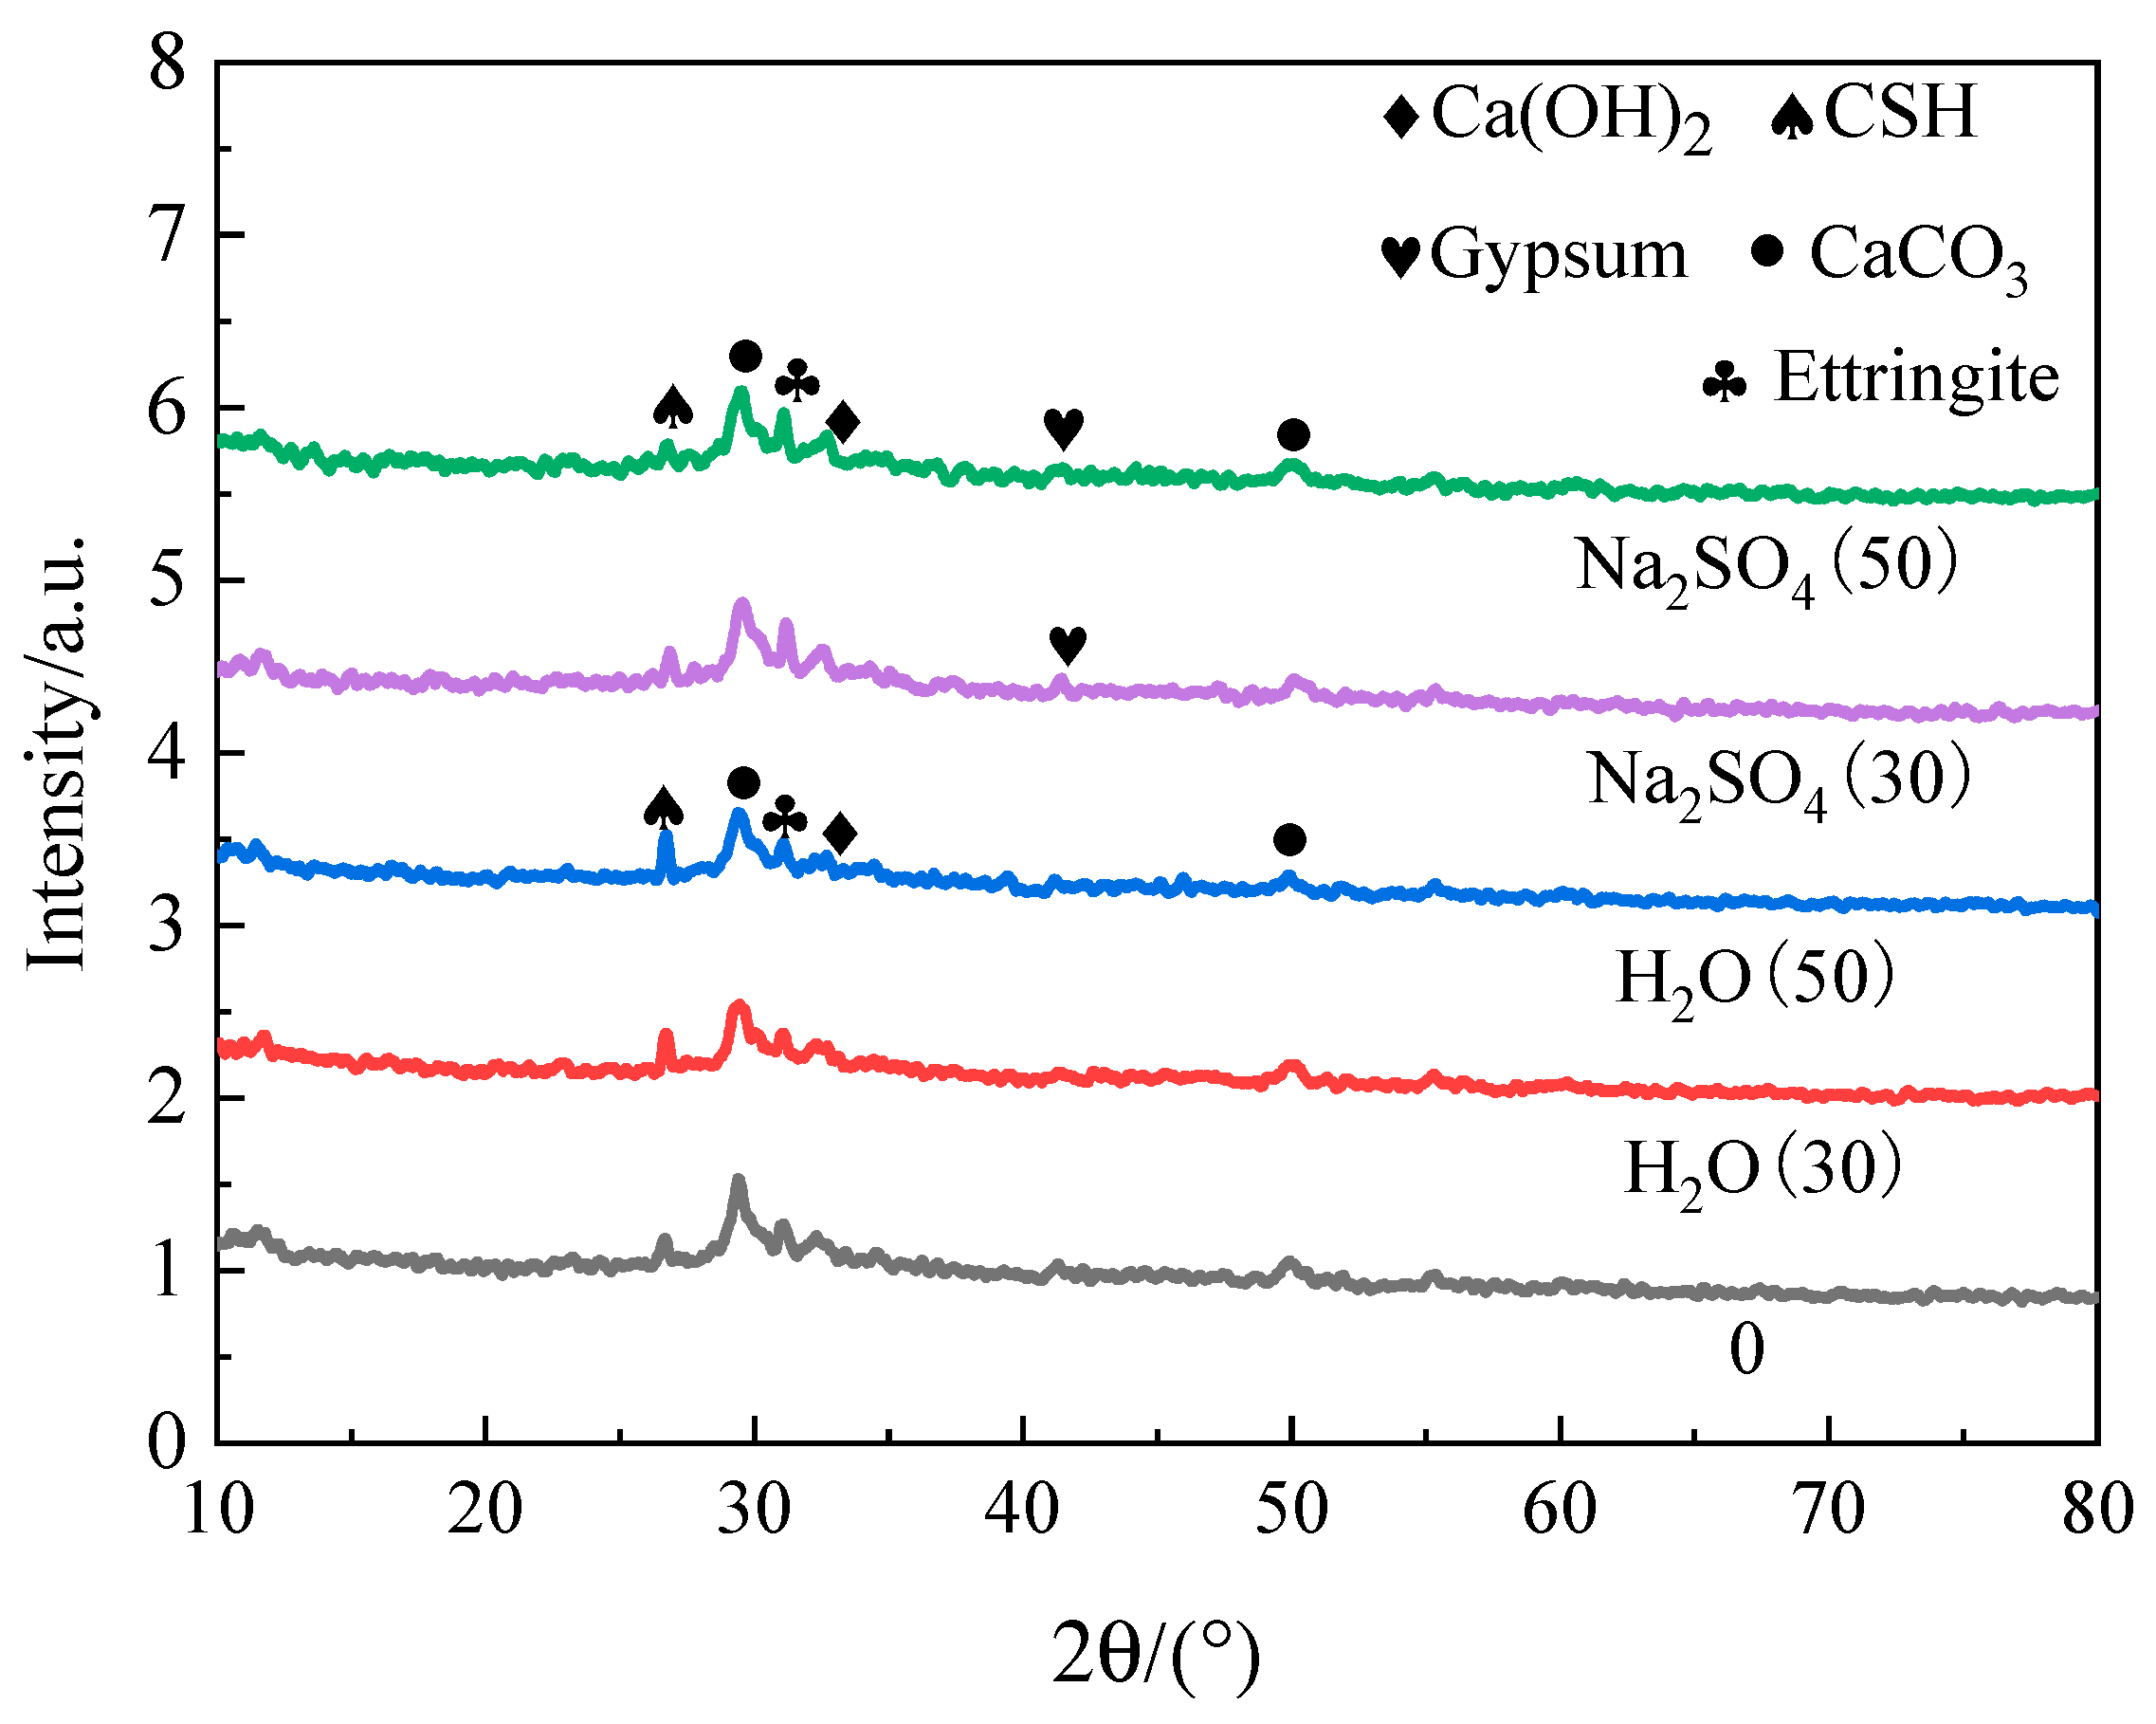
The XRD patterns of the samples under two solutions' freeze-thaw cycles are shown in
Figure 8. Following freezing and thawing in aqueous solution,
Figure 8 shows that the sample’s primary hydration products are Ca(OH)
2, AFt (ettringite) crystal, C-S-H gel, and CaCO
3. After being frozen and thawed in Na2SO4 solution, the sample's primary hydration products are almost identical to those of the aqueous solution. Compared with the freezing and thawing of aqueous solution, the AFt diffraction peak is enhanced, the C-S-H diffraction peak is significantly reduced, and the diffraction peak of gypsum is produced. The reason is that SO42-can enter the interior through the pores on the surface of the sample and form AFt crystal with Ca(OH)
2 the aluminum phase hydration products in materials such as cement. It also reacts with to form gypsum [
15], but it will lead to the decomposition of C-S-H and the dissolution of calcium ions [
16].
4.2. TGA analysis
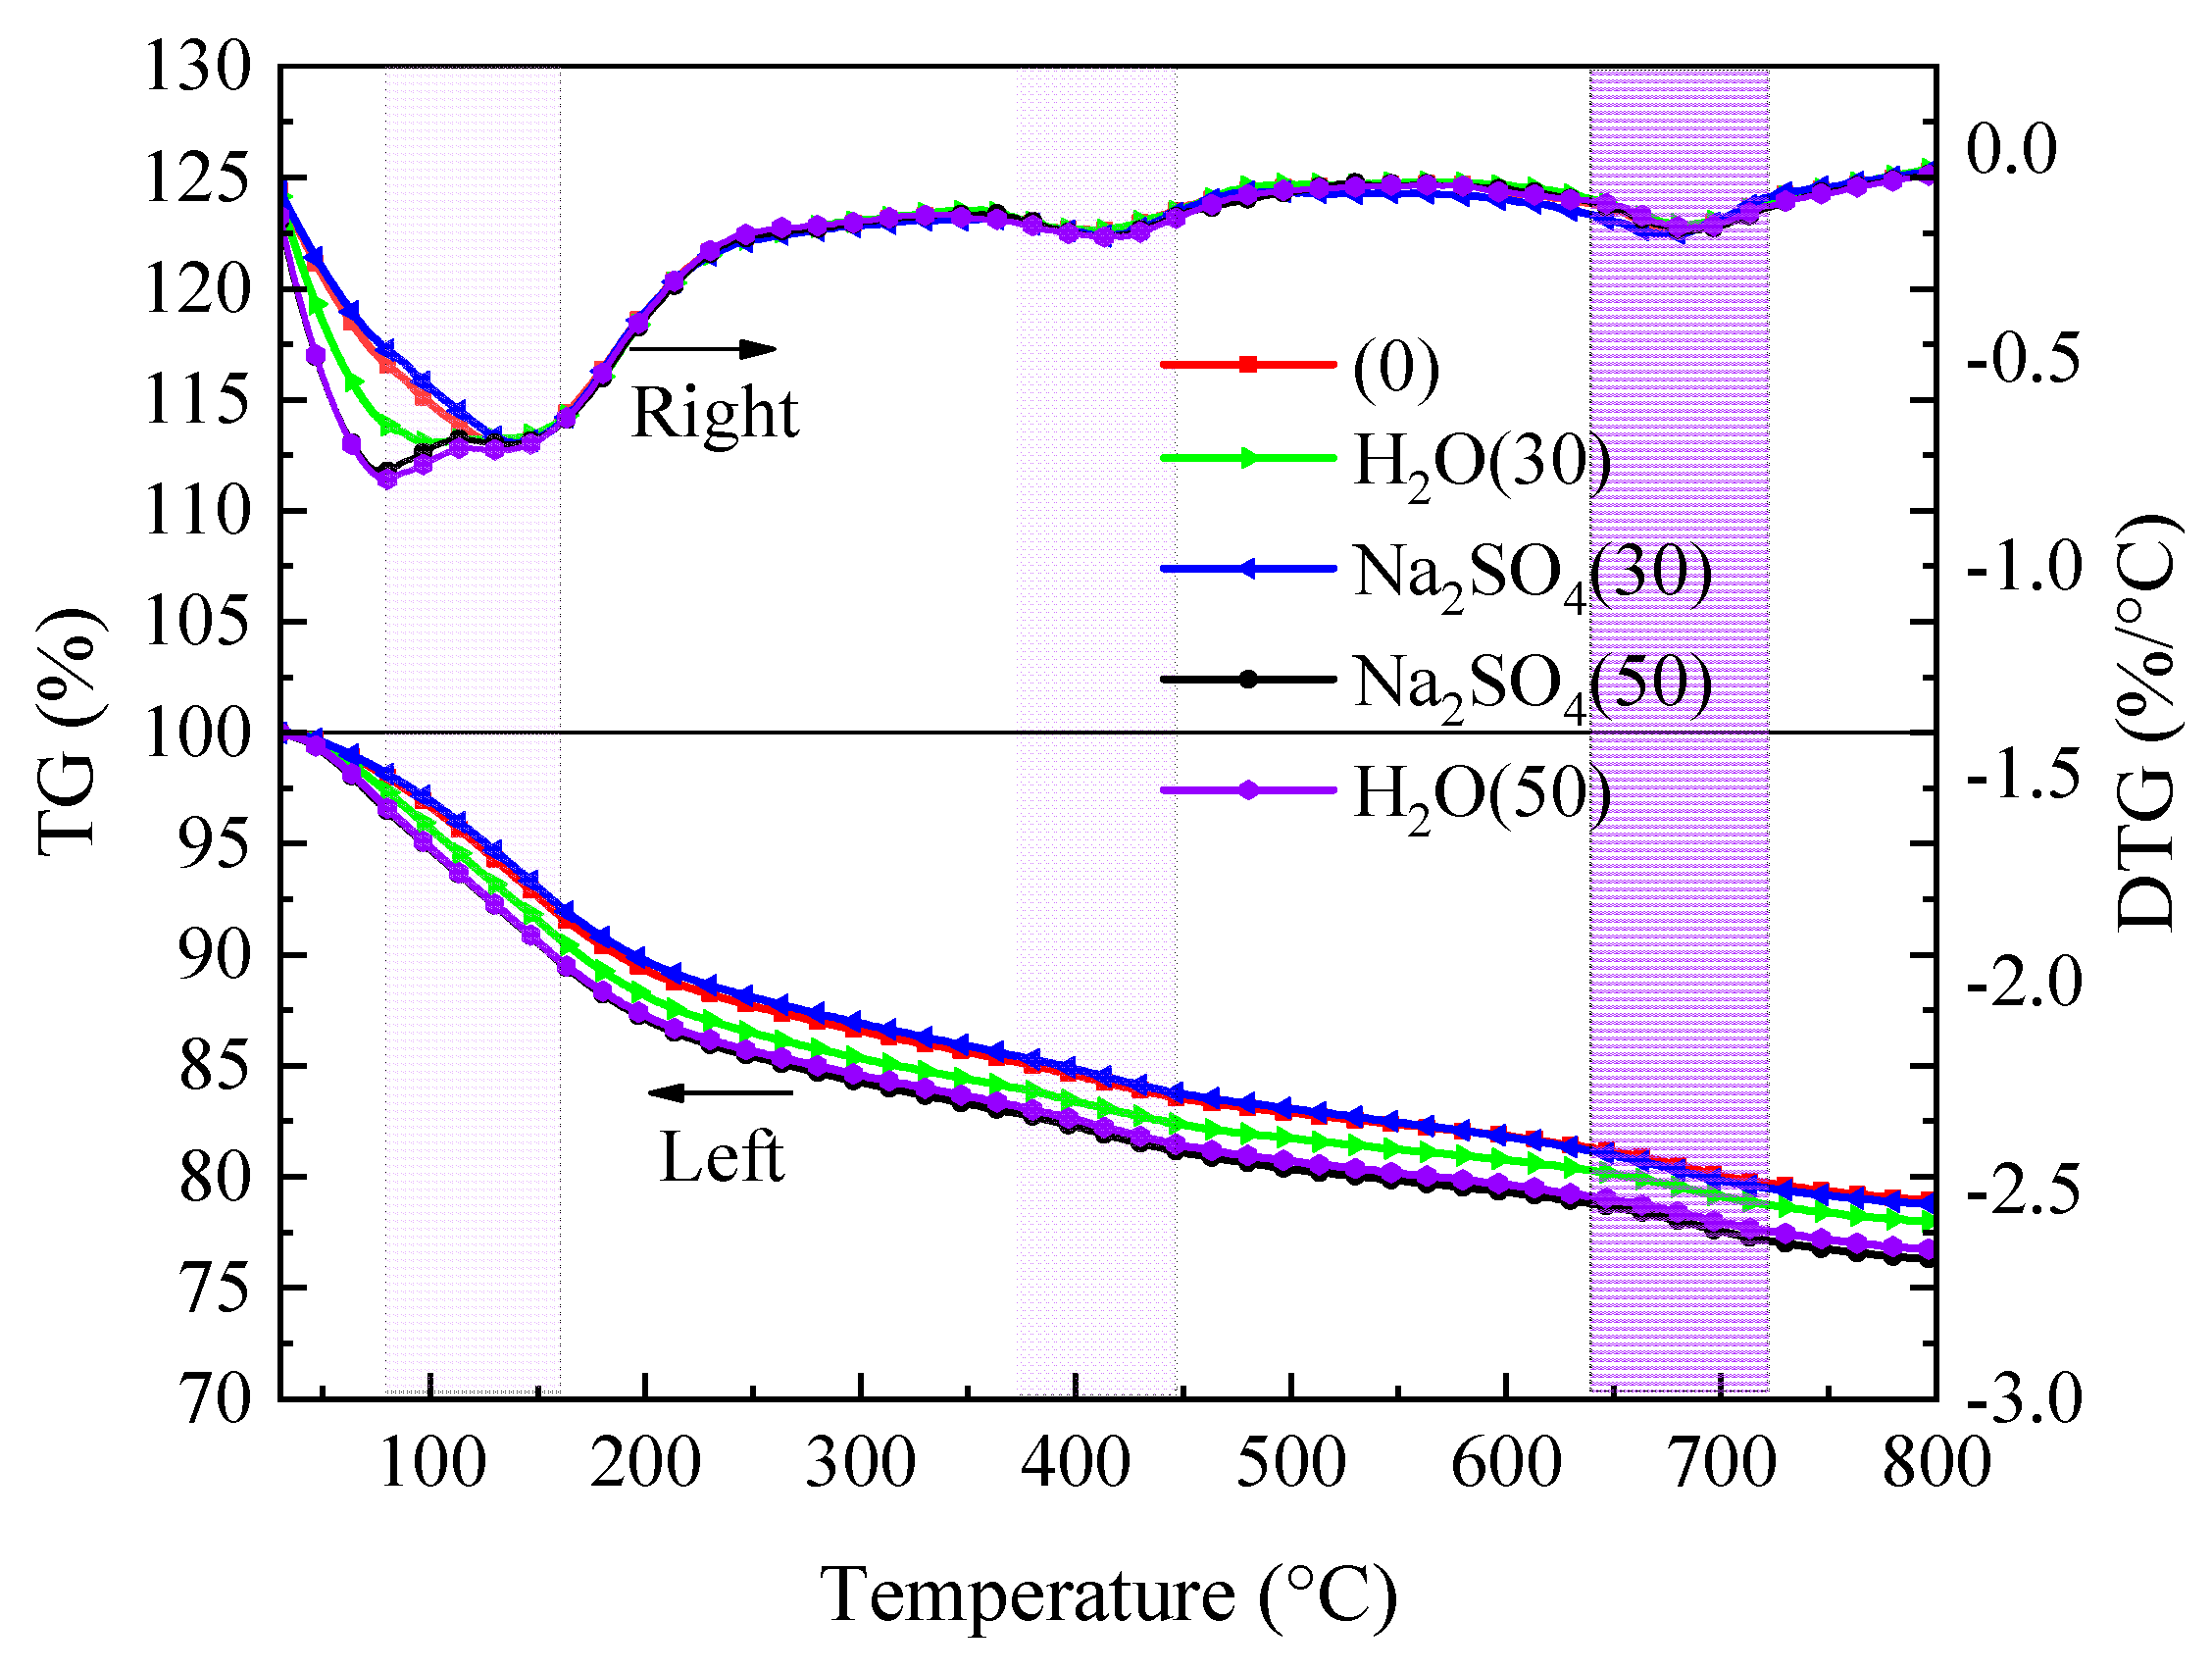
The results of the samples’ TG-DTG analysis following freeze-thaw cycles in aqueous solution and Na
2SO
4 solution are shown in
Figure 9. According to
Figure 9, the dehydration of AFt, C-S-H gel, and free water causes the DTG curve to exhibit a significant peak at about 100°C. [
17,
18]. Due mostly to the dehydration of Ca(OH)
2 [
19] and CaCO
3 [
20], there are two peaks at roughly 400 °C and 700 °C. The TG curve demonstrates that the sample’s mass loss percentage rises as temperature rises, the mass loss of the sample in the aqueous solution rises with the number of freeze-thaw cycles as compared to before freezing and thawing. The TG curve almost correlates with the mass loss of 30 freeze-thaw cycles in Na2SO4 solution before freezing and thawing, and the mass loss of 50 freeze-thaw cycles approaches the maximum. This is due to the fact that initially only a small quantity of AFt crystals and gypsum are created when SO
42- ions interact with the cement hydration product Ca(OH)
2, but later on, a substantial amount of AFt crystals and gypsum are produced. The mass loss of the sample in aqueous solution and Na
2SO
4 solution after exposure to 800 °C was 23.28% and 23.73%, respectively.
4.3. SEM analysis
The samples freeze-thawed for 30 times and 50 times in aqueous solution and Na
2SO
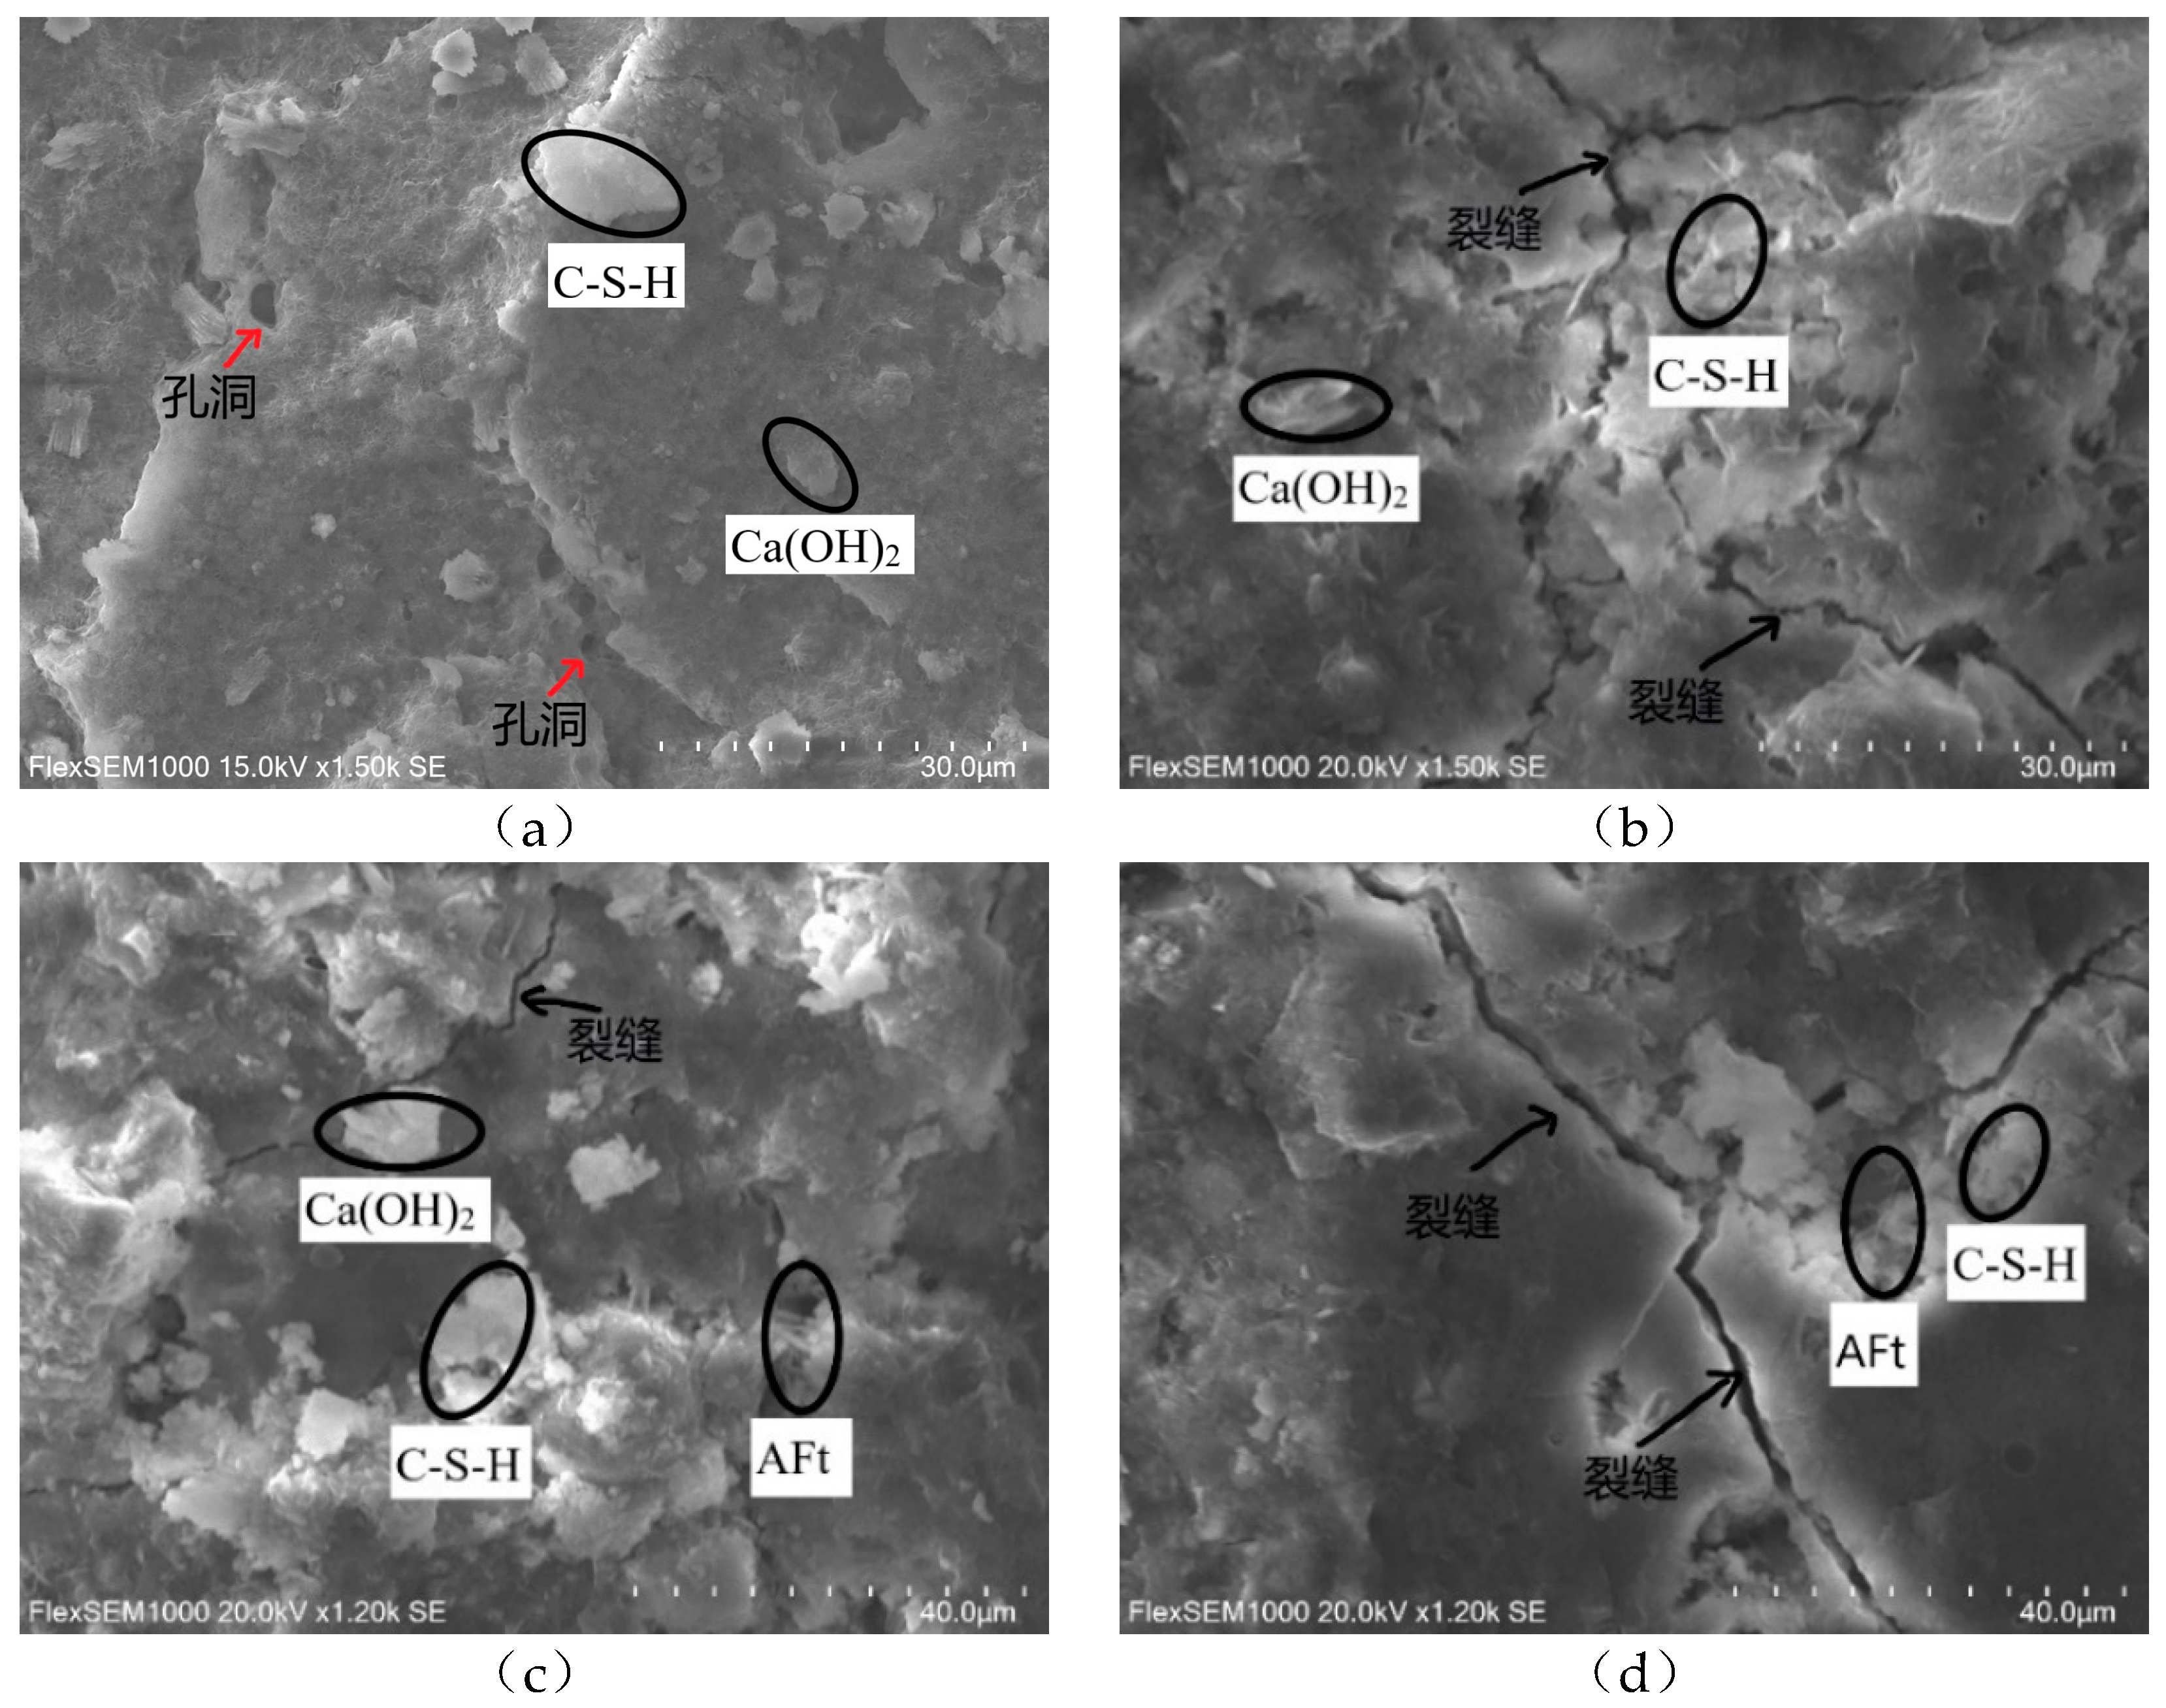
4 solution were selected for SEM test. The test photographs are shown in
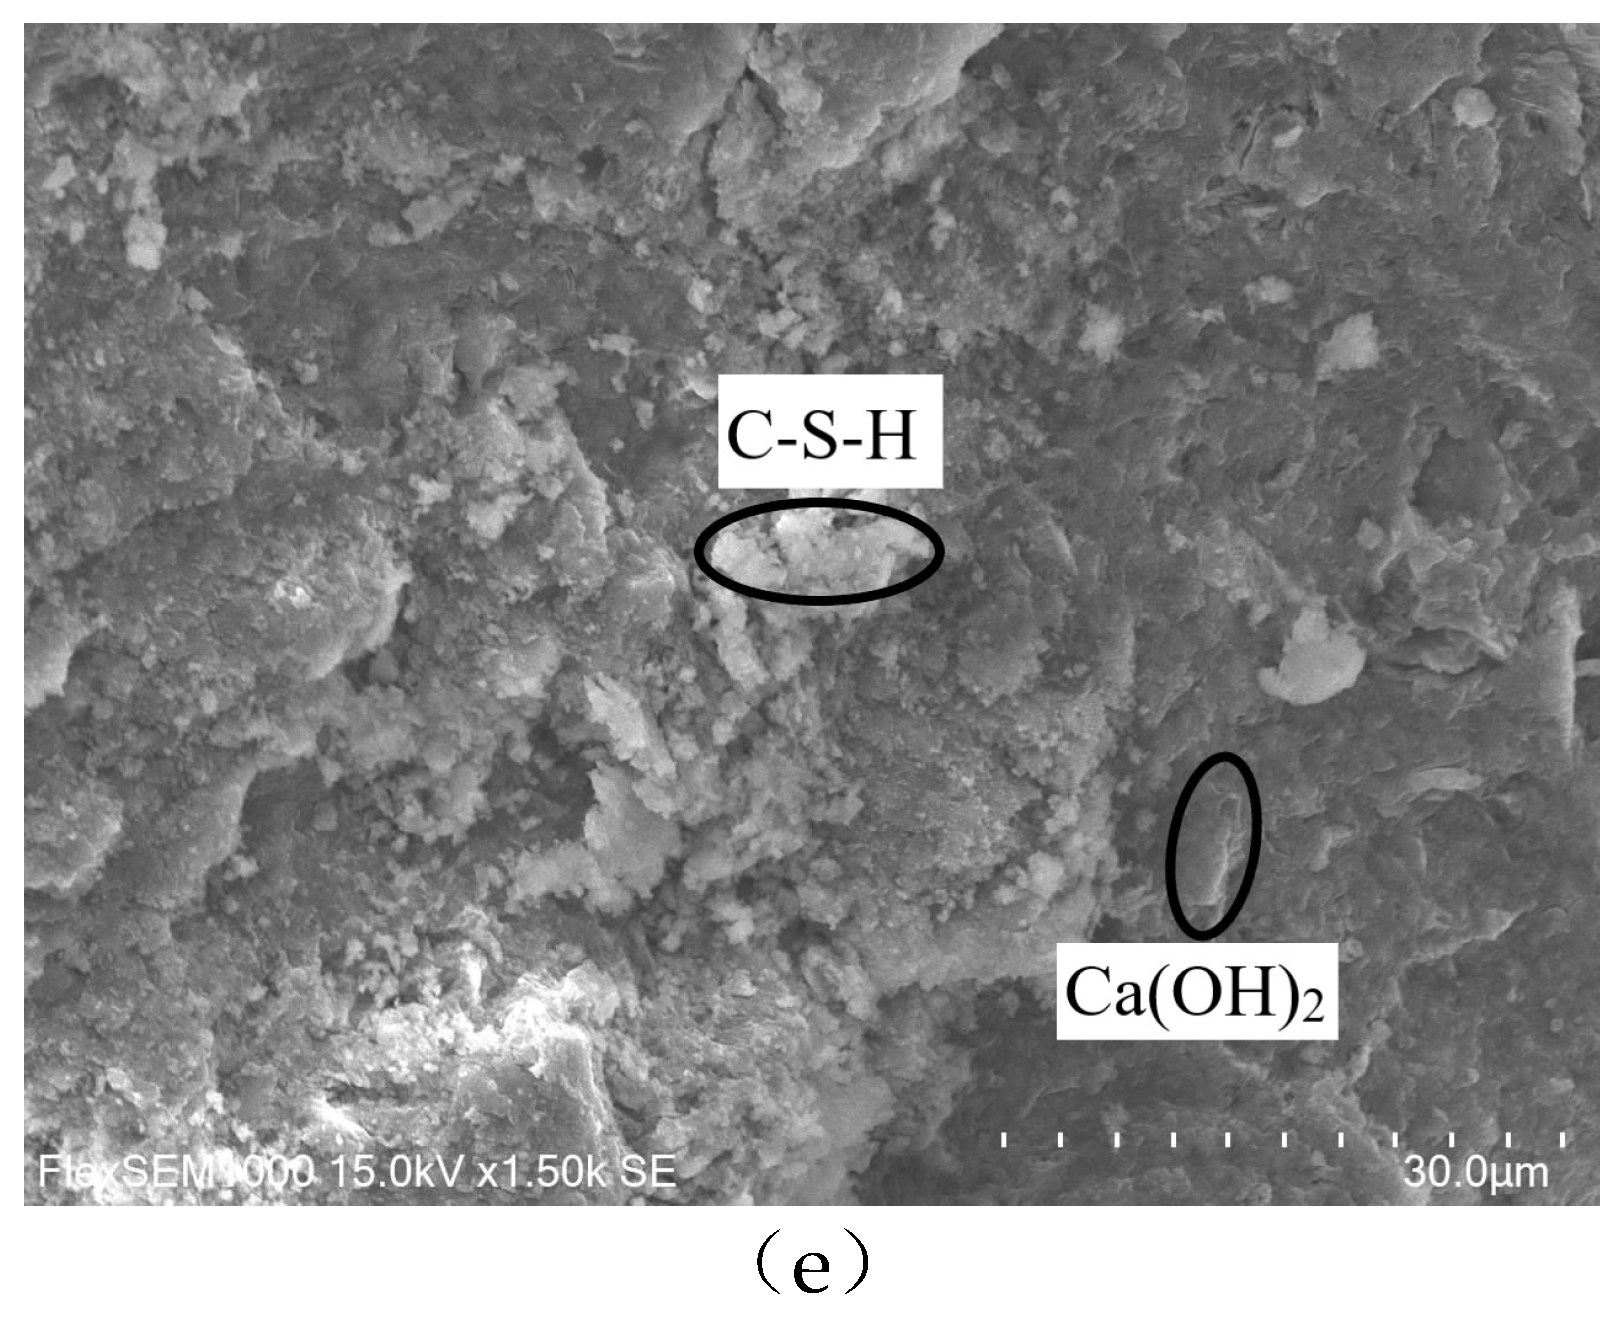
Figure 10. According to
Figure 10(e), the sample had hexagonal flake Ca(OH)2 crystals, a sizable number of C-S-H gels, and the structure was relatively thick before freezing and thawing. When the sample was put through 30 freeze-thaw cycles in aqueous solution, it can be seen from
Figure 10(a) that crystals of Ca(OH)
2 and C-S-H gel were dispersed inside the structure, however some microscopic holes developed. From
Figure 10(b), it is clear that even after being frozen and thawed in aqueous solution 50 times, the sample still contains a significant amount of C-S-H gel, and no other types of substances are produced. However, there are interconnected cracks and holes compared to 30 cycles of freezing and thawing. The increase is brought about by the fact that when the quantity of freeze-thaw cycles rises, the sample develops cracks due to the greater frost heaving force;
Figure 10(c) demonstrates that after the sample underwent 30 cycles of freeze-thaw processing in Na
2SO
4 solution, some Ca(OH)
2 crystals and C-S-H gels were distributed inside the structure, and needle-like AFt was created to fill the interior pores and microcracks. Compared with 30 times of freezing and thawing in aqueous solution, the internal structure was relatively flat and dense, and the macroscopic strength increased. As seen in
Figure 10(d), the internal crack width widens and a lot of needle-like AFt and a little C-S-H gel are scattered throughout the sample structure’s pores. This is due to the reaction of SO
42- ions with the hydration products in the pores to form expansive gypsum and ettringite, which expands the pores or cracks [
21], and macroscopically shows a decrease in strength.
5. Conclusions
(1) Before the sample has undergone a 30-time cycle of freezing and thawing in aqueous solution and Na2SO4 solution, the surface of the sample is slightly covered with a small amount of; The sample in Na2SO4 solution corroded very smoothly at the edges and corners until the number of freeze-thaw cycles reached 50, and a penetrating fracture emerged on the surface. The surface of the sample in the aqueous solution peeled off seriously, but the original edges and corners were still maintained, and no cracks appeared on the surface.
(2) The sample’s mass loss and compressive strength loss in the two solutions rise steadily as the number of freeze-thaw cycles rises, but the relative dynamic elastic modulus gradually falls. The sample in Na2SO4 solution had a mass loss rate of 4.17%, a relative dynamic elastic modulus loss rate of 84.3%, and a compressive strength loss rate of 24.59% when the number of freeze-thaw cycles had reached 30.
(3) Compared with freeze-thaw in aqueous solution, the Ca(OH)2 diffraction peak in the XRD spectrum of the sample in Na2SO4 solution is further reduced, the diffraction peak of AFt crystal is increased, and the diffraction peak of gypsum is produced. The strength of the structure declines and the crack breadth widens after 50 freeze-thaw cycles in Na2SO4 solution.
Author Contributions
Qinyong Ma: Conceptualization, investigation, methodology, data analysis. Biao Li: Test equipment and validation, data analysis, writing original draft.
Data Availability Statement
The data that support the findings of this study are available from the corresponding author upon reasonable request.
Acknowledgments
This work is supported by the Collaborative Innovation Project of Anhui Universities Project (GXXT-2019-005) and National Natural Science Foundation Project (51774011). Thanks to the support of School of Civil Engineering and Architecture, Anhui University of Science and Technology.
Conflicts of Interest
The data that support the findings of this study are available from the corresponding author upon reasonable request.
References
- Wang, Z.P.; Peng, X.; Zhao, Y.T.; Yang, H.Y.; Xu, L.L. Effect of sulfate attack on hydration of calcium aluminate cement at 5-40 ℃. Journal of the Chinese Ceramic Society, 2019, 47, 1538–1545. [Google Scholar]
- Li, X.H.; Zhang, Q.S.; Zhang, X.; Lan, X.D.; Zuo, J.X. Grouting diffusion mechanism in heterogeneous fault-fracture zone. Advanced Engineering Sciences, 2018, 50, 67–76. [Google Scholar]
- Zhu, X.F.; Song, P.T.; Du, F.; Wang, J.; Zhang, W.; Zhou, Y.X.; Leng, F.G. Research on durability and water dispersibility of high performance shield grouting material. Concrete, 2021, 157-160.
- Jiao, L. Study on corrosion resistance of grouting materials for subsea tunnels and its engineering application. Modern Tunnelling Technology, 2022, 59, 256–262. [Google Scholar]
- Liu, C.Y.; Pang, Y.Z.; Zuo, L.M.; Zhao, X.H.; Liu, Y.F. Effect of gypsum on properties of soda residue-fly ash slurry under compound activation. Journal of Yangtze River Scientific Research, 2019, 36, 120–125. [Google Scholar]
- Zhao, A.L.; Wu, Z.L.; Liu, J.Y. Experimental study on water stability and frost resistance of a new type of foamed lightweight soil grouting material in highway goaf. Highway, 2016, 61, 207–211. [Google Scholar]
- Wang, Y.; Cao, Y.S.; Cui, L.; Si, Z.Y.; Wang, H.J. Effect of external sulfate attack on the mechanical behavior of cemented paste backfill. Construction and Building Materials, 2020, 263, 120968. [Google Scholar] [CrossRef]
- Wang, X.F.; Wang, W.W.; Liu, Q.; Shu, Z.; Luo, H.J.; Ji, S.D.; Zhu, J.F. Effects of metakaolin on sulfate and sulfuric acid resistance of grouting restoration materials. Construction and Building Materials, 2022, 349: 128714. [CrossRef]
- Li, B.; Ma, Q.Y.; Zhang, F. Influence mechanism analysis of ultrafine ground granulated blast furnace slag and silica fume on properties of cement-based slurry. Bulletin of the Chinese Ceramic Society, 2022, 41, 4342–4352. [Google Scholar]
- Test method for long-term performance and durability of ordinary concrete: GB/T 50082-2009. Beijing: Standards Press of China, 2009.
- Liu, H.Z. Research on the effect of freeze-thaw cycle and sulfate erosion on the damage of cement mortar. Qingdao Technological University, Qingdao, 2015.
- Tian, W.; Li, X.S.; Wang, F. Experimental study on deterioration mechanism of concrete under freeze-thaw cycles coupled with sulfate solution. Bulletin of the Chinese Ceramic Society, 2019, 38, 702–710. [Google Scholar]
- Weng, J.H.; Wang, R.L.; Li, Z.Y.; Wang, H.; Liu, J.H.; Liu, Q.Y. Study on the influence of baixiangshan iron tailings micro powder on the properties of cementitious grout. Metal Mine, 2022, 41-47.
- Jiang, L.; Niu, D.T. Study on constitutive relation of concrete under sulfate attack and freeze-thaw environment. Advanced Engineering Sciences, 2016, 48, 71–78. [Google Scholar]
- Liu, K.W.; Sun, D.S.; Wang, A.G.; Li, Y.; Deng, M. Mechanical strength and microstructure of grouting materials with long-term lmmersion in sodium sulfate solution. Journal of Materials Science and Engineering, 2018, 36, 403–407+385. [Google Scholar]
- Kunther, W.; Lothenbach, B.; Skibsted, J. Influence of the Ca/Si ratio of the C-S-H phase on the interaction with sulfate ions and its impact on the ettringite crystallization pressure. Cement and Concrete Research, 2015, 69, 37. [Google Scholar] [CrossRef]
- Jia, Z.J.; Chen, C.; Shi, J.J. The microstructural change of CSH at elevated temperature in Portland cement/GGBFS blended system. Cement and Concrete Research, 2019, 123, 105773. [Google Scholar] [CrossRef]
- Alarcon-Ruiz, L.; Platret, G.; Massieu, E.; Ehrlacher, A. The use of thermal analysis in assessing the effect of temperature on a cement paste. Cement and Concrete Research, 2005, 35, 609–613. [Google Scholar] [CrossRef]
- Liu, M.H.; Zhao, Y.D.; Xiao, Y.X.; Yu, Z.Y. Performance of cement pastes containing sewage sludge ash at elevated temperatures. Construction and Building Materials, 2019, 211, 785–795. [Google Scholar] [CrossRef]
- Qu, F.L.; Li, W.G.; Tang, Z.; Wang, K.J. Property degradation of seawater sea sand cementitious mortar with GGBFS and glass fiber subjected to elevated temperatures. Journal of Materials Research and Technology, 2021, 13: 366-384. [CrossRef]
- Lin, H.; Hou, J.; Lu, X.L.; Gao, P.W. Effect of sulfate on the microstructure of cementitious materials. Concrete, 2005, 7-10.
|
Disclaimer/Publisher’s Note: The statements, opinions and data contained in all publications are solely those of the individual author(s) and contributor(s) and not of MDPI and/or the editor(s). MDPI and/or the editor(s) disclaim responsibility for any injury to people or property resulting from any ideas, methods, instructions or products referred to in the content. |
© 2023 by the authors. Licensee MDPI, Basel, Switzerland. This article is an open access article distributed under the terms and conditions of the Creative Commons Attribution (CC BY) license (http://creativecommons.org/licenses/by/4.0/).

