Submitted:
14 June 2023
Posted:
14 June 2023
You are already at the latest version
Abstract
Keywords:
1. Introduction
2. Materials and Methods
2.1. Materials
2.2. Methods
2.2.1. Materials characterization
2.2.2. Anaerobic digestion experiment
| Variant name, - | D | 0 | 1 | 3 | 5 | 7 | 9 | 12 |
|---|---|---|---|---|---|---|---|---|
| Substrate, gwet* | 0.00 | 11.7 | 11.7 | 11.7 | 11.7 | 11.7 | 11.7 | 11.7 |
| Substrate, gTS | 0.00 | 3.00 | 3.00 | 3.00 | 3.00 | 3.00 | 3.00 | 3.00 |
| Substrate, gvs | 0.00 | 2.88 | 2.88 | 2.88 | 2.88 | 2.88 | 2.88 | 2.88 |
| Inoculum, gwet | 150 | 150 | 150 | 150 | 150 | 150 | 150 | 150 |
| Inoculum, gTS | 7.95 | 7.95 | 7.95 | 7.95 | 7.95 | 7.95 | 7.95 | 7.95 |
| Inoculum, gvs | 0.00 | 4.71 | 4.71 | 4.71 | 4.71 | 4.71 | 4.71 | 4.71 |
| SIR by TS, - | - | 0.38 | 0.38 | 0.38 | 0.38 | 0.38 | 0.38 | 0.38 |
| SIR by VS, - | - | 0.61 | 0.61 | 0.61 | 0.61 | 0.61 | 0.61 | 0.61 |
| Stimulatory materials, gTS | - | - | 0.03 | 0.09 | 0.145 | 0.20 | 0.26 | 0.35 |
| Stimulatory materials, gTS×L-1 | - | - | 0.20 | 0.60 | 0.95 | 1.34 | 1.70 | 2.30 |
| Stimulatory materials to substrate by TS, % | - | - | 1 | 3 | 5 | 7 | 9 | 12 |
| *dry substrate was placed into the reactors, | ||||||||
2.2.3. Kinetics parameter determination
2.2.3. Substrate conversion efficiency
2.2.4. Statistical analysis
3. Results and Discussion
3.1. Materials
3.2. Anaerobic digestion
3.3. Kinetics parameters and substrate conversion efficiency
3.3. Process residues
5. Conclusions
Author Contributions
Funding
Institutional Review Board Statement
Informed Consent Statement
Data Availability Statement
Conflicts of Interest
References
- Karlović, A.; Jurić, A.; Ćorić, N.; Habschied, K.; Krstanović, V.; Mastanjević, K. By-Products in the Malting and Brewing Industries-Re-Usage Possibilities. Fermentation 2020, 6, 1–17. [Google Scholar] [CrossRef]
- Dudek, M.; Świechowski, K.; Manczarski, P.; Koziel, J.A.; Białowiec, A. The Effect of Biochar Addition on the Biogas Production Kinetics from the Anaerobic Digestion of Brewers’ Spent Grain. Energies (Basel) 2019, 12, 1–22. [Google Scholar] [CrossRef]
- Mussatto, S.I.; Dragone, G.; Roberto, I.C. Brewers’ Spent Grain: Generation, Characteristics and Potential Applications. J Cereal Sci 2006, 43, 1–14. [Google Scholar] [CrossRef]
- Russ, W.; Mörtel, H.; Meyer-Pittroff, R. Application of Spent Grains to Increase Porosity in Bricks. Constr Build Mater 2005, 19, 117–126. [Google Scholar] [CrossRef]
- Thomas, K.R.; Rahman, P.K.S.M. Brewery Wastes. Strategies for Sustainability. A Review. Asp Appl Biol 2006, 80, 147–153. [Google Scholar]
- Saenge, C.; Cheirsilp, B.; Suksaroge, T.T.; Bourtoom, T. Potential Use of Oleaginous Red Yeast Rhodotorula Glutinis for the Bioconversion of Crude Glycerol from Biodiesel Plant to Lipids and Carotenoids. Process Biochemistry 2011, 46, 210–218. [Google Scholar] [CrossRef]
- Syguła, E.; Gałęzowska, M.; Białowiec, A. Enhanced Production of Biogas Using Biochar–Sulfur Composite in the Methane Fermentation Process. Materials 2022, 15. [Google Scholar] [CrossRef]
- Kostowski, W.; Barzantny, M. Efektywność Energetyczna i Środowiskowa Wybranych Metod Wykorzystania Wodoru Energy and Environmental Efficiency of Selected Methods to Use Hydrogen. 2022, 445–450.
- Magazyn Biomasa Raport Biogaz w Polsce. 2020.
- Świechowski, K.; Rasaq, W.A.; Syguła, E. Anaerobic Digestion of Brewer’s Spent Grain with Biochars—Biomethane Production and Digestate Quality Effects. Front Energy Res 2023, 11. [Google Scholar] [CrossRef]
- Ryckebosch, E.; Drouillon, M.; Vervaeren, H. Techniques for Transformation of Biogas to Biomethane. Biomass Bioenergy 2011, 35, 1633–1645. [Google Scholar] [CrossRef]
- Rejman-Burzyńska, A.; Maksymiak-Lach, H.; Jędrysik, E. Potencjał Energetyczny Biogazu – Ocena Zasobów Surowcowych Do Produkcji Biogazu w Polsce. Chemik 2013, 67, 446–453. [Google Scholar]
- Sakiewicz, P.; Cebula, J.; Piotrowski, K.; Bohdziewicz, J. Kinetics of Methane Fermentation of Selected Post-Processed Poultry Beddings — Possibilities of Process Intensification and Limitations. 2019, 2, 105–112. [Google Scholar] [CrossRef]
- IEA Bioenergy Methane Emissions from Biogas Plants; 2017; ISBN 978-1-910154-35-9.
- Krzysztof Ziemiński Methane Fermentation Process as Anaerobic Digestion of Biomass: Transformations, Stages and Microorganisms. Afr J Biotechnol 2012, 11, 4127–4139. [CrossRef]
- Qiang, H.; Lang, D.L.; Li, Y.Y. High-Solid Mesophilic Methane Fermentation of Food Waste with an Emphasis on Iron, Cobalt, and Nickel Requirements. Bioresour Technol 2012, 103, 21–27. [Google Scholar] [CrossRef]
- Khor, W.C.; Rabaey, K.; Vervaeren, H. Low Temperature Calcium Hydroxide Treatment Enhances Anaerobic Methane Production from (Extruded) Biomass. Bioresour Technol 2015, 176, 181–188. [Google Scholar] [CrossRef]
- Krishania, M.; Vijay, V.K.; Chandra, R. Methane Fermentation and Kinetics of Wheat Straw Pretreated Substrates Co-Digested with Cattle Manure in Batch Assay. Energy 2013, 57, 359–367. [Google Scholar] [CrossRef]
- Bischof, L.F.; Haurat, M.F.; Hoffmann, L.; Albersmeier, A.; Wolf, J.; Neu, A.; Pham, T.K.; Albaum, S.P.; Jakobi, T.; Schouten, S.; et al. Early Response of Sulfolobus Acidocaldarius to Nutrient Limitation. Front Microbiol 2019, 9. [Google Scholar] [CrossRef]
- Wintsche, B.; Glaser, K.; Sträuber, H.; Centler, F.; Liebetrau, J.; Harms, H.; Kleinsteuber, S. Trace Elements Induce Predominance among Methanogenic Activity in Anaerobic Digestion. Front Microbiol 2016, 7. [Google Scholar] [CrossRef] [PubMed]
- Preeti Rao, P.; Seenayya, G. Improvement of Methanogenesis from Cow Dung and Poultry Litter Waste Digesters by Addition of Iron. World J Microbiol Biotechnol 1994, 10, 211–214. [Google Scholar] [CrossRef] [PubMed]
- Meng, X.; Zhang, Y.; Li, Q.; Quan, X. Adding Fe0 Powder to Enhance the Anaerobic Conversion of Propionate to Acetate. Biochem Eng J 2013, 73, 80–85. [Google Scholar] [CrossRef]
- Takashima, M.; Shimada, K.; Speece, R.E. Minimum Requirements for Trace Metals (Iron, Nickel, Cobalt, and Zinc) in Thermophilic and Mesophilic Methane Fermentation from Glucose. Water Environment Research 2011, 83, 339–346. [Google Scholar] [CrossRef] [PubMed]
- Grgas, D.; Rukavina, M.; Bešlo, D.; Štefanac, T.; Crnek, V.; Šiki, T.; Habuda-stani, M. The Bacterial Degradation of Lignin — A Review. 2023, 1–17.
- Kaar, W.E.; Holtzapple, M.T. Using Lime Pretreatment to Facilitate the Enzymic Hydrolysis of Corn Stover. Biomass Bioenergy 2000, 18, 189–199. [Google Scholar] [CrossRef]
- Chen, S.; Zhang, J.; Wang, X. Effects of Alkalinity Sources on the Stability of Anaerobic Digestion from Food Waste. Waste Management & Research: The Journal for a Sustainable Circular Economy 2015, 33, 1033–1040. [Google Scholar] [CrossRef]
- PN-EN 14346:2011 Standard. Waste Characteristics. Calculation of Dry Mass on the Basis of Dry Residue or Water Content.
- PN-EN 15169:2011 Standard. Waste Characteristics. Determination of Organic Matter Content for Waste, Slurry and Sludge.
- 2: ISO 118852009 Water Quality - Determination of Selected Elements by Inductively Coupled Plasma Optical Emission Spectrometry (ICP-OES) (ISO 11885, 1188.
- Abdelwahab, T.A.M.; Fodah, A.E.M. Utilization of Nanoparticles for Biogas Production Focusing on Process Stability and Effluent Quality. SN Appl Sci 2022, 4, 332. [Google Scholar] [CrossRef]
- Chen, Y.; Cheng, J.J.; Creamer, K.S. Inhibition of Anaerobic Digestion Process: A Review. Bioresour Technol 2008, 99, 4044–4064. [Google Scholar] [CrossRef] [PubMed]
- Andriamanohiarisoamanana, F.J.; Shirai, T.; Yamashiro, T.; Yasui, S.; Iwasaki, M.; Ihara, I.; Nishida, T.; Tangtaweewipat, S.; Umetsu, K. Valorizing Waste Iron Powder in Biogas Production: Hydrogen Sulfide Control and Process Performances. J Environ Manage 2018, 208, 134–141. [Google Scholar] [CrossRef]
- Liu, Y.; Wang, Q.; Zhang, Y.; Ni, B.-J. Zero Valent Iron Significantly Enhances Methane Production from Waste Activated Sludge by Improving Biochemical Methane Potential Rather Than Hydrolysis Rate. Sci Rep 2015, 5, 8263. [Google Scholar] [CrossRef] [PubMed]
- Cao, X.; Wang, Y.; Liu, T. Effects of Iron Powder Addition and Thermal Hydrolysis on Methane Production and the Archaeal Community during the Anaerobic Digestion of Sludge. Int J Environ Res Public Health 2022, 19, 4470. [Google Scholar] [CrossRef]
- Lohani, S.P.; Havukainen, J. Anaerobic Digestion: Factors Affecting Anaerobic Digestion Process. In Energy, Environment, and Sustainability; Springer Nature, 2018; pp. 343–359.
- Zhang, Y.; Liang, Y.; Chen, J.; Chen, H. Effect of Lime Loading on the Performance of Simultaneous Lime Treatment and Dry Anaerobic Digestion of Smooth Cordgrass. Energy Sources, Part A: Recovery, Utilization, and Environmental Effects 2016, 38, 3048–3054. [Google Scholar] [CrossRef]
- Zhang, J.; Wang, Q.; Zheng, P.; Wang, Y. Anaerobic Digestion of Food Waste Stabilized by Lime Mud from Papermaking Process. Bioresour Technol 2014, 170, 270–277. [Google Scholar] [CrossRef]
- Drosg, B. Process Monitoring in Biogas Plants; 2013.
- Jun, D.; Yong-sheng, Z.; Mei, H.; Wei-hong, Z. Influence of Alkalinity on the Stabilization of Municipal Solid Waste in Anaerobic Simulated Bioreactor. J Hazard Mater 2009, 163, 717–722. [Google Scholar] [CrossRef]
- Montalvo, S.; Guerrero, L.; Borja, R.; Sánchez, E.; Milán, Z.; Cortés, I.; Angeles de la la Rubia, M. Application of Natural Zeolites in Anaerobic Digestion Processes: A Review. Appl Clay Sci 2012, 58, 125–133. [Google Scholar] [CrossRef]
- Cavali, M.; Libardi Junior, N.; de Almeida Mohedano, R.; Belli Filho, P.; da Costa, R.H.R.; de Castilhos Junior, A.B. Biochar and Hydrochar in the Context of Anaerobic Digestion for a Circular Approach: An Overview. Science of The Total Environment 2022, 822, 153614. [Google Scholar] [CrossRef]
- Ward, A.J.; Hobbs, P.J.; Holliman, P.J.; Jones, D.L. Optimisation of the Anaerobic Digestion of Agricultural Resources. Bioresour Technol 2008, 99, 7928–7940. [Google Scholar] [CrossRef] [PubMed]
- Sánchez-Sánchez, C.; González-González, A.; Cuadros-Salcedo, F.; Cuadros-Blázquez, F. Using Low-Cost Porous Materials to Increase Biogas Production: A Case Study in Extremadura (Spain). J Clean Prod 2018, 198, 1165–1172. [Google Scholar] [CrossRef]
- Shi, Y.; Liu, M.; Li, J.; Yao, Y.; Tang, J.; Niu, Q. The Dosage-Effect of Biochar on Anaerobic Digestion under the Suppression of Oily Sludge: Performance Variation, Microbial Community Succession and Potential Detoxification Mechanisms. J Hazard Mater 2022, 421, 126819. [Google Scholar] [CrossRef] [PubMed]
- Montalvo, S.; Díaz, F.; Guerrero, L.; Sánchez, E.; Borja, R. Effect of Particle Size and Doses of Zeolite Addition on Anaerobic Digestion Processes of Synthetic and Piggery Wastes. Process Biochemistry 2005, 40, 1475–1481. [Google Scholar] [CrossRef]
- Koch, K.; Hafner, S.D.; Weinrich, S.; Astals, S.; Holliger, C. Power and Limitations of Biochemical Methane Potential (BMP) Tests. Front Energy Res 2020, 8. [Google Scholar] [CrossRef]
- Koch, K.; Hafner, S.D.; Weinrich, S.; Astals, S. Identification of Critical Problems in Biochemical Methane Potential (BMP) Tests From Methane Production Curves. Front Environ Sci 2019, 7. [Google Scholar] [CrossRef]
- Akunna, J.C. Anaerobic Treatment of Brewery Wastes. In Brewing Microbiology; Elsevier, 2015; pp. 407–424.
- Czekała, W.; Lewicki, A.; Pochwatka, P.; Czekała, A.; Wojcieszak, D.; Jóźwiakowski, K.; Waliszewska, H. Digestate Management in Polish Farms as an Element of the Nutrient Cycle. J Clean Prod 2020, 242, 118454. [Google Scholar] [CrossRef]
- Li, Y.; Alaimo, C.P.; Kim, M.; Kado, N.Y.; Peppers, J.; Xue, J.; Wan, C.; Green, P.G.; Zhang, R.; Jenkins, B.M.; et al. Composition and Toxicity of Biogas Produced from Different Feedstocks in California. Environ Sci Technol 2019, 53, 11569–11579. [Google Scholar] [CrossRef] [PubMed]
- Bharathiraja, B.; Sudharsana, T.; Jayamuthunagai, J.; Praveenkumar, R.; Chozhavendhan, S.; Iyyappan, J. Biogas Production–A Review on Composition, Fuel Properties, Feed Stock and Principles of Anaerobic Digestion. Renewable and Sustainable Energy Reviews 2018, 90, 570–582. [Google Scholar] [CrossRef]
- Häfner, F.; Hartung, J.; Möller, K. Digestate Composition Affecting N Fertiliser Value and C Mineralisation. Waste Biomass Valorization 2022, 13, 3445–3462. [Google Scholar] [CrossRef]


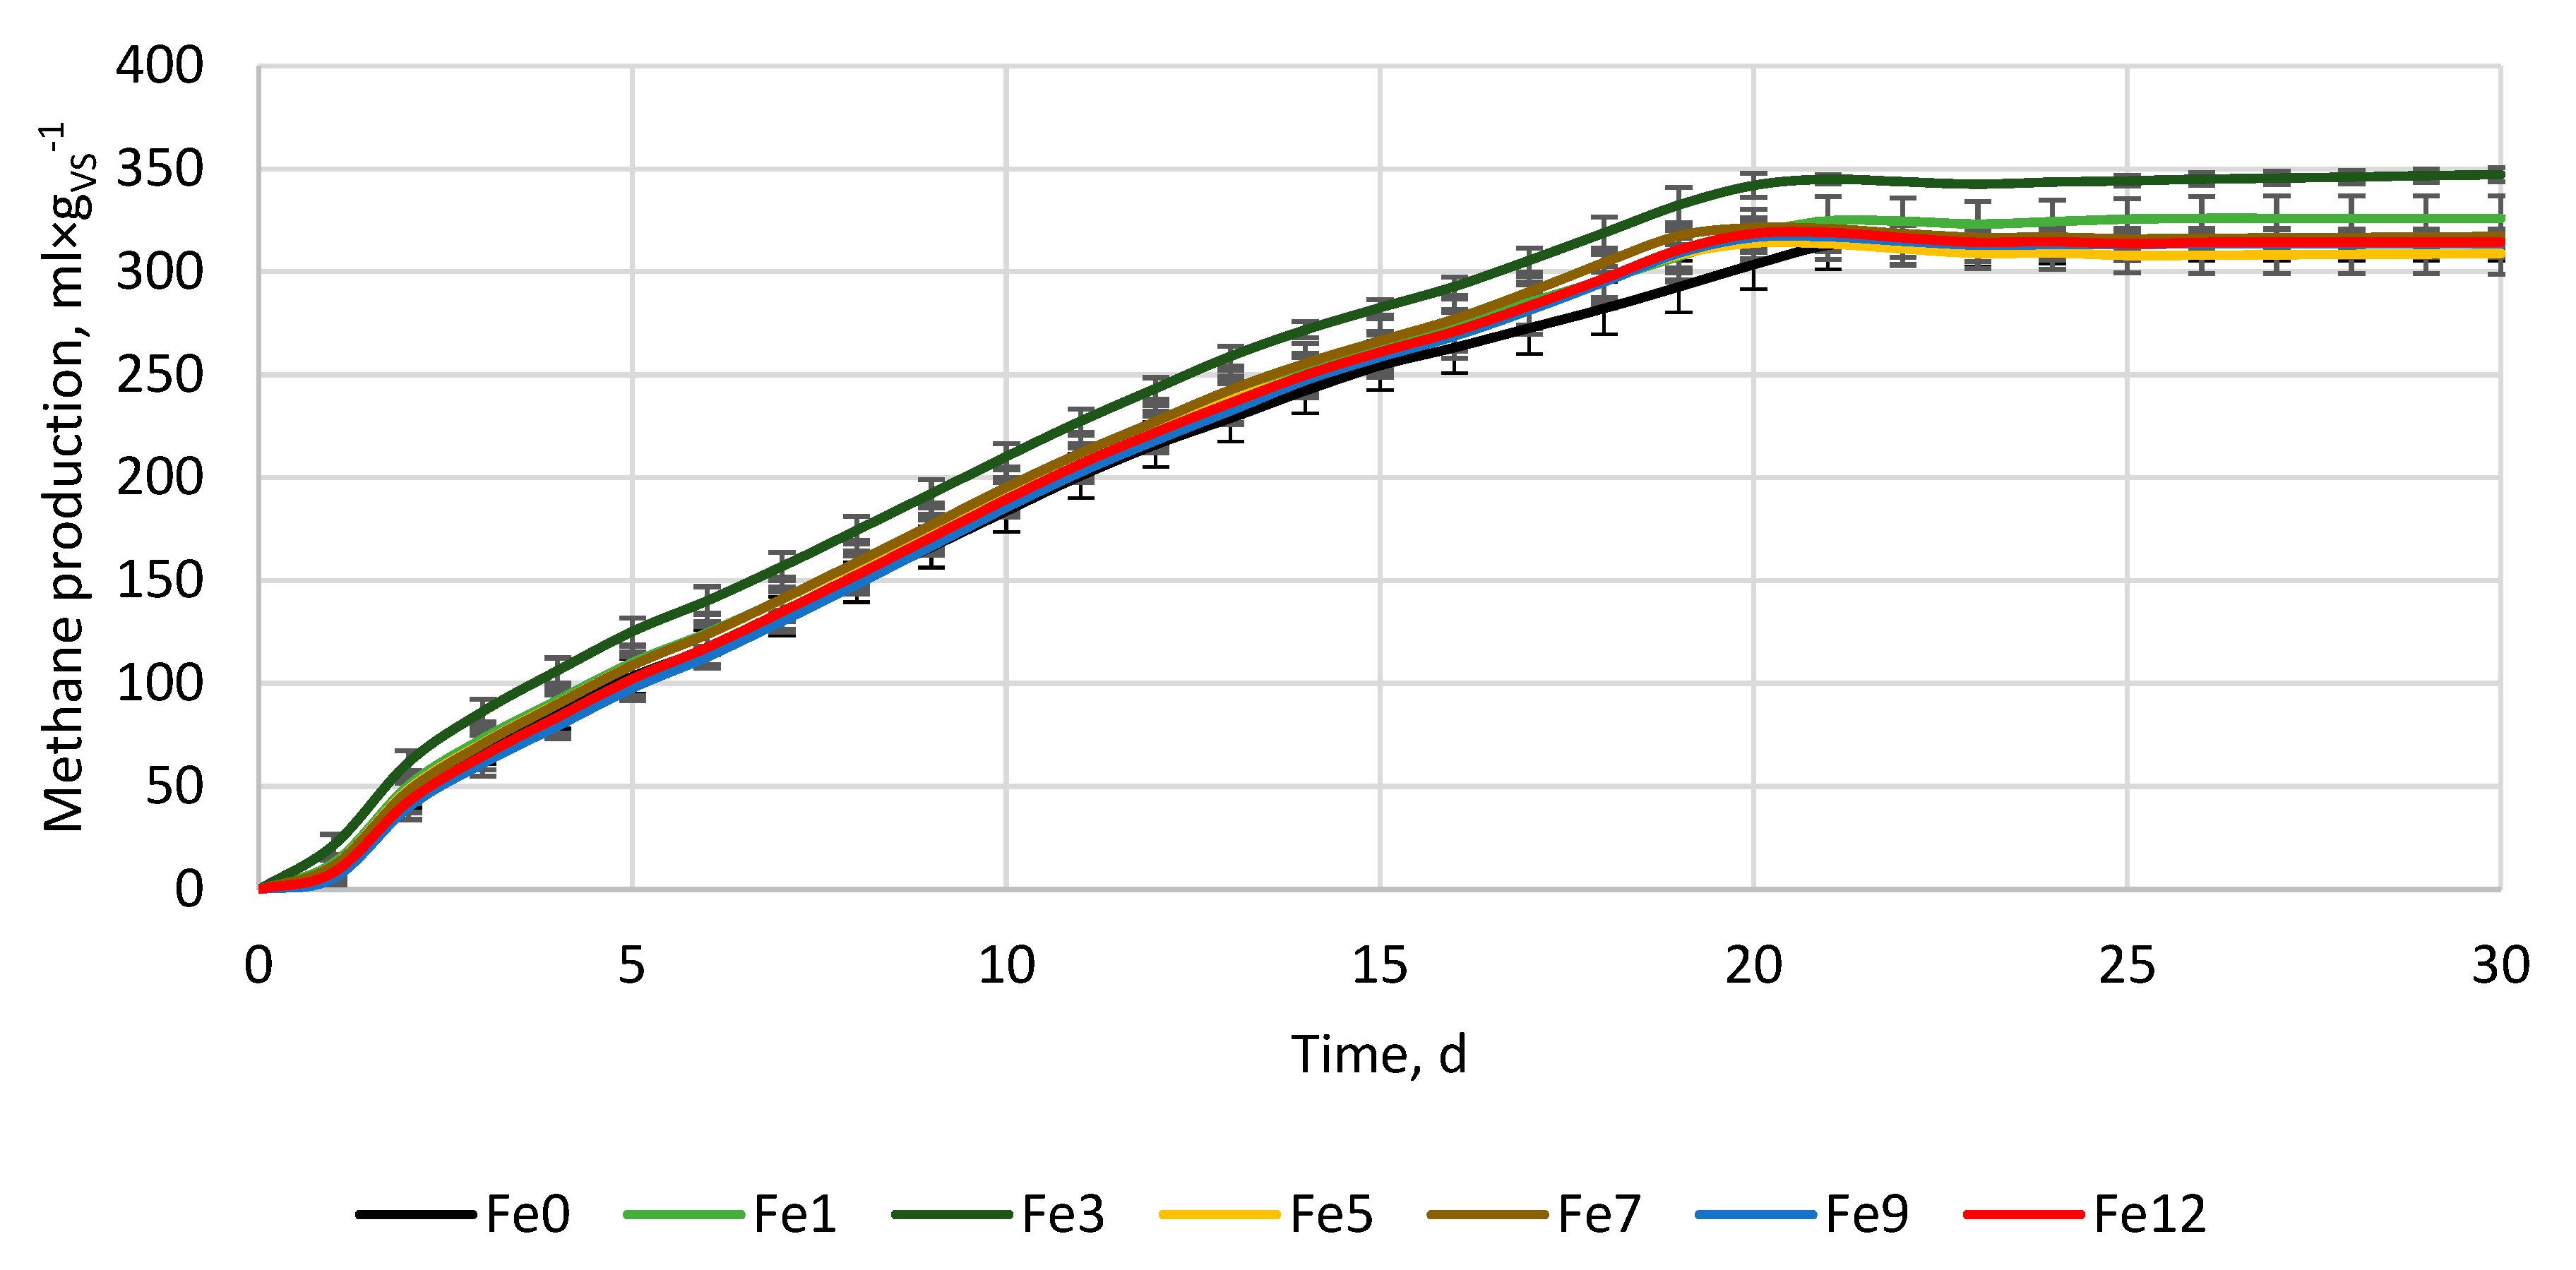
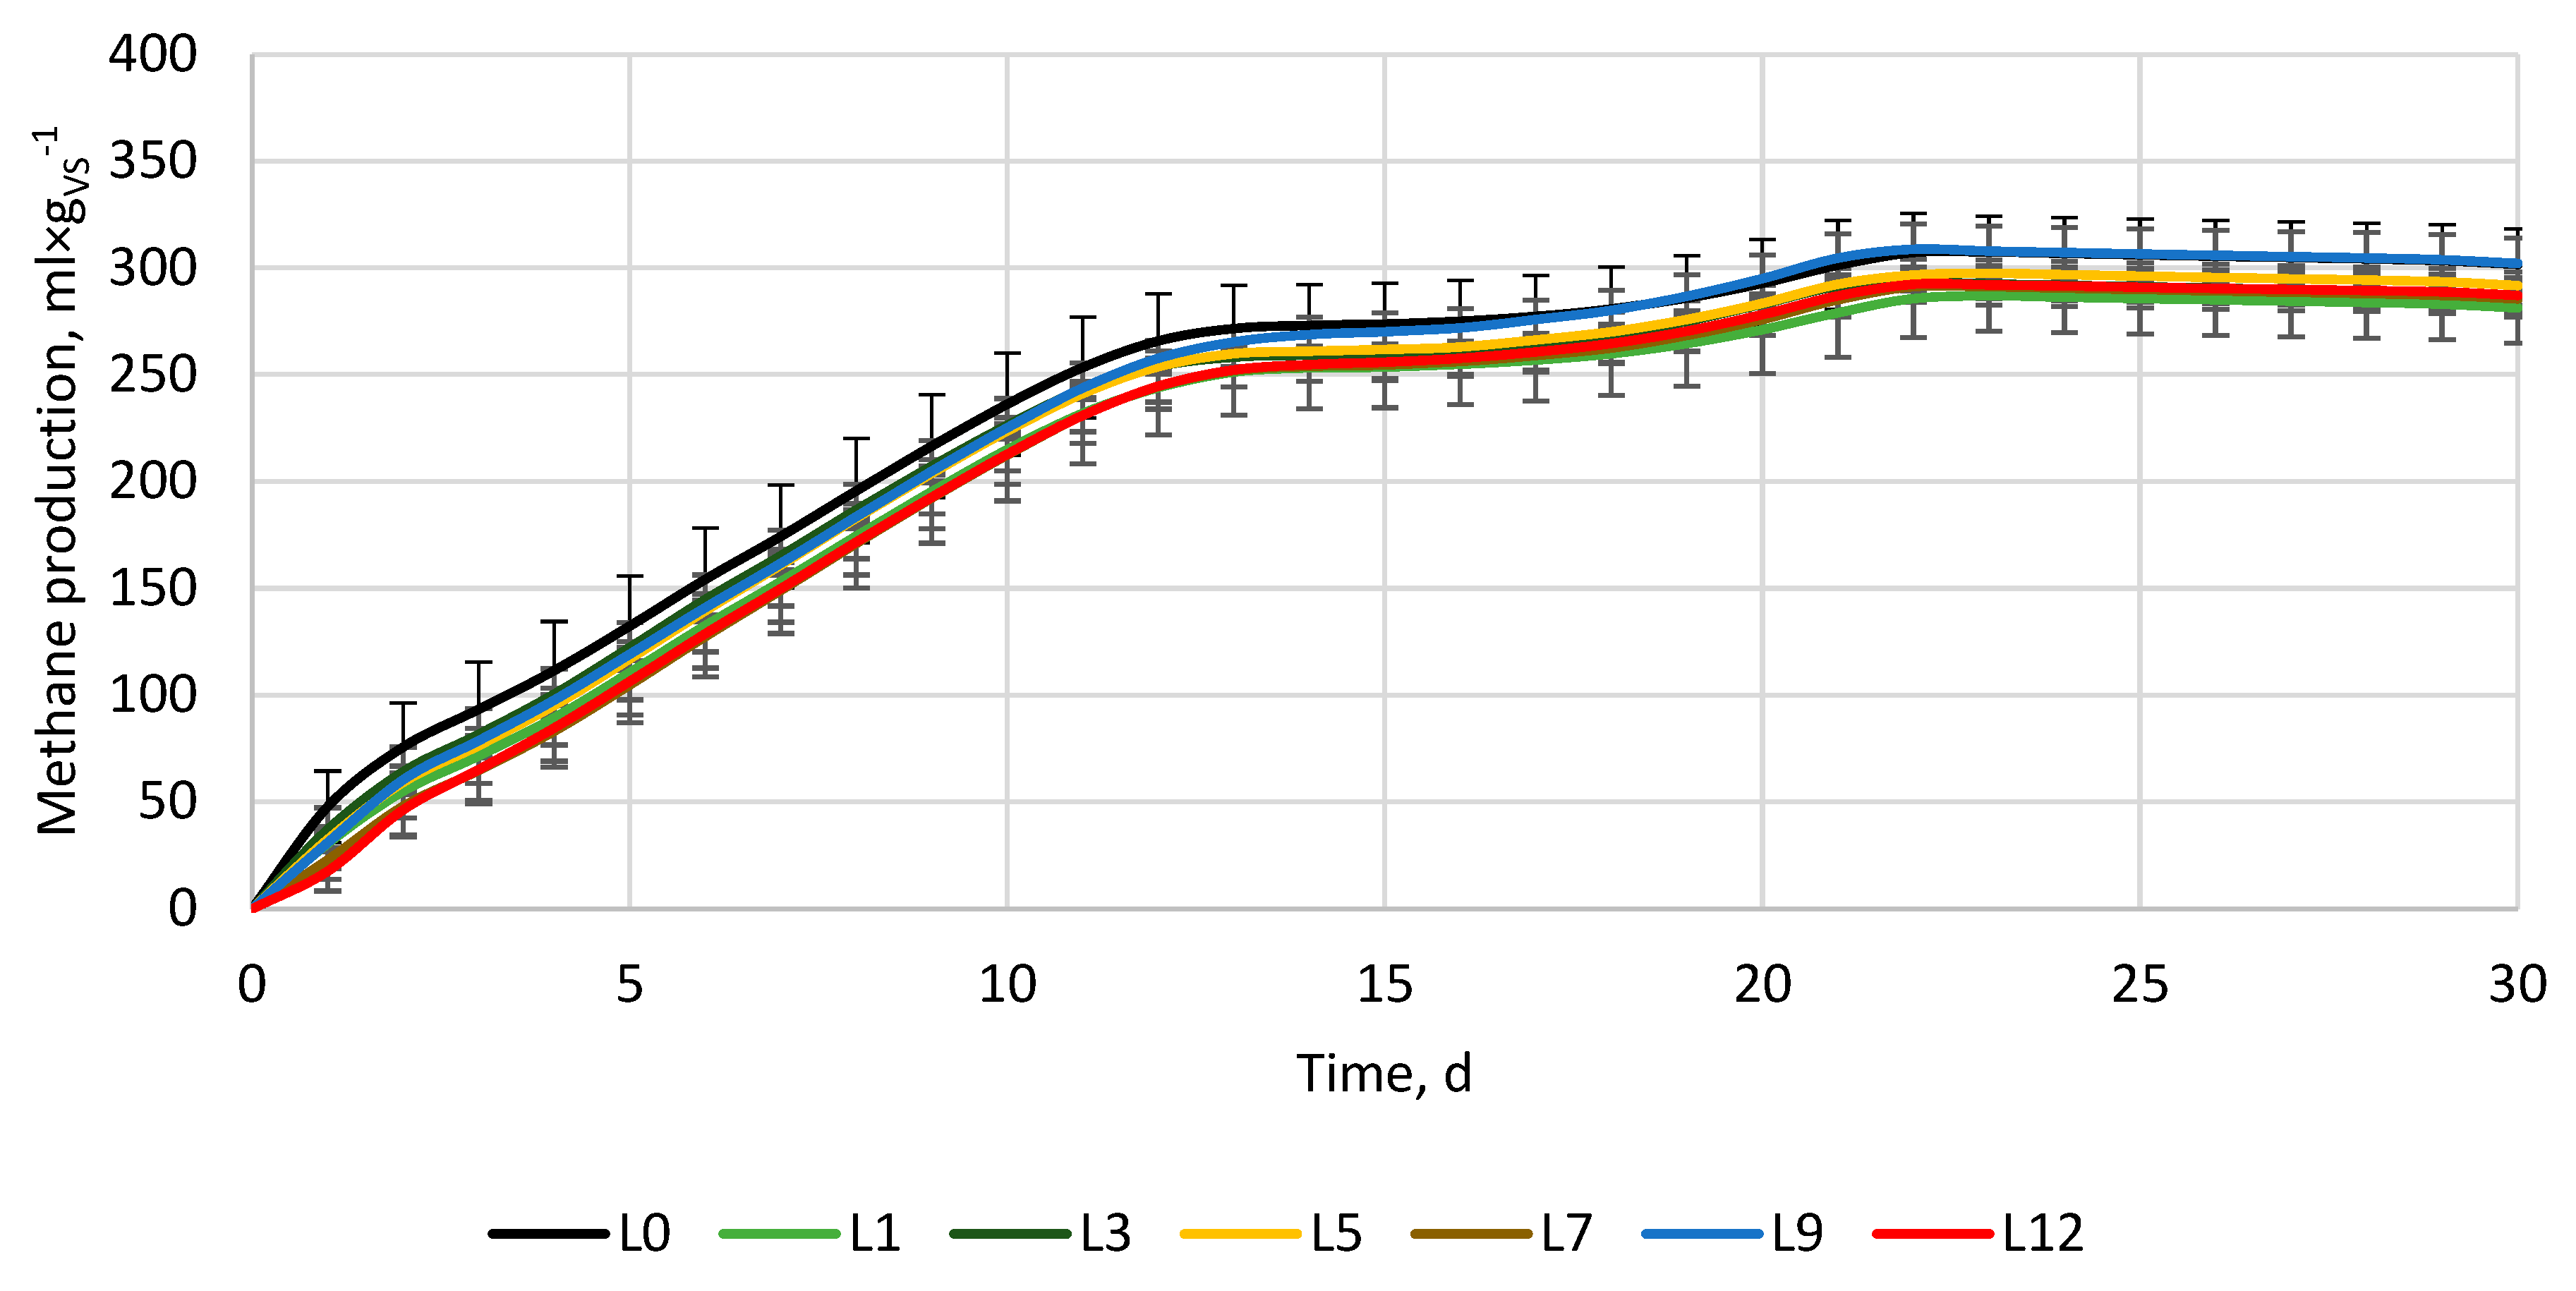
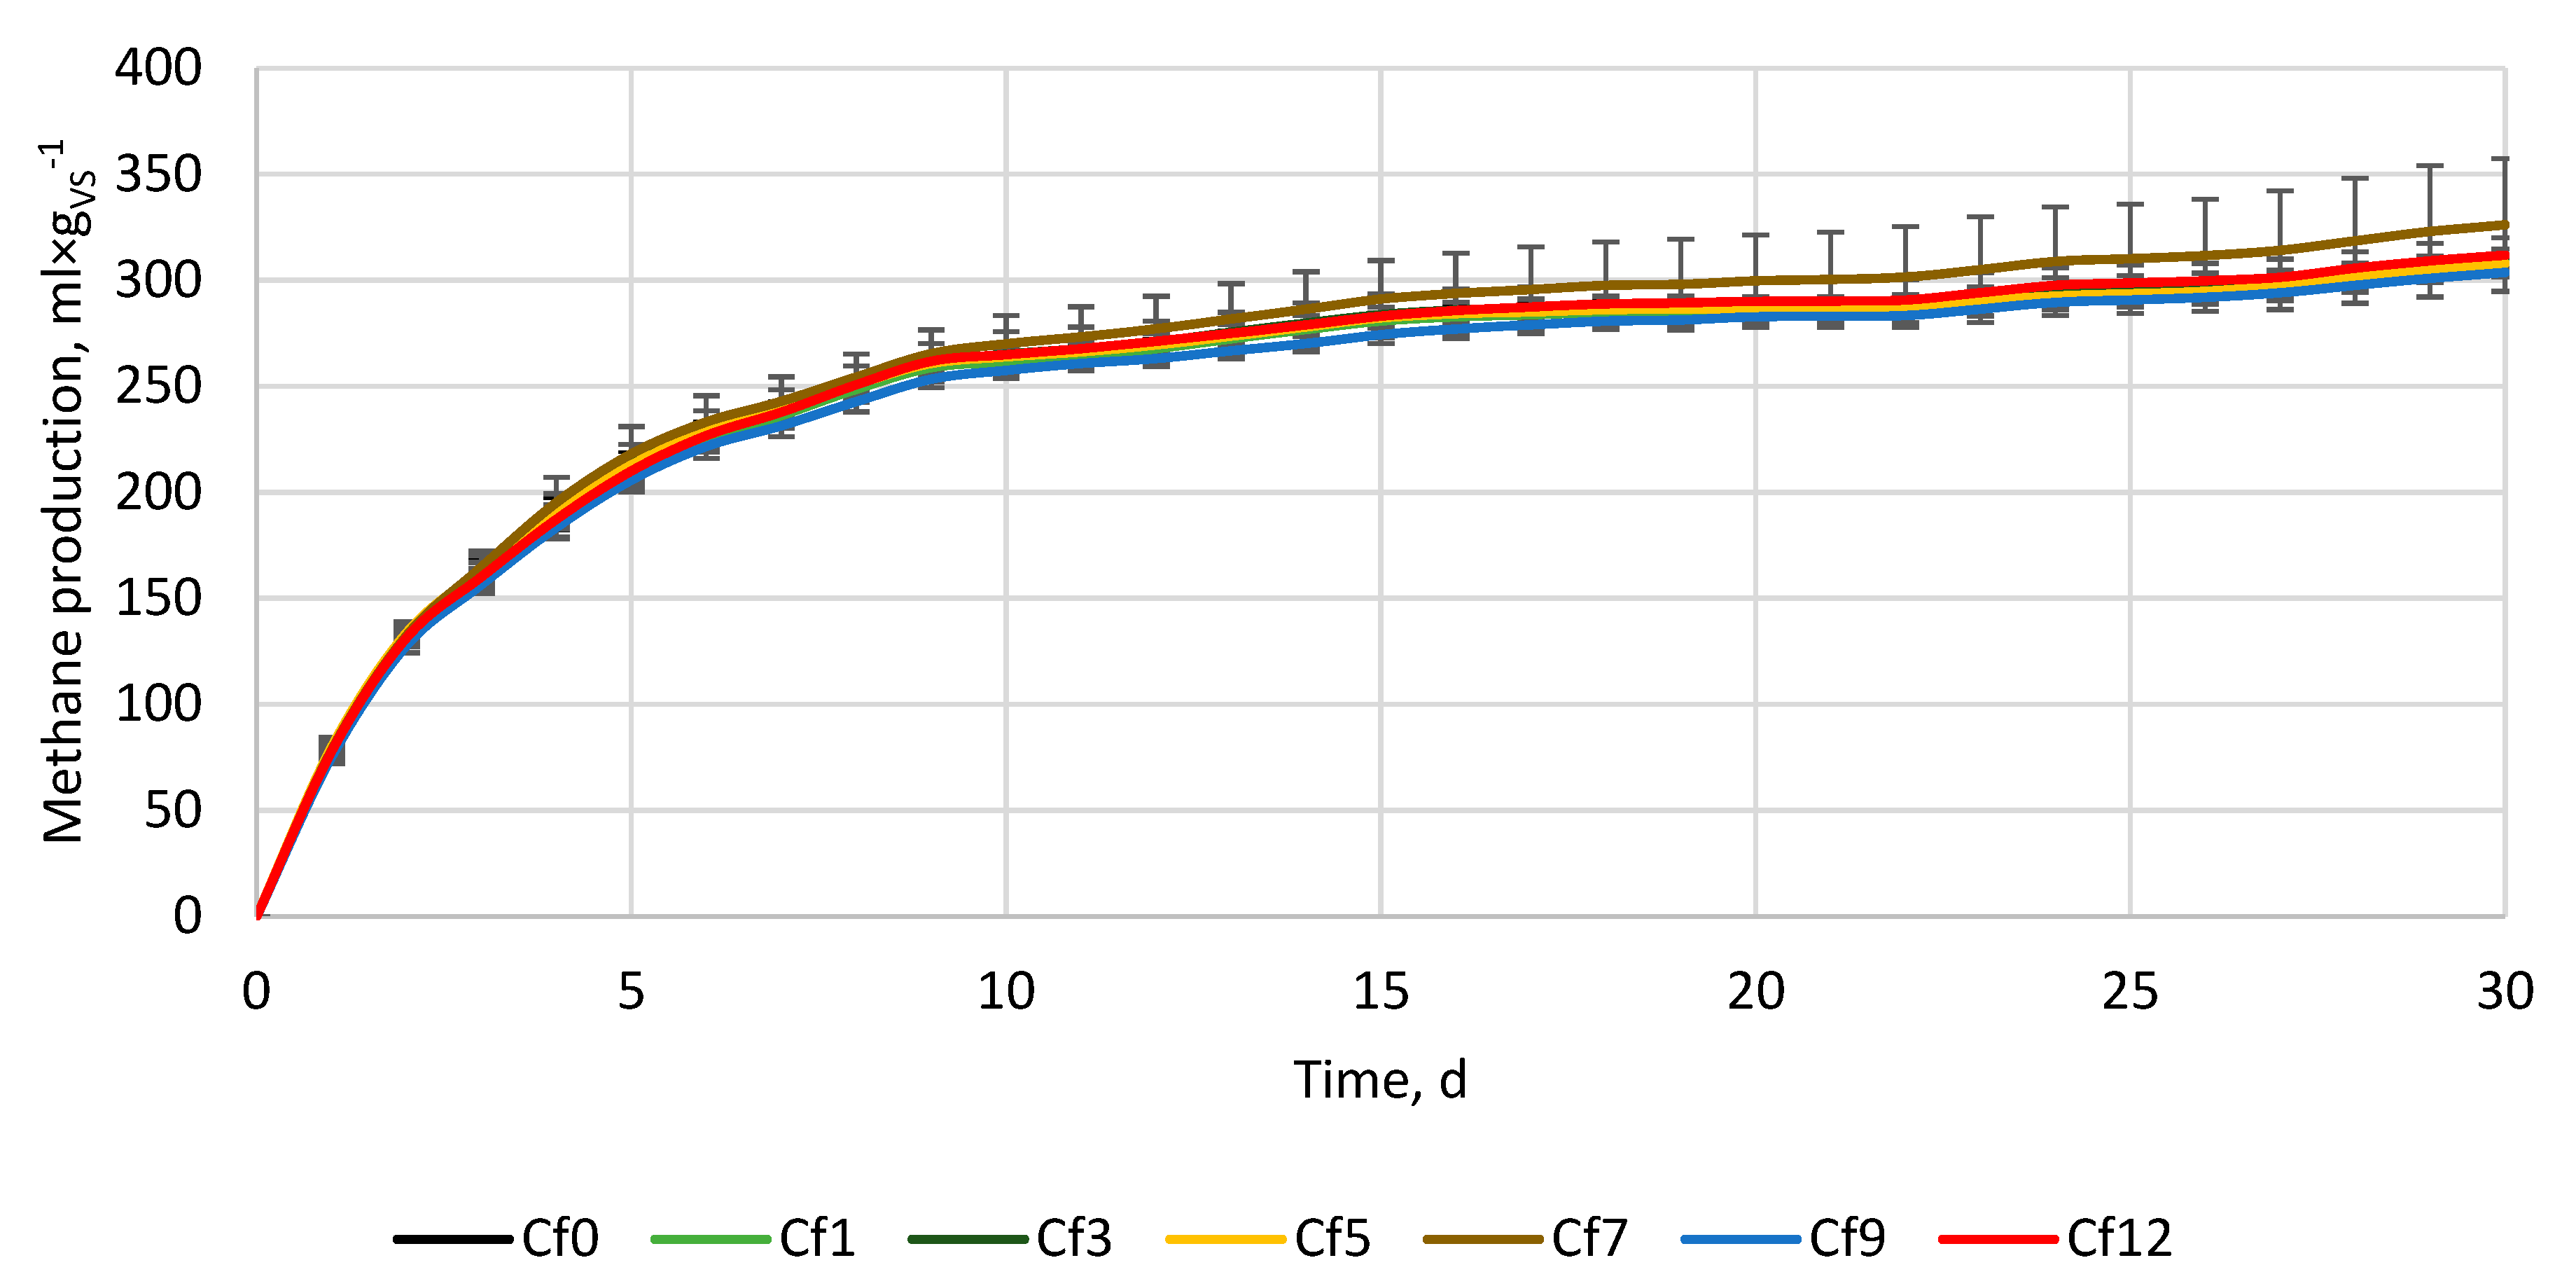
| Variant, - | ymax, ml×gvs-1 | k, d-1 | r, ml×(gvs×d)-1 | t1/2, d | BD, % | VSr, % |
|---|---|---|---|---|---|---|
| Fe0 | 383.6±2.6 | 0.07±0.00 | 26.4±1.5 | 10.1±0.5 | 62.0±2.1 | 43.0±0.9 |
| Fe1 | 389.1±9.9 | 0.07±0.00 | 28.3±0.4 | 9.5±0.4 | 63.9±1.8 | 42.6±0.6 |
| Fe3 | 403.1±9.2 | 0.08±0.01 | 31.7±1.5 | 8.8±0.6 | 68.1±0.7 | 43.6±0.5 |
| Fe5 | 360.3±1.6 | 0.08±0.00 | 29.1±1.7 | 8.6±0.5 | 60.6±2.0 | 44.2±1.9 |
| Fe7 | 373.2±0.1 | 0.08±0.00 | 29.3±0.9 | 8.8±0.3 | 62.2±0.7 | 43.4±0.7 |
| Fe9 | 383.4±4.5 | 0.07±0.00 | 26.8±0.6 | 9.9±0.1 | 61.5±1.3 | 44.3±1.5 |
| Fe12 | 378.6±5.3 | 0.07±0.01 | 27.8±1.6 | 9.5±0.7 | 61.6±0.7 | 40.7±0.7 |
| L0 | 320.2±7.2 | 0.12±0.01 | 40.1±5.2 | 5.6±0.6 | 58.8±3.3 | 44.7±0.0 |
| L1 | 305.0±2.0 | 0.11±0.01 | 33.9±3.0 | 6.3±0.5 | 54.8±1.6 | 45.6±0.8 |
| L3 | 306.6±3.0 | 0.12±0.00 | 37.2±0.6 | 5.7±0.0 | 55.9±0.8 | 45.1±1.3 |
| L5 | 315.2±5.3 | 0.11±0.01 | 35.5±1.0 | 6.2±0.3 | 56.9±0.7 | 42.9±1.1 |
| L7 | 314.4±4.9 | 0.10±0.00 | 32.3±1.1 | 6.8±0.1 | 55.6±1.7 | 44.4±0.0 |
| L9 | 329.5±13 | 0.11±0.01 | 35.5±0.8 | 6.4±0.4 | 58.9±2.3 | 44.8±0.3 |
| L12 | 316.7±0.3 | 0.10±0.01 | 32.5±2.7 | 6.8±0.6 | 56.0±1.6 | 45.2±0.1 |
| Cf0 | 298.7±1.8 | 0.24±0.01 | 71.7±2.5 | 2.9±0.1 | 61.9±0.7 | 44.7±2.1 |
| Cf1 | 296.2±2.3 | 0.24±0.01 | 70.6±2.0 | 2.9±0.1 | 61.3±0.7 | 45.6±1.0 |
| Cf3 | 299.0±6.7 | 0.24±0.00 | 72.4±2.9 | 2.9±0.0 | 61.7±1.8 | 45.1±0.4 |
| Cf5 | 296.0±2.5 | 0.25±0.01 | 73.3±1.6 | 2.8±0.1 | 61.1±0.8 | 42.9±0.8 |
| Cf7 | 312.7±6.7 | 0.22±0.00 | 69.7±2.9 | 3.1±0.0 | 64.8±6.2 | 44.4±2.4 |
| Cf9 | 292.7±1.5 | 0.23±0.01 | 68.1±2.4 | 3.0±0.1 | 60.3±0.2 | 44.8±0.7 |
| Cf12 | 300.7±2.0 | 0.23±0.00 | 70.0±1.0 | 3.0±0.0 | 62.0±0.7 | 45.2±1.5 |
| Variant, - | VS, % | C, % | H, % | N, % | S, % | O, % | AC, % | pH, - | EC, µS×cm-1 |
|---|---|---|---|---|---|---|---|---|---|
| Fe0 | 63.7±0.1 | 35.5±1.1 | 5.0±0.1 | 4.2±0.3 | 1.4±0.1 | 19.1±0.4 | 36.3±0.1 | 8.07±0.01 | 33.80±0.00 |
| Fe1 | 64.2±0.3 | 34.0±0.4 | 4.5±0.0 | 4.2±0.2 | 1.3±0.2 | 21.5±0.2 | 35.8±0.3 | 8.11±0.01 | 34.50±1.27 |
| Fe3 | 62.8±2.7 | 32.5±0.9 | 4.2±0.2 | 3.9±0.2 | 1.4±0.3 | 22.2±0.4 | 37.2±2.7 | 8.09±0.01 | 34.70±0.14 |
| Fe5 | 62.8±0.8 | 31.7±2.1 | 4.0±0.3 | 3.8±0.1 | 1.5±0.4 | 23.3±0.7 | 37.2±0.8 | 8.11±0.02 | 34.30±0.42 |
| Fe7 | 63.9±0.2 | 35.0±1.3 | 4.5±0.4 | 4.6±0.5 | 1.5±0.1 | 19.7±0.6 | 36.1±0.2 | 8.11±0.01 | 34.20±0.57 |
| Fe9 | 63.0±0.9 | 34.3±0.4 | 4.3±0.3 | 4.5±0.1 | 1.4±0.0 | 19.9±0.2 | 37.0±0.9 | 8.14±0.00 | 34.45±0.21 |
| Fe12 | 64.5±0.3 | 32.5±1.6 | 4.2±0.3 | 4.4±0.6 | 1.4±0.1 | 23.4±0.6 | 35.5±0.3 | 8.13±0.00 | 34.70±0.14 |
| L0 | 62.4±1.2 | 33.1±2.3 | 4.3±0.6 | 3.7±0.1 | 1.2±0.0 | 21.3±0.7 | 37.6±1.2 | 7.92±0.02 | 34.95±0.07 |
| L1 | 63.4±0.1 | 32.1±0.3 | 4.1±0.0 | 4.1±0.2 | 1.2±0.1 | 23.1±0.2 | 36.6±0.1 | 7.94±0.00 | 35.70±0.00 |
| L3 | 62.5±0.6 | 33.4±1.5 | 4.3±0.3 | 4.1±0.6 | 1.3±0.1 | 20.6±0.6 | 37.5±0.6 | 7.94±0.00 | 33.50±0.07 |
| L5 | 62.3±1.7 | 35.3±1.1 | 4.4±0.2 | 4.6±0.6 | 1.2±0.1 | 18.0±0.5 | 37.7±1.7 | 7.95±0.04 | 34.80±0.07 |
| L7 | 63.1±0.1 | 33.8±1.0 | 4.4±0.3 | 4.8±0.0 | 1.2±0.2 | 20.1±0.4 | 36.9±0.1 | 7.95±0.01 | 35.15±0.07 |
| L9 | 61.6±0.3 | 30.6±1.8 | 3.9±0.4 | 4.6±0.4 | 1.1±0.4 | 22.5±0.7 | 38.4±0.3 | 7.95±0.01 | 35.30±0.07 |
| L12 | 61.0±0.1 | 31.6±0.7 | 3.9±0.1 | 4.4±0.0 | 0.8±0.1 | 21.1±0.2 | 39.0±0.1 | 7.94±0.01 | 35.50±0.07 |
| Cf0 | 63.4±1.2 | 32.6±0.3 | 4.3±0.1 | 3.9±0.1 | 1.1±0.2 | 22.5±0.2 | 36.6±1.2 | 7.92±0.02 | 34.95±1.06 |
| Cf1 | 63.8±1.1 | 32.3±0.5 | 4.2±0.2 | 4.1±0.0 | 1.2±0.1 | 23.1±0.2 | 36.2±1.1 | 7.94±0.02 | 35.70±0.14 |
| Cf3 | 63.6±1.6 | 32.5±2.6 | 4.3±0.6 | 4.0±0.4 | 1.1±0.0 | 22.8±0.9 | 36.4±1.6 | 7.94±0.03 | 33.50±0.78 |
| Cf5 | 63.6±2.2 | 31.7±5.1 | 4.1±1.0 | 4.2±0.3 | 1.0±0.1 | 23.6±1.6 | 36.4±2.2 | 7.95±0.01 | 34.80±0.99 |
| Cf7 | 63.7±1.5 | 30.5±0.7 | 4.1±0.2 | 4.7±0.3 | 1.0±0.0 | 24.4±0.3 | 36.3±1.5 | 7.95±0.03 | 35.15±0.49 |
| Cf9 | 62.8±0.9 | 31.7±0.1 | 4.2±0.0 | 4.6±0.2 | 1.1±0.1 | 22.3±0.1 | 37.2±0.9 | 7.95±0.04 | 35.30±0.57 |
| Cf12 | 62.1±1.3 | 32.0±0.2 | 4.0±0.1 | 4.4±0.3 | 1.0±0.1 | 21.8±0.2 | 37.9±1.3 | 7.94±0.01 | 35.50±2.33 |
| Share, % | Fe | Co | Mo | Se | W | Cu | Zn | Mn |
|---|---|---|---|---|---|---|---|---|
| Fe0 | 3300±500 | 1.5±0.3 | 1.6±0.3 | < 5.0 | < 5.0 | 27.5±5.5 | 210±40 | 99±20 |
| Fe1 | 3350±500 | 1.6±0.3 | 1.2±0.2 | < 5.0 | < 5.0 | 25.5±5.5 | 195±40 | 87±18 |
| Fe3 | 5400±800 | 2.2±0.5 | 1.6±0.3 | < 5.0 | < 5.0 | 28.5±5.5 | 220±45 | 96±19 |
| Fe5 | 5650±850 | 2.2±0.5 | 1.8±0.4 | < 5.0 | < 5.0 | 28.5±6.0 | 215±40 | 96.5±19 |
| Fe7 | 6950±1050 | 2.8±0.6 | 2.9±0.6 | < 5.0 | < 5.0 | 31.5±3.0 | 230±45 | 102±19 |
| Fe9 | 6400±950 | 2.6±0.5 | 1.4±0.3 | < 5.0 | < 5.0 | 26.5±5.0 | 200±40 | 86±17 |
| Fe12 | 8650±1300 | 3.3±0.7 | 2.0±0.4 | < 5.0 | < 5.0 | 31.5±6.5 | 240±50 | 104±35 |
| L0 | 3500±550 | 1.5±0.3 | 1.7±0.3 | < 5.0 | < 5.0 | 31.0±6.0 | 190±40 | 100±30 |
| L1 | 3550±550 | 1.7±0.3 | 2.2±0.5 | < 5.0 | < 5.0 | 30.0±6.0 | 200±40 | 97±19 |
| L3 | 3350±500 | 1.4±0.3 | 2.3±0.5 | < 5.0 | < 5.0 | 28.5±5.5 | 180±35 | 96±29 |
| L5 | 3150±450 | 1.3±0.3 | 1.9±0.4 | < 5.0 | < 5.0 | 27.0±5.5 | 175±35 | 92±18 |
| L7 | 3800±550 | 2.1±0.4 | 2.1±1.8 | < 5.0 | < 5.0 | 33.5±6.5 | 195±40 | 104±20 |
| L9 | 3550±550 | 1.6±0.3 | 2.3±0.5 | < 5.0 | < 5.0 | 30.5±6.0 | 205±40 | 103±19 |
| L12 | 3500±500 | 1.6±0.3 | 2.2±0.5 | < 5.0 | < 5.0 | 29.5±6.0 | 195±40 | 97±19 |
| Cf0 | 3520±520 | 1.5±0.5 | 1.6±0.6 | < 5.0 | < 5.0 | 29.3±7.5 | 200±45 | 99±25 |
| Cf1 | 3450±520 | 1.6±0.6 | 1.7±0.7 | < 5.0 | < 5.0 | 27.0±8.5 | 198±55 | 93±35 |
| Cf3 | 3250±650 | 1.8±0.6 | 1.9±0.6 | < 5.0 | < 5.0 | 28.5±8.5 | 200±50 | 97±30 |
| Cf5 | 3400±650 | 1.7±0.6 | 1.8±0.5 | < 5.0 | < 5.0 | 27.75±8 | 195±50 | 94±30 |
| Cf7 | 3680±800 | 2.4±0.5 | 2.5±1.2 | < 5.0 | < 5.0 | 32.5±7.5 | 213±45 | 103±30 |
| Cf9 | 3530±750 | 2.1±0.5 | 1.8±0.4 | < 5.0 | < 5.0 | 28.5±8.0 | 203±50 | 94±30 |
| Cf12 | 3520±900 | 2.5±0.6 | 2.1±0.6 | < 5.0 | < 5.0 | 30.5±8.0 | 218±50 | 100±30 |
Disclaimer/Publisher’s Note: The statements, opinions and data contained in all publications are solely those of the individual author(s) and contributor(s) and not of MDPI and/or the editor(s). MDPI and/or the editor(s) disclaim responsibility for any injury to people or property resulting from any ideas, methods, instructions or products referred to in the content. |
© 2023 by the authors. Licensee MDPI, Basel, Switzerland. This article is an open access article distributed under the terms and conditions of the Creative Commons Attribution (CC BY) license (http://creativecommons.org/licenses/by/4.0/).


