Introduction
Handwriting is a potential instrument for physiologic identification modalities such as DNA and fingerprints[
1]. In document forensics, handwriting and ink are regarded as key indicators for spotting forgeries [
2]. Because of the digitization of documents, the widespread use of hand-held mobile devices, and the development of better sensors and processing algorithm, automated forgery detection in document images has rapidly evolved[
3,
4]. In recent year, researchers have been interested in using hyperspectral images for ground-based uses because they have a lot of information in them[
4]. Hyperspectral imaging is an advanced spectral detection technique that provides extensive spectral information regarding the underlying material. In remote sensing, art conservation and archaeology, artwork authentication, forensic science, image-guided surgery and medical diagnosis, crime scene analysis, food quality control, and defense and homeland security, hyperspectral imaging is widely employed [
5]. Hyperspectral images contain multiple spectral bands that are beneficial for the automatic detection of ink mismatch [
6]. The use of HSI analysis in forensic science has increased because it gives forensic analysts the ability to observe and analyze a wider range of forensic traces, including fingerprints, inks, bloodstains, hair, narcotics, etc. [
7]. On the premise of spectral signature, inks can be utilized for a variety of purposes, including forgery, ink aging, and fraudulent document creation. It is predicated on the hypothesis that the forged document was written with a different ink or with a different pen. Ink mismatch also plays a crucial role in the substantiation of bank checks, university degree evaluations, and various government documents. For a number of years, researchers have proposed various techniques for detecting mismatched ink using HSI and multispectral images [
8].
There are two primary methods for validating documents and distinguishing ink: destructive and nondestructive examinations. In a destructive method, chemical analysis techniques such as Thin-Layer Chromatography (TLC) are used to separate the various components of a mixture of ink [
8,
9]. The destructive method has various disadvantages, including the inability to recover damage to the document. It takes time since several measurements must be taken. HSI, on the other hand, is a reliable approach for non-destructive and non-contact forensic document inspection. HSI is a method that combines imaging and spectroscopy [
10,
11]. In this method, each image is captured at a narrow band of the electromagnetic spectrum in order to collect precise spectral data. Thus, HSI reveals the invisible details of an image without interacting with it directly. Consequently, non-destructive methods are preferred [
8].
Easton et al. [
12] delivered one of the foundational contributions in multispectral imaging. Christens-Barry et al. [
13] developed the Eureka Vision spectral imaging framework. Forensic professionals in the field of ink investigation can benefit from such frameworks. It is time-consuming to investigate ink utilizing a band-by-band assessment of multi spectral pictures by eye review. The analyst must physically observe it under each frequency of light. The National Archives of the Netherlands developed an advanced and complex HSI system for forensic document examination [
14]. It produced images with great spatial and spectral resolution that were collected across the spectral spectrum (from near UV to IR). However, capturing such forensic records requires about fifteen minutes of exposure. This HSI system was quite strong, but its considerable acquisition time limited its application. Morales et al. [
15] Proposed employing Least Square SVM classification for ink analysis in pen verification and handwritten documents. Silva et al. [
16] created a non-destructive method for detecting fraud in documents using various chemometric techniques. Khan et al. [
17] suggested a combined sparse band selection-based hyperspectral imaging document analysis technique to differentiate distinct metameric inks. However, because this work assumes equal ink proportions for conducting trials, highly disproportionate cases were less recognizable and had low accuracy, limiting its applicability in most practical cases. Abbas et al. [
18] presented hyper spectral unmixing for detecting ink mismatches. Our primary goal is to separate visually similar inks that have been combined in varying proportions to create an unbalanced clustering problem. Hedjam et al. [
19] suggested a mathematical technique for improving the meaning of severely disintegrated text. Several strategies for identifying ink mismatches based on HSI inspection have been proposed in the last decade. Fuzzy c-means clustering [
10], k-means clustering [
11], localized hyper spectral image analysis [
20], and deep convolutional network [
21] are among the approaches used. Jaleed et al. [
10] proposed a multi spectral image analysis-based automatic ink mismatch detecting technique. Local thresholding and Fuzzy C-Means Clustering (FCM) are used to segment ink pixels. Khurshid et al. [
22] suggested a CNN-based ink mismatch detection approach for HSDIs that classifies ink pixels using a combination of spectral and spatial information.
This article used K-means Clustering technique for the automatic detection of ink discrepancy.K-means is an algorithm for partitional clustering. It divides the total number of samples into k distinct groups with the restriction that the number of samples cannot exceed the number of groups. This method employs unsupervised learning techniques that identify similar subgroups in the data and then aggregate similar data based on their similarity, intensity, or other characteristics.
Dataset description
In this study, a dataset of hyperspectral images of 54 individuals' handwriting samples is utilized. Islam et al. [
3] proposed this dataset (iVision HHID). One image from given dataset is used for this research. Each hyperspectral cube in the dataset has an image size of 512*650 pixels and comprises 149 spectral channels between 478 and 900 nm. All of the individuals have distinct personalities and writing styles. Each individual's age and gender information is given in this dataset. This dataset consists of the sample handwritten by each author using one of six distinct pens. Each pen is used to write two sentences of the text “A quick brown fox jumps over the lazy dog”. This sentence is written in either black or blue ink on a hyper spectral image. In addition, each pen originates from a different manufacturer, resulting in pigment variations despite having the same color on the outside. The dataset image is shown in Figure 1.
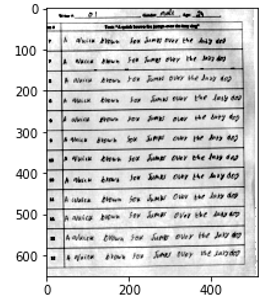
Image for iVision dataset; Images for Ist, 30th, 60th and 145th channel is shown in Figure 2.
Methodology
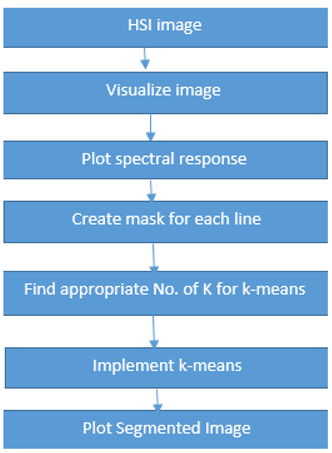
As shown in Figure 1, there are 12 lines in image. One line is considered as a single unit. Firstly we plot spectral responses for each line against wavelengths. Then we create mask for each line to separate foreground and background pixels. After implementing mask, k-means is implemented to extract number of inks used in document. Flow chart diagram for this research is shown in Figure 3.
The data collection is divided into clusters (or subsets) using the unsupervised clustering technique. One of the most effective unsupervised algorithms is K-means clustering. It requires less computation because it is straightforward. It divides the data into k clusters, where k is the required initial cluster assignment. Since it is an unsupervised technique, it is utilized when unlabeled data that lacks ground truth is accessible.
The clustering algorithm minimizes the squared error between the centroid of a cluster and its members. This indicates that the k-means algorithm attempts to optimize the objective function depicted in equation 1. The algorithm will always converge if each iteration results in a better solution. The number of clusters is proportional to the number of mixed inks. The number of clusters chosen is critical to accurate segmentation.
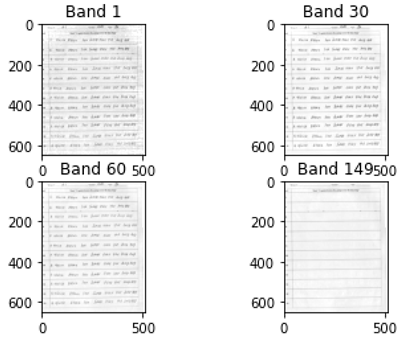
Grayscale image for 1st, 30th, 60th and 145th band
However, using k-means, we are unable to detect the precise number of inks. As a result, we employ the k-means with elbow method[
23].In the elbow approach, provide the explained variation of the clusters function to obtain the elbow and ideal number of clusters. If we increased the number of clusters and improved the explained variation. If we couldn't discover an elbow and had to overfit, we used the point-to-line distance formula. We locate the needed projection point on the provided line. The longest distance told elbow. The Pinitial and Pend distances are cluster distances.
We used a different method K-means clustering with silhouette method[
24]. The silhouette value measures how similar a point is to its own cluster and how distinct it is from other clusters. Its range is -1 to 1, where a negative value indicates the point was assigned the incorrect cluster and a positive value indicates the point was assigned its own cluster.
Results and Discussion
The dataset used for this study has a image size of of 512*650 pixels and comprises 149 spectral channels between 478 and 900 nm. This document is written in either black or blue ink and its image is captured in 149 channels. Firstly we plot spectral response of each line against which is shown in Figure 4. As we can see in image, reflectance for inks is lower in smaller wavelengths as compared to longer wavelengths. Reflectance for inks is higher for longer wavelengths.
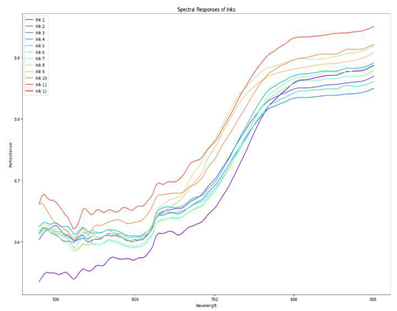
Spectral response for each line against wavelengths
Then, we create mask for each line to separate out foreground and background pixels. Grayscale image after implementation of mask is shown in Figure5. After implementing mask, we implemented K-means unsupervised learning to detect number of possible inks used in this document.
To detect appropriate number of clusters, we used Elbow and silhouette method. The elbow technique performs k-means clustering on the data set for a range of k values, then computes an average score for all clusters for each value of k. When the total metrics for each model are shown, the best value for k may be visually determined. If the line chart resembles an arm, the optimal value of k is the "elbow" (the point of inflection on the curve). Having a silhouette coefficient (another name for this number) close to +1 indicates that the sample is geographically isolated from any nearby clusters. Negative numbers suggest that the sample may have been incorrectly assigned to a cluster, whereas a value of 0 indicates that the sample is on or very close to the decision boundary between two neighboring clusters. Results for these two methods is shown in figure 5. By comparing results, we determine 6 clusters for this study.
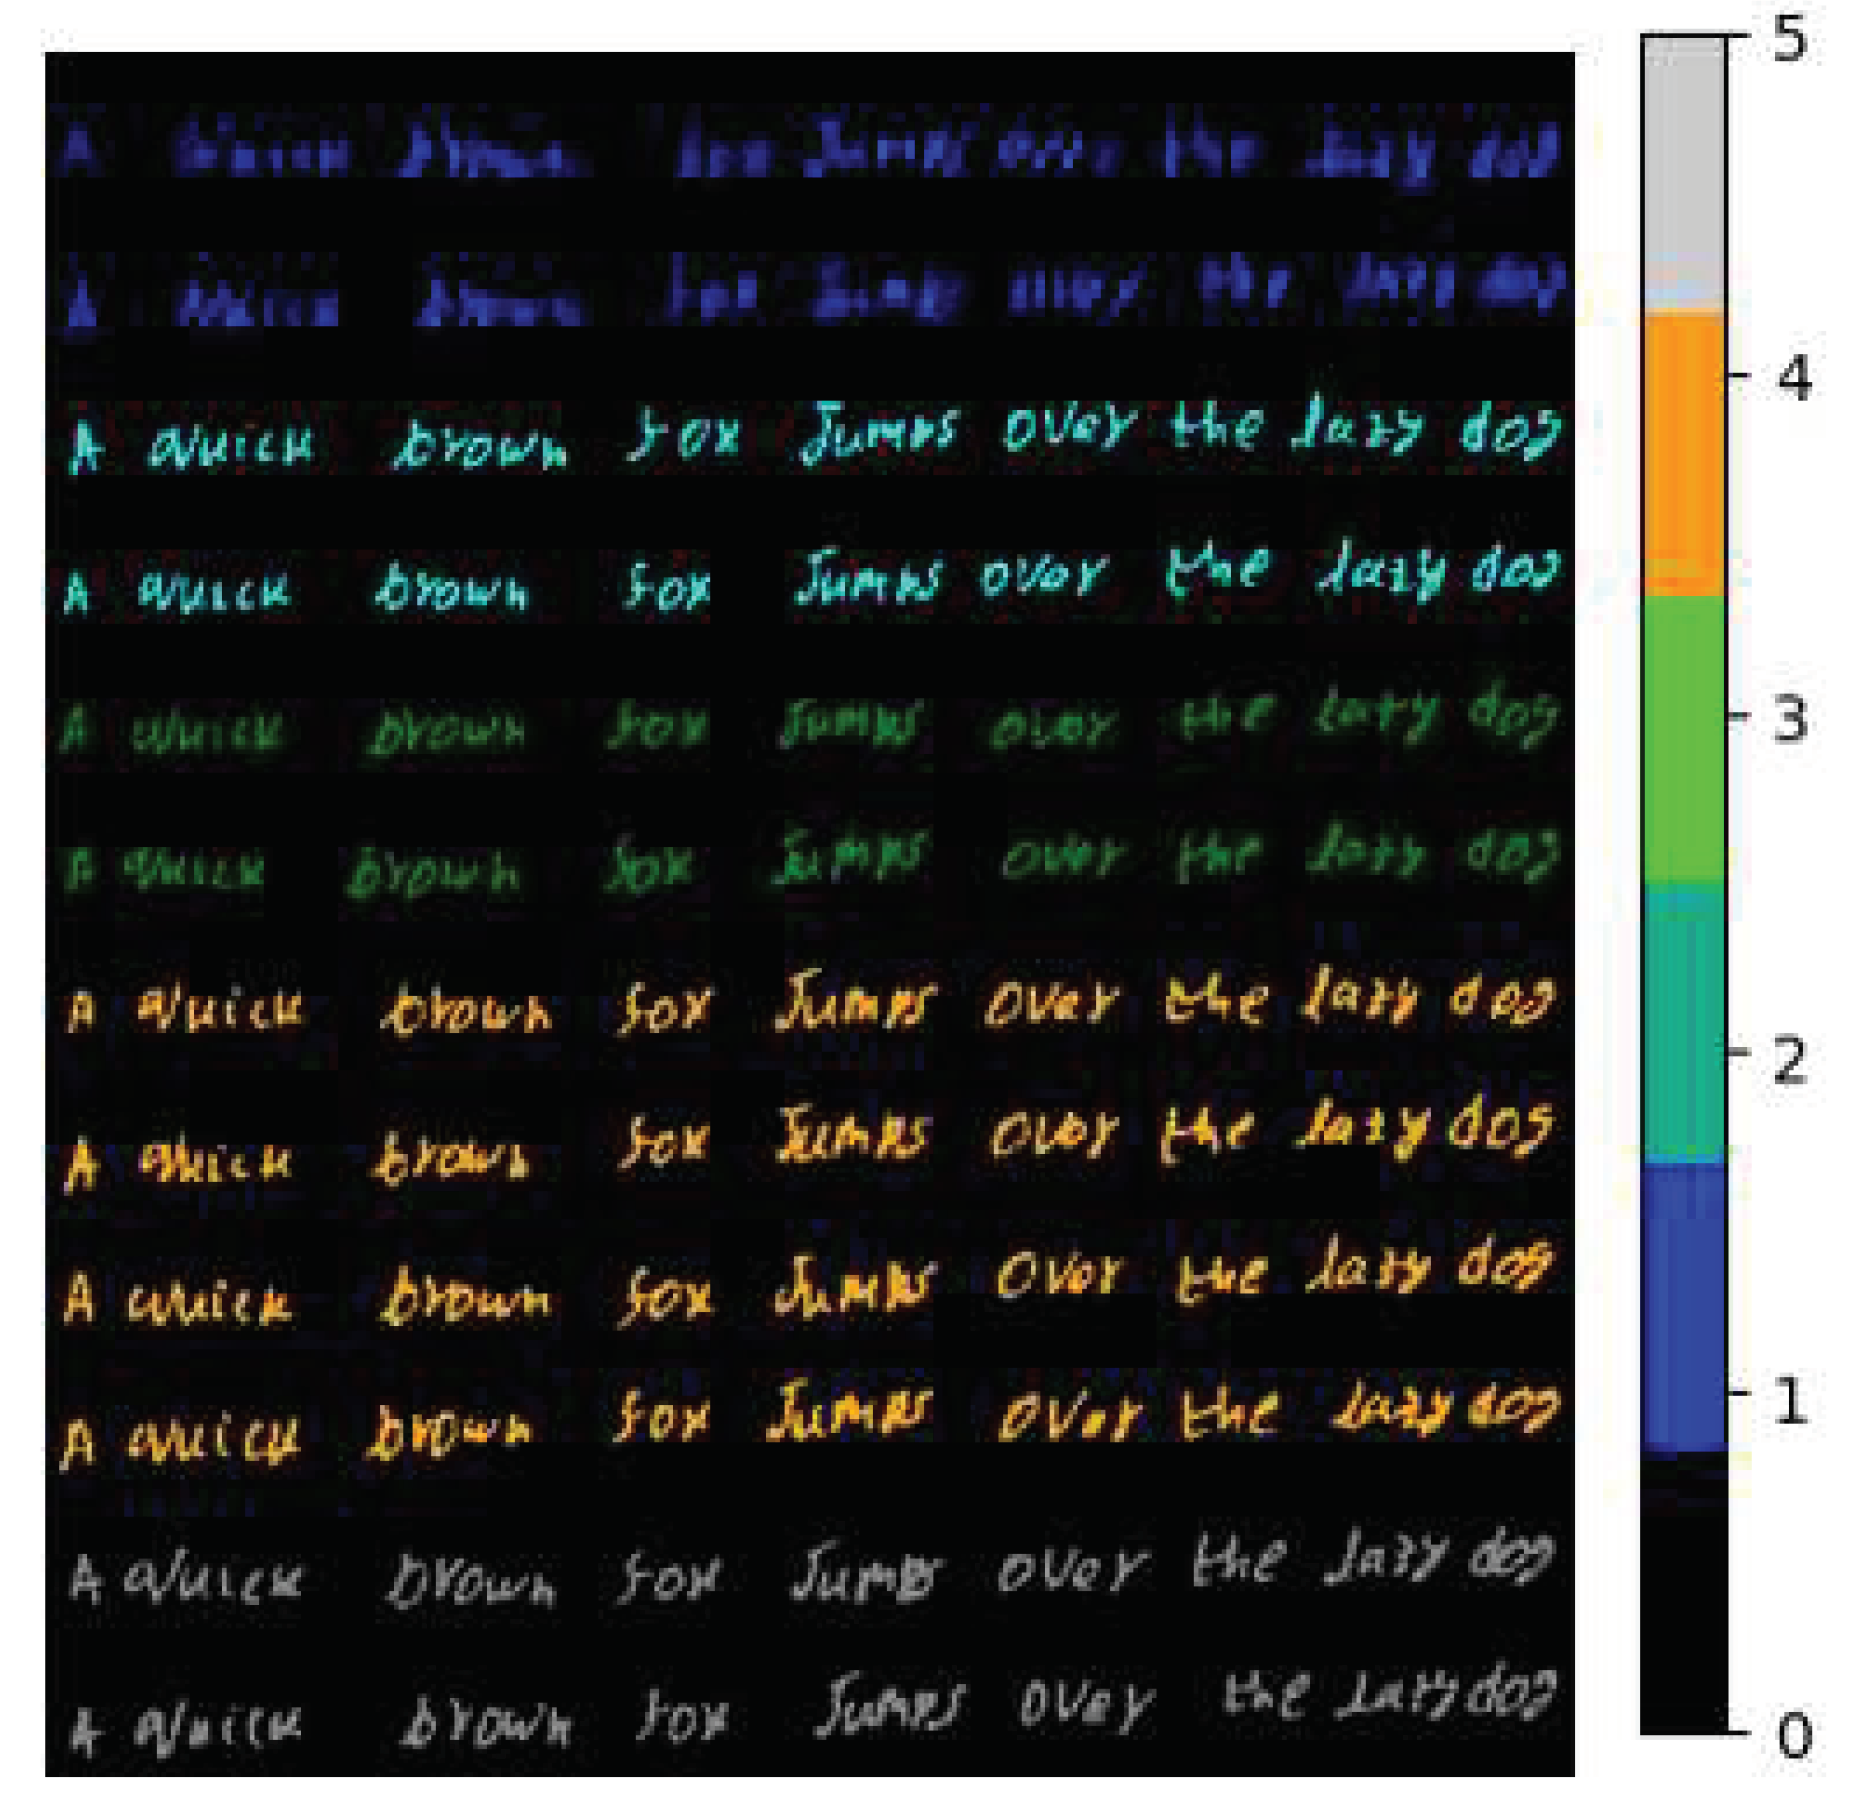
After implementing K-means, document image is segmented into 6 clusters. Finally segmented map is shown in figure 6. As we can see there are 5 inks extracted in written document. One cluster is created for background.
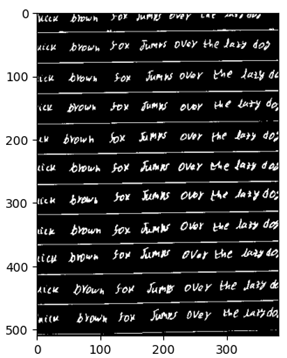
Masked image
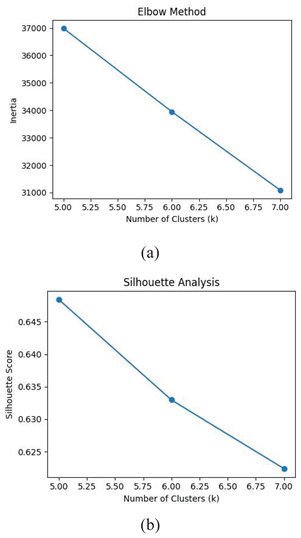
(a) Elbow Method result (b) Silhouette result.
Scheme 4.
there is too much intra class similarity between inks. So, we should adopt methodology preprocess data to reduce intra class similarity. We will implement different Deep learning and Generic algorithm techniques for automatically extraction of inks.
Scheme 4.
there is too much intra class similarity between inks. So, we should adopt methodology preprocess data to reduce intra class similarity. We will implement different Deep learning and Generic algorithm techniques for automatically extraction of inks.
References
- Saks, M. Commentary on: Srihari SN, Cha S-H, Arora H, Lee S. Individuality of handwriting. J Forensic Sci 2002; 47(4):856-72. J. Forensic Sci. 2003, 48, 916–918. [Google Scholar] [CrossRef] [PubMed]
- Islam, U.; Khan, M.J.; Asad, M.; Khan, H.A.; Khurshid, K. iVision HHID: Handwritten hyperspectral images dataset for benchmarking hyperspectral imaging-based document forensic analysis. Data Br. 2022, 41, 107964. [Google Scholar] [CrossRef]
- Qureshi, R.; Uzair, M.; Khurshid, K.; Yan, H. Hyperspectral document image processing: Applications, challenges and future prospects. Pattern Recognit 2019, 90, 12–22. [Google Scholar] [CrossRef]
- Islam, U.; Khan, M.J.; Khurshid, K.; Shafait, F. Hyperspectral Image Analysis for Writer Identification using Deep Learning. In 2019 Digital Image Computing: Techniques and Applications (DICTA), 2019, pp. 1–7. [CrossRef]
- Khan, M.J.; Khurshid, K.; Shafait, F. A Spatio-Spectral Hybrid Convolutional Architecture for Hyperspectral Document Authentication. In 2019 International Conference on Document Analysis and Recognition (ICDAR), 2019, pp. 1097–1102. [CrossRef]
- Bilal, M.; Ahmad, H.; Ali, K. Ink Classification in Hyperspectral Images. 2020. [CrossRef]
- Khan, M.J. Deep learning for automated forgery detection in hyperspectral document images. J. Electron. Imaging 2018, 27, 1. [Google Scholar] [CrossRef]
- Saeed, S.; Raza, R.; Sharif, R. Ink detection using K-Mean clustering in hyperspectral document. Preprints 2020, 2–5. [Google Scholar] [CrossRef]
- Shah, N.R.; Talha, M.; Imtiaz, F.; Azmat, A. Automatic Ink Mismatch Detection in Hyper Spectral Images Using K-means Clustering. 2020.
- Aginsky, V.N. Forensic Examination of ‘Slightly Soluble’ Ink Pigments Using Thin-Layer Chromatography. J. Forensic Sci. 1993, 38, 1131–1133. [Google Scholar] [CrossRef]
- Khan, M.J.; Yousaf, A.; Khurshid, K.; Abbas, A.; Shafait, F. Automated Forgery Detection in Multispectral Document Images Using Fuzzy Clustering. In 2018 13th IAPR International Workshop on Document Analysis Systems (DAS), 2018; pp. 393–398. [CrossRef]
- Khan, Z.; Shafait, F.; Mian, A. Hyperspectral Imaging for Ink Mismatch Detection. In 2013 12th International Conference on Document Analysis and Recognition, 2013; pp. 877–881. [CrossRef]
- Easton, R.L.; Knox, K.T.; Christens-Barry, W.A. Multispectral imaging of the Archimedes palimpsest. In 32nd Applied Imagery Pattern Recognition Workshop, 2003. Proceedings., 2003; pp. 111–116. [CrossRef]
- Christens-Barry, W.; Boydston, K.; France, F.; Knox, K.; Toth, M. Camera system for multispectral imaging of documents. Proc. SPIE - Int. Soc. Opt. Eng. 2009. [Google Scholar] [CrossRef]
- Padoan, R.; Steemers, A.; Klein, M.; Aalderink, B.; de Bruin, G. Quantitative hyperspectral imaging of historical documents: technique and applications. 2008.
- Morales, *!!! REPLACE !!!*; Ferrer, M.A.; Diaz-Cabrera, M.; Carmona, C.; Thomas, G.L. Morales; Ferrer, M.A.; Diaz-Cabrera, M.; Carmona, C.; Thomas, G.L. The use of hyperspectral analysis for ink identification in handwritten documents. In 2014 International Carnahan Conference on Security Technology (ICCST), 2014, pp. 1–5. [CrossRef]
- Silva, C.S.; Pimentel, M.; Honorato, R.; Pasquini, C.; Montalbán, J.P.; Ferrer, A. Near Infrared Hyperspectral Imaging for forensic analysis of document forgery. Analyst 2014, 139. [Google Scholar] [CrossRef]
- Khan, Z.; Shafait, F.; Mian, A. Automatic ink mismatch detection for forensic document analysis. Pattern Recognit. 2015, 48, 3615–3626. [Google Scholar] [CrossRef]
- Abbas, A.; Khurshid, K.; Shafait, F. Towards Automated Ink Mismatch Detection in Hyperspectral Document Images. 2017. [CrossRef]
- Hedjam, R.; Cheriet, M.; Kalacska, M. Constrained Energy Maximization and Self-Referencing Method for Invisible Ink Detection from Multispectral Historical Document Images. In 2014 22nd International Conference on Pattern Recognition, 2014, pp. 3026–3031. [CrossRef]
- Luo, Z.; Shafait, F.; Mian, A. Localized forgery detection in hyperspectral document images. 2015, 496–500. [CrossRef]
- Khan, J.; Yousaf, A.; Abbas, A.; Khurshid, K. Deep Learning for Automated Forgery Detection in Hyperspectral Document Images. J. Electron. Imaging 2018, 27, 53001. [Google Scholar] [CrossRef]
- Thorndike, R.L. Who belongs in the family? Psychometrika 1953, 18, 267–276. [Google Scholar] [CrossRef]
- Rousseeuw, P.J. Silhouettes: A graphical aid to the interpretation and validation of cluster analysis. J. Comput. Appl. Math. 1987, 20, 53–65. [Google Scholar] [CrossRef]
|
Disclaimer/Publisher’s Note: The statements, opinions and data contained in all publications are solely those of the individual author(s) and contributor(s) and not of MDPI and/or the editor(s). MDPI and/or the editor(s) disclaim responsibility for any injury to people or property resulting from any ideas, methods, instructions or products referred to in the content. |
© 2023 by the authors. Licensee MDPI, Basel, Switzerland. This article is an open access article distributed under the terms and conditions of the Creative Commons Attribution (CC BY) license (http://creativecommons.org/licenses/by/4.0/).


