Preprint
Article

Study on the Stress and Deformation Characteristics of Shield Tunneling Through Mining Tunnel Structure

Altmetrics

Downloads

123

Views

36

Comments

0

This version is not peer-reviewed

Submitted:

14 June 2023

Posted:

14 June 2023

You are already at the latest version

Alerts
Abstract
In the construction of shield crossing existing mined tunnel without load, it is imperative to develop corresponding design standards that reflect actual engineering force characteristics to ensure the successful completion of tunnel construction. This research uses The MIDAS-GTS finite element software to facilitate the creation of a numerical model of the shield structure for an air-push-over mine tunnel project in Changsha, China, investigating the stress field’s evolution during shield construction, and calculating the maximum positive and negative bending moments and maximum axial forces for different structures and other force states under various construction conditions. This study's findings informed the design and construction optimisation of the shield tunnelling empty-push method. The outcomes of this numerical simulation led to several key findings: (1) The soil density exerted a significantly greater impact on the internal forces of the initial support structure than both the tunnel depth and soil Poisson's ratio. Additionally, a sudden shift in internal forces occurred within the 300-350 mm range when the lining thickness was altered. (2) Factors such as the tunnel depth, soil density, soil Poisson's ratio μ, and lining thickness have a similarly influenced internal forces of the segment and the initial support. Notably, the backfill layer thickness significantly affected the segment’s maximum axial force causing an abrupt change of approximately 300 mm. (3) Under the shield machine equipment’s weight constraint, it is essential to control the guide rail’s thickness, to prevent it from becoming overly large.
Keywords: 
Subject: Engineering  -   Civil Engineering

1. Introduction

Urban subway tunnels predominantly comprise shallow structures that traverse bustling city districts. The use of shield tunnelling methods during construction can effectively minimise the impact on ground surfaces. However, in the face of challenging geological conditions, such as hard rock, boulders, anchor cables, and varied layers of hardness and softness, shield tunnelling technology in China has not fully matured. As a result, employing the shield tunnelling in these circumstances may expedite tool wear, diminish excavation speed, and necessitate more frequent tool replacements. This could lead to increased engineering costs and elevated safety risks. Considering these problems, it is prudent to consider a combined construction approach that integrates mining and shield tunnelling methods.
As the complexity of urban subway construction increases, new technical development demands have been raised for shield tunnelling construction. Research on the construction technology of shield tunnelling empty-pushing using mining method has also made significant progress in China. In terms of construction technology research, as urban subway construction becomes increasingly challenging, new technological development requirements have been proposed for the shield construction process. In China, shield tunnelling empty-pushing construction using the mining method has made significant progress. Regarding construction technology research, Bi et al. [1] optimised the construction scheme for the large-diameter shield tunnelling empty-pushing mining method in local hard rock sections, such as weathered mudstone formations, by analysing the construction quality. Erharter, G.H. et al [2] studied the friction coefficient for tunnel boring machine excavation planning by shearing rock specimens with different lithology to optimise the construction parameters of the shield in terms of friction. Choi, WY. et al [3] experimentally evaluated the waterproofing performance of five sealant installation methods based on the type and number of layers of sealant, using a waterproofing performance test to determine the relative waterproofing performance of the tunnel tube sheets. Li [4] introduced a novel technique for slope-filled pea gravel at the interface section of a mining tunnel, ensuring safe entry for shield machines. Meanwhile, Hong et al. [5] devised a hydraulic-based shield machine translation and shield-driving integrated device. This device amalgamates translation and shield-driving processes, achieving a cohesive shield machine translation and shield-driving technology. B.T. Le et al [6] proposed an equation describing the relationship between volume loss and liquefaction potential index by monitoring field data obtained during the construction of the Binh Thanh-Su Tien tunnel on line 1 of the Ho Chi Minh City metro in Vietnam, which was used in practice as an indicator of potential large settlements caused by EBP tunnel boring machines in sandy soils. Jie et al. [7] examined the performance of blades made from 42CrMo low-alloy steel post different heat treatments, contributing valuable insights for fault prevention and cost reduction in shield machines. Numerous researchers domestically and internationally [8,9,10] have pioneered key construction technologies by modifying the shield machine construction methods and overcoming the technical difficulties of shield machine construction under diverse geological conditions. Regarding numerical simulation and analysis, M.D. Goel et al [11] carried out a finite element analysis of shallow tunnels exposed to blast inside a tunnel, comparing the damage to the tunnel superstructure and the change in tunnel cross-sectional shape under internal blast loading. Wang [11] offered a reference for assembly construction technology within the mining method by carrying out full-scale experiments and numerical simulation, the context of single-line railway tunnel construction. Md Shariful Islam et al [12] used MIDAS GTS NX to carry out 3D finite element numerical simulations to optimise the geometric parameters and construction sequence of the twin tunnels to help the designers control the settlement caused during the excavation of the back-loaded twin tunnels. Fang et al. [13] suggested a modelling method based on the coupled finite difference and discrete element methods, simulating the interaction between the shield machine and the layered rock mass. they further discussed the progressive failure mechanism of a layered rock mass. Xu et al. [14] developed a predictive model for the geological conditions of very-large-diameter SPBM tunnels . They augmented the available geological information by comparing the predictive efficacy of various machine learning algorithms, thereby allowing the construction team to swiftly adjust tunnel parameters and diminish construction risks. Hussaine S.M. et al [15] used the open-source AutoML framework to construct different machine learning models to predict the maximum ground settlement when shield tunnels are constructed on soft subsoil, with advantages in terms of prediction accuracy. Chen et al. [16] formulated a hybrid prediction dataset that incorporated geological and tectonic parameters. They based this on sampling methods using spatial and time series to obtain an approximate range of subsidence with the aim of reducing the potential damage the project might inflict on the surrounding environment. Wang et al [17] combined with engineering examples, applied the Matlab program of BP neural network based on genetic algorithm to achieve relatively efficient construction feedback through forward analysis of construction parameters, which can effectively improve the response efficiency of unexpected conditions in the construction process. Many scholars [18,19,20,21,22,23,24,25] have used finite element numerical simulation, machine learning method comparison and genetic algorithms to perform numerical modelling of shield tunnelling under special external loads, investigating the deformation characteristics and mechanisms of tunnel structures. The results of the digital modelling are used to predict changes in construction conditions, optimize construction parameters and control construction quality.
In conclusion, domestic research on shield machine empty-pushing through mining method in tunnel construction has primarily focused on aspects such as construction technology, quality control, and monitoring and measurement techniques. However, research contributions in structural stress and design are somewhat limited. In practical scenarios, as tunnelling projects progress, frequent stress disturbances occur within the structure. This results in substantial changes in the internal forces of the tunnel structure, which often fluctuate under varying building conditions. During the construction of a mine method tunnel project, the internal force fluctuations can exceed their limits, leading to potential failure or even collapse, of the existing structure. This poses risks to buildings surrounding the metro line and complicates tunnel construction. Ensuring safety through excessive building measures would inflate the project's cost. By studying the alternations in stresses within the tunnel structure in the current project situation, we can clarify the range and trend of potential stresses during construction . This facilitates the optimisation of the design criteria for the initial support and detailed structures such as tube sheeting, thereby achieving a balance between economic efficiency and safety. MIDAS-GTS software has a rich interface for importing solid files in various formats for collaborative structural and geotechnical analysis. Thus, in comparison to the presentation of simulation results in numerical or mechanical equations by Xu et al. and Chen et al. and the more complex Flac3D modelling process used by Zhang et al, It can be combined with various built-in modelling aids and specialised cell libraries and intrinsic models to create realistic terrain and stratigraphic sub-interfaces by using a terrain data generator combined with borehole data, facilitating researchers’ studies. At the same time, MIDAS-GTS can output combined envelope results such as vectors, section output clouds and tables for the construction phase of analysis. Therefore, this study focuses on a section of Changsha Metro Line 3 in China. We uses MIDAS-GTS finite element software to establish a model of tunnel construction using a shield machine with empty-pushing through mining method, and carried out a relevant mechanical analysis. Several numerical models were created following actual construction steps to examine the effects of different construction conditions on the displacements in the x, y, and z directions and the internal stress distribution within the shield-driven section. In comparison with other tunnelling projects in China, the simulation results of this study can offer recommendations for construction standards for shield machine empty-pushing through mining method in tunnel construction on the basis of construction safety. Based on the simulation analysis results, we offer recommendations for construction standards for shield machine empty-pushing through mining method in tunnel construction. The research findings can maximise the load bearing capacity of the structure and ensure the economic efficiency of the project costs, which can provide some practical engineering data to support similar tunnelling projects in the future.

2. Materials and Methods

2.1. Project Overview

In a specific section of Changsha Metro Line 3 in China, the anchor cables utilised for the basement excavation support of a commercial plaza on the south side intersected with the shield tunnelling section, affecting an approximately 80 m stretch. Similarly, the anchor cables employed for the basement excavation support of an office building and shopping mall on the north side penetrated the shield tunnelling section, influencing a length of approximately 160 m. According to the geological data, field geological survey, and drilling results from the area, the site is primarily covered by loose Quaternary strata, underlaid by chalk and muddy sand bedrock. The survey unveiled the presence of strongly and moderately weathered zones in gravel and fully weathered, strongly weathered, and moderately weathered zones in the muddy sandstone. The moderately weathered gravel exhibited a debris structure and a medium-thick layered structure, whereas the muddy sandstone displayed a muddy sand structure, thick layered structure, and mudstone cementation. The geological distribution of the study sites is illustrated in Figure 1. The construction projects primarily involve vertical shaft construction, undermining horizontal tunnels, and undermining tunnels in the interval section, with the left and right boundaries of the undermining interval being left ZDK35+945.797, left ZDK36+117.911, right YDK35+951.006, and right YDK36+52.378, respectively. The geological distribution and construction plan for the undermined section of the station are depicted in Figure 1.

2.1.1. Preliminary Construction Scheme Comparison

Given that the basement pit support anchor cables encroach on the shield construction area on both sides of the concealed section, there is a risk of the shield cutter head becoming trapped. Initially, the use of manually excavated bored piles was proposed for removing anchor cables. However, owing to the smaller diameter of these piles, procuring or modifying the necessary anchor-cable extractor is challenging. Additionally, the poor linearity of anchor cables during pipe drilling might result in missed or severed cables [26]. Moreover, using manually excavated bored piles for anchor cable removal would occupy the main traffic routes, potentially causing traffic congestion. Therefore, during the construction drawing stage, this approach, was optimised and adjusted. A combination of mining method excavation and shield tunnelling was chosen for anchor cable removal. This method ensures the complete removal of anchor cables within the intrusion section of the tunnel, thus facilitating the smooth passage of the shield.

2.1.2. Mining Method Tunnel Scheme

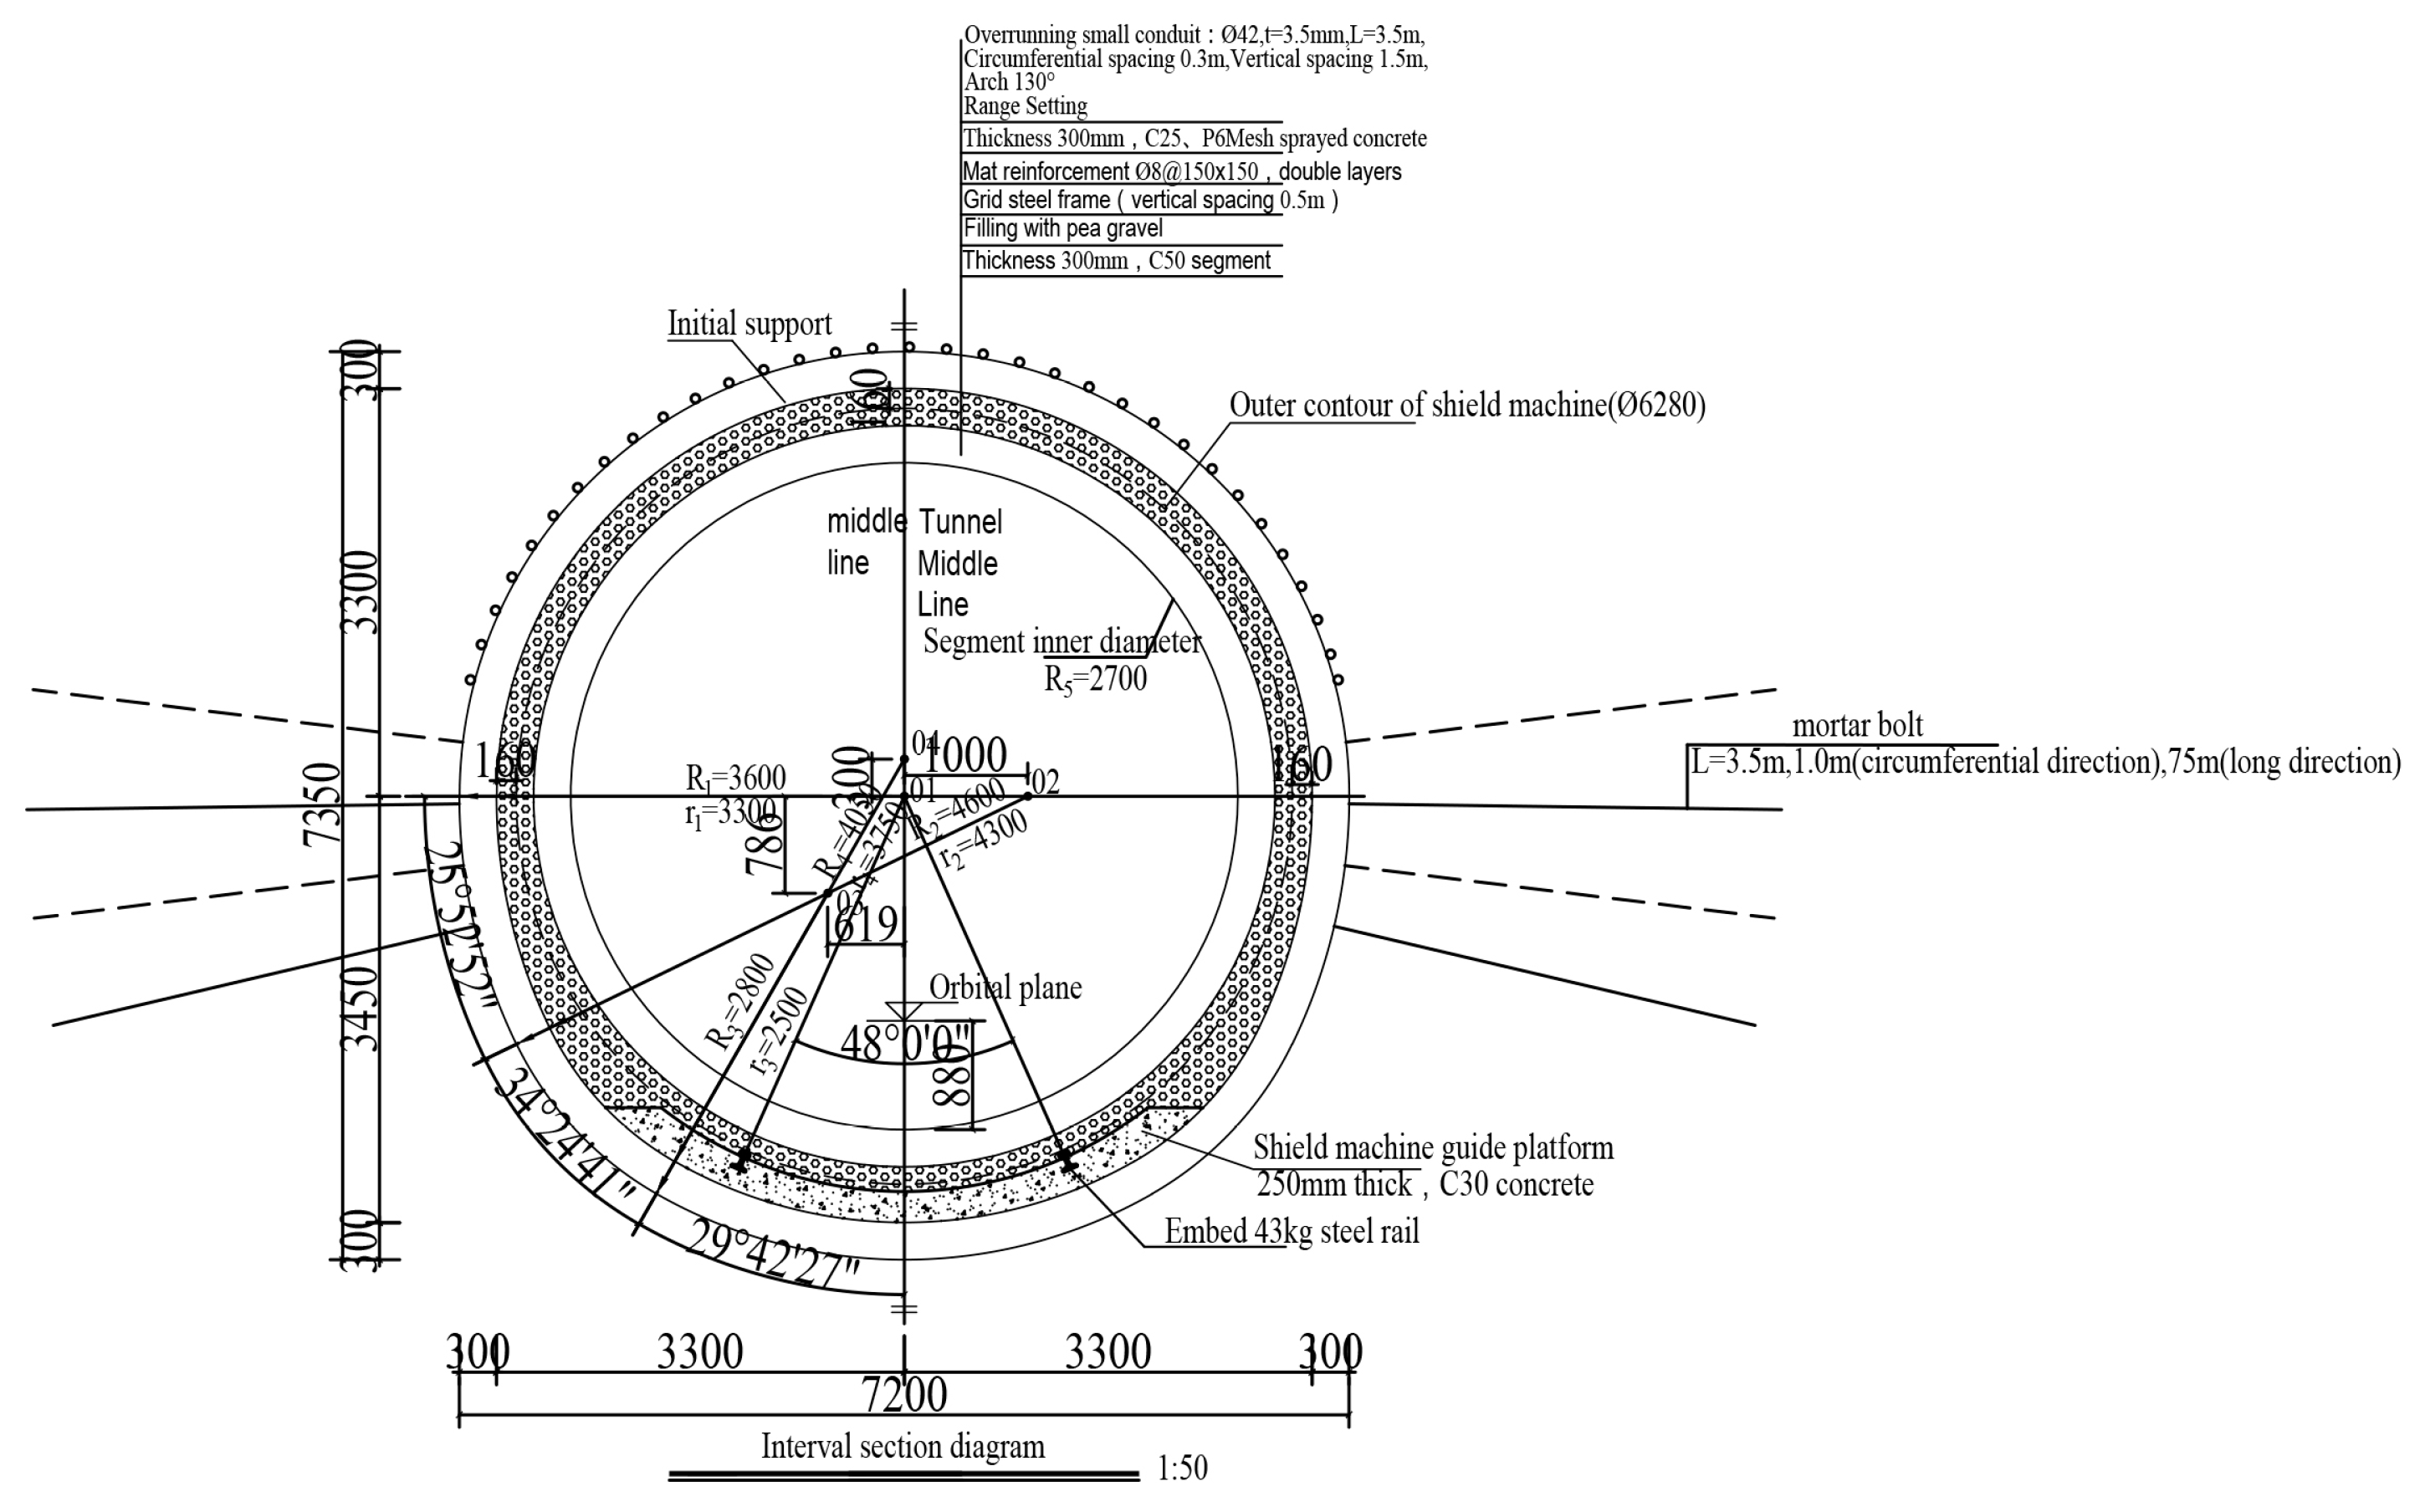
The initial support structure combined a steel mesh, system anchor bolts (advanced small conduits), gratings, and shotcrete for reinforcement. Upon the completion the initial support construction for the mining method section, shield tunnelling empty-pushing was conducted, with the gap between the tunnel lining segments and the initial support filled using grouting and gravel. A C35 concrete guide platform with a radius of 3,200 mm and a thickness of 250 mm, was installed within a 60° range at the bottom of the cross section. To ensure the smooth passage of the tunnelling shield, the concrete guide platform should be accurately measured and inspected prior to the shield's advancement. Cross-sectional measurements of the tunnel excavation face should be taken at one-metre intervals, and any under-excavation should be promptly addressed. The final cross-sectional view of the mining tunnel is shown in Figure 2.

2.2. Numerical Calculation Model and Method

A numerical model of the shield tunnelling empty-pushing through the mining method tunnel was established using the MIDAS-GTS finite element calculation software, considering the self-weight stress field for the ground stress field. During the modelling process, certain conditions were optimised and assumed, considering the following basic assumptions: According to the Code for Geotechnical Investigation of Urban Rail Transit (GB50307-2012), Code for Investigation of Geotechnical Engineering (GB50021-2001) and Standard for Geotechnical Testing Method (GB/T50123-2019), the geological parameters provided by the geological survey report were used to extract the most representative strata. The corresponding physical and mechanical properties of the selected soil strata were used as simulation parameters in the model, and the detailed parameter settings are shown in Table 1. The entire construction process was simulated using the construction step sequence, considering the spatial displacement variation during construction, without considering the time effect.
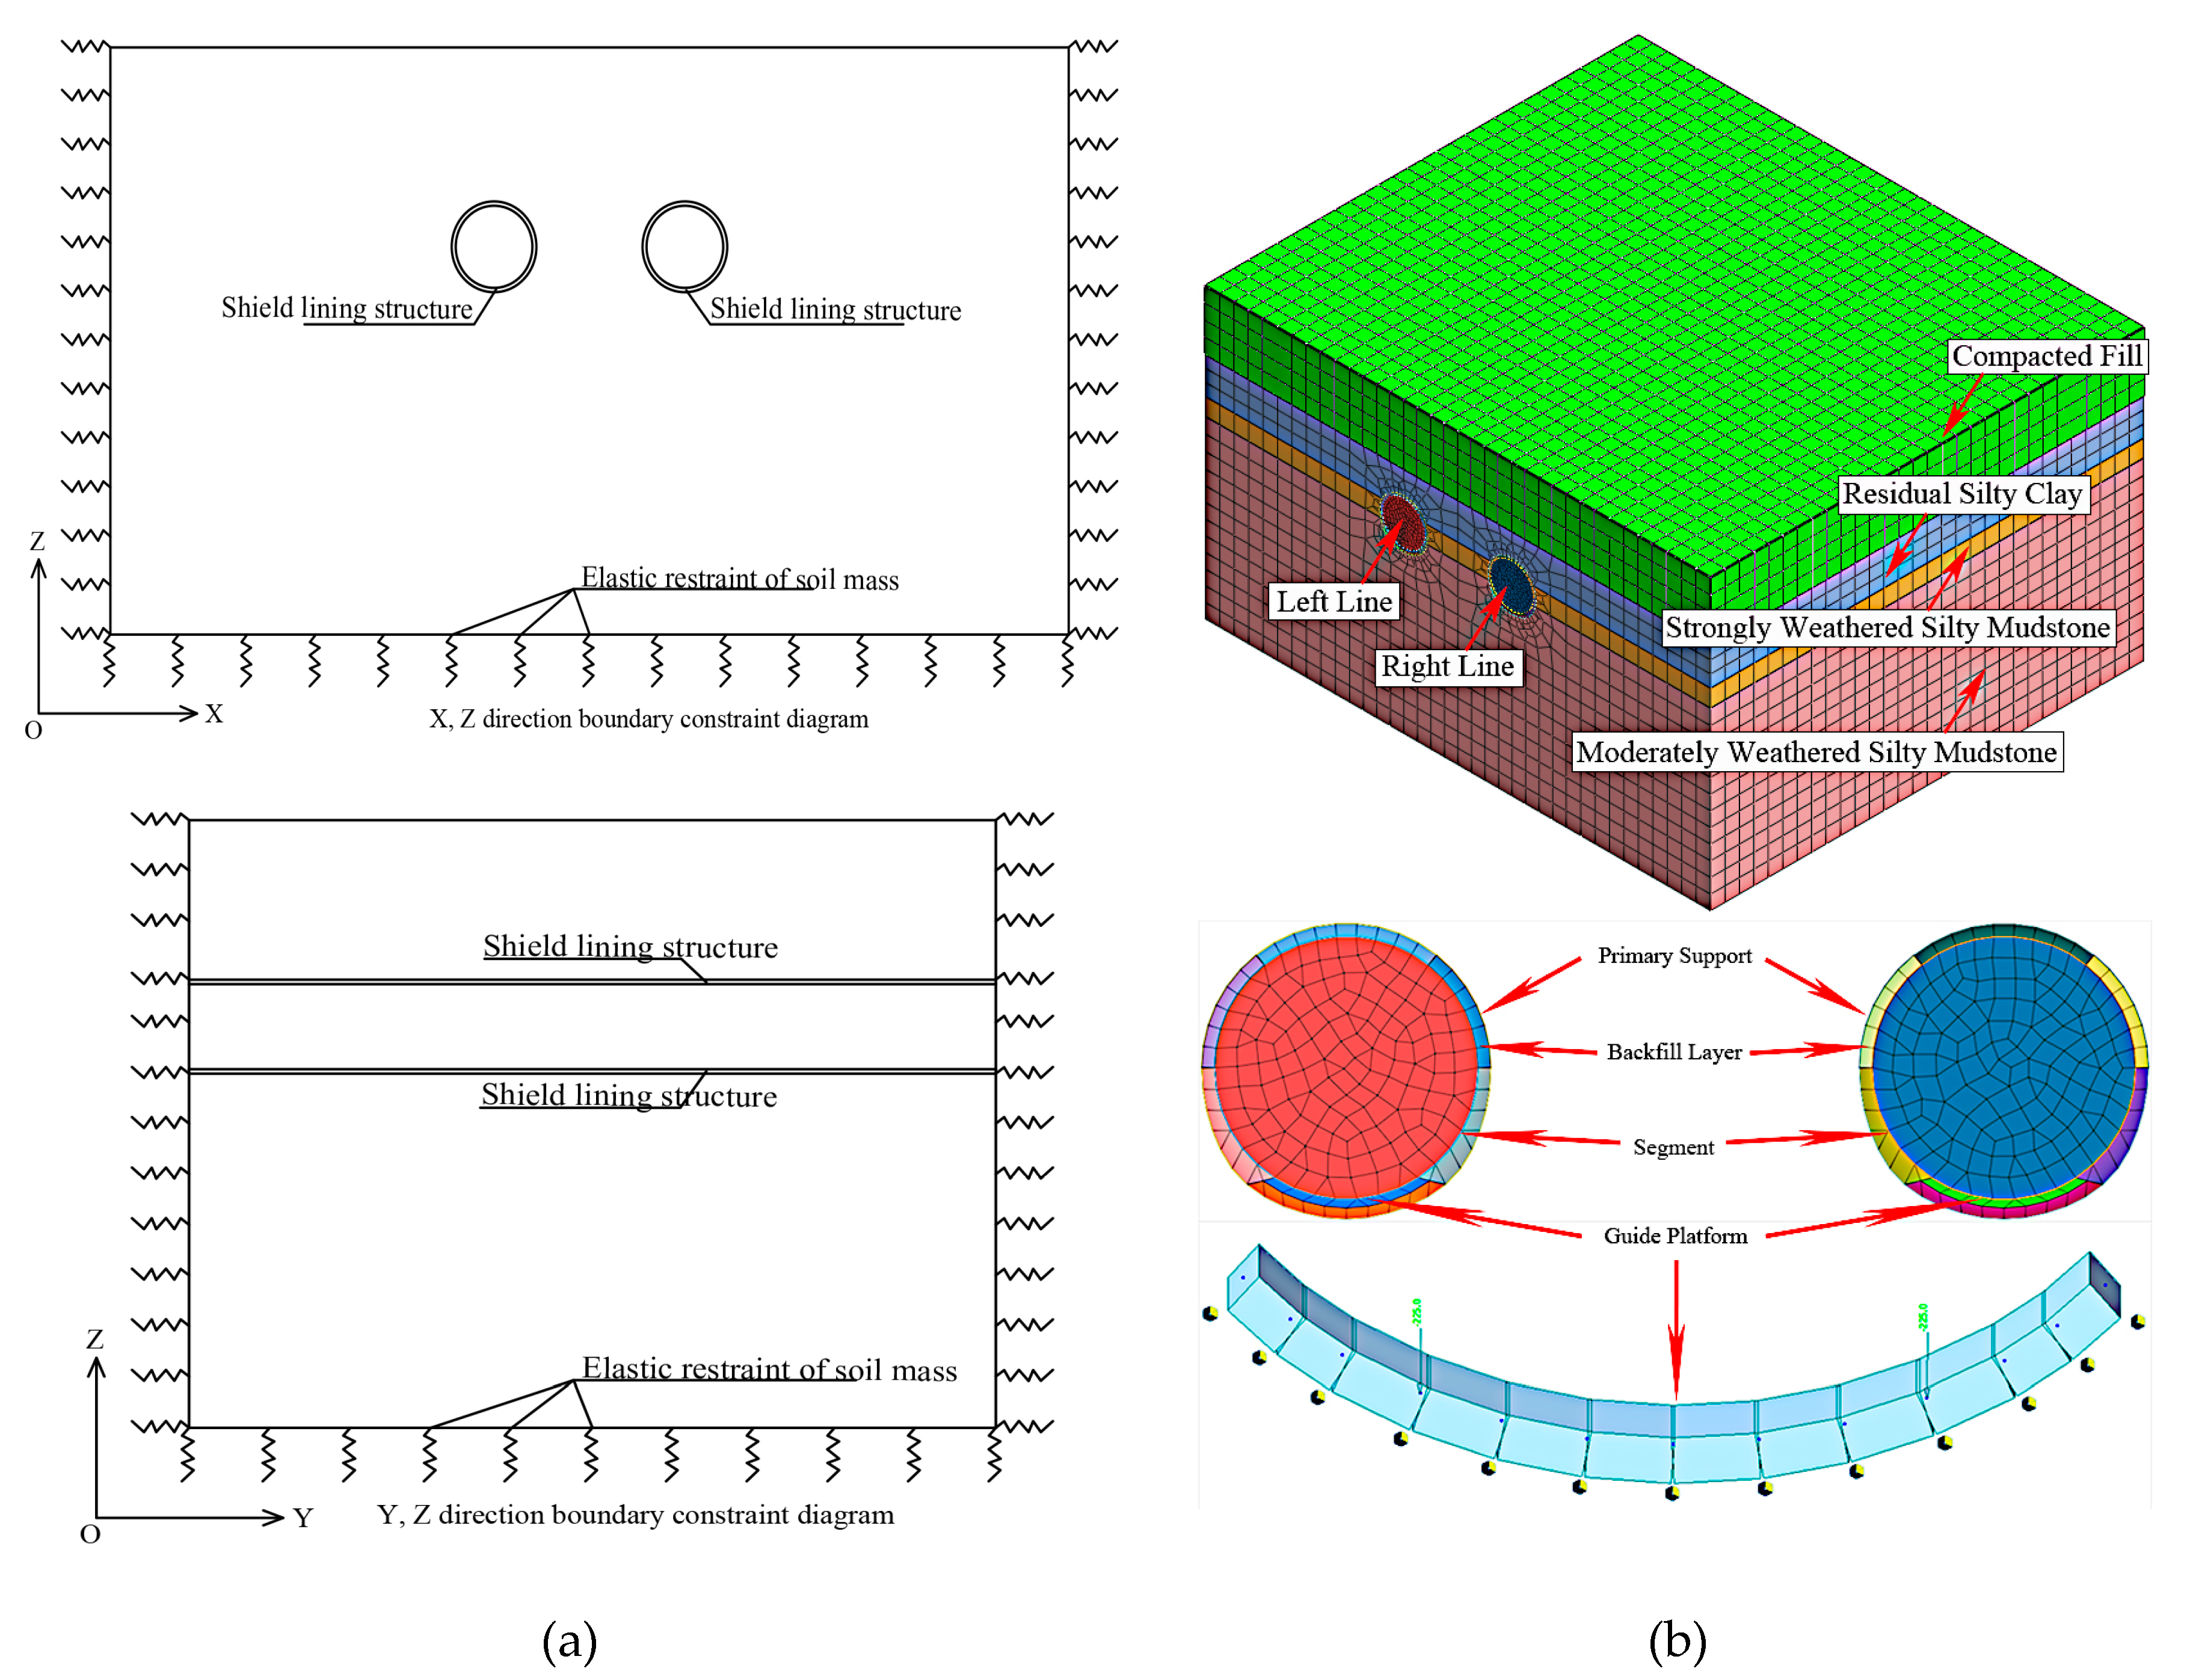
To minimise the impact of boundary constraints on the computational results, the boundary for each direction was established based on similar numerical simulations and experimental experiences for tunnels [27,28,29,30]. According to the principles of the numerical simulation, the boundary should be placed three to five times the diameter of the tunnel section outside the retaining structure. In this model, a distance four times the diameter of the tunnel section was adopted. The overall range of the numerical model was 70 m × 50 m × 40 m. The main stressed soil layers simulated, from top to bottom, and their corresponding thicknesses were as follows: compacted fill (8.2 m), residual silty clay (5.2 m), strongly weathered silty mudstone (2.4 m), and moderately weathered silty mudstone (24.3 m extending from the bottom boundary of the model). The net distance between the left and right tunnel lines was 8.4 m. Each tunnel line had a horizontal width of 6.6 m and a vertical width of 6.75 m. For displacement boundary conditions, a free surface was used at the top of the model, and normal fixed constraints were employed for the other five faces in the vertical direction. Specifically, X- and Y-normal fixed constraints were utilised for the horizontal constraints, and a Z-fixed constraint was applied to the bottom, as shown in Figure 3(a). The modified Mohr-Coulomb criterion derived from Li ’s [31] analysis of the Yumo railway project in China was adopted as the failure criterion for the grid elements using practical engineering experience as a basis. Solid elements were employed to simulate each soil layer. The initial support and shield segments were modelled using plate elements, whereas the gravel backfill layer and guide platform were simulated using solid elements. The numerical model corporates 8,800 hexahedral mesh elements and 7,601 nodes. Mesh size is controlled using linear gradient, with a mesh size of 0.5 m for initial supports, segments, pea gravel, and soil inside the tunnel. Outside the tunnel, the mesh size for the soil gradually increases linearly with distance from the tunnel centreline, reaching a maximum mesh size of 5 m.
To accurately simulate the initial state of natural soil layers during the finite element modelling of foundation pit excavation, it is crucial to balance the initial geostress. This implies that the soil model should only contain the initial stress field without any initial displacements. Initially, the soil displacement and stress fields under their own weights were initially calculated. Subsequently, to construct the initial stress field, the displacement zeroing function of MIDAS-GTS was utilised to remove the completed settlement displacement. Lastly, a finite element numerical model for each structure was established, as shown in Figure 3(b). Ground displacement values for each geological condition simulated in the model were combined with stress-strain and modulus of elasticity formulas to derive the corresponding structural axial force and bending moment values.

3. Results

3.1. Three-Dimensional Model Mesh Simulation Results

3.1.1. Single Tunnel Single Ring Construction Process Numerical Simulation Results

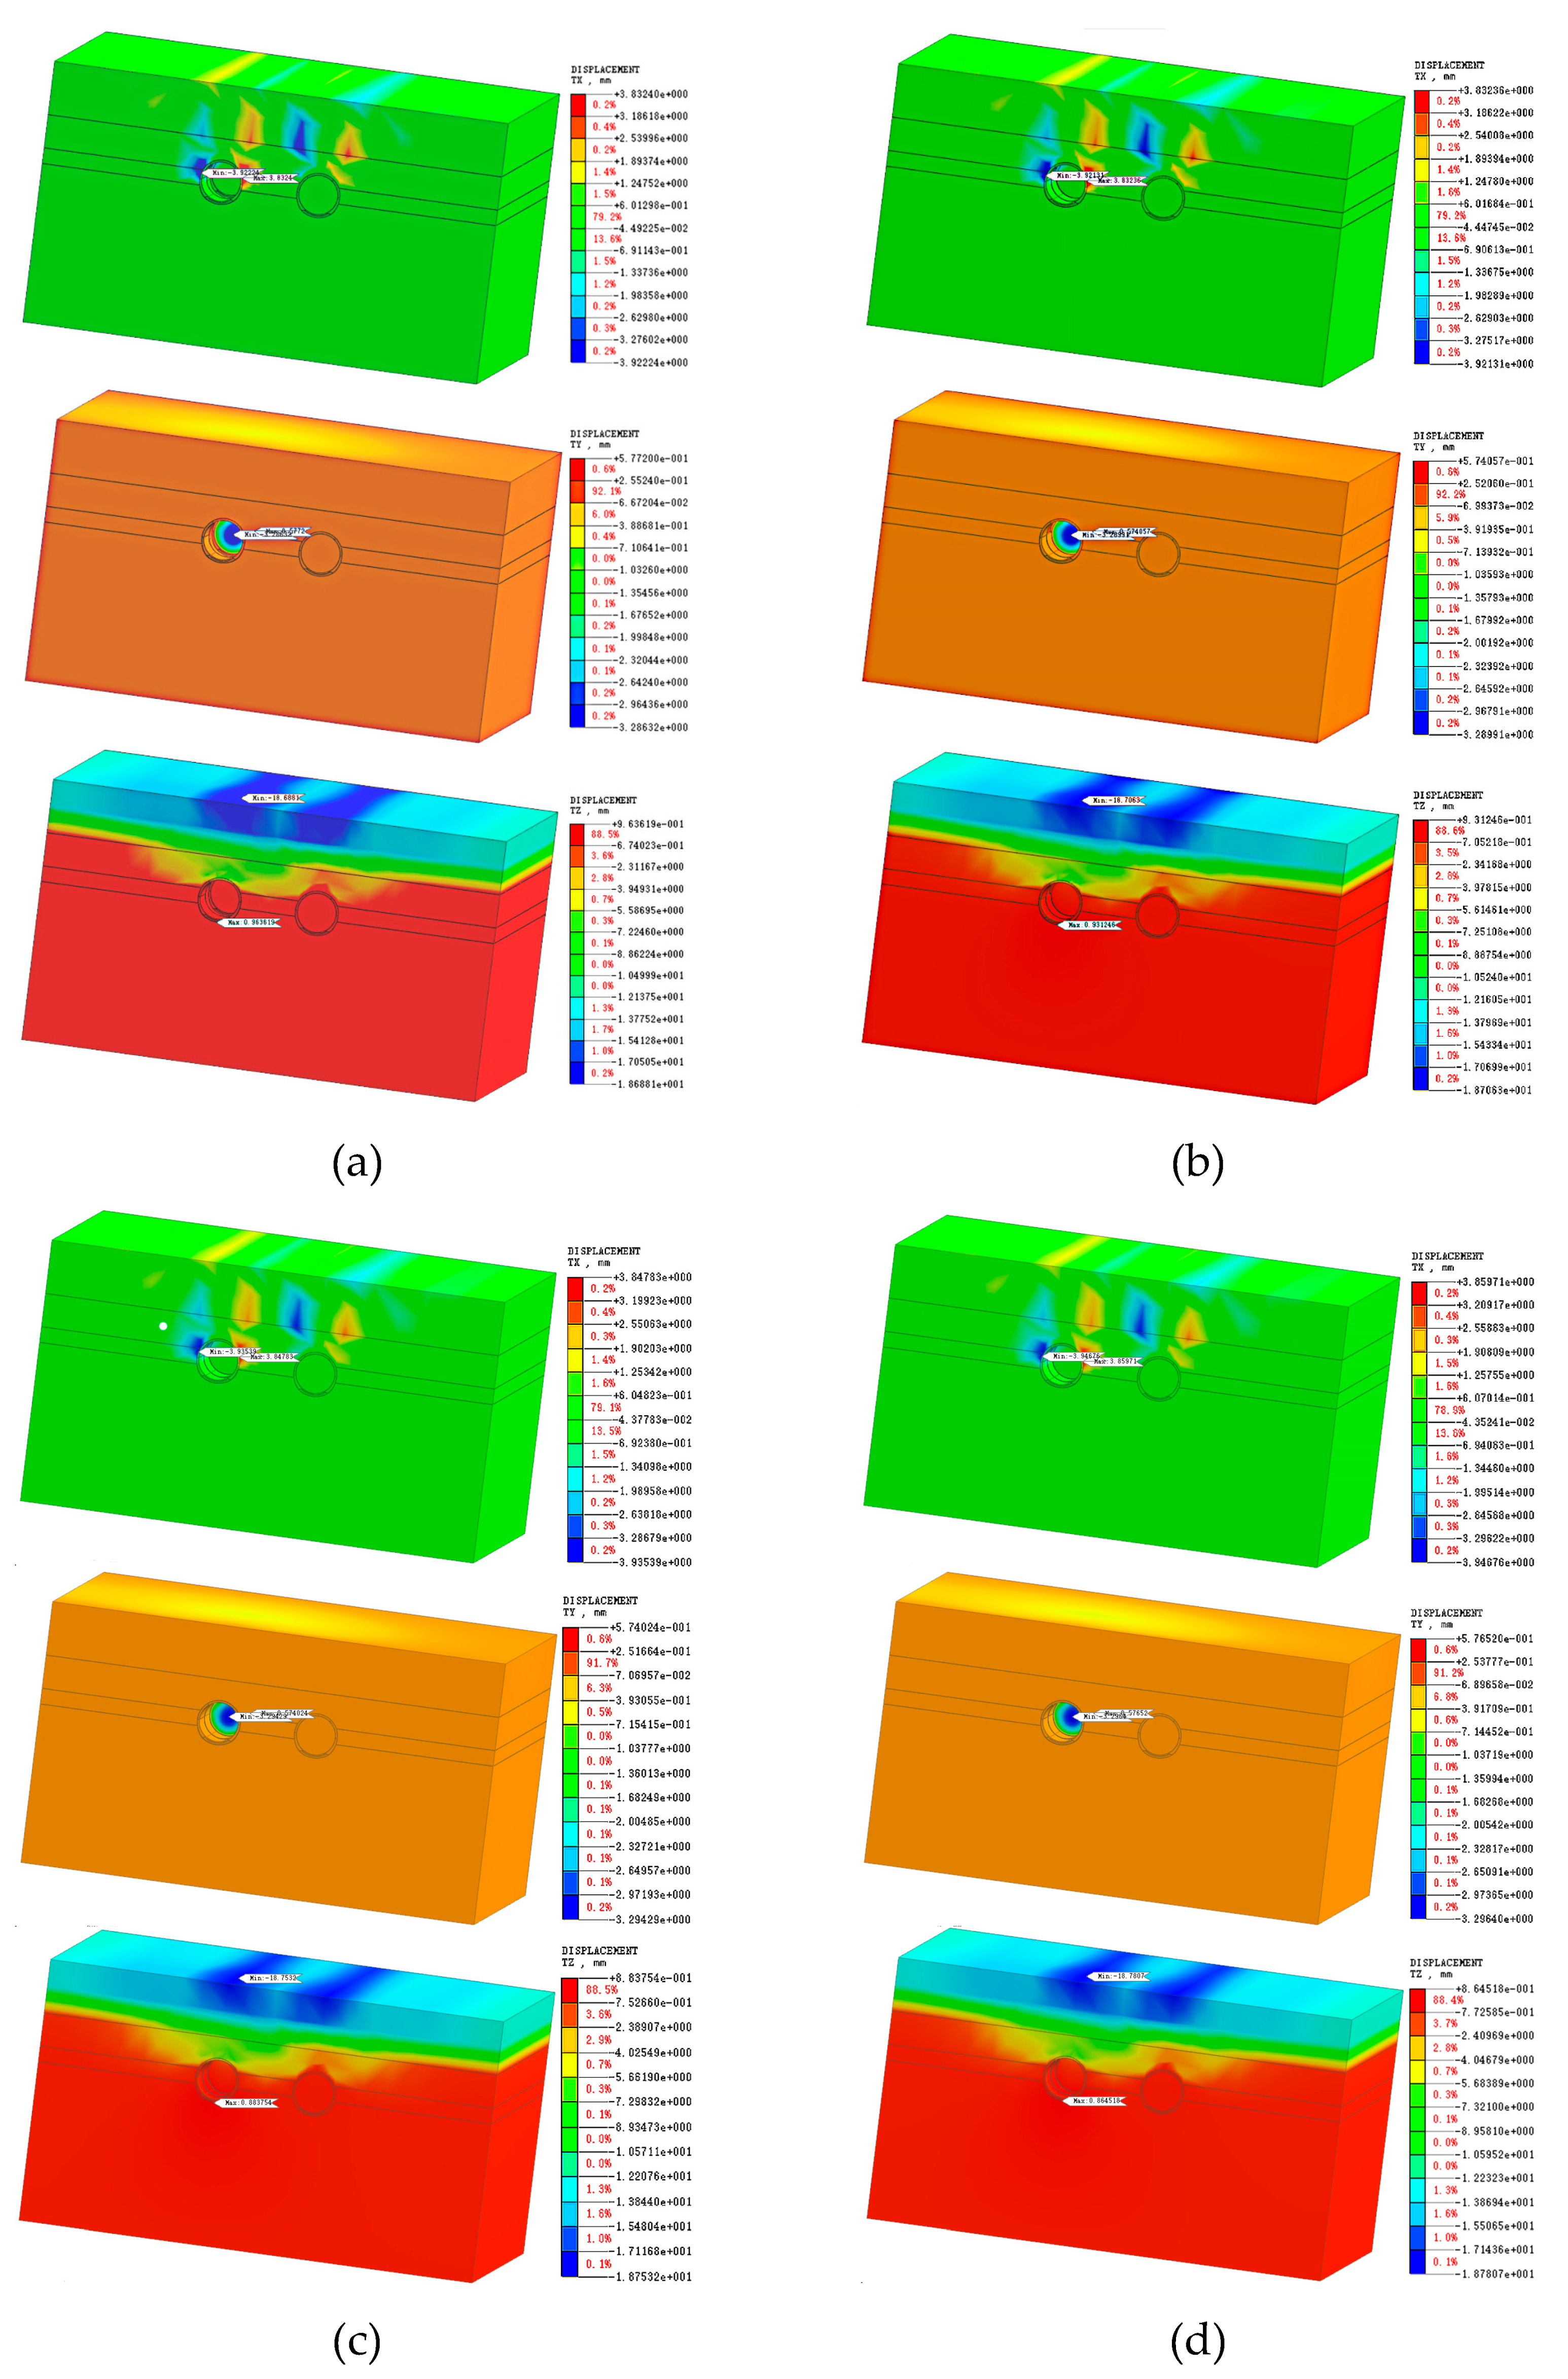
During the numerical calculations, the specific construction steps for the tunnel model are as follows: Step 1: Achieving initial stress balance; Step 2: Excavating one ring in the left tunnel and implementing initial support and guide platform; Step 3: Backfilling gravel to the waist of the initial support ring in the left tunnel; Step 4: Assembling one ring of segments in the left tunnel; Step 5: Completing the backfilling of gravel outside the segments; Step 6: Continuing excavation, support, guide platform construction, segment assembly, and gravel backfilling in the left tunnel until completion; Step 7: Continuing excavation, support, guide platform construction, segment assembly, and gravel backfilling in the right tunnel until completion. Taking the construction of the second section of the left tunnel as an example, the displacement cloud maps for each construction step are shown in Figure 4.
As can be seen from the above figure, the displacement changes in the x- and y-directions during the construction process of the left tunnel are very small, with the maximum displacement occurring at the horizontal and vertical axis positions (xmax=3.947 mm and ymax=3.60 mm), and the differences at the level of 0.01 mm. In the z-direction, the ground settlement gradually increases with the construction sequence, with the maximum displacement occurring directly above the tunnel, zmax=18.781 mm. The bulge at the bottom of the tunnel gradually decreases as the tunnel is enclosed and the overall stiffness increases, but the magnitude of the change is around 0.01 mm, and the maximum displacement is 0.964 mm.

3.1.2. Single and Twin Tunnel Completed Numerical Simulation Results

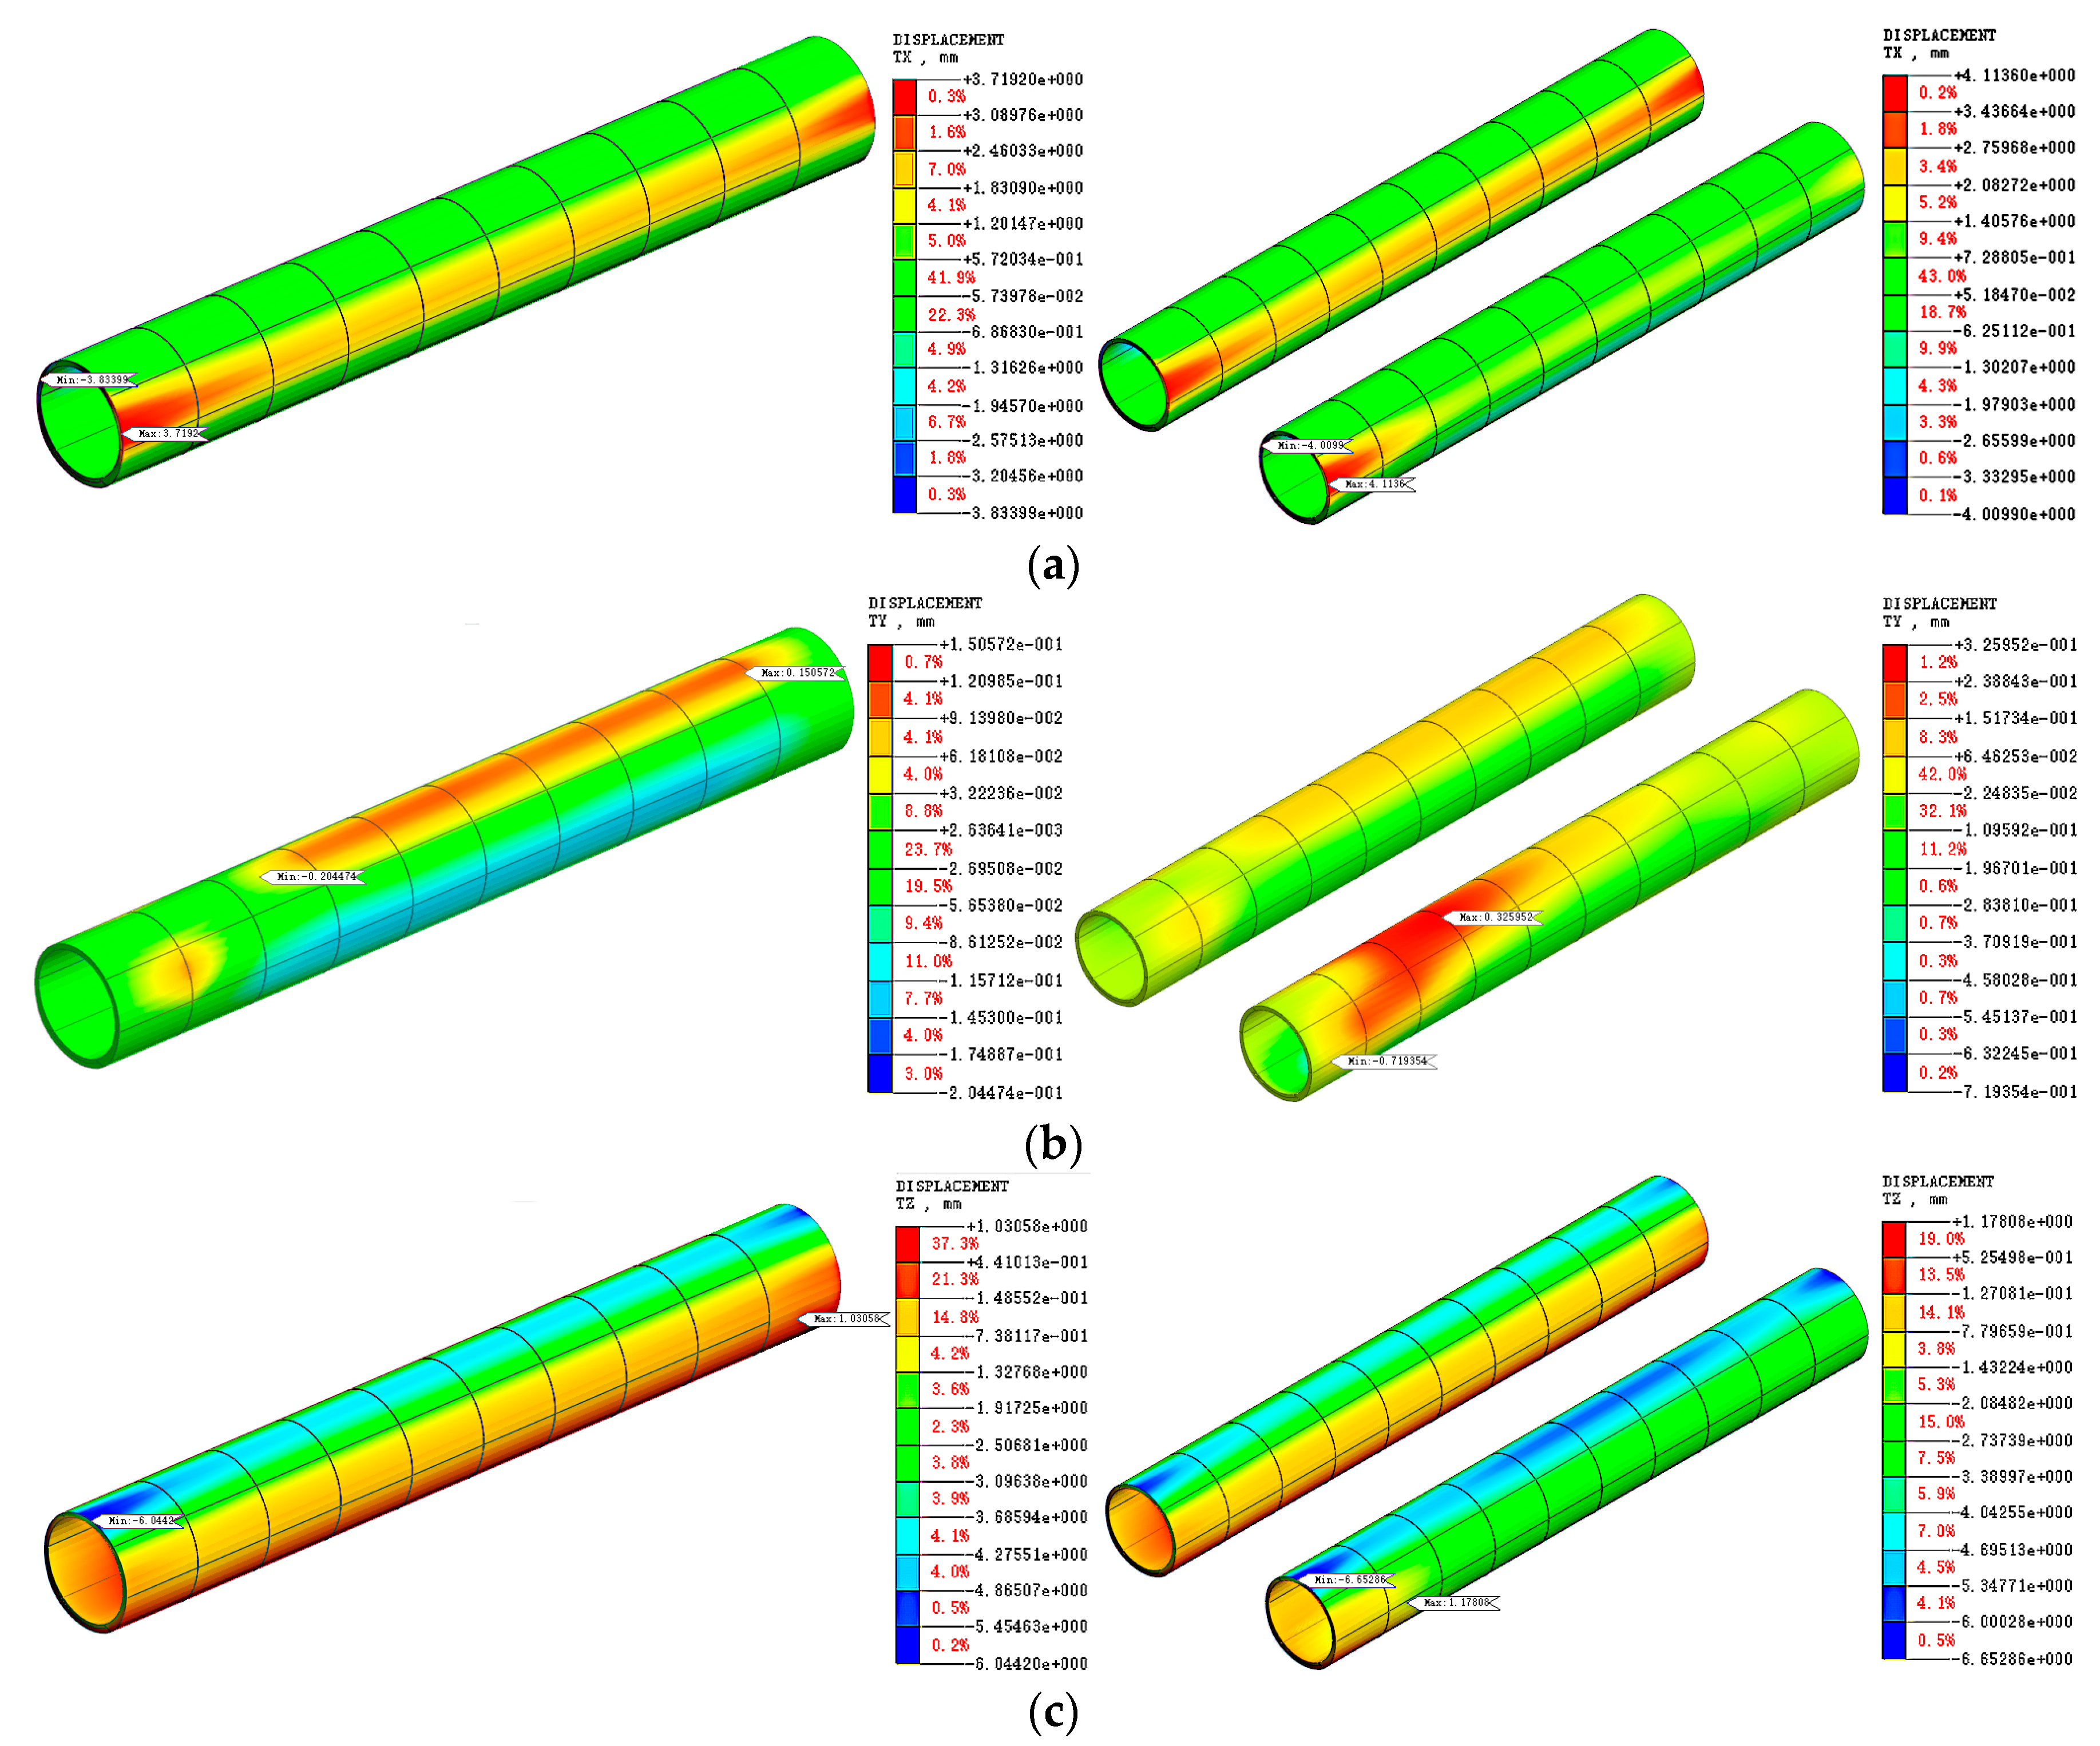
In the construction step simulation, the y-direction dimensions were 50 m, comprising a total of 10 excavation steps of 5 m each. using the left tunnel as an example for the single tunnel part, the right line of the twin tunnel was simulated using the same construction steps as the left line. The final displacement cloud map for the completed single and twin tunnels is depicted in Figure 4.
As can be seen from the above figure, following the completion of the left tunnel construction, the maximum displacement in the x-direction occurred at the horizontal axis position of the initial excavation, with xmax=3.834 mm. The maximum displacement in the y-direction occurred at the top and bottom of the tunnel in the vertical axis position. The maximum displacement occurred at the initial excavation position, with ymax=0.244 mm. The maximum displacement in the z-direction occurred at the top of the tunnel at the initial excavation position, with zmax=6.044 mm. All the aforementioned displacement values were within the allowable range. With the completion of the right tunnel construction, the maximum displacement in the x-direction occurred at the horizontal axis position of the initial excavation, with xmax=4.114 mm. The maximum displacement in the y-direction occurred at the top and bottom of the tunnel in the vertical axis position, with the maximum displacement occurring at the initial excavation position ymax=0.19 mm. The maximum displacement in the z-direction occurred at the top of the tunnel at the initial excavation position, with zmax=6.653 mm.
In this study, the limits of Schedule B.0.2 of the Technical Specification for Safety Protection of Urban Rail Transit Structures (CJJ/T202) [31] were adopted for the displacement control requirements of this model, as shown in Table 2, considering actual engineering experience. According to the simulation results, the displacement values are within the permissible range. Based on the simulation results presented above, it can be observed that during the construction of a single tunnel, the maximum displacement tends to occur at the top, bottom, and waist of the tunnel after completing the initial support, segmental lining installation, and gravel backfilling. The ground settlement gradually increases as the construction progresses, whereas the uplift at the bottom of the tunnel decreased after the tunnel was sealed by installing a segmental lining. Therefore, minimising the duration of the tunnel sealing process is beneficial for controlling the uplift. Given that the net distance of the tunnel in this project is greater than one tunnel diameter, after the single-hole and double-hole construction is completed, the location of the maximum displacement shifts; however, the relative location and absolute value of the displacement are closer to the results of the single tunnel.

3.2. Force Characteristics Results of Initial Support

3.2.1. Impact of Tunnel Burial Depth on the Force Exerted on Initial Support

The Poisson's ratio is the ratio of the absolute value of the transverse positive strain to the axial positive strain when a material is subjected to unidirectional tension or compression. In geotechnics, Poisson's ratio is one of the parameters used to evaluate the properties of soils due to its sensitive response to the physical and mechanical state of the soil.
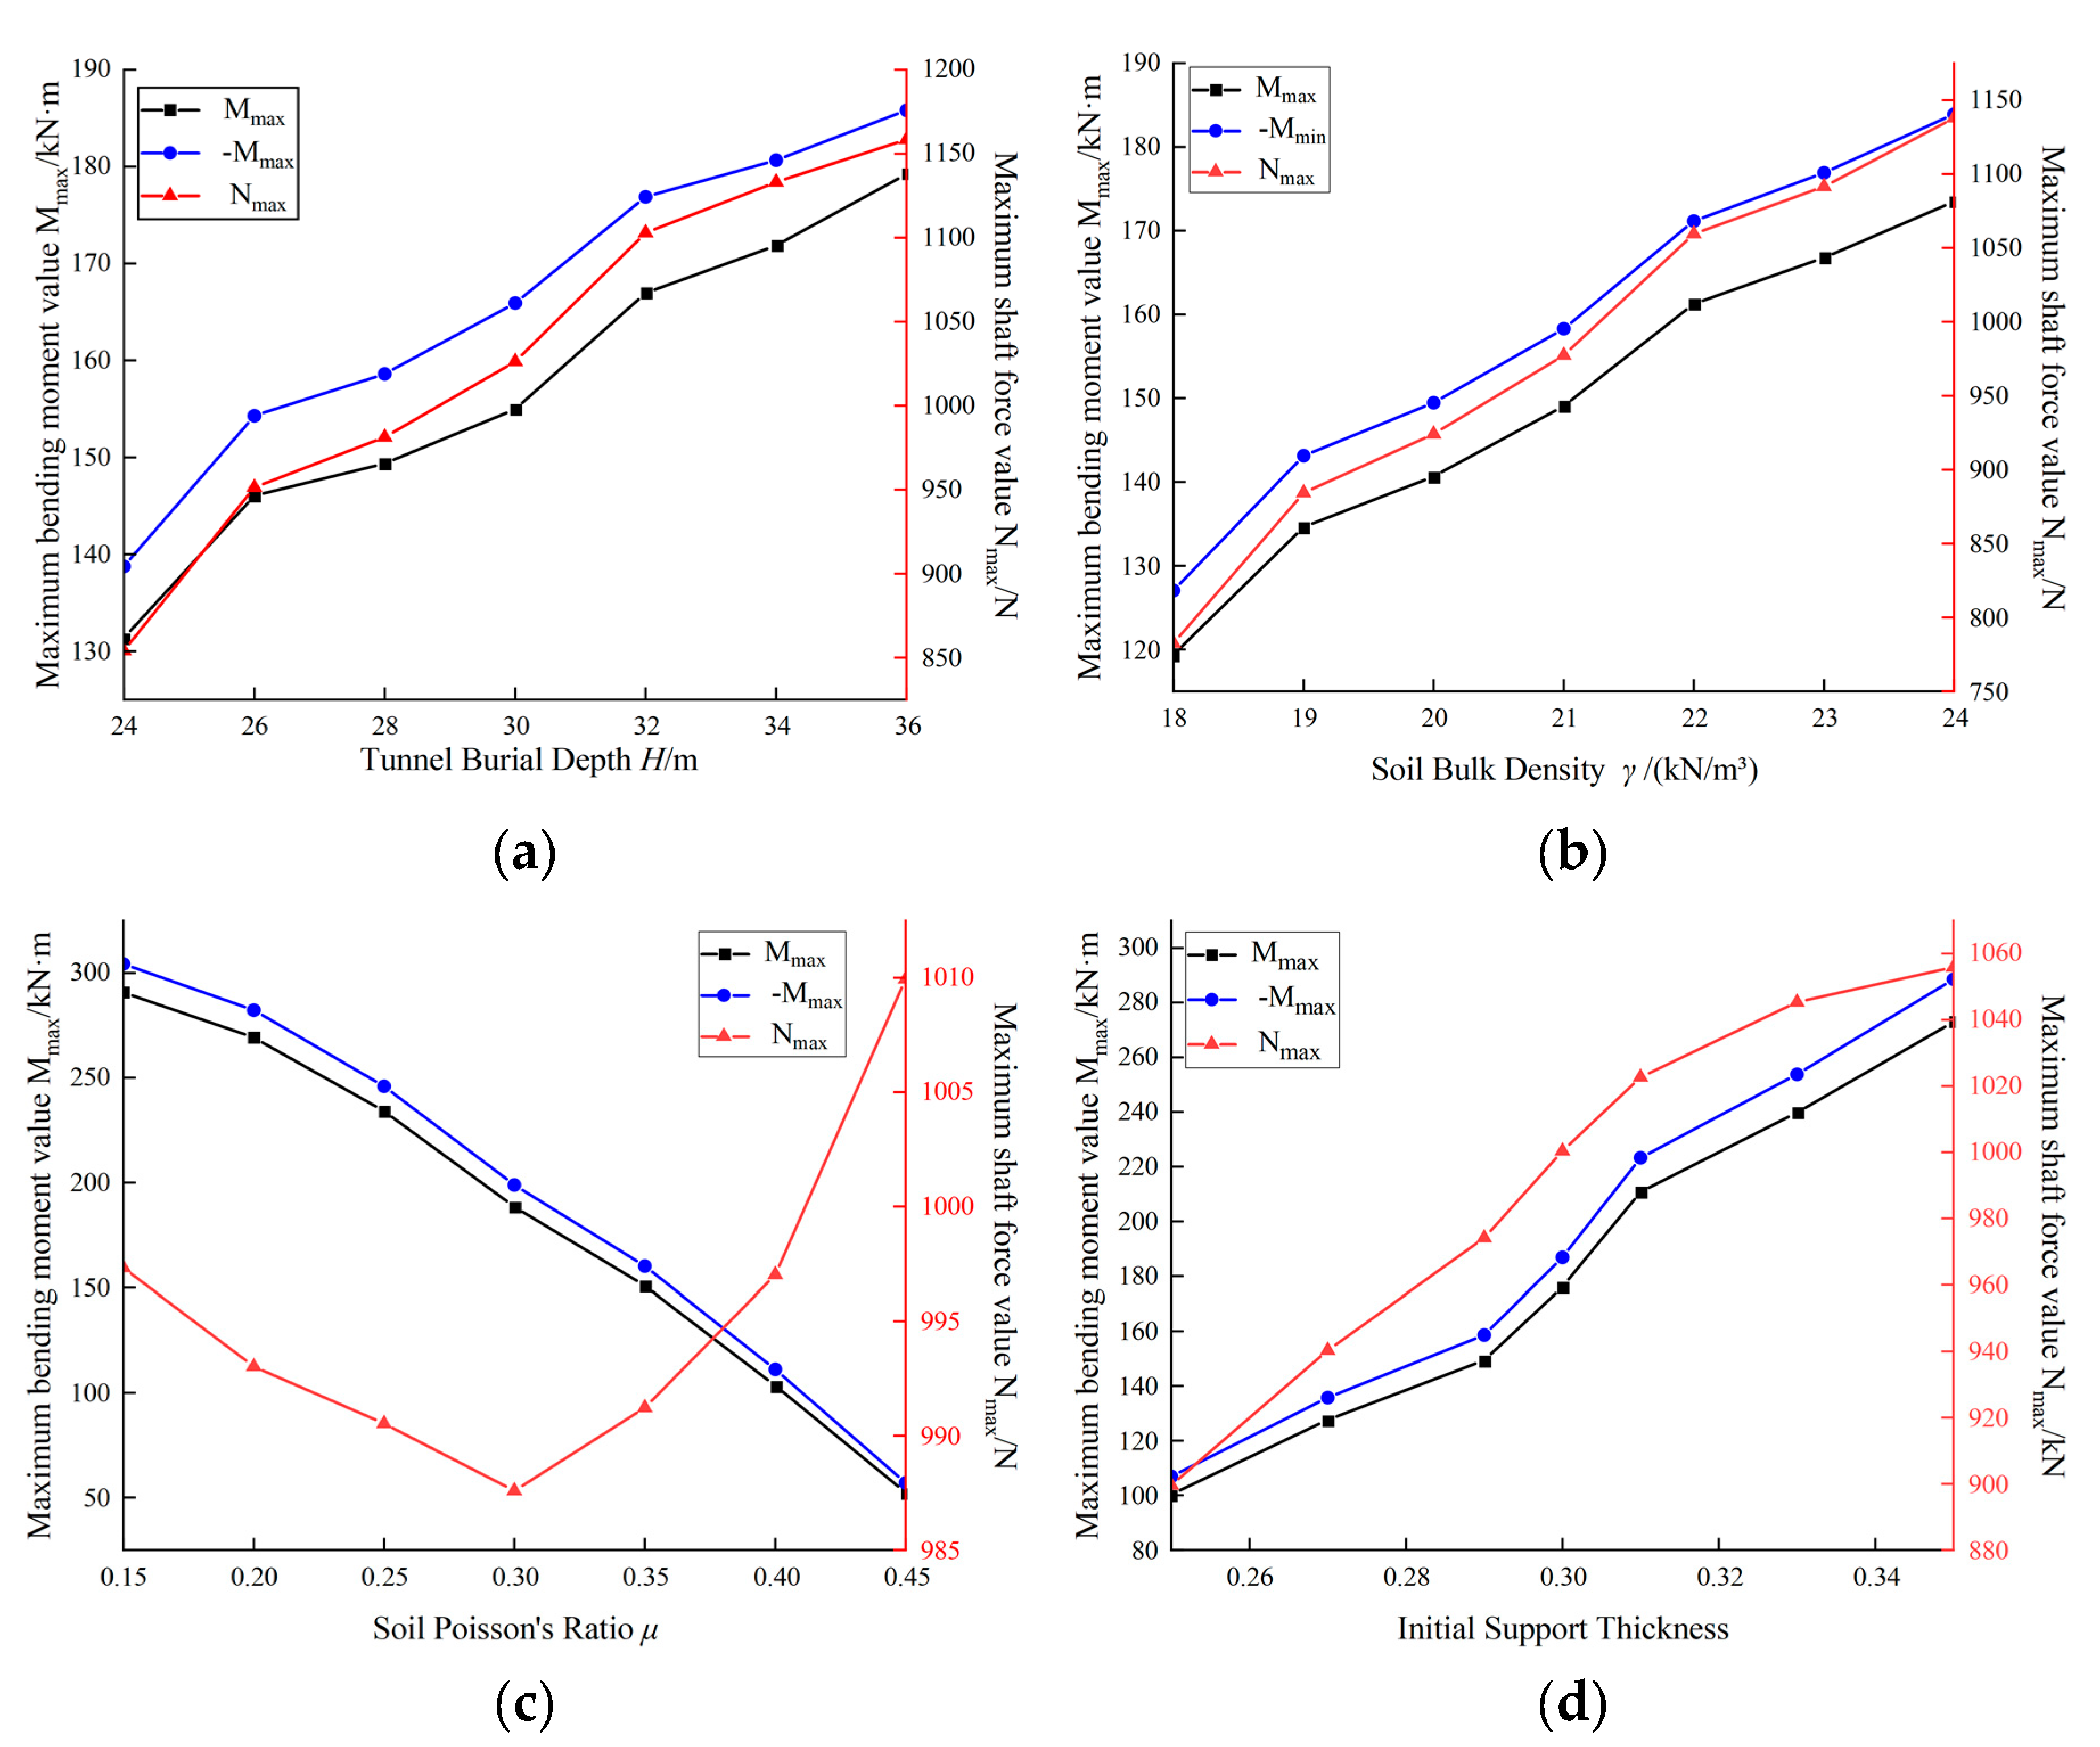
With the other simulation parameters held constant, the force on the initial support was calculated at different buried depths of H=24, 26, 28, 30, 32, 34, and 36 m. The details of the force changes are illustrates in Figure 6a. The bending moment of the initial support was the highest at the top and bottom of the support ring and increased as the buried depth of the tunnel increased. The initial support section was under compressed, with the maximum axial force was located at the waist of the support ring. By controlling the variables, it was observed that the internal force of the initial support changes in the same manner, positively correlated with the buried depth of the tunnel. As the depth increases it contributes to an increase in the maximum axial force.

3.2.2. Impact of Soil Bulk Density on the Force Exerted on Initial Support

To study the influence of the soil unit weight (γ) on the initial support stress characteristics in the combined method, the soil unit weight was varied in the calculation model as 18, 19, 20, 21, 22, 23, and 24 kN/m γ. The resulting initial support stresses were obtained for different soil unit weights.
As evident from the initial support stress variation curve in Figure 6b, both the maximum bending moment and axial force of the initial support section are linearly and positively correlated with the soil weight, with their values increasing as the weight increases. Moreover, as the unit weight parameter increases, the growth rate of the maximum axial force curve gradually outpaces that of the maximum bending moment curve. This suggests that, in this project, the influence of the unit weight on the axial force was more pronounced than that its influence on the bending moment.

3.2.3. Influence of Soil Poisson's Ratio on Forces Experienced by Initial Support

The Poisson's ratio of the soil is one of the parameters used to evaluate soil performance of the soil. In this study, different Poisson's ratios were selected, with values of 0.15, 0.20, 0.25, 0.30, 0.35, 0.40, and 0.45, to investigate their influence on the initial support stress.
The analysis of the variation in internal force values shown in Figure 6c indicates that the maximum bending moment of the section is linearly and negatively related to the soil’s Poisson's ratio, decreasing as the Poisson's ratio increases. The variation in the maximum axial force value fluctuates less than that of the maximum bending moment value, initially decreasing and then increasing with an increase in Poisson's ratio. The minimum value was reached at a Poisson's ratio of 0.3, indicating that the soil layer with a Poisson's ratio of 0.3 has the least impact on the maximum axial force value of the initial support.

3.2.4. Influence of Initial Support Thickness on Forces Experienced by Initial Support

In the mining method, the structural stiffness of the initial support ring is directly affected by the thickness of the initial support. The internal forces of the initial support at various thicknesses were obtained in the simulation by adjusting the thickness of the initial support in the tunnel model to 0.25, 0.27, 0.29, 0.30, 0.31, 0.33, and 0.35 m. The maximum bending moment and maximum axial force of the initial support are positively correlated with thickness and increase with thickness, as shown in Figure 6d. However, there is a discrepancy in the slope of the bending moment and axial force curves as the thickness increases. This indicates that the maximum bending moment of the starting section is influenced by its thickness; the maximum bending moment changes more significantly than the maximum axial force, and the maximum bending moment changes abruptly.

3.3. Force Characteristics Results of Segment

3.3.1. Influence of Tunnel Burial Depth on Segment Forces

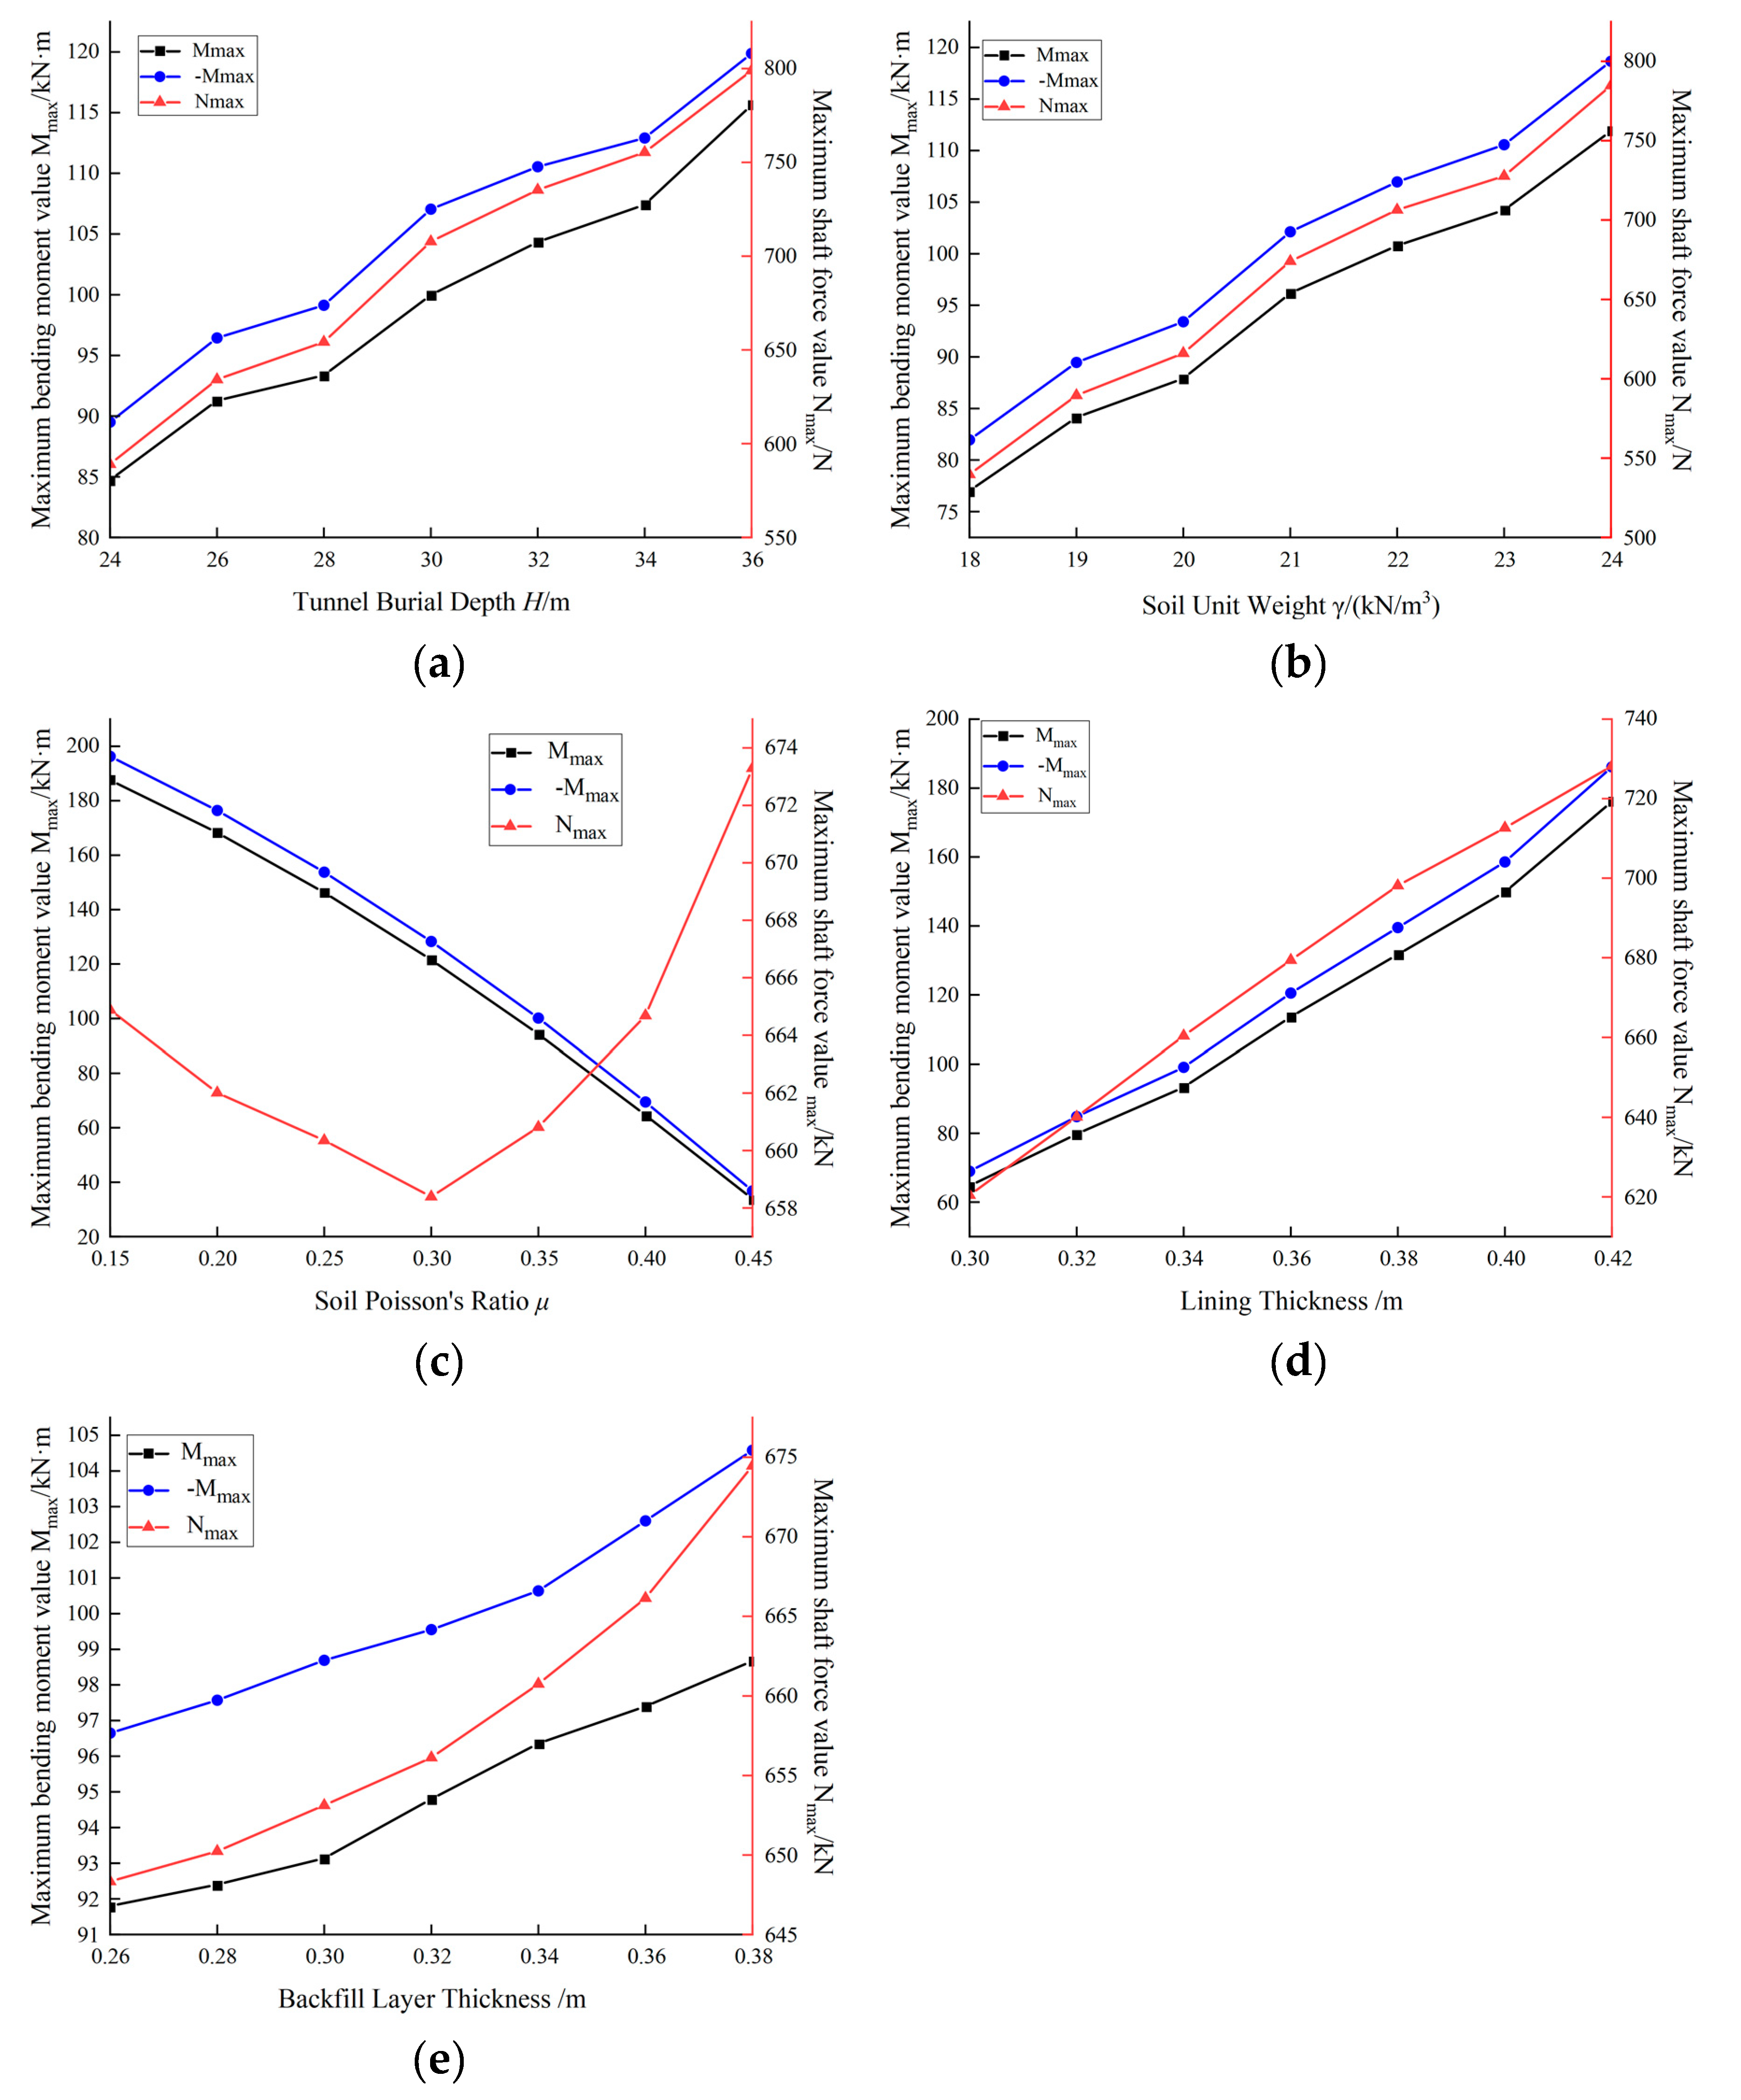
The burial depth of the tunnel not only impacts the initial support but also influences the segment through the lining. By modifying the burial depth H of the tunnel to 24, 26, 28, 30, 32, 34, and 36 m while keeping the other simulation parameters of the soil layer constant, the evolution of the bending moment and axial force in the segment was obtained, as illustrated in Figure 7a. From the analysis, it can be observed that the variation trend of the internal force variation in the segment is similar to that of the initial support when the burial depth of the tunnel changes. However, compared to the initial support, the increase in the tunnel’s burial depth had a more substantial effect on the growth trend of the internal forces in the segment. This indicates that the range of burial depth should be appropriately in this project to balance the fluctuation effects on the segment and the initial support.

3.3.2. Influence of Soil Unit Weight on Segment Forces

To further study the effect of soil bulk density (γ) on the stress characteristics of the segment using the combined method, the soil bulk density in the calculation model was altered to 18, 19, 20, 21, 22, 23, and 24 kN/m . The trend of stress variation in the segment under different soil bulk densities was obtained, as illustrated in Figure 7b. The maximum bending moment and axial force in the segment showed a positive correlation with the soil bulk density, and their values increased with increasing density. This indicates that the impact of soil bulk density on the internal forces in the segment was relatively balanced in this project.

3.3.3. Influence of Soil Poisson's Ratio on Segment Forces

To continue investigating the impact of the soil’s Poisson's ratio (μ) on the force characteristics of the segments, we selected soil Poisson's ratios of 0.15, 0.20, 0.25, 0.30, 0.35, 0.40, and 0.45. We then studied the effect of different Poisson's ratios on the stress of the segment . The variation in the maximum bending moment and axial force in the section with changes in the soil’s Poisson’s ratio is illustrated in Figure 7c. It can be observed that the maximum bending moment is negatively linearly correlated with the soil’s Poisson's ratio, with its value decreasing as the Poisson's ratio increases. In comparison, the variation in the maximum axial force value is relatively stable. It first decreases then increases with an increase in Poisson's ratio, reaching a minimum value at a Poisson's ratio of 0.3. This pattern is consistent with the variation observed in the initial support.

3.3.4. Influence of Lining Thickness on Segment Forces

Because the thickness of the lining is mainly determined by the thickness of the segments, the thickness of the segments also affects their stress situations. By varying the thicknesses of the segments in the tunnel model to 0.30, 0.32, 0.34, 0.36, 0.38, 0.40 and 0.42 m, the internal force changes of the segment under different thicknesses are obtained and shown in Figure 7d. When the thickness of the segment was different, the distribution of the internal forces in the segment was the same. The maximum bending moment and axial force of the segment were both positively correlated with the thickness of the segment and increased with increasing thickness. Moreover, the change in the maximum axial force is more in line with the linear relationship than the maximum bending moment, indicating that the change in the axial force is more stable under the influence of the segment thickness.

3.3.5. Influence of Backfill Layer Thickness on Segment Forces

To provide structural strength, backfill materials, such as gravel and cement slurry, must be used to fill the space between the segments and the initial support while building a shield tunnel that passes through a mining region. As shown in Figure 7e, the stress curves of the segments with various backfill layer thicknesses were produced to analyse the impact of the backfill layer on the stress of the segments. The backfill layer thicknesses were 0.26, 0.28, 0.30, 0.32, 0.34, 0.36 and 0.38 m. It can be observed that the maximum bending moment of the segment has a positive correlation with the backfill layer thickness and increases as the layer thickness increases. Although the total size of the change is minimal, the change in the thickness of the backfill layer has a significant impact on the rate at which the maximum axial force increases.

3.4. Stress Behaviour of Guide Platform

3.4.1. Influence of Shield Body Weight on Guide Platform Stress

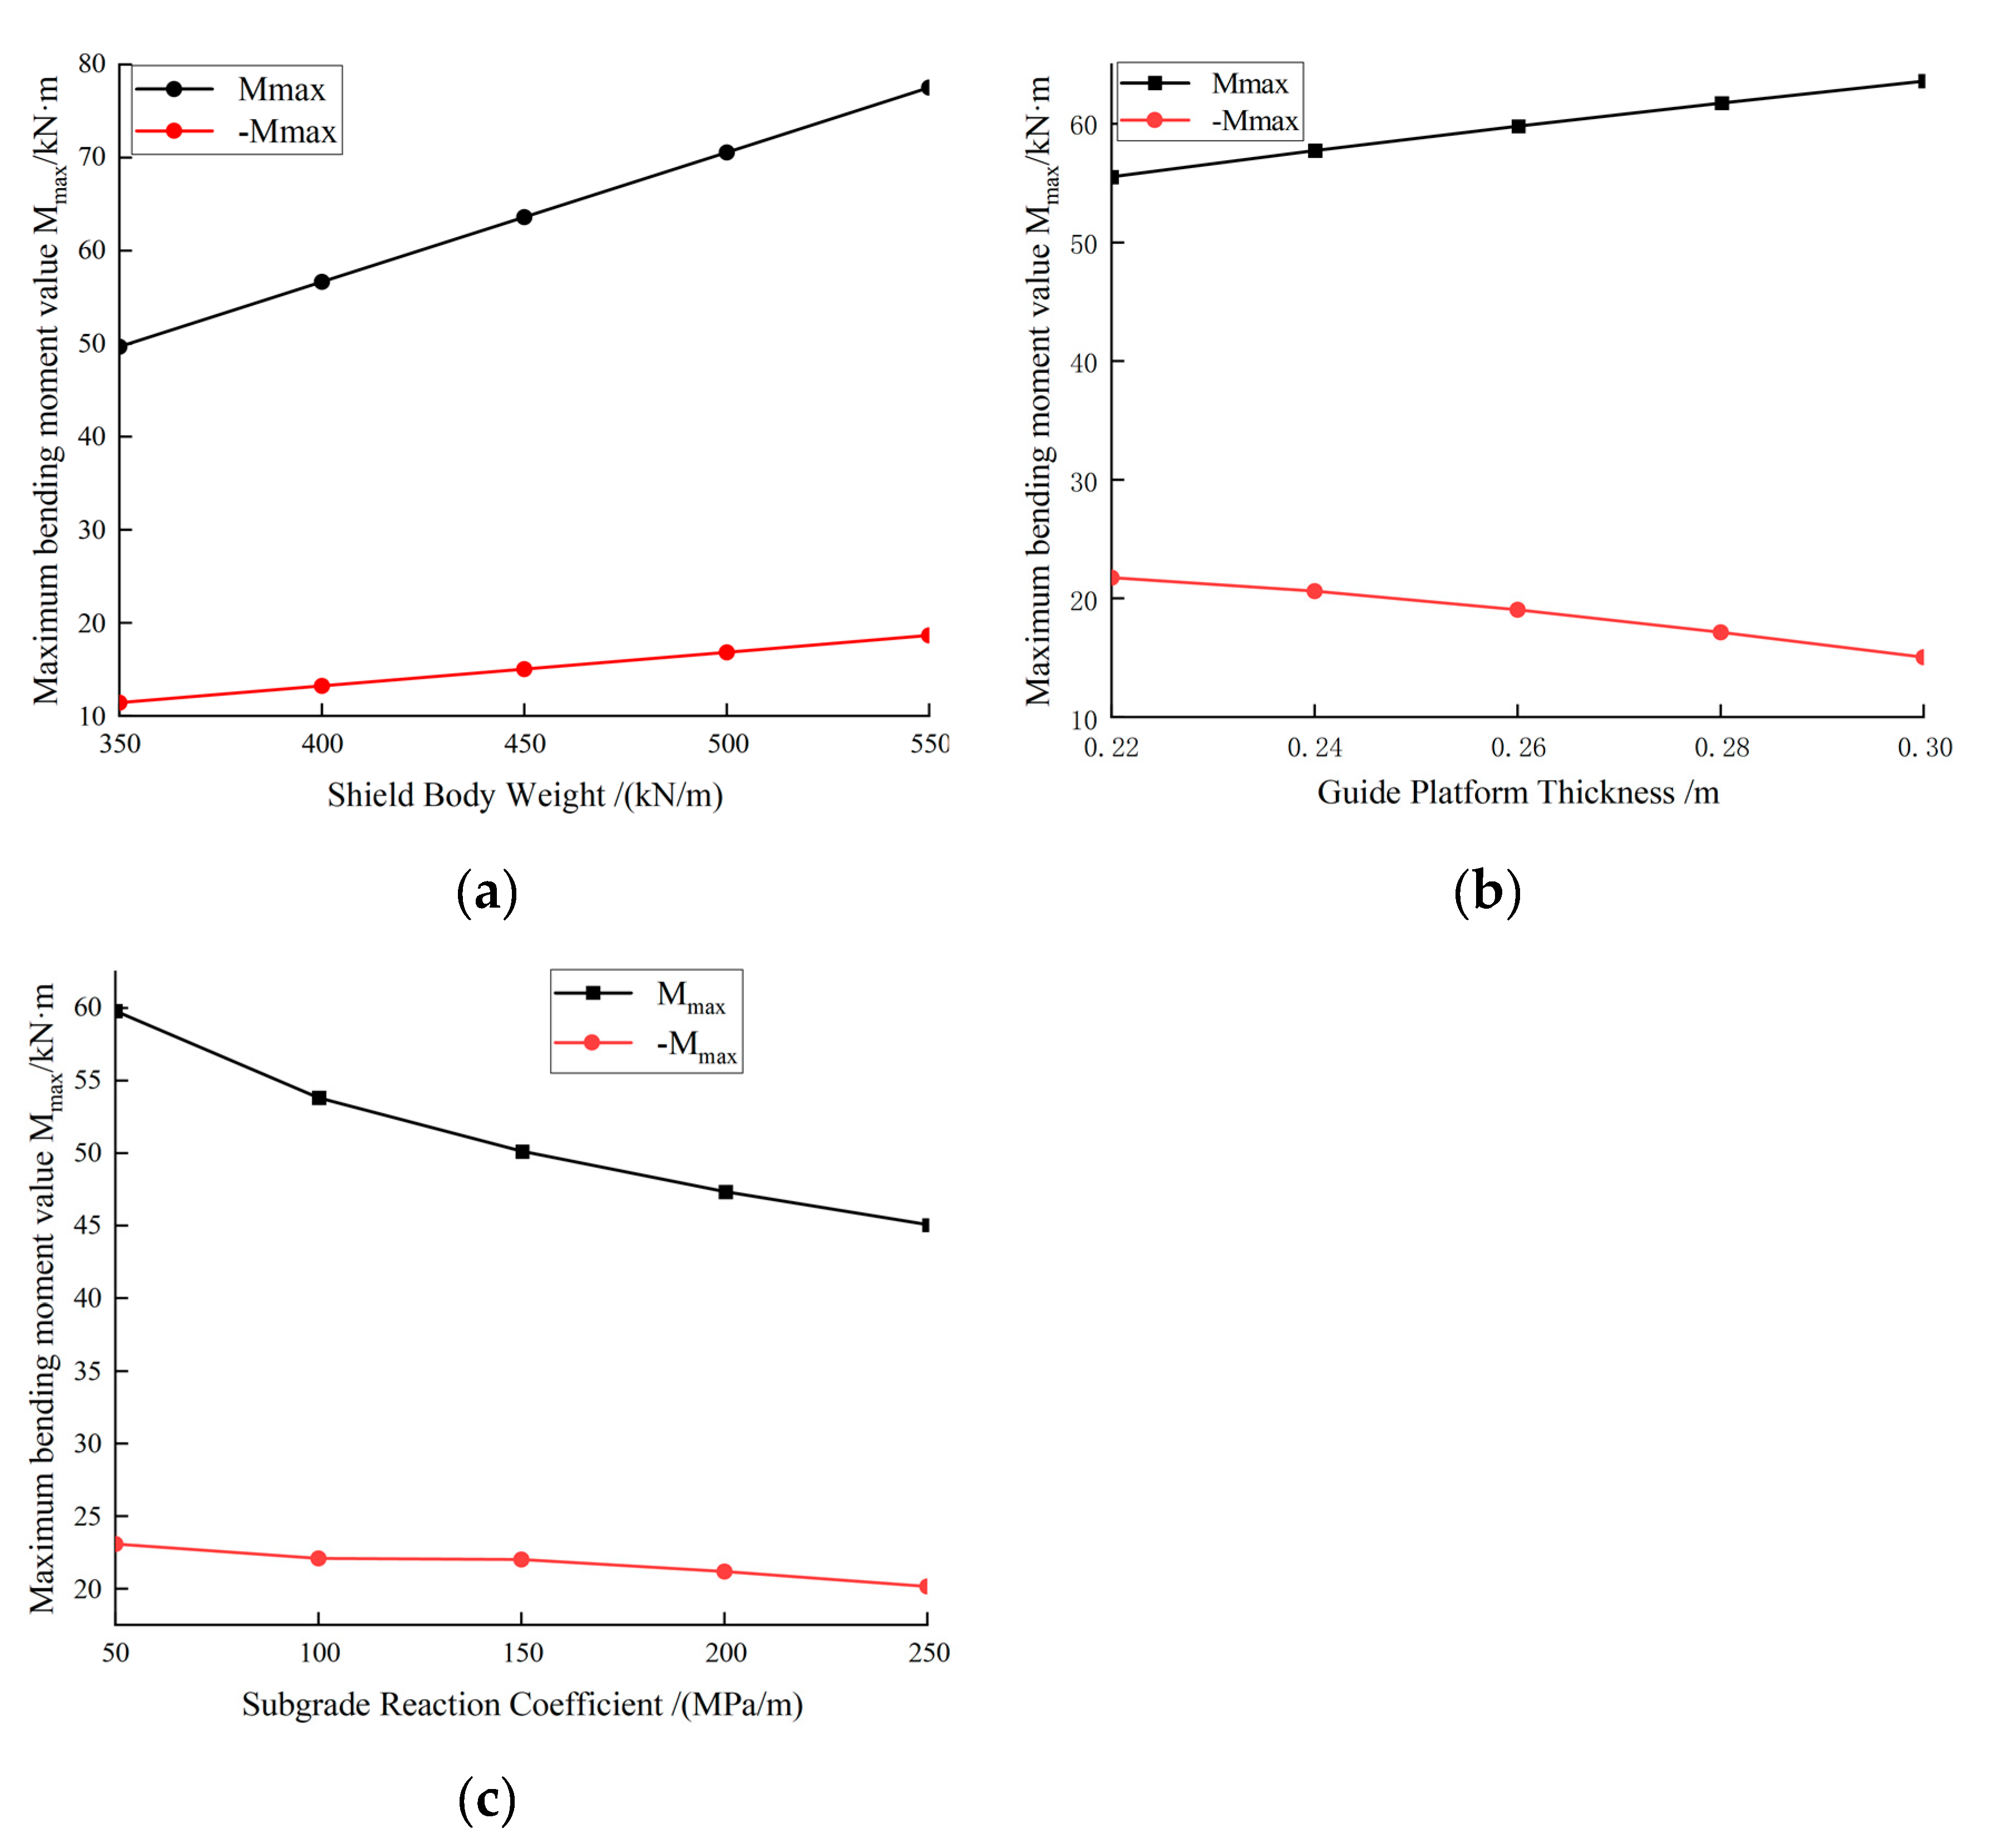
The weight of the shield per metre has an impact on the load applied on the guide platform, which consequently affects the force exerted on the guide platform. In order to analyse this, the stress of the segments at different burial depths was calculated, by varying the weight of the shield per metre to 350, 400, 450, 500, and 550 kN/m. The results, displayed in Figure 8a, demonstrate that the internal forces acting on the guide platform were altered. The maximum bending moment of the guide platform exhibited a linear and positive correlation with the weight of the shield, with its value increasing as weight increased. Since the weight has a greater influence on the maximum positive bending moment compared to the maximum negative bending moment of the guide platform, the disparity between the maximum positive and negative bending moments increases with the shield weight. Consequently, this leads to an uneven distribution of the internal bending moments within the guide platform.

3.4.2. Influence of Guide Platform Thickness on Guide Platform Stress

The thickness of the guide platform directly impacts its stiffness, thus the thickness of the guide platform in the tunnel model was altered to 0.22, 0.24, 0.26, 0.28, and 0.30 m. The internal force variation curves of the guide platform with different thicknesses are depicted in Figure 8b. It is evident that the maximum positive bending moment of the guide platform exhibits a linear relationship with the thickness of the guide platform, with its value increasing as the thickness increases. Conversely, the maximum negative bending moment of the guide platform demonstrates a linear negative correlation with the thickness of the guide platform, with its value decreasing as the thickness increases. As the weight of the shield body has an opposing effect on the maximum positive and negative bending moments, the difference between them increases. Consequently, the uneven distribution of the maximum positive and negative bending moments within the guide platform becomes more pronounced.

3.4.3. Influence of Subgrade Reaction Coefficient on Guide Platform Stress

The bed coefficient represents the pressure required to induce a unit deformation per unit area in a geotechnical body under external force. It plays a role in determining the settlement degree of a structure to some extent. In order to study the impact of different soil bed coefficients on the force acting on the guide platform, values of 50, 100, 150, 200 and 250 MPa/m were selected. The resulting change curve of the internal forces on the guide platform is presented in Figure 8c. Analysis reveals that the maximum positive and negative bending moments of the guide platform exhibit a linear and negative relationship with the bed coefficient. An increase in the bed coefficient has a suppressing effect on the bending moments experience by the guide platform. Notably, the influence of the bed coefficient on the maximum positive bending moments is more pronounced in this project. Consequently, it leads to a gradual equalisation of the maximum positive and negative bending moments within the guide platform.

4. Discussion

Due to the construction conditions of this project are under the engineering geological conditions and technical conditions of construction in China, the study compares with Duan [33] and Cui [34] on the results of the force analysis of the segments in shield technology and Jiang [35] on the simulation results of the displacement of the tunnel construction process for comparison and verification, and refers to the findings of Qiu et al. [36] and Zhu et al. [37] on the structural force characteristics of tunnels. According to these references, It can be shown that the findings of this study for the initial support, segments and guide platform of the tunnel are in line with the results of general research on the structural forces of tunnels and can be verified as reasonable.
This study aims to optimise the stress characteristics of an actual project through a numerical model and investigate the stress variation pattern of certain structures in the air-thrust section of the shield. The findings provide suggestions for the structural design criteria in the shield air-thrust over mine method tunnel project. However, it should be noted that this study only considers some selected engineering geological profiles as references for the model, and the material properties of the structures have been optimised, neglecting the properties of specific substrates or material interactions. Incorporating the numerical simulation results into the actual project and further improving the structural design criteria will be the main focus of future engineering construction.
Considering that the structural criteria for shield empty thrust sections can vary based on different project construction conditions, the recommendations provided in this study for partial structural criteria during construction are relevant but not universally representative. In other words, the results of this study are applicable to the specific conditions of the current project. From the above analysis and discussion, it is evident that by selecting appropriate structural criteria corresponding to the stress variation intervals and considering the impact of each engineering geological condition on the tunnelling project, the range of stress variation can be effectively controlled. This allows for the optimal utilisation of the load-bearing capacity of each structure while ensuring structural integrity. By combining practical project construction experience and employing a well-founded structural design, it is often possible to achieve cost savings in engineering. This can be achieved through effective control of the initial support size, implementation of suitable pipe sheets and other necessary structures, reduction of construction material input, and selection of more appropriate processing techniques. These measures contribute to the economical construction of engineering projects.

5. Conclusions

To address the challenges arising from the construction of shield pushing through the mining method tunnel, this study introduces a novel approach by conducting numerical calculations and analysis using finite element methods. It focuses on evaluating the combined structural system comprising the initial support, shield tube sheet, and shield guide table.

5.1. Recommendations for Initial Support Design Criteria

In contrast to conventional practices that rely on increasing burial depth or reducing overburden thickness to address engineering safety and economic concerns, a more rational determination of burial depth for interval tunnels can be achieved by integrating strata distribution with software analysis. Furthermore, the simulation analysis reveals a positive correlation between the bending moment and axial force of the initial support with the burial depth of the tunnel, displaying a similar pattern of change. However, the growth rate of internal forces decreases after reaching a certain depth. Considering the geological conditions specific to this project, the impact of burial depth on the internal forces of the initial support structure is concentrated in the range of 33-35%, whereas the impact of soil bulk density is concentrated in the range of 44-45%. This indicates that, within a fixed soil layer, the bulk density factor has a greater influence on the internal forces of the initial support structure compared to the burial depth factor. Therefore, when determining the tunnel path, it is crucial to control the burial depth within the range of approximately 22 kN/m³, where bulk density undergoes significant changes. This approach ensures the optimal utilisation of the structure's load-bearing capacity under substantial burial depths while considering the impact of soil bulk density on the initial support structure in this project.
Moreover, the soil Poisson's ratio μ has a distinct impact on axial force changes, differing from other factors. In this project, the range of μ variation falls within 0.25-0.3, which corresponds to the declining section of the internal forces in the initial support. Thus, it has minimal detrimental effects on this structure. Regarding the structural dimensions, it is notable that the lining thickness experiences a sudden change in the internal forces of the initial support within the range of 300-350 mm. Therefore, a thickness of 300 mm can be selected for the initial support in this project, allowing for the full utilisation of the structure's load-bearing capacity while ensuring an economical choice of materials..

5.2. Recommendations for Segments Design Criteria

The simulation analysis revealed similar effects of tunnel depth, soil density, soil Poisson's ratio μ, and lining thickness on the internal forces of both the segments and the initial support. The impact of burial depth on the internal forces of the initial support structure was concentrated in the range of 33-36%, while the influence of soil density was concentrated in the range of 44-45%. The soil Poisson's ratio μ also affected the internal forces of the initial support, as it fell within the declining stage. On the other hand, the effect of lining thickness on the segment's forces was weaker compared to the initial support.
Overall, the changes in conditions within this project had a lesser impact on the internal forces of the segments compared to the initial support. Therefore, the design standards for the segments can complement those of the initial support. Although the influence of backfill thickness on the internal forces of the segments was relatively balanced and concentrated in the range of 4-7%, it is crucial to control the backfill void to be no less than approximately 300 mm. This is the point where the maximum axial force mutation occurs, and maintaining this threshold helps prevent structural stress mutations. It is evident that the time factor plays a crucial role in the assembly of pipe pieces into rings and gap backfill processes. This factor significantly impacts the forces and displacements experienced by the pipe pieces. Therefore, further investigation into the use of integrated assembled structural bodies in similar projects is recommended for future stages.

5.3. Recommendations for Guiding Platform Design Criteria

Through the analysis of the influence of the weight of the shield and the thickness of the guide platform on the internal forces of the guide platform, it was observed that the variations in internal forces caused by changes in the shield's weight were amplified by a factor of 1.54. Similarly, the variations in internal forces resulting from changes in the guide platform's thickness were amplified by a factor of 1.43. Therefore, considering the limitation of the shield machine equipment's weight, it is advisable to avoid excessively large thicknesses for the guide platform. For this project, a recommended control range for the guide platform's thickness would be around 200-250 mm.
Additionally, taking into account the planned tunnel burial depth and the range of the soil bed coefficient in this project (150-250 MPa/m), it can be observed that the project is situated in a stage where there is a balance between the positive and negative maximum bending moments. This is a favourable condition for the construction of this project.

Author Contributions

Conceptualization, E.D. and L.Z.; methodology, R.F.; software, R.F.; validation, E.D. , L.Z. and R.F.; formal analysis, R.F.; investigation, E.D.; resources, R.F.; data curation, R.F.; writing—original draft preparation, E.D.; writing—review and editing, E.D. and L.Z.; visualization, E.D.; supervision, L.Z.

Funding

This work was financially supported by the National Natural Science Foundation of China (52204104); the Sichuan Science and Technology Program (2023YFH0022); the Opening Fund of State Key Laboratory of Geohazard Prevention and Geoenvironment Protection, Chengdu University of Technology (SKLGP2021K009); the Open Fund of Shock and Vibration of Engineering Materials and Structures Key Laboratory of Sichuan Province (20kfgk01); the Natural Science Foundation of Hebei Province (E2021402050); the Major research and development project of Metallurgical Corporation of China LTD in the non-steel field (2021-05); the Sichuan University postdoctoral interdisciplinary Innovation Fund.

Data Availability Statement

The datasets generated for this study are available from the corresponding author upon reasonable request.

Acknowledgments

The authors of this work are grateful for the experimental help provided by the Key Laboratory of Deep Earth Science and Engineering, Ministry of Education.

Conflicts of Interest

The authors declare that they have no conflict of interest.

References

  1. Bi Jingdong, Zhao Dejie. Research on construction technology of large-diameter shield tunneling empty pushing through mining method[J]. Urban Rapid Rail Transit Research 2021, 24, 90–94. [Google Scholar]
  2. Erharter, G.H. , Goliasch, R. & Marcher, T. On the Effect of Shield Friction in Hard Rock TBM Excavation[J]. Rock Mech Rock Eng 2023, 56, 3077–3092. [Google Scholar]
  3. Choi, WY. , Lee, SW. Experimental Study on Waterproofing Performance of Segments Based on Sealant Installation Methods[J]. KSCE J Civ Eng 2023, 27, 857–861. [Google Scholar] [CrossRef]
  4. Li Jianming. New technology for shield tunneling empty pushing through mining method[J]. Railway Standard Design 2011, 11, 93–96. [Google Scholar]
  5. Hong Kairong, Li Zhijun, Chen Kui, et al. Development of translational-pneumatic integrated device for hydraulic shield / TBM mainframe [J]. Chinese Journal of Railway Engineering 2021, 38, 97–102. [Google Scholar]
  6. B. T. Le, T.T.T. Nguyen, S. Divall, et al. A study on large volume losses induced by EBPM tunnelling in sandy soils[J]. Tunnelling and Underground Space Technology 2023, 132, 104847. [Google Scholar] [CrossRef]
  7. Jie Li, Yi Gong, Shu-peng Zhao, et al. Material and processing optimization on disc cutter of tunnel boring machine for failure prevention[J]. Engineering Failure Analysis 2022, 138, 106363. [Google Scholar] [CrossRef]
  8. Wenge Qiu, Xufeng Ai, Yuchao Zheng, First application of mechanized method using earth pressure balance TBM with large horseshoe-shaped cross section to loess mountain tunnel: A case study of Baicheng tunnel[J]. Tunnelling and Underground Space Technology 2022, 126, 104547. [CrossRef]
  9. J. N. Shirlaw, T.O. Henderson, I.S. Haryono, et al.The effect of altering the slurry circulation system on TBM tunnelling in weathered Kowloon granite[J]. Tunnelling and Underground Space Technology 2022, 124, 104474. [Google Scholar] [CrossRef]
  10. Gao Yanwei, Weng Zicai, Zhang Zhaohuang. Application analysis of shield technology in tunnel construction [J]. Journal of China Academy of Water Resources and Hydropower Research 2020, 18, 502–507. [Google Scholar]
  11. M. D. Goel, Shivani Verma, Jagriti Mandal, et al.Effect of blast inside tunnel on surrounding soil mass, tunnel lining, and superstructure for varying shapes of tunnels[J]. Underground Space 2021, 6, 619–635. [Google Scholar] [CrossRef]
  12. Md Shariful Islam, Magued Iskander,Three-dimensional numerical investigation of ground settlement caused by piggyback twin tunnels[J]. Tunnelling and Underground Space Technology 2023, 134, 104970. [CrossRef]
  13. Xinghua Fang, Junsheng Yang, Xuemin Zhang, et al. Numerical modeling of open TBM tunneling in stratified rock masses using a coupled FDM-DEM method[J]. Computers and Geotechnics 2023, 156, 05251. [Google Scholar]
  14. Deming Xu, Yusheng Wang, Jingqi Huang, et al. Prediction of geology condition for slurry pressure balanced shield tunnel with super-large diameter by machine learning algorithms[J]. Tunnelling and Underground Space Technology 2023, 131, 104852. [Google Scholar] [CrossRef]
  15. Hussaine, S.M. , Mu L. Intelligent Prediction of Maximum Ground Settlement Induced by EPB Shield Tunneling Using Automated Machine Learning Techniques[J]. Mathematics 2022, 10, 4637. [Google Scholar] [CrossRef]
  16. Liang Chen, Kimihiro Hashiba, Zhitao Liu, et al. Spatial-temporal fusion network for maximum ground surface settlement prediction during tunnel excavation[J]. Automation in Construction 2023, 147, 104732. [Google Scholar] [CrossRef]
  17. Wang Rui, Qi Taiyue, Feng Jian, et al. Analysis and application of positive inversion of tunnel construction parameters based on genetic algorithm with BP neural network[J]. Journal of Railways 2016, 38, 98–104. [Google Scholar]
  18. Ruan Hengfeng, Liang Rongzhu, Kang Cheng, et al. Three-dimensional refined numerical simulation study on deformation mechanism of subway shield tunnel under surface sudden loading [J]. Safety and Environmental Engineering 2023, 30, 35–45. [Google Scholar]
  19. Lv Xilin, Zhao Yucheng, Cai Jiantao. Numerical simulation of subsidence deformation induced by shield tunnel construction disturbance in water-rich sand layer [J]. Modern Tunnel Technology 2020, 57, 104–109. [Google Scholar]
  20. Martin Ziegler, Arash Alimardani Lavasan, Simon Loew,Stress evolution around a TBM tunnel in swelling clay shale over four years after excavation[J]. Tunnelling and Underground Space Technology 2022, 128, 104649. [CrossRef]
  21. Xiao-Wei Ye, Xiao-Long Zhang, Hong-Qian Zhang, et al. Prediction of lining upward movement during shield tunneling using machine learning algorithms and field monitoring data[J]. Transportation Geotechnics 2023, 41, 101002. [Google Scholar] [CrossRef]
  22. Hongwei Huang, Jiaqi Chang, Dongming Zhang, et al. Machine learning-based automatic control of tunneling posture of shield machine[J]. Journal of Rock Mechanics and Geotechnical Engineering 2022, 14, 1153–1164. [Google Scholar] [CrossRef]
  23. Xuyan Tan, Weizhong Chen, Tao Zou, et al. Real-time prediction of mechanical behaviors of underwater shield tunnel structure using machine learning method based on structural health monitoring data[J]. Journal of Rock Mechanics and Geotechnical Engineering 2023, 15, 886–895. [Google Scholar] [CrossRef]
  24. Khalid Elbaz, Shui-Long Shen, Annan Zhou, et al. Prediction of Disc Cutter Life During Shield Tunneling with AI via the Incorporation of a Genetic Algorithm into a GMDH-Type Neural Network[J]. Engineering 2021, 7, 238–251. [Google Scholar] [CrossRef]
  25. Xiangzhen Zhou, Chuang Zhao, Xuecheng Bian. Prediction of maximum ground surface settlement induced by shield tunneling using XGBoost algorithm with golden-sine seagull optimization[J]. Computers and Geotechnics 2023, 154, 105156. [Google Scholar] [CrossRef]
  26. Zhou Weijia, Ma Jia, An Jianyong, et al. On the application of large-area anchor cable group extraction construction technology in deep sand narrow fertilizer trough [J]. Building construction 2022, 44, 2191–2193. [Google Scholar]
  27. Kangjian Zhang, Xing Zhao, Zhiqiang Zhang, Influences of tunnelling parameters in tunnel boring machine on stress and displacement characteristics of surrounding rocks[J]. Tunnelling and Underground Space Technology 2023, 137, 105129. [CrossRef]
  28. Cai Yuelong, Du Wei. Numerical simulation of tunnel excavation by CRD method [J]. Engineering and construction 2018, 32, 114–115. [Google Scholar]
  29. Su Xiaokun. Study on the value range of surrounding rock boundary in numerical simulation of tunnel excavation [ J ]. Railway Engineering 2012, 3, 64–68. [Google Scholar]
  30. Yan Zhuang, Xiaoyan Cui, Shunlei Hu. Numerical simulation and simplified analytical method to evaluate the displacement of adjacent tunnels caused by excavation[J]. Tunnelling and Underground SpaceTechnology 2023, 132, 104879. [Google Scholar] [CrossRef]
  31. Sang Yunlong, Liu Xuezeng, Zhang Qiang. Analysis and application of stiffness analysis of tube sheet annular joint in metro shield tunnel based on bolt-convex tenon connection[J]. Tunnel Construction 2020, 40, 19–27. [Google Scholar]
  32. Technical specification for structural safety protection of urban rail transit (with explanatory notes on provisions):CJJ/T 202-2013[S]. 2013.
  33. Duan Junmeng. Research on the mechanical response of pipe sheet for shield tunnel liaison channel construction[D]. Beijing Jiaotong University, 2019.
  34. Cui Huan. Finite element analysis of force characteristics of shield pipe sheet [D]. Shenyang University of Technology, 2021.
  35. Jiang Yuyu. Structural analysis and health monitoring of shield tunnel pipe sections [D]. Dalian University of Technology, 2020.
  36. Jutao Qiu, Xiaojun Zhou, Yusheng Shen, et al. Failure mechanism of the deep-buried metro tunnel in mixed strata: Physical model test and numerical investigation[J]. Tunnelling and Underground Space Technology 2023, 139, 105224. [Google Scholar] [CrossRef]
  37. Yueyue Zhu, Cheng Liu, Xiaotian Yin, et al. Analysis of the Internal Force and Deformation Characteristics of Double-Layer Lining Structure of Water Conveyance Tunnel[J]. Geofluids 2022, 9159632.
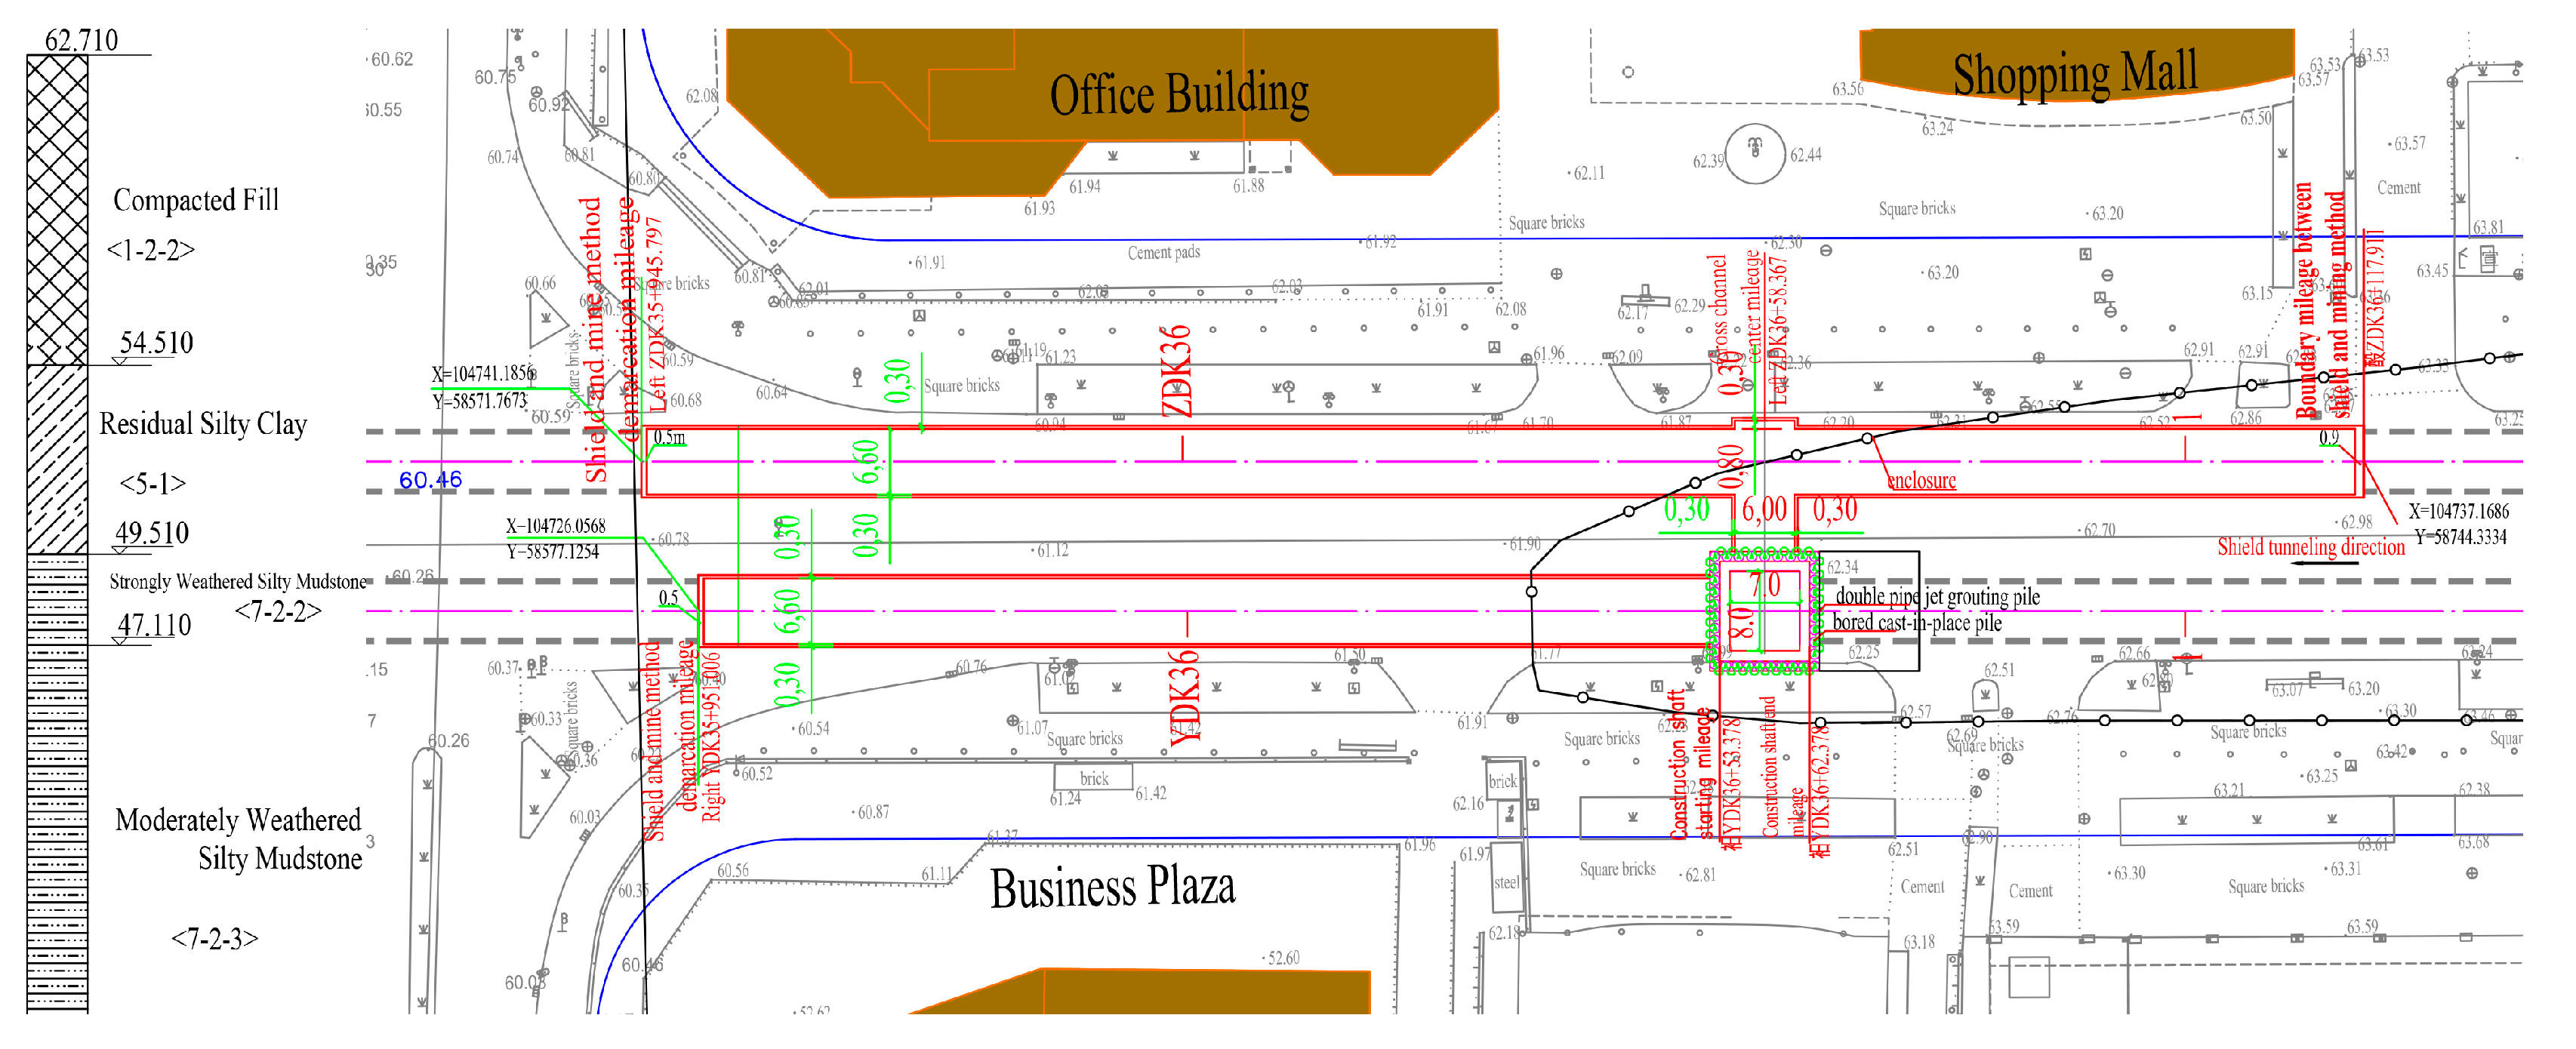
Figure 1. The engineering geological distribution map and plan view of the undermining section.
Preprints 76629 g001
Figure 2. Cross-sectional view of the mining method tunnel.
Preprints 76629 g002
Figure 3. Finite element calculation models. (a) Finite element calculation models of each structure; (b) Boundary conditions of finite element calculation models.
Preprints 76629 g003
Figure 4. Displacement cloud map for the second construction stage. (a) the displacement values in the x, y and z directions after the initial support construction; (b) the displacement values in the x, y and z directions after the lower half of the gravel construction; (c) the displacement values in the x, y and z directions after the tunnel lining segment construction; (d) the displacement values in the x, y and z directions after the upper half of the gravel construction with a half symbol.
Preprints 76629 g004
Figure 5. Tunnel x, y and z-direction displacement values after single tunnel completion. (a) x-direction displacement value of the tunnel after the completion of the left and right tunnel construction; (b) y-direction displacement value of the tunnel after the completion of the left and right tunnel construction; (c) z-direction displacement value of the tunnel after the completion of the left and right tunnel construction.
Preprints 76629 g005
Figure 6. Initial support stress variation curve. (a) influence curve of tunnel burial depth on initial support stress; (b) influence curve of soil bulk density on initial support stress; (c) influence curve of soil Poisson's ratio on initial support stress; and (d) influence curve of initial support thickness on initial support stress.
Preprints 76629 g006
Figure 7. Segment stress variation curve. (a) influence curve of tunnel depth on segment stress; (b) influence curve of soil unit weight on segment stress; (c) influence curve of soil Poisson's Ratio on segment stress; (d) influence curve of Lining thickness on segment stress; and (e) influence curve of backfill thickness on segment stress.
Preprints 76629 g007
Figure 8. Guide platform stress variation curve. (a) influence curve of shield body weight on guide platform stress; (b) influence curve of guide thickness on guide platform stress; and (c) influence curve of subgrade reaction coefficient on guide stress.
Preprints 76629 g008
Table 1. Physical and mechanical parameters of model materials.
Soil and Rock Name Natural Density ρ/(g/cm2) Cohesion c/kPa Internal Friction Angle Φ/(°) Compression Coefficient/MPa-1 Deformation Modulus /MPa Poisson's Ratio μ Subgrade Reaction Coefficient
Vertical Kv/(MPa/m) Horizontal Kh/(MPa/m)
Compacted Fill 1.97 12.0 15.6 0.35 / / 14 18
Residual Silty Clay 2.00 30.0 15.0 0.30 25 0.30 45 35
Strongly Weathered Silty Mudstone 2.29 45.0 28.0 0.20 120 0.25 150 140
Moderately Weathered Silty Mudstone 2.31 150.0 32.0 / 2500* 0.22 240 220
* Values with an asterisk (*) represent rock elastic modulus.
Table 2. Urban rail transit structural safety control index values.
Safety Control Indicators Early Warning Value Control Value
Tunnel Horizontal Displacement < 10 mm < 20 mm
Tunnel Vertical Displacement < 10 mm < 20 mm
Disclaimer/Publisher’s Note: The statements, opinions and data contained in all publications are solely those of the individual author(s) and contributor(s) and not of MDPI and/or the editor(s). MDPI and/or the editor(s) disclaim responsibility for any injury to people or property resulting from any ideas, methods, instructions or products referred to in the content.
Copyright: This open access article is published under a Creative Commons CC BY 4.0 license, which permit the free download, distribution, and reuse, provided that the author and preprint are cited in any reuse.
Prerpints.org logo

Preprints.org is a free preprint server supported by MDPI in Basel, Switzerland.

Subscribe

© 2024 MDPI (Basel, Switzerland) unless otherwise stated