Preprint
Review

Novel Amorphous-Wollastonitic Low-Calcium Hydraulic Binders: A State-of-the-Art Review

Altmetrics

Downloads

108

Views

30

Comments

0

A peer-reviewed article of this preprint also exists.

Submitted:

14 June 2023

Posted:

15 June 2023

You are already at the latest version

Alerts
Abstract
Due to the severe environmental impact of the CO2 emissions associated with the production of Ordinary Portland Cement (OPC) and the increasing demand for this commodity material, the development of alternative products has become a global concern. One alternative to OPC, or alitic-based clinkers, are amorphous-wollastonitic low calcium hydraulic binders (AWLCs). This new class of hydraulic binders, described in the literature for the first time in 2015, may significantly reduce the CO2 emissions associated with its production, resulting from its lower calcium content, but also from the fact that its production technology can be fully electrified. In this paper it is provided a state-of-the-art review, providing a comprehensive description on the latest research, summarizing both the physico-chemical and mechanical characteristics for this type of hydraulic binders, as well as possible routes for its production at an industrial scale.
Keywords: 
Subject: Chemistry and Materials Science  -   Materials Science and Technology

1. Introduction:

Ordinary Portland Cement (OPC) is a hydraulic binder manufactured in a rotary kiln whose raw materials contain adequate amounts of lime, silica, and, in smaller proportions, alumina and iron oxide [1]. The mixture is first calcined at 900ºC, followed by a clinkering stage at 1450ºC, to allow the formation of alite (CaO)3.SiO2 and, in smaller amounts, belite (CaO)2.SiO2 [1]. The produced clinker, with a density of ~3.1 g/cm3 [2], is then ground to an optimum particle size distribution [3], obtaining a specific surface area that ranges from 3000 to 5000 cm2/g [4,5,6]. When in contact with water, OPC goes through an exothermic hydration reaction responsible for the material's strength development. This reaction can release more than 250 J/g of cumulative heat after 72 h of hydration [7].
OPC is mainly used in the production of mortar (cement mixed with water and sand) and concrete (cement mixed with water, sand, and other coarse aggregates). Concrete is extremely resilient and durable, can bear heavy compressive loads, and resist severe environmental conditions, making it the world's most widely used construction material [7]. The main factors that influence the compressive strength of concrete are hydration time, the type of cement used, and temperature and curing conditions [1]. OPC is not only a widely used material with well-established manufacturing technology but is also a low-cost commodity, as it is made from raw materials abundant in the Earth’s crust (SiO2 and CaO). Hence, due to these unique properties and the growing need for housing, services, and transport network development, cement consumption is expected to significantly increase in the next decade [8].
Nevertheless, the production of OPC has a significant environmental impact. In fact, for each ton of clinker produced about 800 kg of CO2 is concomitantly produced, which means that the production of one ton of OPC may result in the release of up to 540 kg of CO2 into the atmosphere [9,10]. These CO2 emissions result from to two main sources: CO2 process emissions (CPE) and CO2 energy emissions (CEE). CPE come from to chemical reaction involved in the decarbonization of limestone, while CEE are related to the burning of fossil fuel required for heating the cement kiln [11].
Consequently, reducing the environmental impact of cement production has become an increasing concern. In the 2022 Energy Agency Report [8], one of the thresholds to reach by 2050 was the “near-zero emission” of the cement industry, aiming for over 80% of reduction of the emissions, as compared to the present best available technology.
Nevertheless, the quest for carbon neutrality depends on the rapid scale-up deployment of alternative clinker technologies such as alkali-activated materials (AAM) [22] or low calcium hydraulic binders (LCHB), which may reduce CO2 emissions by decreasing the amount of CaCO3 used in their production [12,13,14,15,16,17,18,19].
LCHBs are materials rich in phases with lower calcium content than alite, such as belite, rankinite (CaO)3(SiO2)2, or wollastonite CaO.SiO2. Belite is a hydraulic phase but has a much slower hydration kinetics than alite due to its densely packed structure and lower solubility, lowering the compressive strength of the binder at early ages [20,21]. Both rankinite and wollastonite are non-hydraulically active, hence, binders rich in these phases usually go through a carbonation process instead of a hydration reaction [19,22].
In 2015, an alternative LCHB was developed and patented internationally [12,17]. The precursor idea involves the production of a material with a Ca/Si ratio of ~1, corresponding approximately to the chemical composition in which wollastonite crystallizes in equilibrium conditions [13], but processed in a way that promotes the formation of an amorphous phase upon cooling instead of the crystalline one. In fact, it was shown that, by melting a mixture with a Ca/Si ratio of ~1 at a temperature between 1460 and 1550ºC, corresponding to the liquid or the liquid + pseudowollastonite zone, followed by a fast quenching, a material with hydraulic properties is obtained [12,13,17]. This material is mostly amorphous (~94% wt%), with the presence of a small proportion of pseudowollastonite (<10%). The reduction of the calcium content of this material results in a decrease of more than 25% of the CPE, as compared to alitic clinkers [10]. Moreover, the complete melting of this amorphous-wollastonitic low-calcium hydraulic binders (AWLCs) enables for the perspective of the full electrification of the production process [10], which, theoretically, may result in “near zero” CEE emissions.
Several studies have been made to characterize the properties and hydraulic activity of AWLCs. The chemical composition and microstructure of AWLCs and its respective hydration products were determined using X-ray fluorescence (XRF), Nuclear Magnetic Resonance (NMR), Fourier-transform infrared spectroscopy (FTIR), X-ray diffraction (DRX), and High-resolution Transmission Electron Microscopy (HR-TEM) [13,23,24,25]. The hydration of the binder with water has been characterized by measuring the compressive strength of pastes at various ages [17,26,27,28], and its chemical reaction has been followed by using isothermal calorimetry and computational work [29]. More recent works explored the impact of an alkaline activation of AWLC [15,30]. In the following points, the state-of-the-art review in what concerns the production, characterization, and optimization of AWLCs, as well for the the perspectives for future developments, is presented.

2. Production of AWLC hydraulic binders

As previously mentioned, the chemical composition of the AWLC leads to a Ca/Si ratio close to 1, i.e., in the wollastonitic domain. Typically, the raw materials were ground, mixed and compressed, and then melted at a temperature between 1550 and 1450ºC, following a three-step procedure [31]:
  • Heating the raw mixture at a rate R1= 25ºC/min to reach the required melting temperature (T1).
  • Maintain temperature T1 in the liquid region for a period of t1= 60 min to allow the homogenization of the composition.
  • Quenching the system to room temperature at a rate of at least 300 ºC/min.
After quenching, a material with a density of 2.94±0.5 g/cm3 is obtained, and its grinding completes the production process [17].

3. Characterization of the AWLC

3.1. Anhydrous material

Figure 1 shows the FTIR and NMR analysis on samples of AWLC with Ca/Si ratios ranging from 0.8 to 1.25 (taken from [25]). The FTIR analysis of AWLC binders shows five main regions:
  • 400 to 500 cm-1;
  • 600 to 750 cm-1;
  • 780 to 850 cm-1 870 to 900 cm-1;
  • 900 to 1000 cm-1 and
  • 1100 to 1200 cm-1.
The peak identified as a, located around 450-490 cm1, can be attributed to Si-O-Si bending [32] and is similar in all samples. The bands at b are caused by the tetrahedral Si-O-Si vibration of amorphous silica [33], and they increase as the Ca/Si ratio increases, indicating the presence of Q1 and Q0 structures on the sample [17]. The peak at c can be attributed to isolated tetrahedra's non-bridging Si-O stretching mode [33]. The bands d and e are related to the stretching vibrations of non-bridging Si-O bonds, indicating the presence of Q2 and Q3 units [17,33]. The shoulder at e is more prominent in samples with a lower Ca/Si ratio, indicating the formation of a more structured sample.
The deconvolutions of the 29Si MAS NMR spectra are shown in Table 1. It can be observed that contrarily to what happens with wollastonite, which is essentially formed by Q2 structures [34], the AWLC is formed by a dispersion of Qn connectivity’s, with a prevalence of Q1 units with a dispersion of Q0, Q2, and Q3. It can be observed that as the Ca/Si increases from 0.8 to 1.1, there is an increase in the proportion of Q0 units and, then, the Q0 proportion decreases again. Hence, with the increase in Ca content from 0.8 to 1.1, there is increasing depolymerization of the silicate chains [25].

3.2. Hydrated material

Isothermal calorimetry
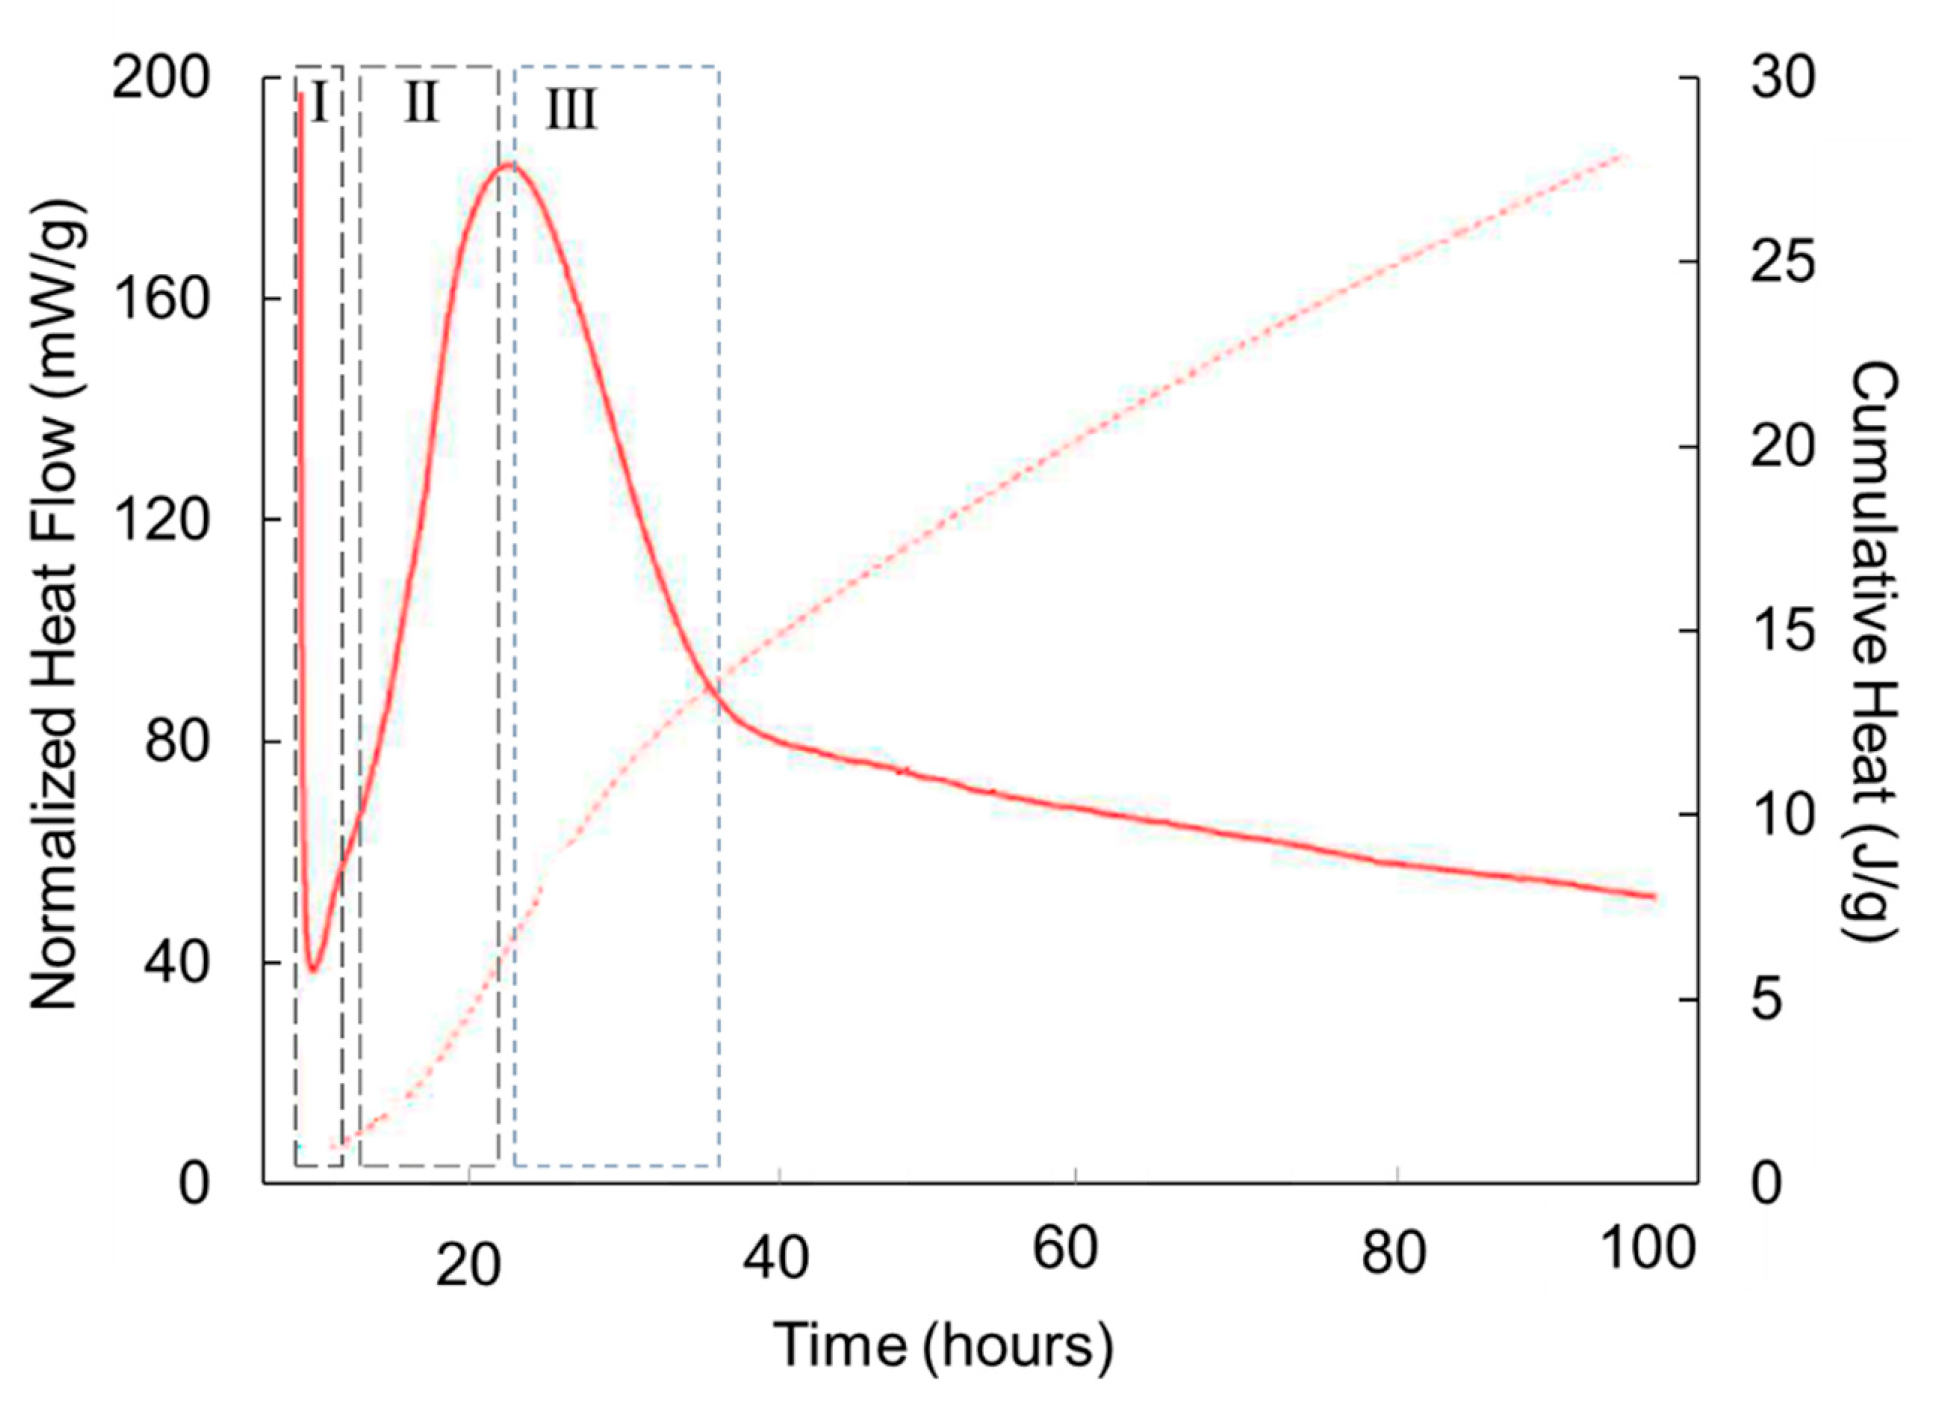
Since understanding the kinetics of the hydration reaction is crucial for evaluating the binder’s compressive strength, isothermal calorimetry measurements were used to track the hydration evolution of the material. Figure 2 illustrates the three regions that can be observed in AWLC calorimetric experiments:
I.
A first stage of the hydration, characterized by a slow reaction kinetics, also observed in OPC, is usually attributed to species ionic dissolution [35].
II.
An acceleration period characterized by a high rate of heat release [35,36]. In OPC this stage is usually attributed to the precipitation of CSH products and portlandite. Since in AWLC, there is no precipitation of portlandite, this second stage should correspond to the formation of CSH and, most probably, to the formation of tobermorite, which is present in the hydrated product [16] as we will see in the following points.
III.
A deceleration period, in which the rate of the reaction decreases, probably due to the inability of CSH to keep precipitating on the surface of the grains, in this period a gradual densification of the microstructure occurs, as described for OPC [36,37].
The activation energy (Ea) of AWLC pastes was recently calculated by using the Arrhenius equation and calorimetric results in a range of temperatures from 20 to 35ºC [16]. The results showed that the AWLC has an experimental Ea in the 82–85 kJ/mol range [16] which is almost 50% higher than the Ea of alitic and belitic clinkers (51 and 55 kJ/mol [38,39]). This higher activation energy of the AWLC material as compared to conventional clinkers was attributed to the formation of structurally different hydration products, with higher CSH mean chain length, low Ca/Si ratio, and higher crystallinity. [17].
FTIR and NMRanalysis
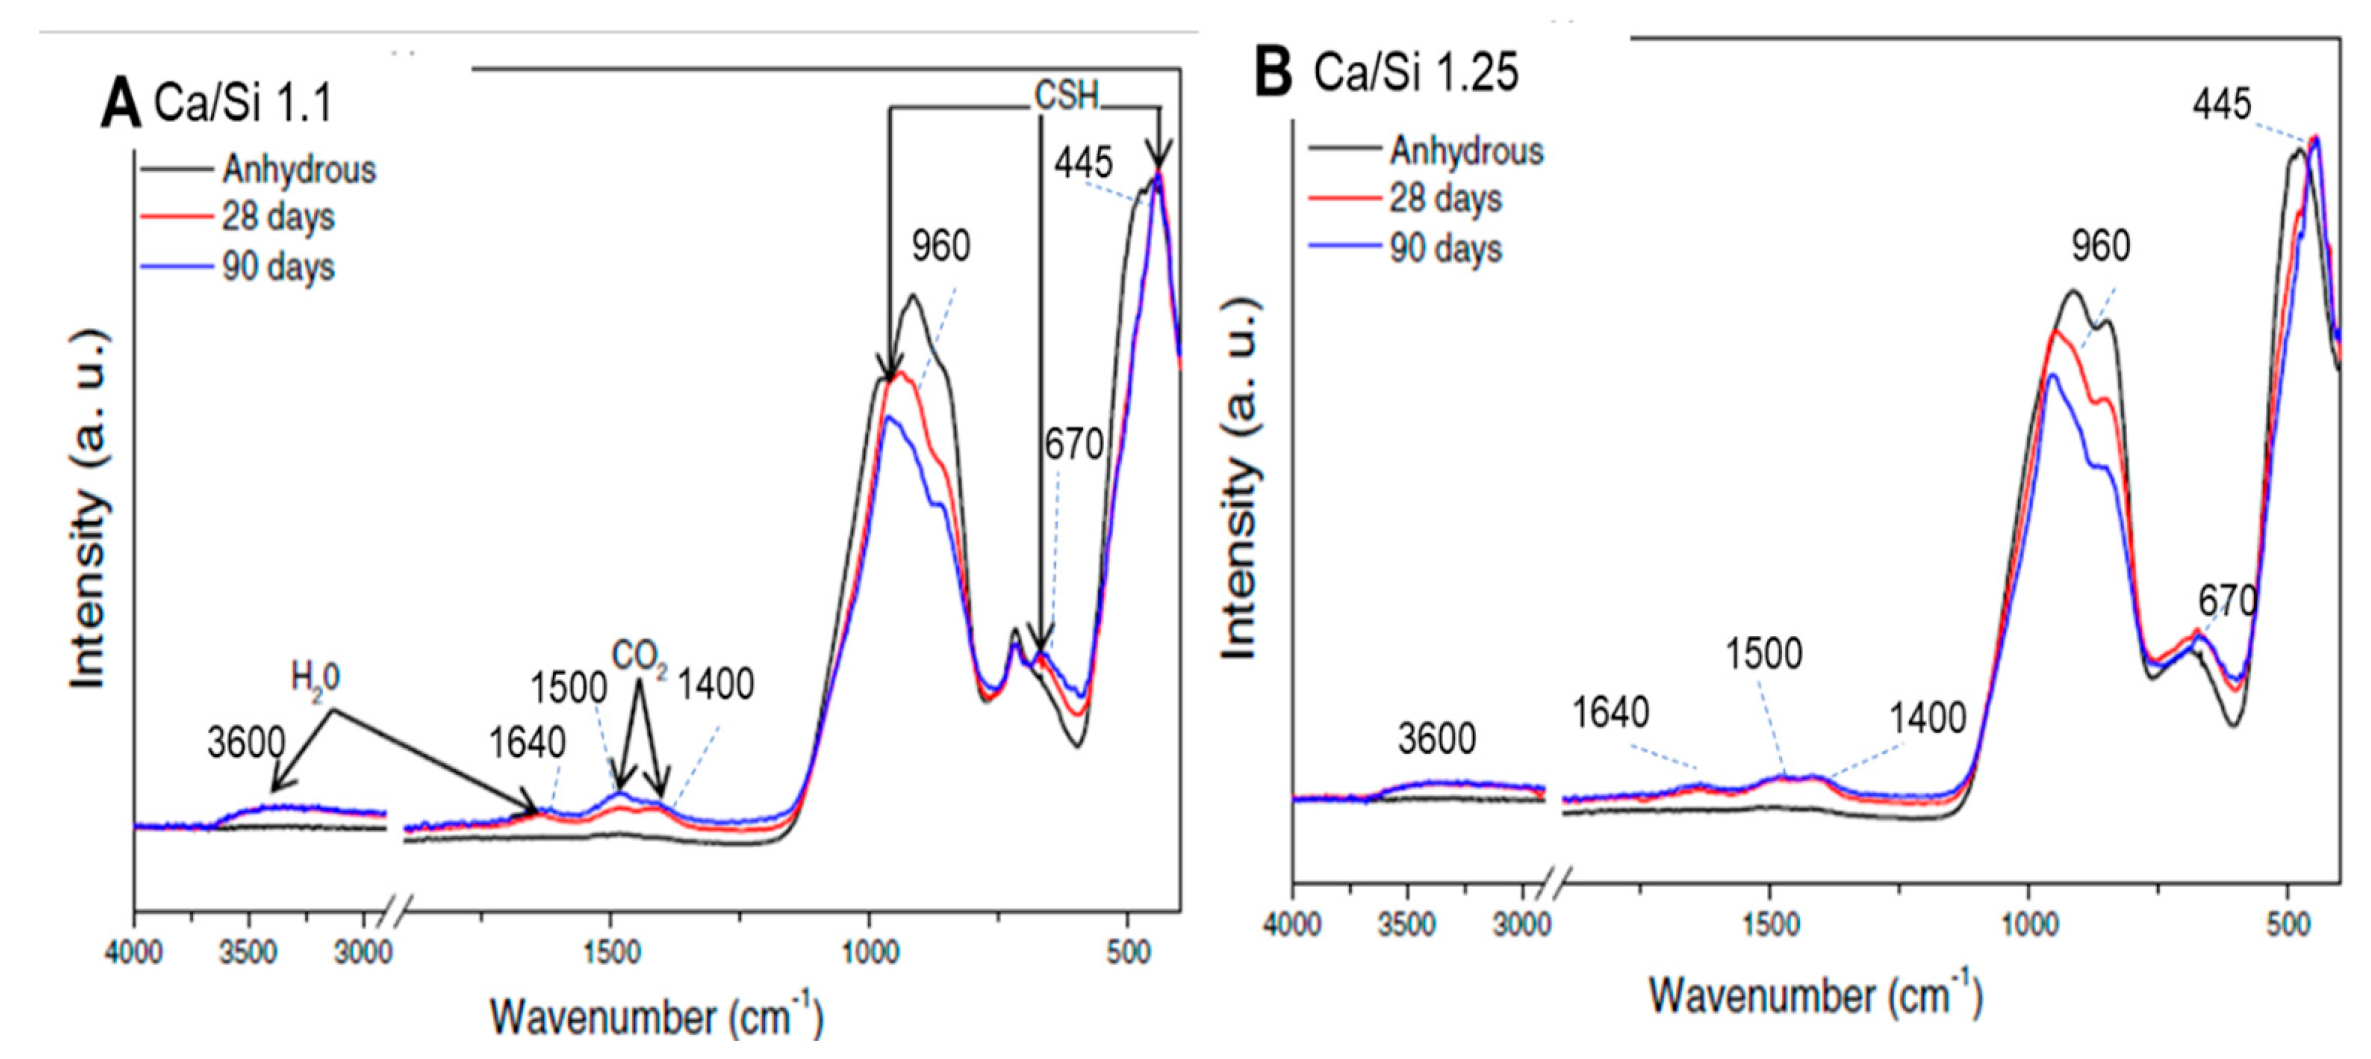
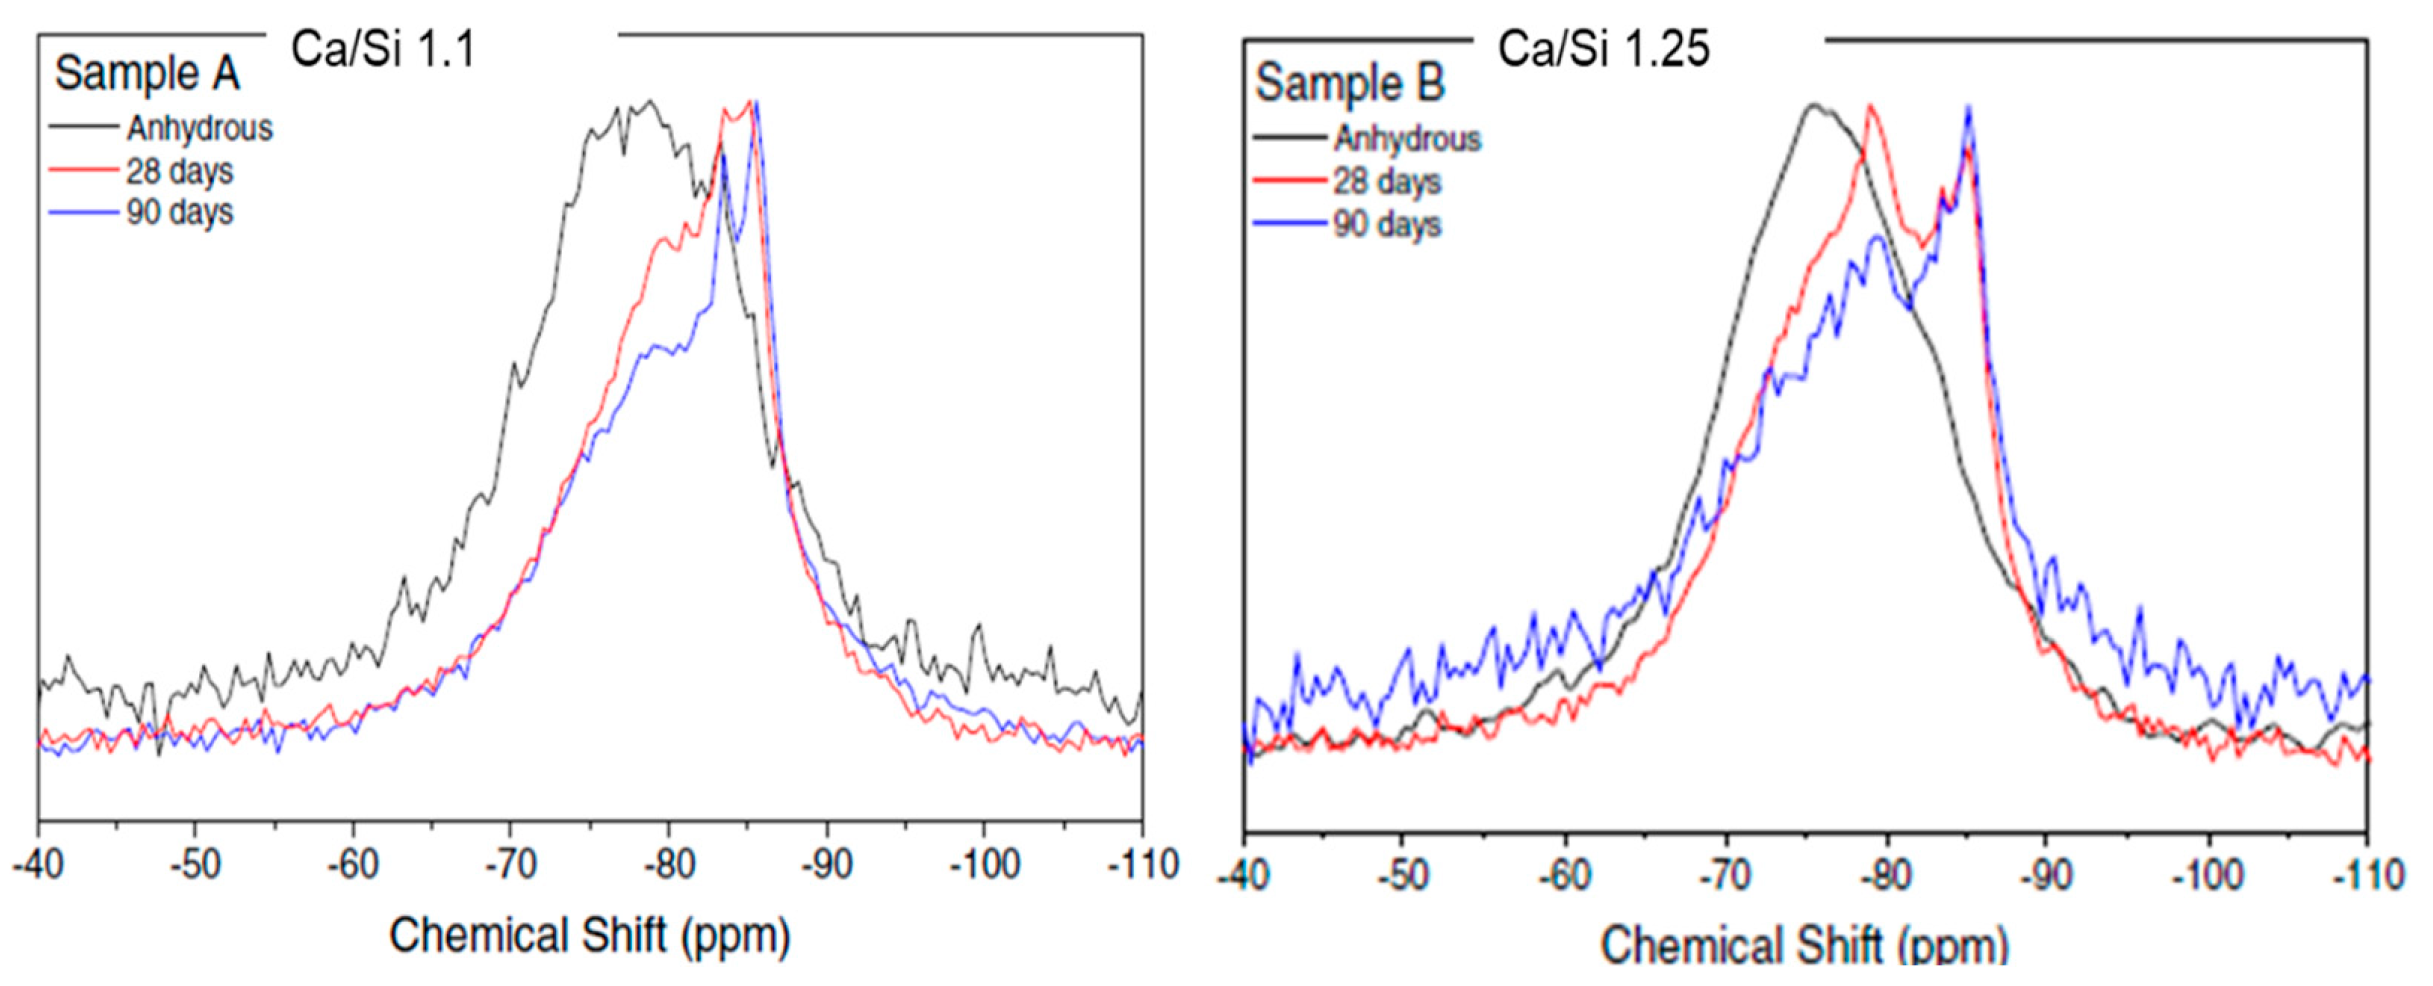
Santos et al. [17] performed FTIR and NMR analysis on anhydrous samples and compared them with 28 and 90-day water-hydrated pastes to assess the structural development upon hydration. Both binders were melted at 1550oC and had a Ca/Si ratio of either 1 or 1.25. Figure 3 and Figure 4, depict the FTIR and NMR spectra, respectively.
Upon hydration, the FTIR spectra of both samples (Ca/Si of 1.1 and 1.25) revealed the development of a narrow band centered at −445 cm−1, indicating the formation of a more organized structure and a similarity between the hydration products [17]. All hydrated samples exhibited features at ~670 cm-1 and ~960 cm−1. The first peak is characteristic of the Si–O–Si bending mode related to CSH gels with a low Ca/Si ratio [17], and the peak at 960 cm−1 to the stretching vibrations of the Q2 tetrahedra [40]. In the range of 1400 to 1500 cm−1 the presence of an asymmetric stretching of CO32- is shown [41]. Finally, at 1640 cm−1 and 2800 to 3600 cm−1 two broad features can be assigned to the H–O–H bending vibration of molecular water and the stretching vibrations of O–H [41].
The evolution of the normalized 29Si MAS NMR spectra reveals that, as the hydration progresses, the resonances move to more negative chemical shifts, indicating an increase in the degree of polymerization achieved by the rearrangement of the least coordinated Qn units (Q0 and Q1) [17]. Furthermore, the authors reported that well-defined peaks on the hydrated sample at −79 and −85 ppm indicate the formation of a CSH structure because these peaks are characteristic of the end-chain Q1 groups (−79 ppm) and middle-chain Q2 groups (−85 ppm) with non-bridging Si-O-Si linkages. The presence of the Q2 component increases with age, reaching ~ 75% after 90 days of hydration, while Q0 groups disappear after this time of hydration [17].
HR-TEM and XRD
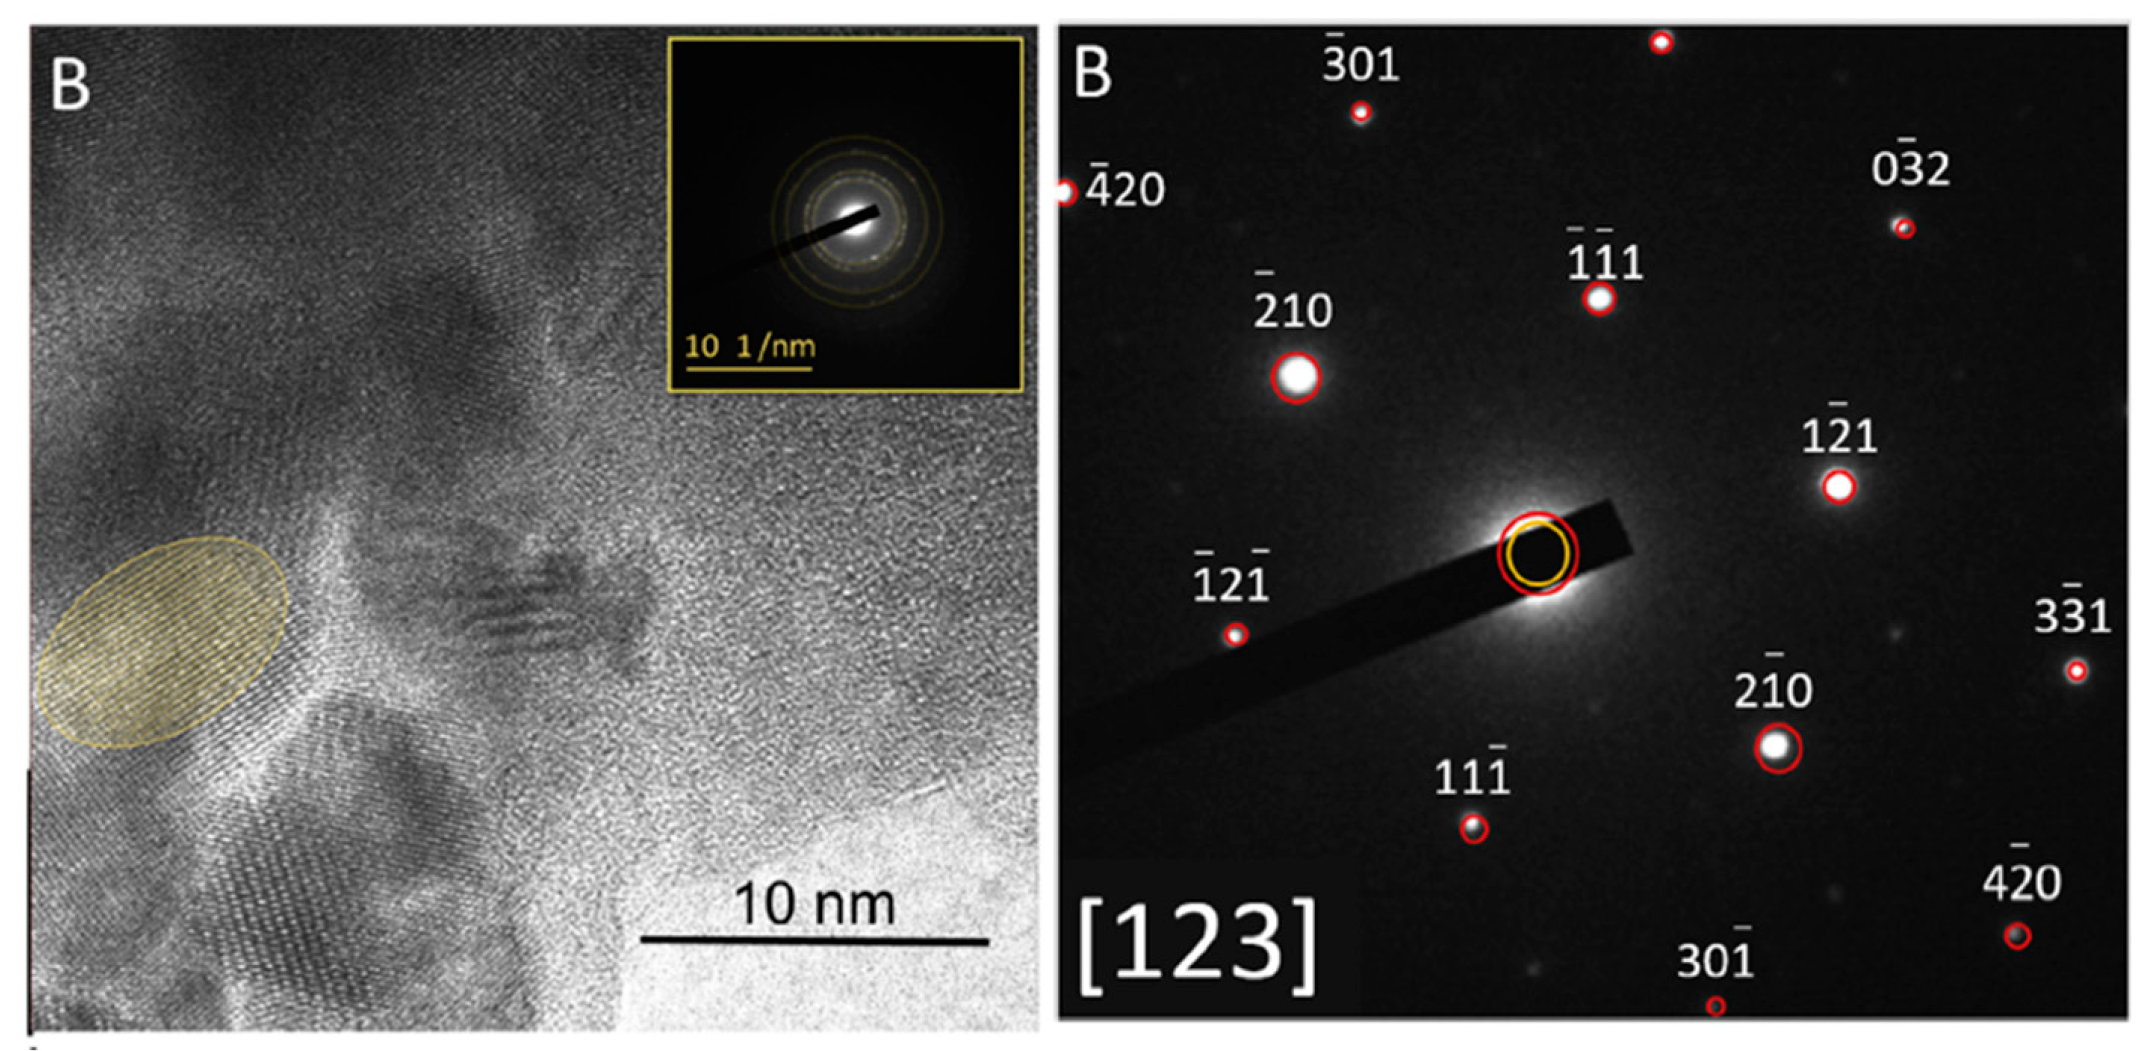
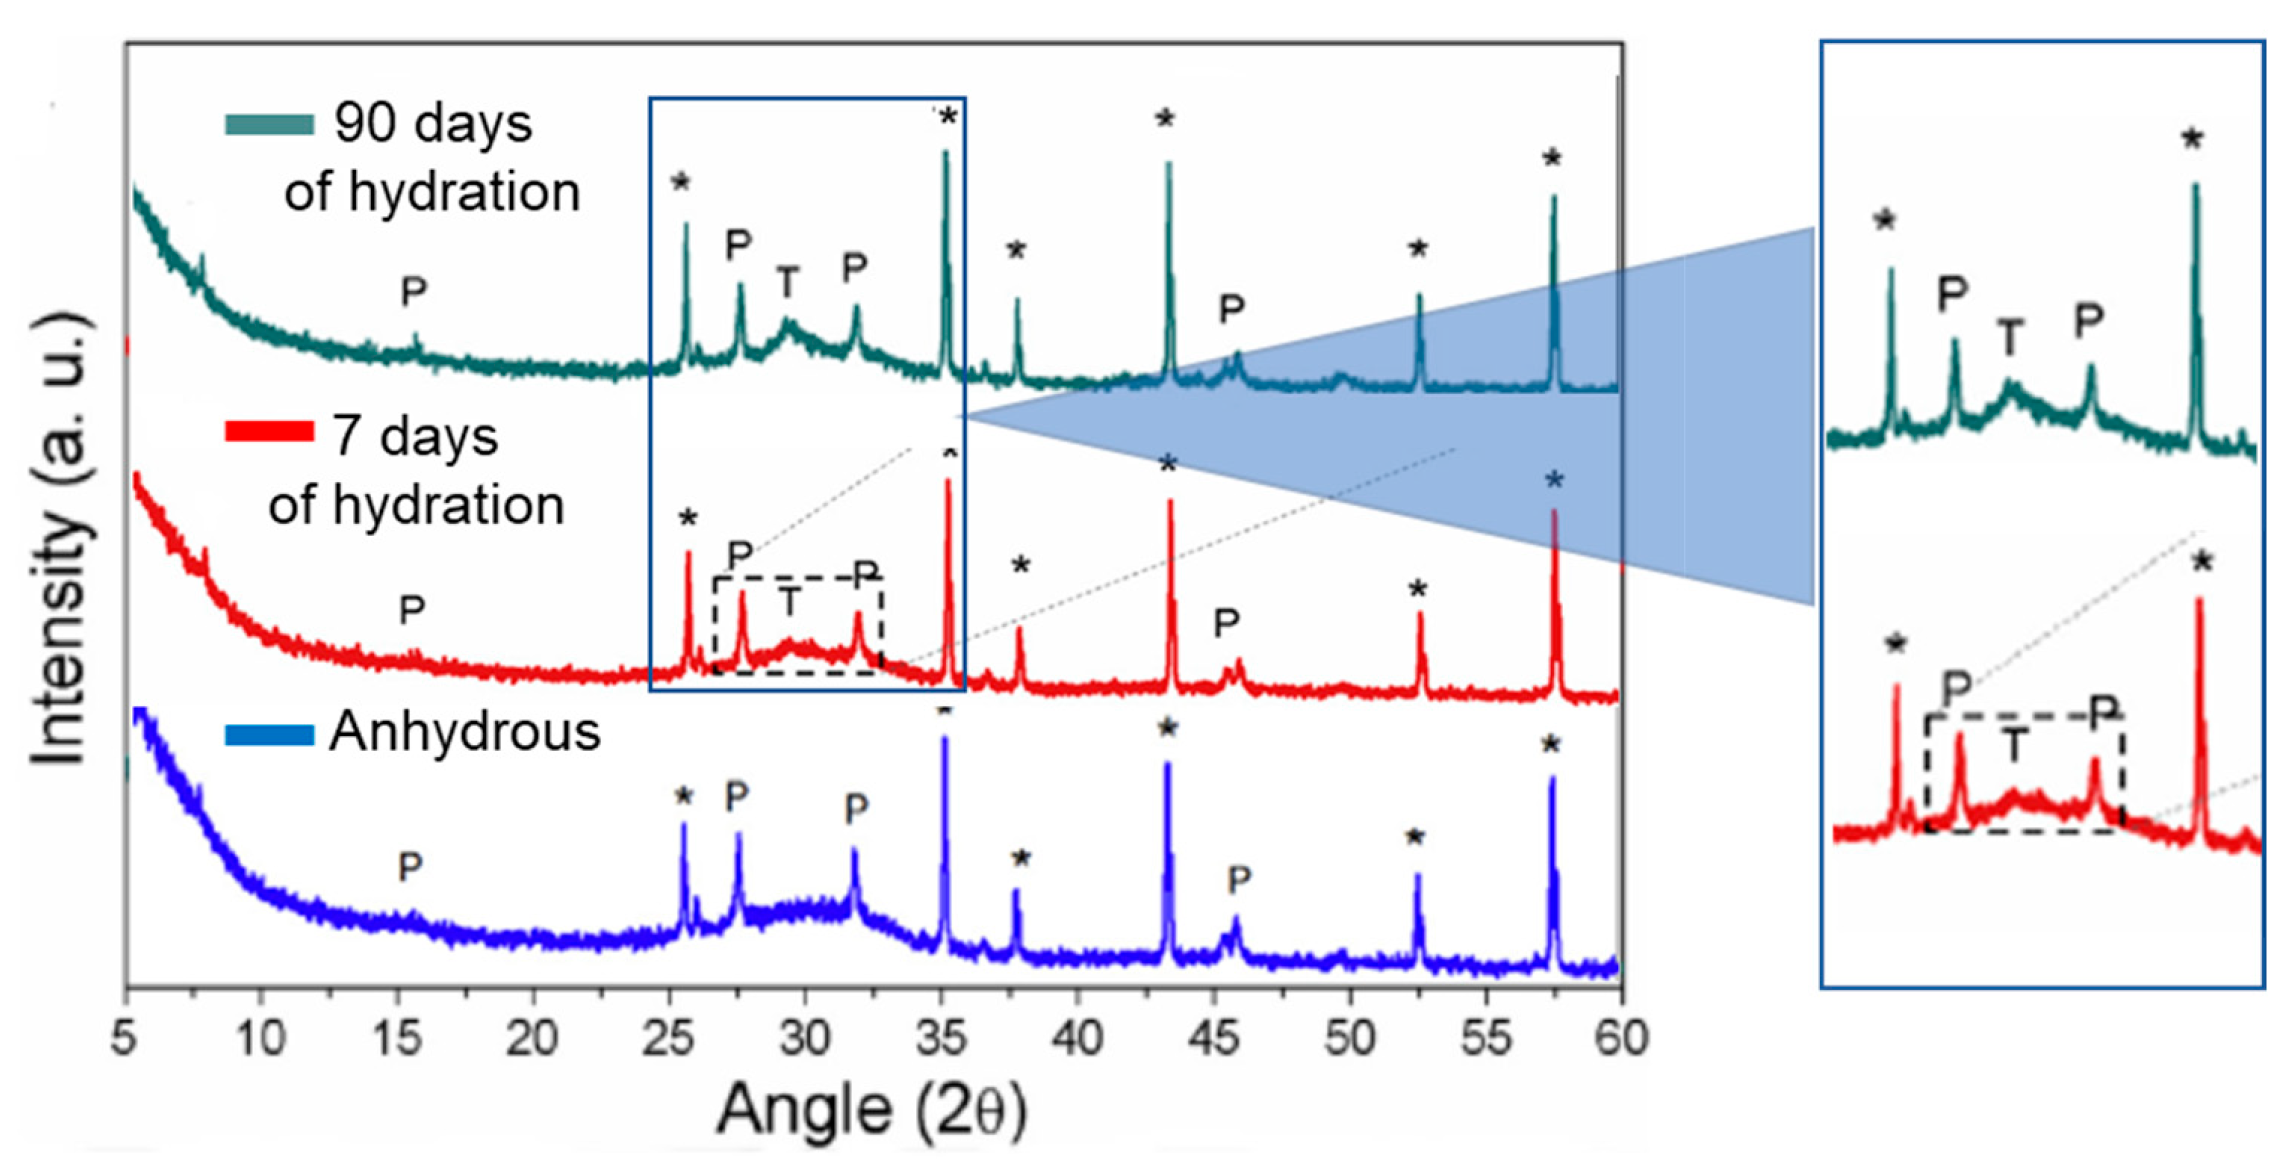
Paradiso et al. [42] performed selected area electron diffraction in HR-TEM observations of the hydrated product. It was observed that the CSH formed upon hydration present well ordered nanocrystals, with dimensions of the order of 10-20 nm whose diffraction pattern is compatible with 9Å tobermorite (Figure 5). The presence of CSH and tobermorite phase was also confirmed by Rietveld XRD analysis, which also showed that the proportion of 9Å tobermorite increases with hydration time (Figure 6).
Computational simulation studies have previously shown that a low C/S ratio promotes a CSH with a more well-ordered lamellar structure that enhances the mechanical stiffness and hardness of the material [43]. The HR-TEM and Rietveld observations of Paradiso et al. have shown that, within the binding phase of the CSH, densely packed tobermorite 9Å nanocrystals are formed in AWLCs. Tobermorite is a layered structure composed of stacking Ca-O layers supported by silica tetrahedra, arranged according to the Dreierketten rule [1]. Depending on the degree of hydration, tobermorite can be categorized into 3 types, with a basal spacing of 9 Å,11 Å, and 14 Å [43]. The presence of tobermorite has also been documented during the hydration process of OPC [44]. Previous studies proposed mechanistic pathways for its formation, including the formation of amorphous and semi-crystalline CSH, followed by a growth of semi-crystalline tobermorite and finally, the re-crystallization of solid tobermorite [45]. The growth of this structure is facilitated by a mixture of heterogeneous nucleation and internal restructuring [45]. The ultra-confined interlayer water within the tobermorite molecular structure influences the uniaxial tensile and compressive response of the structure [46,47]. In the case of the AWLCs the observed tobermorite 9Å, presents layers slightly inclined in the axial direction and the structure does not contain any water molecule within its interlayer spaces. Previous studies reported that the tilting of the tetrahedra in the silicate chains and the shortening of the axial Ca-O distances allow for better dissipation of energy under compression, thereby improving the mechanical resistance of the material [47].

3.3. Relation between the tobermorite and pseudowollastonite content and the mechanical performance

Different melting temperatures were used to produce AWLC clinkers with different pseudowollastonite proportions [14,27]. Pseudowollastonite is a wollastonite polymorphous consisting of isolated trisilicate ring structures, in which the calcium cation is ionically linked to oxygen atoms [48]. Wollastonite, characterized by a chain-structured, undergoes a reaction to form pseudowollastonite at 1125ºC and congruently melts at 1544ºC [48]. The use of the pseudowollastonite phase was already studied on low calcium binders, due to its carbonation capabilities yielding CaCO3 and SiO2 as reaction products [49,50,51,52]. Plattenberger et al [53] even proposed that the exposure of this phase to aqueous CO2 results in the formation of both CaCO3 and calcium silicate phases, which show to be the more stable phase under low pH conditions.
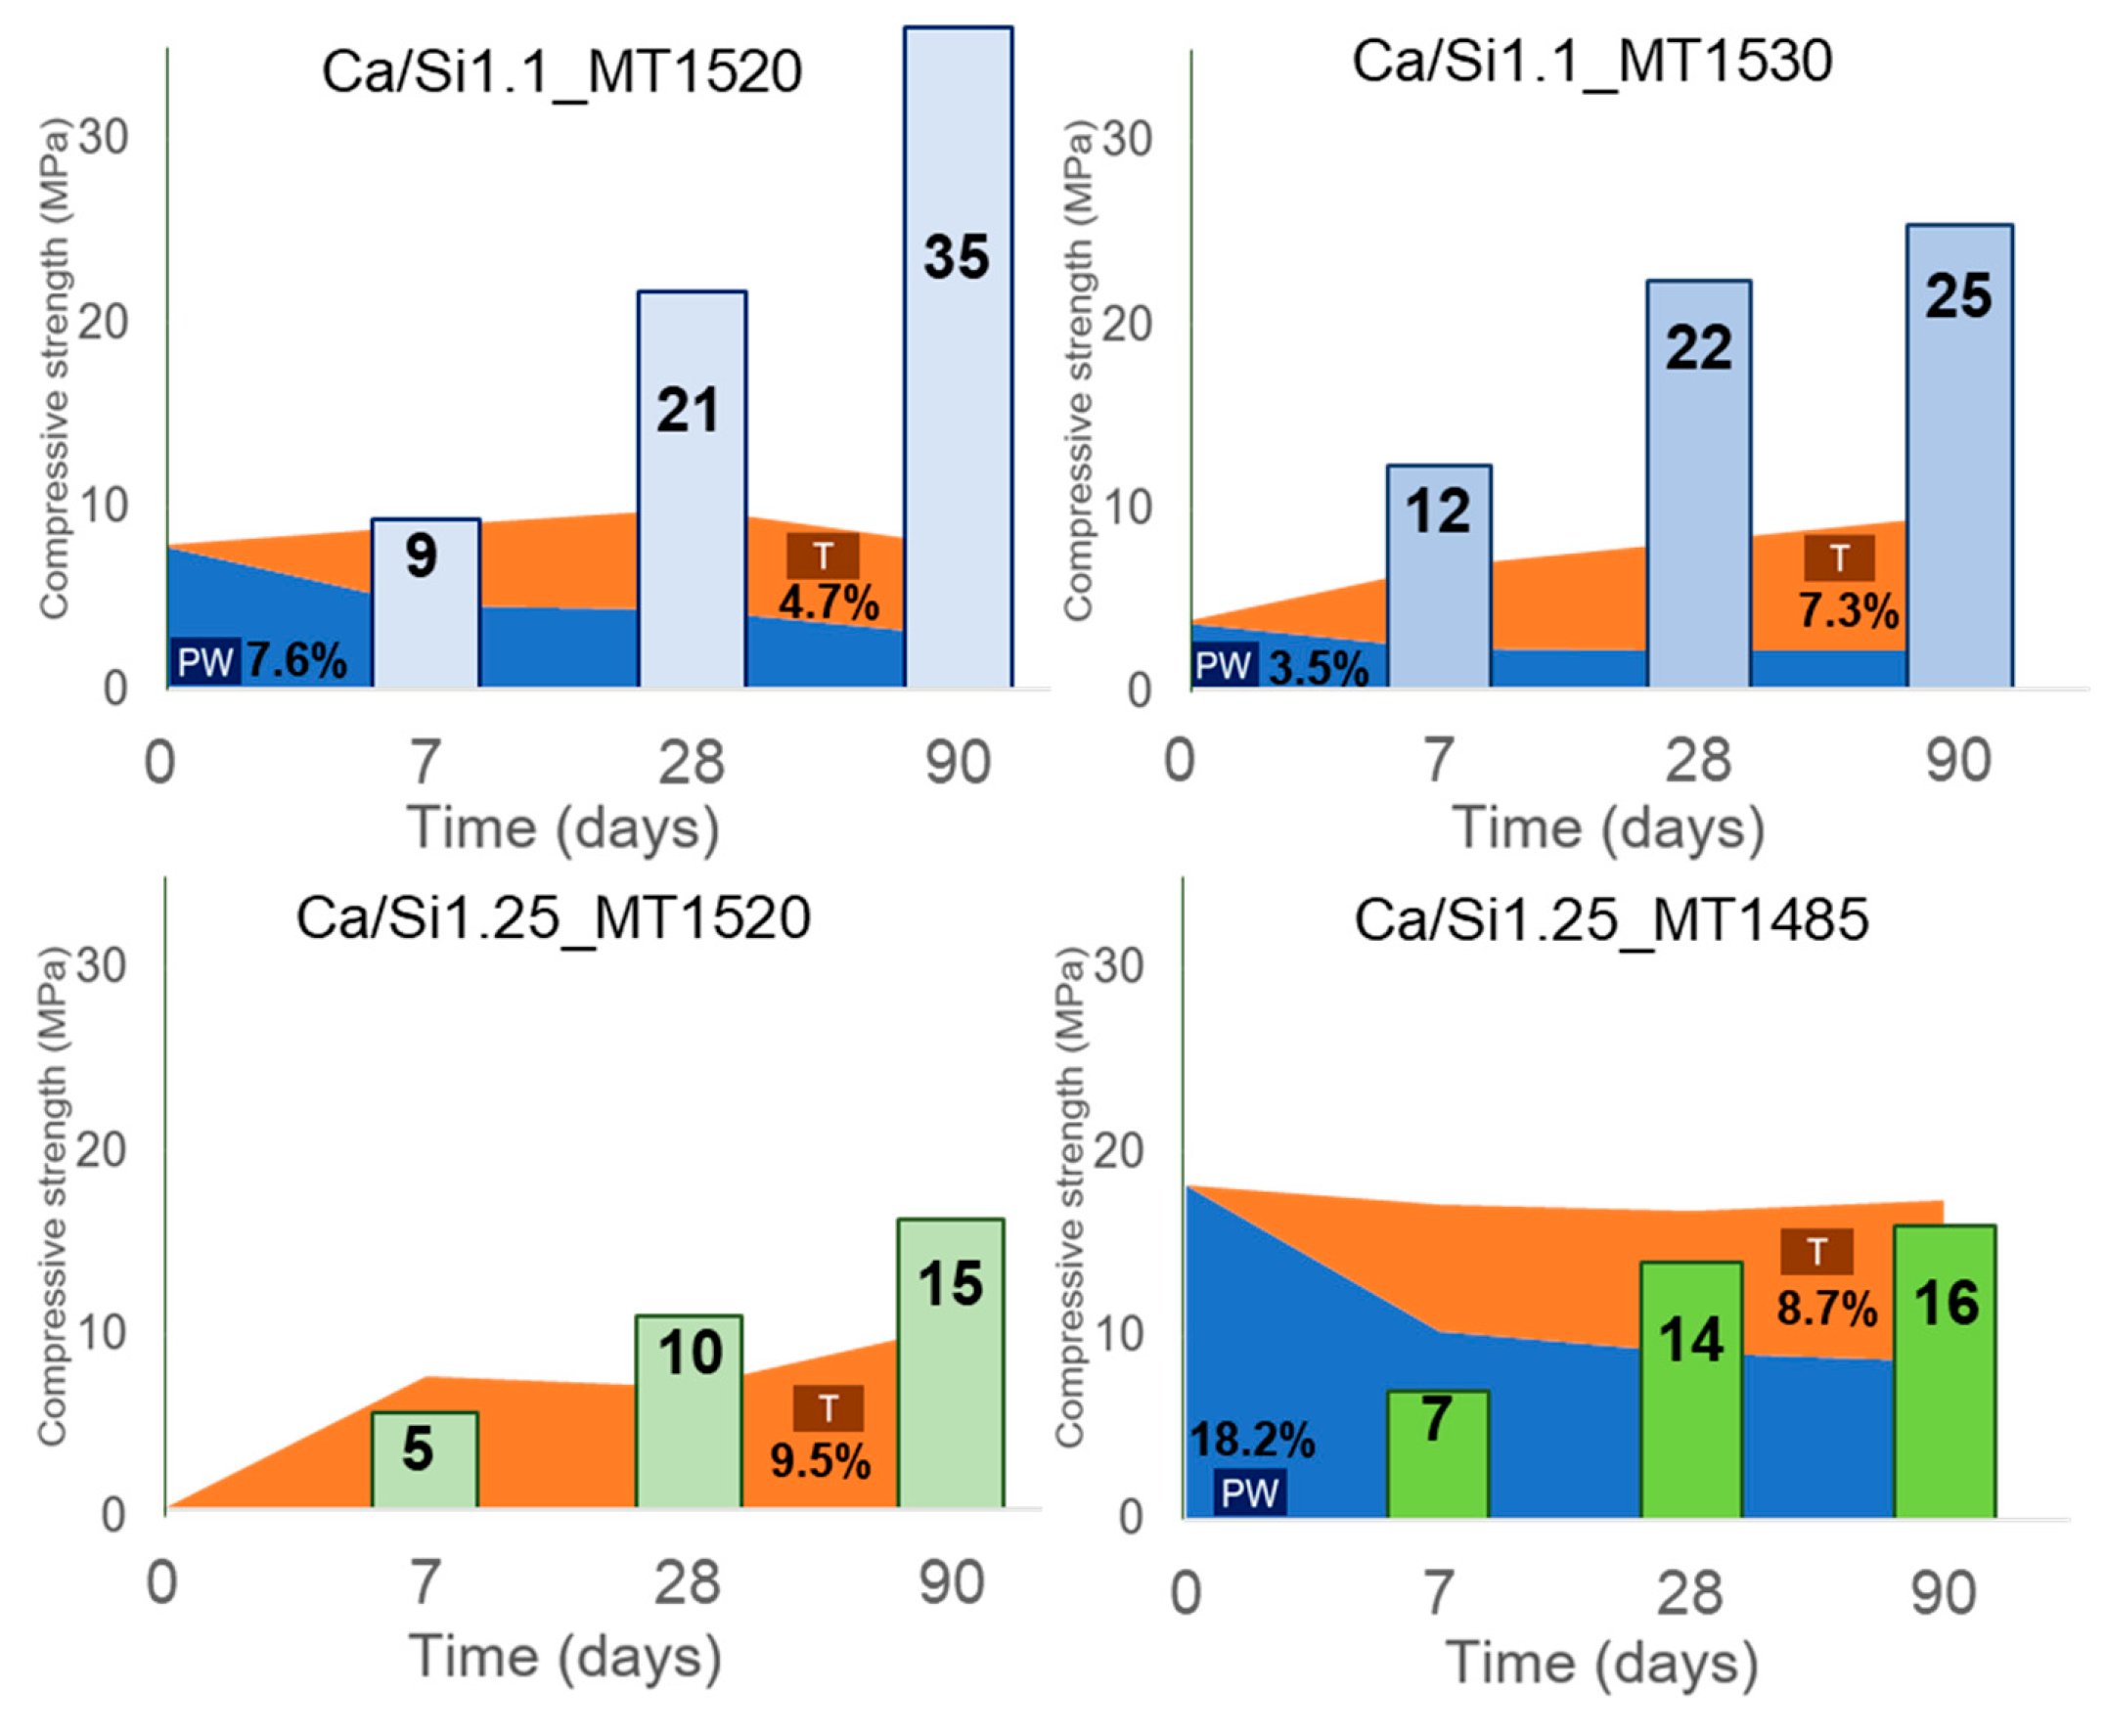
The samples tested by [14,27] were hydrated with water using a w/b ratio of 0.375 and submitted to microstructural and mechanical characterization [14]. Figure 7 resumes the obtained results. The results indicate that at early ages the compressive strength is more or less independent of the initial content of pseudowollastonite. However, at later ages (28 and 90 days), the samples with an initial psewdowollastonite content between 3.5% and 7.6% show better mechanical performance. In particular, samples with 7.6% of pseudowollastonite show a significant evolution of the compressive strength, increasing from 8.5 MPa, at 7 days, to 34.5 MPa, at 90 days. It was also observed a decrease in initial pseudowollastonite content and an increase in the tobermorite content up to 90 days of curing time.
Therefore, this set of experiences shows that a higher pseudowollastonite content corresponds to a lower melting temperature, due to the equilibrium obtained in the liquid phase with the pseudowollastonite+ liquid region of the CaO-SiO2 phase diagram, and the presence of small amounts of pseudowollastonite (up to 7.6%) in the AWLC may be beneficial in terms of mechanical performance. During hydration the proportion of pseudowollastonite decreases which may be a consequence of its carbonation process, which at later ages could improve the compressive strength of the sample. Finally, the presence of crystalline tobermorite during hydration was found, increasing its proportion, at least, until 90 days of hydration.

3.4. Influence of water/binder ratio, granulometry, and Ca/Si ratio on the mechanical performance

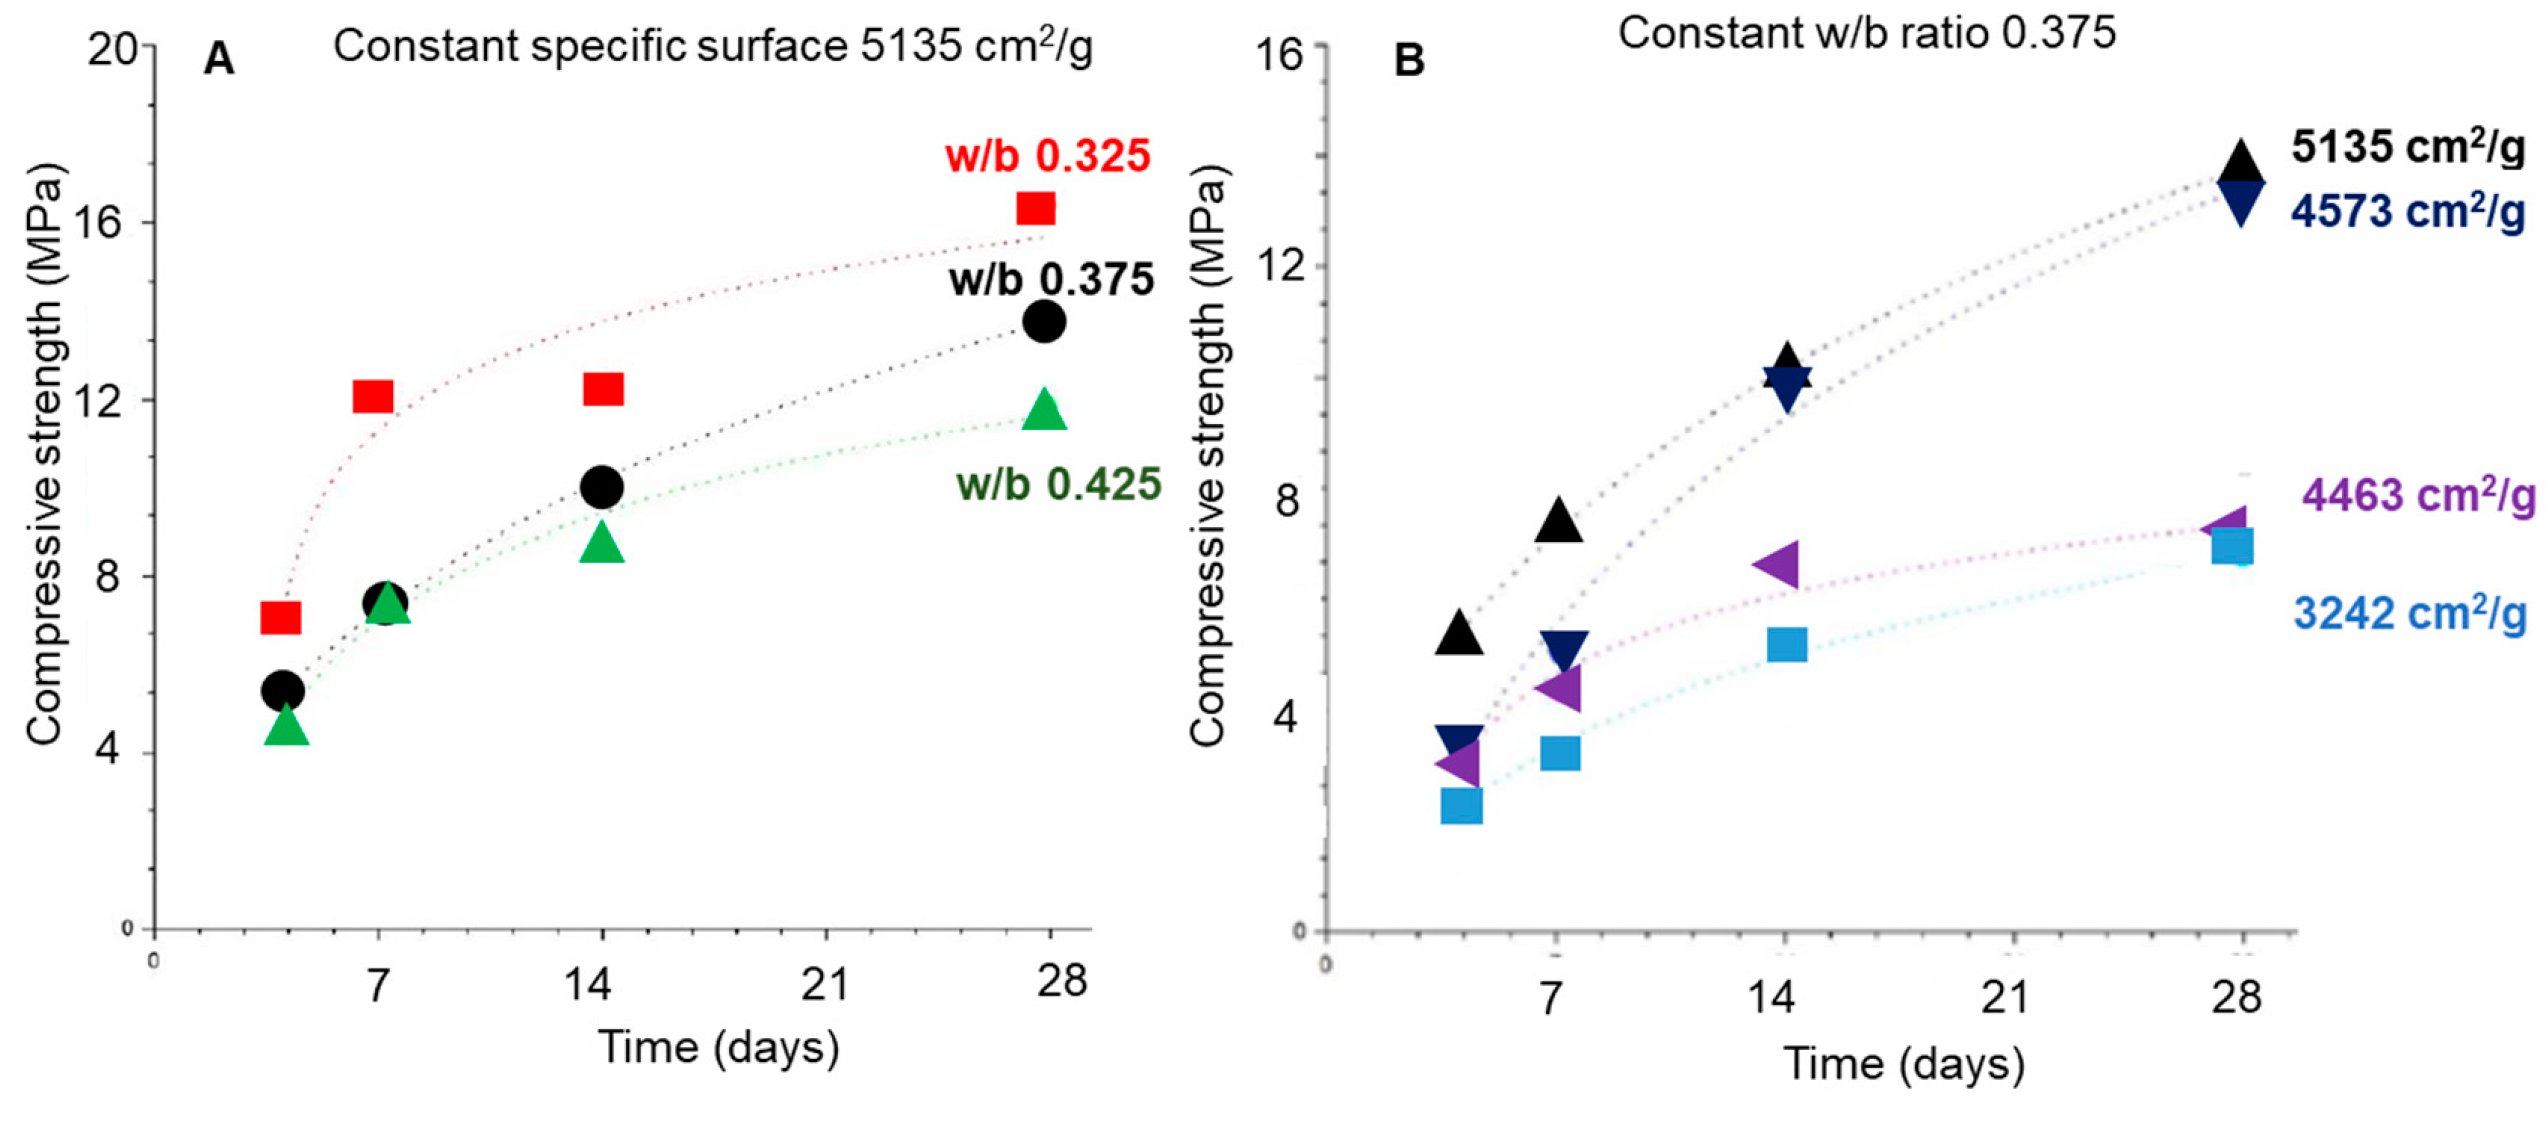
The influence of the water/binder (w/b) ratio and the granulometry on the mechanical behavior are shown in Figure 8 [26]. It can be observed that both the w/b ratio and the particle fineness affect the strength of AWLC pastes, and the increase of the w/b ratio from 0.325 to 0.425 results in a significant decrease in the compressive strength of the material (Figure 8. A). Furthermore, the reduction of the particle fineness from 3242 to 5135 cm2/g results in a significant increase in the compressive strength. Nevertheless, Mendes et al. [30] reported that the effect of particle fineness begins to fade at later ages (90 days) for binders with higher amorphous contents.
The compressive strength of the paste is influenced by both the specific surface area and the w/b ratio w/b ratio. These two conditions impact the exposed area of the particle and the distance between the binder particle, influencing the reactivity of the sample. When the specific surface area is high, indicating a larger exposed area and the w/b ratio is low, indicating a shorter distance between particles [54,55], the conditions favor a higher reactivity in the sample. This increased reactivity promotes the production of more hydration products, specifically calcium silicate hydrate (CSH), resulting in higher compressive strength.
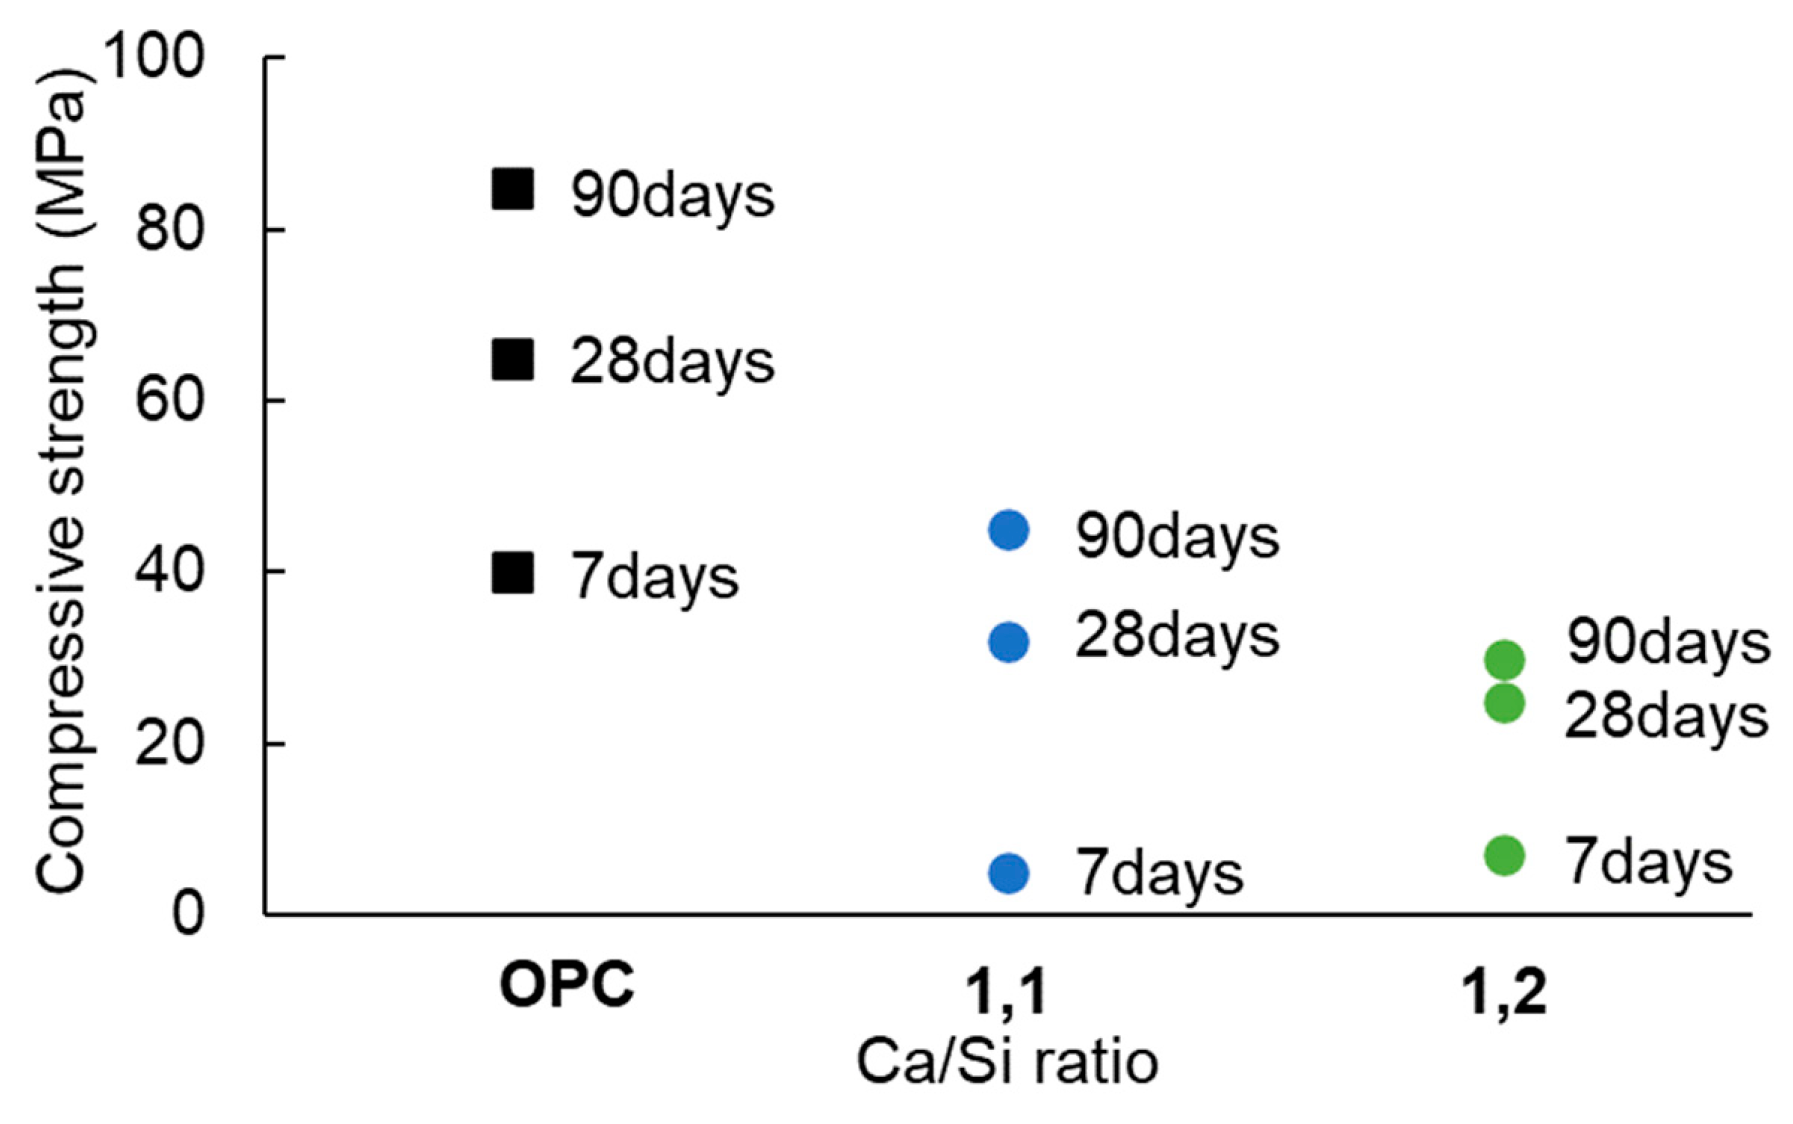
The influence of the Ca/Si ratio on the compressive strength of AWLC pastes was analyzed in [17]. The results are shown in Figure 9 using OPC pastes as reference material. It was observed that the samples with a Ca/Si ratio of 1.1 had better mechanical performances than the Ca/Si 1.25 pastes.

4. Alkaline activation of the binder

The use of alkaline activation to improve the compressive strength and performance of AWLC with a Ca/Si ratio of ~1.1 was studied by Santos et al. [15] and Mendes et al. [30]. The alkaline activators studied were Na2CO3, Na2SO4, CaSO4, and a mixture of Na2SiO3 and NaOH. The main observation of these works was that the AWLC activated with Na2SiO3 solution presented, by far, better performances. When Na2SiO3 solution is used as an activator, the mechanical strength of AWLC can overcome that of OPC. In this way, in this review, we will refer only to activation with Na2SiO3.
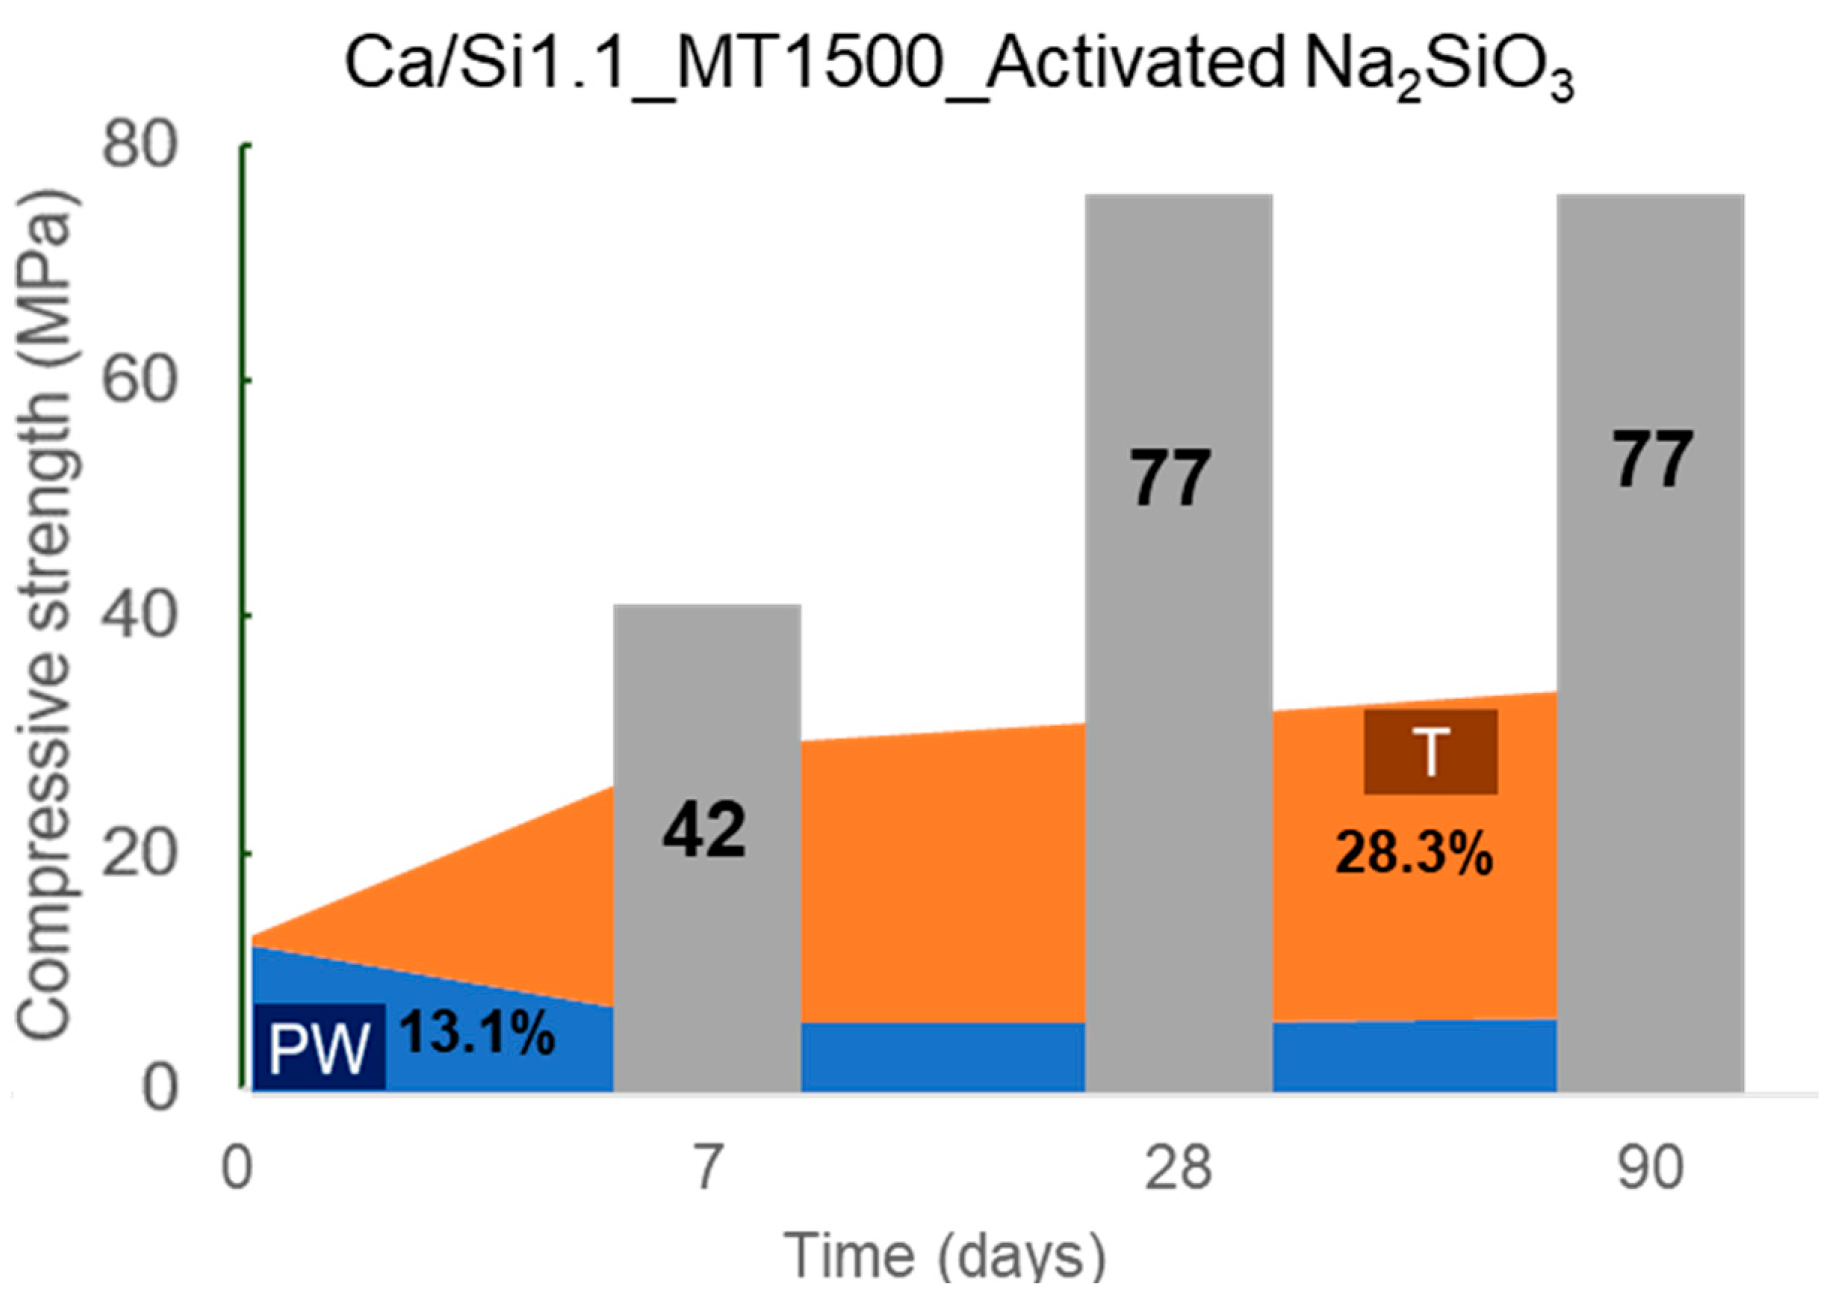
Santos et al. [15], tested the compressive strength after 7. 28, and 90 days of hydration of pastes with a w/b of 0.375 activated with Na2SiO3. The compressive strength together with the evolution of the respective pseudowollastonite and tobermorite contents are shown in Figure 10. Comparing these results with those of Figure 7 for water hydrated pastes, it is observed that activation of the AWLC with Na2SiO3. May lead to an invrease of the compressive strength of up to 300%. Furthermore, the results indicate that the formation of tobermorite is related to the development of mechanical properties of the pastes [14].
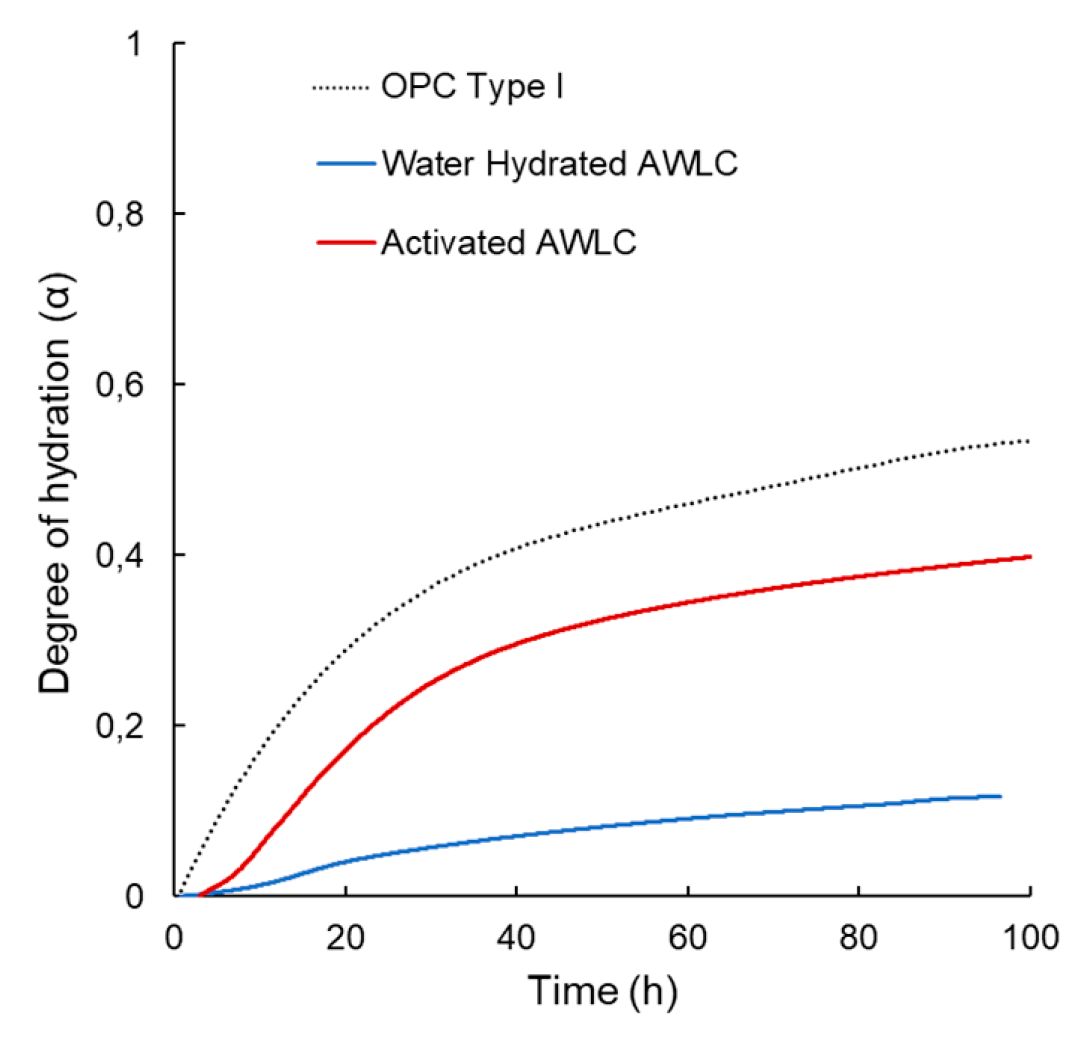
Since the degree of hydration (α) quantifies the extent of hydration of a binder over time, the experimental data from [16] was used to calculate the degree of hydration between water-hydrated AWLC and Na2SiO3 activated AWLC. We have used the methodology proposed by Poole et al. [56], that calculated this parameter by the ratio of heat at each hydration time, H(t) with total amount of heat available Hmax, α=H(t)/Hmax. The results were compared with a typical Type I OPC in Figure 11. The results in Figure 11 indicate that when the AWLC binder is hydrated with water, the degree hydration remains below 0.1 for the first 100 hours. However, by activating the material with Na2SiO3., a considerable increase in the degree of hydration is observed, indicating an increase in the hydration kinetics allowing the formation of CSH/tobermorite structures particularly at earlier ages, as observed by HR-TEM, XRD-Rietveld (Figure 5 and Figure 6).
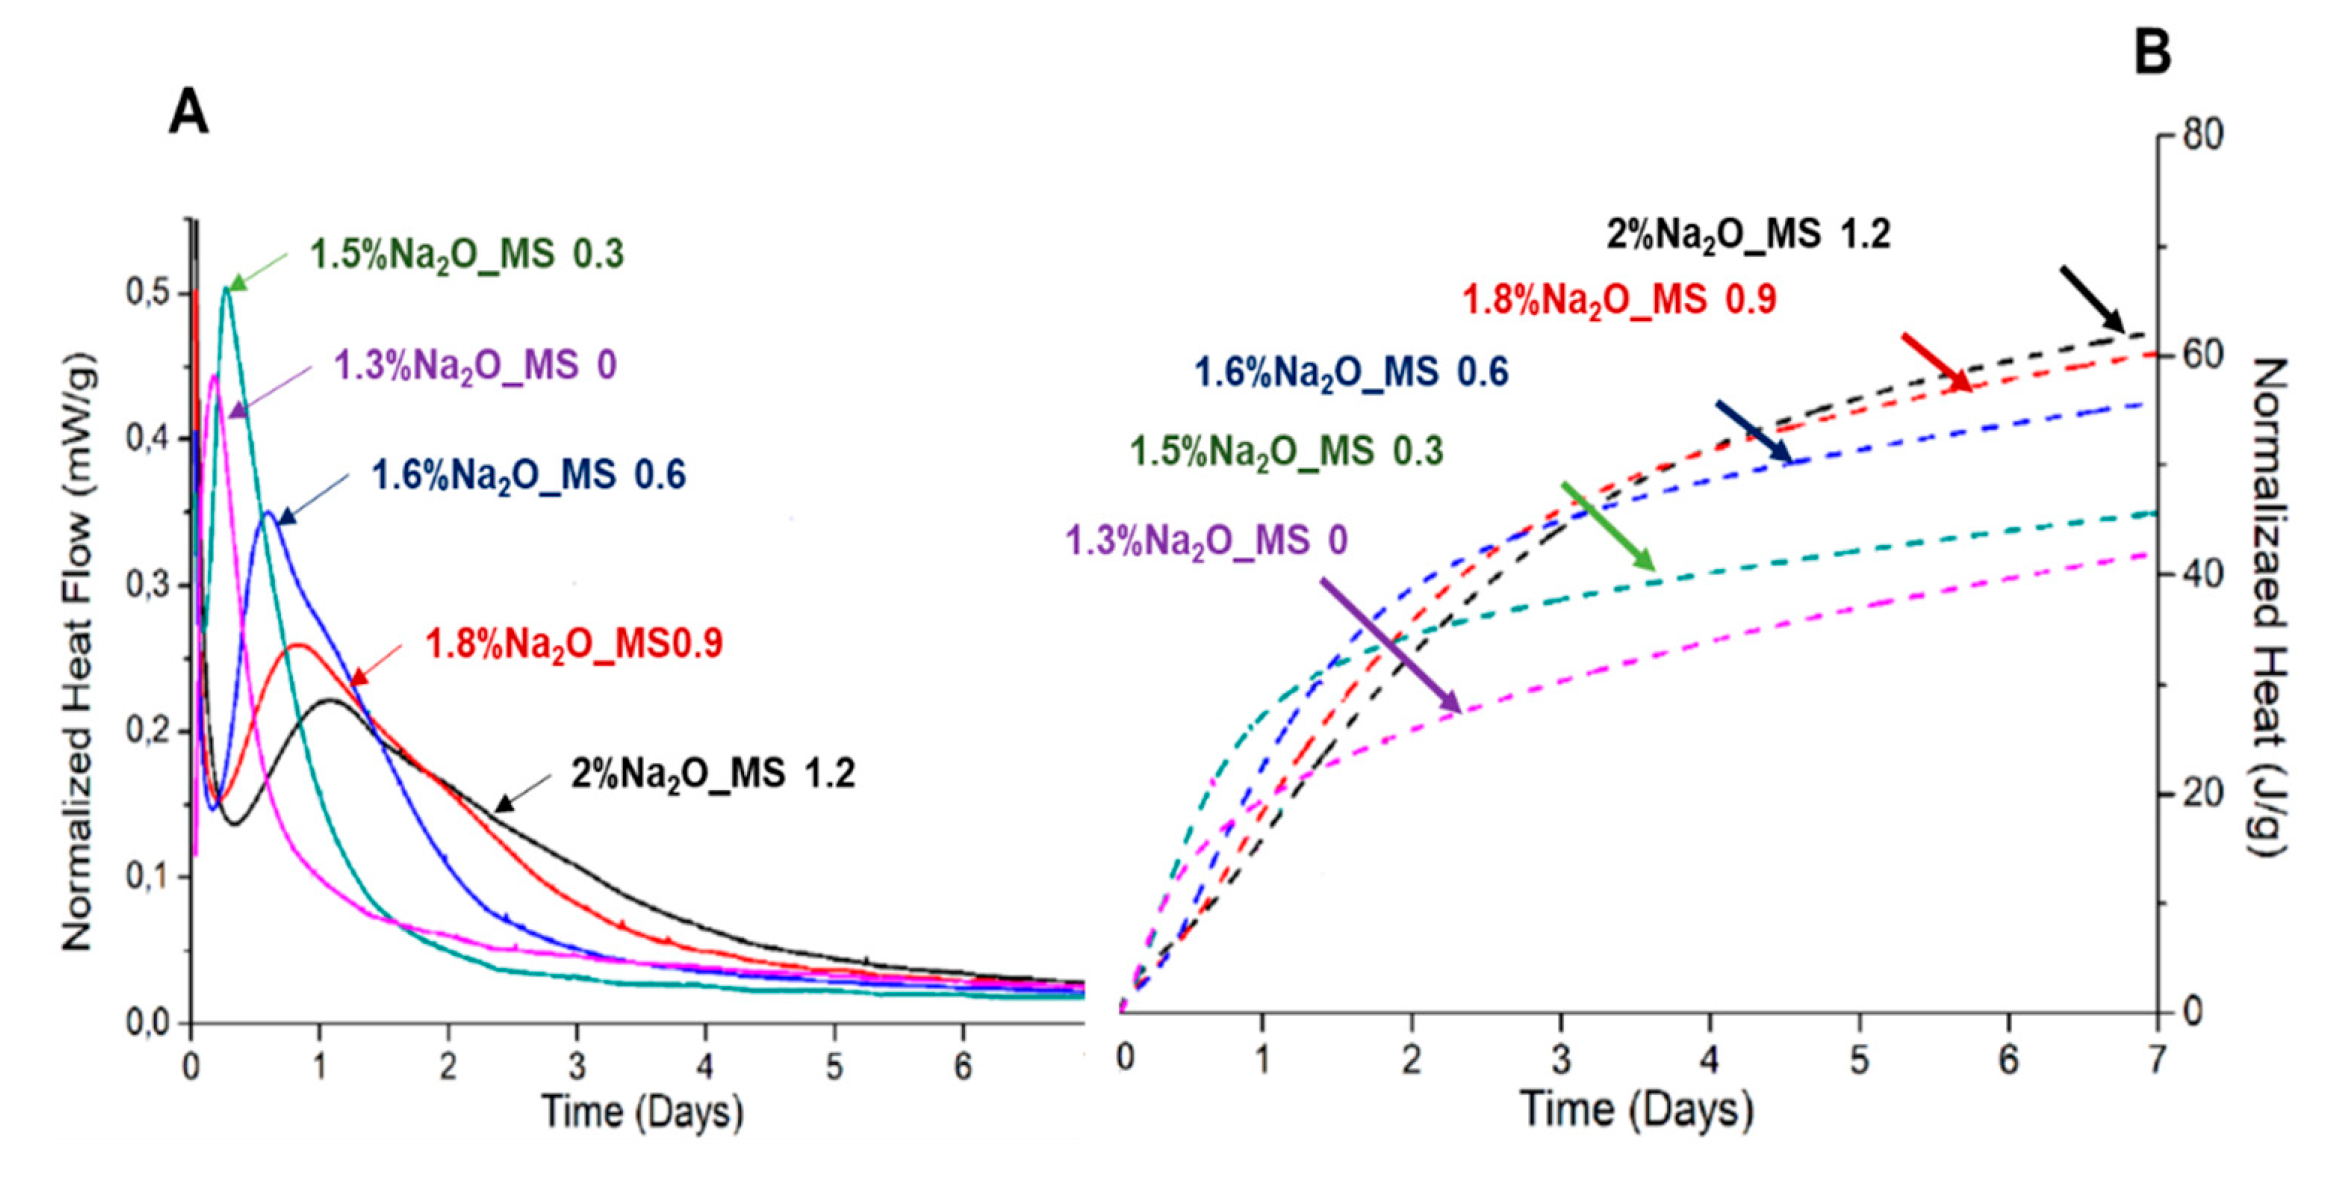
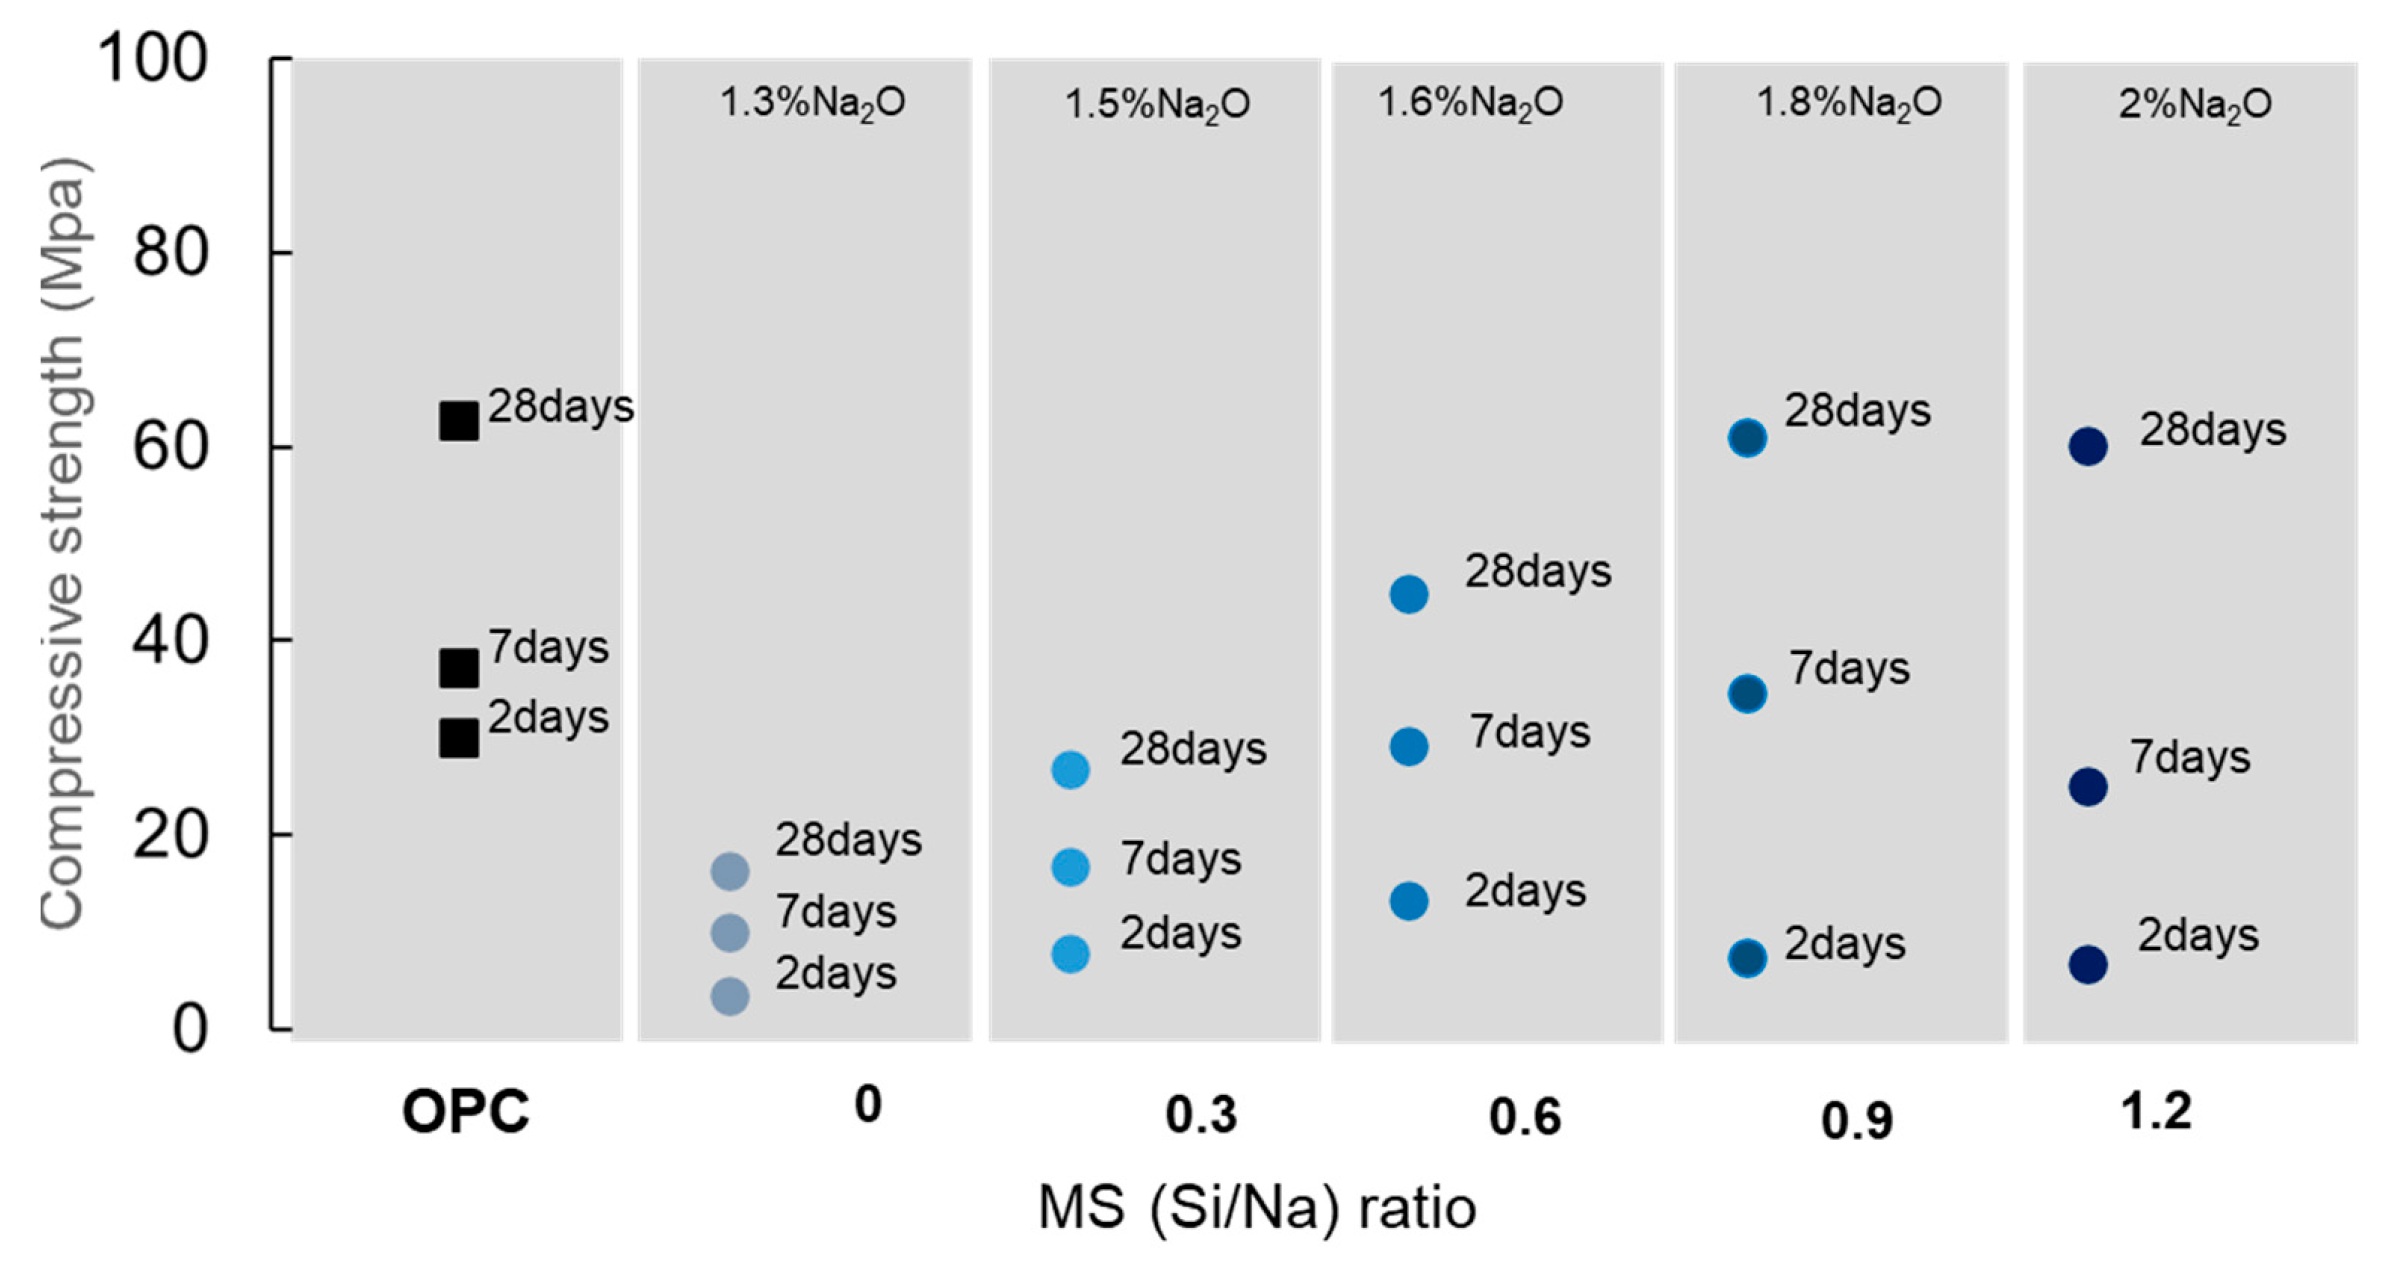
To reduce the amount of Na2SiO3 and optimize the Na2O content in the hydrating solution, Mendes et al. [30] used a Na2O and Si/Na modulus of 1.2, followed by a successive reduction of 25%wt of Na2SiO3 until a combination of just NaOH and water was reached (0%. of Na2SiO3). The activation properties of each mixture were studied by calorimetry and compressive strength tests on pastes with a w/b ratio of 0.25. The calorimetric results and the compressive strength of each studied condition are shown in Figure 12 and Figure 13, respectively. The isothermal calorimetry analysis obtained by the authors showed a delay in the maximum hydration peak with the rise of Na2SiO3 on the activator. However, the increase of Na2SiO3 content also promoted a more controlled kinetic after the peak, consequently, these samples released more heat after 7 days of hydration. As a result, after 7 days of hydration, the amount of heat released increases with the increase of Na2SiO3 concentration. Compressive strength results on pastes activated with the studied solutions showed that the samples with a higher heat released originated higher compressive strength results at later ages.

5. Correlation between bonded water and compressive strength

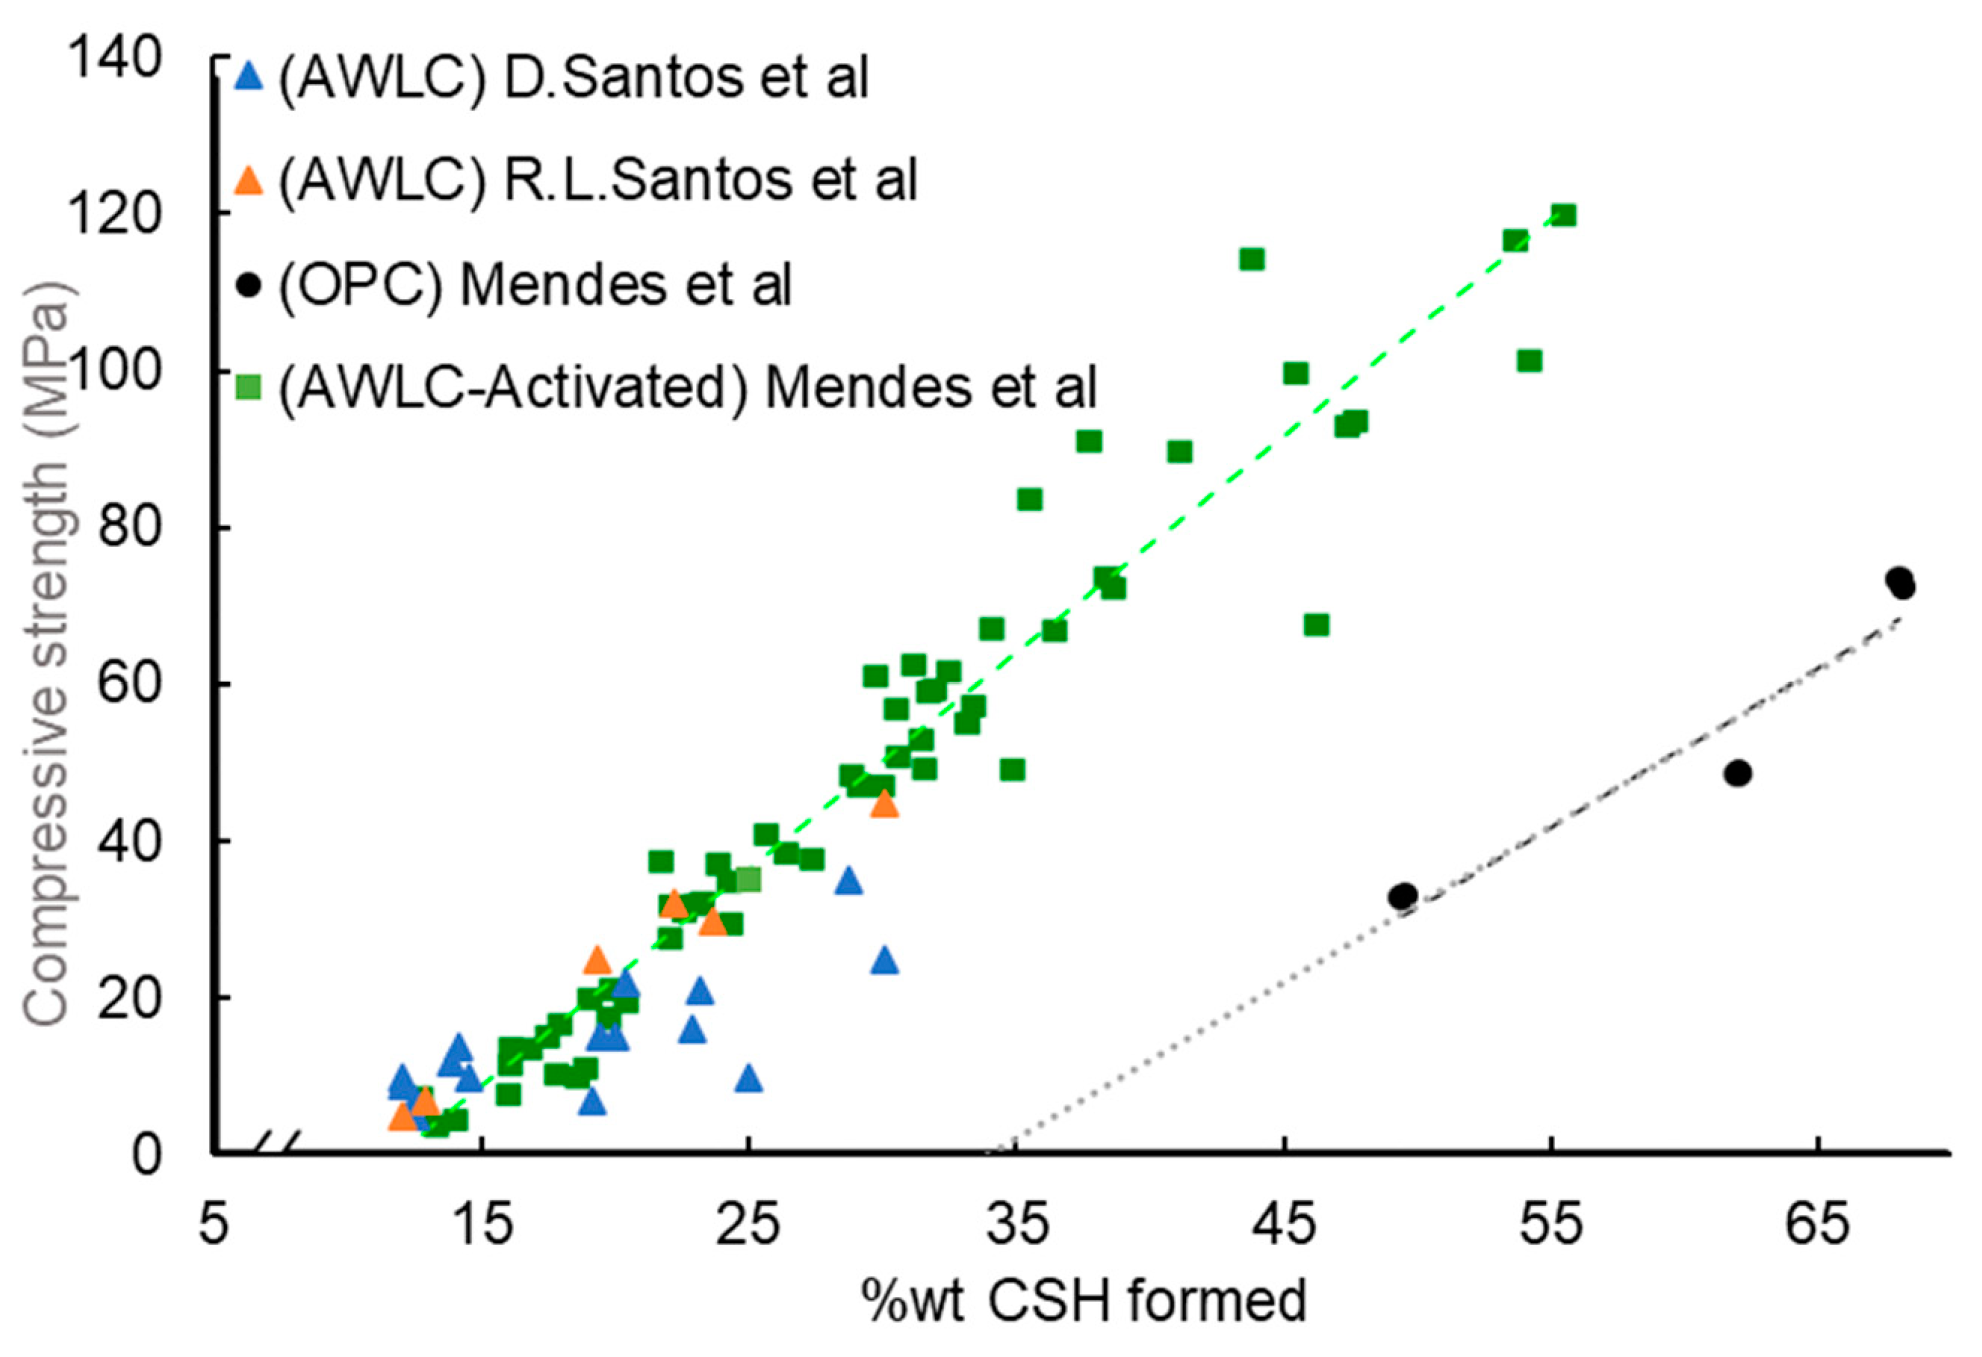
Thermogravimetric analysis was used to calculate the amount of bonded water (BW) on the hydrated phases by measuring the weight loss of each sample at the temperature range of 110ºC to 500ºC [14,17,30]. Considering that the strength development of the samples is directly related to their hydration process, it is possible to correlate the compressive strength with the chemical BW content. Furthermore, assuming the model of Richardson and Qomi [57], a relation between the bonded water and the amount of CSH can be established:
H 2 O S i = 19 C a S i 7 17
Using these data, it is possible to compare the percentage of CSH on the sample with its compressive strength, as shown in Figure 14. It can be observed that AWLCs requires a lower amount of CSH to obtain compressive strength values similar to OPC. This may be due to the presence of hydration products with a low Ca/Si ratio, which allows the formation of a CSH structure with better mechanical properties [42,43]. Moreover, the linear correlation between CSH formed and the respective compressive strength on all experimental pastes, hydrated with water or with an alkaline solution, suggests that the resulting hydration product is similar in all cases.

6. Conclusions

The development, optimization, and use of low-calcium amorphous hydraulic binders with Ca/Si≈1 as an alternative to Portland cement-based materials, aiming to reduce the carbon footprint associated with its production, have made relevant progresses since 2015. Summing up the main achievements are as follows:
a)
To obtain a binder with good mechanical performance, the raw materials should be heated to at least 1500ºC and the quenching should be done preferentially in water.
b)
With the rise in calcium content in the raw material, with C/S between 0.8 and 1.25 an increase in Q0 structures was observed, reaching a maximum value at a Ca/Si ratio of 1.1. Moreover, pastes prepared with this ratio showed an increase in compressive strength
c)
The tests performed on the hydrated product revealed that the only products formed during the hydration of this AWLC were an amorphous CSH with a Ca/Si ratio of 1.1 and an MCL of 5, and a crystalline tobermorite 9Å phase. Furthermore, no portlandite was identified.
d)
With the increase in hydration time, a reduction in pseudowollastonite and an increase in tobermorite were observed. On water-hydrated pastes, the optimum content of pseudowollastonite on the anhydrous binder was ~7.6%.
e)
The degree of hydration rate of the AWLCs binder was established and compared with type I OPC, the results showed that even though the hydration rate of the binder is lower than that of OPC, by activating the material a significant enhancement in the in the degree of hydration was observed, suggesting a potential improved in its performance.
f)
Competitive strength on pastes was only obtained when the binder was hydrated with a Na2SiO3 solution with at least 1.8 Na2O%wt content. When activated, the pseudowollastonite content does not seem to be as relevant to the performance of the binder. An important parameter observed was that the AWLC binder exhibited a much lower heat release than traditional type I OPCs, even when activated.
g)
Finally, a correlation between bonded water and the formation of CSH chains with compressive strength was established by different authors.
Table 2 summarizes the main characteristics of the AWLC binders as compared with with OPC.

Author Contributions

Conceptualization, R.C., R.B.H. and R.L.S.; methodology, R.C., M..A, R.L.S.; validation, R.C., R.B.H.; formal analysis, R.C., R.B.H., RLS.; investigation, M.A. and R.L.S.; data curation, M.A.; writing—original draft preparation, M.A. and R.L.S.; writing—review and editing, R.C., RBH.; visualization, R.C., R.L.S. and M.A.; supervision, R.C., R.B.H. and R.L.S.; project administration, R.C; funding acquisition, R.C. All authors have read and agreed to the published version of the manuscript.

Funding

This work was supported by Fundação para a Ciência e Tecnologia (FCT), under LAETA, project UIDB/50022/2020 and by CIMPOR SGPS under contract CIMPOR/ADIST 006/2016. M. Antunes also thank FCT for the PhD scholarship ref. 2022.10652.BDANA.

Conflicts of Interest

The authors declare no conflict of interest.

References

  1. Hewlett, P.C. Lea’s Chemistry of Cement and Concrete; 4th edition.; Butterworth Heinemann: Oxford, UK, 2003; ISBN 9780750662567. [Google Scholar]
  2. Balonis, M.; Glasser, F.P. The Density of Cement Phases. Cem Concr Res 2009, 39, 733–739. [Google Scholar] [CrossRef]
  3. Jankovic, A.; Valery, W.; Davis, E. Cement Grinding Optimisation. Miner Eng 2004, 17, 1075–1081. [Google Scholar] [CrossRef]
  4. American Society for Testing and Materials. ASTM C465 – Standard Specification for Processing Additions for Use in the Manufacture of Hydraulic Cements; 2014. [Google Scholar]
  5. American Association of State Highway and Transportation Officials AASHTO Designation: M 85-19 Standard Specification for Portland Cement, Technical Subcommitee: 3a, Hydraulic Cement and Lime; Washington, D. C. 2001, 2019.
  6. Nontananandh, S.; Yoobanpot, N.; Chaysuwan, D.; Thongdaeng, K. Influence of Fineness of Cement Produced from Industrial Wastes on Strength of Mortar. Nat. Sci. 2011, 45, 762–772. [Google Scholar]
  7. Lehne, J.; Preston, F. Making Concrete Change Innovation in Low-Carbon Cement and Concrete; 1st edition.; The Royal Institute of International Affair: London, UK, 2018. [Google Scholar]
  8. Energy Agency International. Achieving Net Zero Heavy Industry Sectors in G7 Members; 2022. [Google Scholar]
  9. International Energy Agency. Technology Roadmap - Low-Carbon Transition in the Cement Industry; Technical Report International Energy Agency: Paris, France, 2018. [Google Scholar]
  10. Antunes, M.; Santos, R.L.; Pereira, J.; Rocha, P.; Horta, R.B.; Colaço, R. Alternative Clinker Technologies for Reducing Carbon Emissions in Cement Industry: A Critical Review. Materials 2022, 15. [Google Scholar] [CrossRef]
  11. Andrew, R.M. Global CO2 Emissions from Cement Production,1928–2018. Earth Syst Sci Data 2019, 11, 1675–1710. [Google Scholar] [CrossRef]
  12. Horta, R.S.B.; Colaço, R.A.C.; Lopes, J.N.A.; Santos, R.L.; Pereira, João Chaves Rocha, P.J.P.; Lebreiro, S.M.M. Amorphous Low-Calcium Content Silicate Hydraulic Binders and Methods for Their Manufacturing. US Patent US10414690B2, 2016.
  13. Santos, R.L. New Hydraulic Binders with Low Calcium Content. PhD Thesis, Lisbon, Portugal; PhD Thesis, Universidade de Lisboa, 2016. [Google Scholar]
  14. Santos, D.; Santos, R.L.; Pereira, J.; Horta, R.B.; Colaço, R.; Paradiso, P. Influence of Pseudowollastonite on the Performance of Low Calcium Amorphous Hydraulic Binders. Materials 2019, 12, 1–13. [Google Scholar] [CrossRef]
  15. Santos, R.L.; Horta, R.B.; Al, E. Alkali Activation of a Novel Calcium-Silicate Hydraulic Binder. American Ceramic Society 2018, 101, 4158–4170. [Google Scholar] [CrossRef]
  16. Antunes, M.; Santos, R.L.; Pereira, J.; Horta, R.B.; Paradiso, P.; Colaço, R. The Apparent Activation Energy of a Novel Low-Calcium Silicate Hydraulic Binder. Materials 2021. [Google Scholar] [CrossRef]
  17. Santos, R.L.; Horta, R.B.; Pereira, J.; Nunes, T.G.; Rocha, P.; Lopes, J.N.C.; Colaço, R. Novel High-Resistance Clinkers with 1.10<CaO/SiO2<1.25 : Production Route and Preliminary Hydration Characterization. Cem Concr Res 2016, 85, 39–47. [Google Scholar] [CrossRef]
  18. Stemmermann, P.; Beuchle, G.; Garbev, K.; Schweike, U. Celitement- A New Sustainable Hydraulic Binder Based on Calcium Hydrosilicates. 13th International Congress on the Chemistry of Cement. 2011, 1–7. [Google Scholar]
  19. Sahu, S.; Meininger, R.C. Sustainability and Durability of Solidia Cement Concrete. Concrete International 2020, 29–34. [Google Scholar]
  20. Chi, L.; Zhang, A.; Qiu, Z.; Zhang, L.; Wang, Z.; Lu, S.; Zhao, D. Hydration Activity, Crystal Structural, and Electronic Properties Studies of Ba - Doped Dicalcium Silicate. Nanotechnology Review 2020, 1027–1033. [Google Scholar] [CrossRef]
  21. Kotsay, G.; Jaskulski, R. Belite Cement as an Ecological Alternative to Portland Cement – a Review. Materials Structures Technology 2020, 2, 70–76. [Google Scholar] [CrossRef]
  22. Meyer, V.; Cristofaro, N. De; Bryant, J.; Sahu, S. Solidia Cement an Example of Carbon Capture and Utilization. Key Eng Mater 2018, 761, 197–203. [Google Scholar] [CrossRef]
  23. Bayão, M.I. Mecanismos de Hidratação e Otimização Das Condições de Hidratação de Cimentos de Baixo Teor Em Cálcio. MsC; Lisbon University, Instituto Superior Técnico: LIsbon, Portugal, 2017. [Google Scholar]
  24. Câmara Santos, D. Desenvolvimento de Novos Cimentos Amigos Do Ambiente. MsC; Lisbon University, Instituto Superior Técnico: Lisbon, Portugal, 2015. [Google Scholar]
  25. Pardal, M. Desenvolvimento de Novos Cimentos Com Política Sustentável de Baixo Teor Em Cálcio Produção e Caracterização de Amorfos No Sistema CaO-SiO2-Al2O3-Fe2O3. MsC; Lisbon University, Instituto Superior Técnico: Lisbon, Portugal,, 2015. [Google Scholar]
  26. Cunha, M.I. Mecanismos de Hidratação e Otimização Das Condições de Hidratação de Cimentos de Baixo Teor Em Cálcio. MsC; Lisbon University , Instituto Superior Técnico: Lisbon, Portugal, 2017. [Google Scholar]
  27. Santos, D. Studies on Low Calcium Amorphous Hydraulic Binders and on the Pseudowollastonite Effect on Their Compressive Strength Performance. MsC; Lisbon University, Instituto Superior Técnico: Lisbon, Portugal, 2018. [Google Scholar]
  28. Pinha, M. Eco-Efficient Concrete Produced with a New Amorphous Hydraulic Binder with C/S Molar Ratio of 1.1-Proof of Concept in Mortar Mixtures. MsC; Lisbon University, Instituto Superior Técnico: Lisbon, Potugal, 2018. [Google Scholar]
  29. Faria, B. Hydration of Amorphous Calcium Silicate Clinkers MD Simulations with ReaxFF; Lisbon University, Instituto Superior Técnico: Lisbon, Portugal, 2018. [Google Scholar]
  30. Mendes, Á. Studies on a New Low Calcium Amorphous Hydraulic Binder. MsC, Lisbon University; Instituto Superior Técnico: Lisbon, Portugal, 2021. [Google Scholar]
  31. Santos, R.L.; Horta, R.B.; Pereira, J.; Nunes, T.G.; Rocha, P.; Lopes, J.N.; Colaço, R. Microstructural Control and Hydration of Novel Micro-Dendritic Clinkers with CaO/SiO2 = 1.4. Cem Concr Res 2015, 76, 212–221. [Google Scholar] [CrossRef]
  32. Smith, B. Infrared Spectral Interpretation A Systematic Approach; 1st Edition.; Taylor and Francis Group: Boca Raton, Florida USA, 1999; ISBN 0-8493-2463-7. [Google Scholar]
  33. Garcia, M.D. Synthesis by Supercritical Fluids Methods of Advanced Additions for Cementitious Materials. PhD Thesis Material chemistry., Université de Bordeaux, 2018; p. 233. [Google Scholar]
  34. Freitas, A.A.; Santos, R.L.; Colaço, R.; Bayão Horta, R.; Canongia Lopes, J.N. From Lime to Silica and Alumina: Systematic Modeling of Cement Clinkers Using a General Force-Field. Physical Chemistry Chemical Physics 2015, 17, 18477–18494. [Google Scholar] [CrossRef]
  35. Scrivener, K.L.; Nonat, A. Hydration of Cementitious Materials, Present and Future. Cem Concr Res 2011, 41, 651–665. [Google Scholar] [CrossRef]
  36. Ouzia, A.; Scrivener, K. The Needle Model: A New Model for the Main Hydration Peak of Alite. Cem Concr Res 2019, 115, 339–360. [Google Scholar] [CrossRef]
  37. Berodier, E.; Scrivener, K. Understanding the Filler Effect on the Nucleation and Growth of C-S-H. Journal of the American Ceramic Society 2014, 97, 3764–3773. [Google Scholar] [CrossRef]
  38. Thomas JJ , Ghazizadeh S, M.E.. Kinetic Mechanisms and Activation Energies for Hydration of Standard and Highly Reactive Forms of β – Dicalcium Silicate ( C2S ). Cem Concr Res 2018, 322–328. [CrossRef]
  39. Thomas, J.J. The Instantaneous Apparent Activation Energy of Cement Hydration Measured Using a Novel Calorimetry-Based Method. Journal of the American Ceramic Society 2012, 95, 3291–3296. [Google Scholar] [CrossRef]
  40. Ping, Y.; Kirkpatrick, R.J.; Brent, P.; McMillan, P.F.; Cong, X. Structure of Calcium Silicate Hydrate (C-S-H): Near-, Mid-, and Far-Infrared Spectroscopy. Journal of the American Ceramic Society 1999, 82, 742–748. [Google Scholar] [CrossRef]
  41. Joshi, S.; Kalyanasundaram, S.; Balasubramanian, V. Quantitative Analysis of Sodium Carbonate and Sodium Bicarbonate in Solid Mixtures Using Fourier Transform Infrared Spectroscopy (FT-IR). In Proceedings of the Applied Spectroscopy; August 2013; Vol. 67; pp. 841–845. [Google Scholar]
  42. Paradiso, P.; Santos, R.L.; Horta, R.B.; Lopes, J.N.C.; Ferreira, P.J.; Colaço, R. Formation of Nanocrystalline Tobermorite in Calcium Silicate Binders with Low C/S Ratio. Acta Mater 2018, 152, 7–15. [Google Scholar] [CrossRef]
  43. Abdolhosseini Qomi, M.J.; Krakowiak, K.J.; Bauchy, M.; Stewart, K.L.; Shahsavari, R.; Jagannathan, D.; Brommer, D.B.; Baronnet, A.; Buehler, M.J.; Yip, S.; et al. Combinatorial Molecular Optimization of Cement Hydrates. Nat Commun 2014, 5, 4960. [Google Scholar] [CrossRef]
  44. Richardson, I.G. Model Structures for C-(A)-S-H(I). Structural Science, Crystal Engineering and Materials, Acta Crystallographica Section B: 2014, 70, 903–923. [Google Scholar] [CrossRef]
  45. Houston, J.R.; Maxwell, R.S.; Carroll, S.A. Transformation of Meta-Stable Calcium Silicate Hydrates to Tobermorite: Reaction Kinetics and Molecular Structure from XRD and NMR Spectroscopy. Geochem Trans 2009, 10. [Google Scholar] [CrossRef]
  46. Mitra, N.; Sarkar, P.K.; Prasad, D. Intermolecular Dynamics of Ultraconfined Interlayer Water in Tobermorite: Influence on Mechanical Performance. Physical Chemistry Chemical Physics 2019, 21, 11416–11423. [Google Scholar] [CrossRef]
  47. Tunega, D.; Zaoui, A. Understanding of Bonding and Mechanical Characteristics of Cementitious Mineral Tobermorite from First Principles. J Comput Chem 2011, 32, 306–314. [Google Scholar] [CrossRef]
  48. Essene, E. High-Pressure Transformations in CaSi03*. Contr. Mineral. and Petrol 1974, 45, 247–250. [Google Scholar] [CrossRef]
  49. Ashraf, W.; Olek, J.; Sahu, S. Phase Evolution and Strength Development during Carbonation of Low-Lime Calcium Silicate Cement (CSC). Constr Build Mater 2019, 210, 473–482. [Google Scholar] [CrossRef]
  50. Qian, B.; Li, X.; Shen, X. Preparation and Accelerated Carbonation of Low Temperature Sintered Clinker with Low Ca/Si Ratio. J Clean Prod 2016, 120, 249–259. [Google Scholar] [CrossRef]
  51. Plattenberger, D.A.; Opila, E.J.; Shahsavari, R.; Clarens, A.F. Feasibility of Using Calcium Silicate Carbonation to Synthesize High-Performance and Low-Carbon Cements. ACS Sustain Chem Eng 2020, 8, 5431–5436. [Google Scholar] [CrossRef]
  52. Wang, X.; Guo, M.Z.; Ling, T.C. Review on CO2 Curing of Non-Hydraulic Calcium Silicates Cements: Mechanism, Carbonation and Performance. Cem Concr Compos 2022, 133. [Google Scholar] [CrossRef]
  53. Plattenberger, D.A.; Ling, F.T.; Tao, Z.; Peters, C.A.; Clarens, A.F. Calcium Silicate Crystal Structure Impacts Reactivity with CO2 and Precipitate Chemistry. Environ Sci Technol Lett 2018, 5, 558–563. [Google Scholar] [CrossRef]
  54. Bentz, D.P. The Hidden Meaning of Water-Cement Ratio. Concrete International 2008, 30, 51–54. [Google Scholar]
  55. Bentz, D.P. Influence of Water-to-Cement Ratio on Hydration Kinetics: Simple Models Based on Spatial Considerations. Cem Concr Res 2006, 36, 238–244. [Google Scholar] [CrossRef]
  56. Poole, J.L.; Riding, K.A.; Folliard, K.J.; Juenger, M.C.G.; Schindler, A.K. Methods for Calculating Activation Energy for Portland Cement. ACI Mater J 2007, 104, 86–94. [Google Scholar] [CrossRef]
  57. Richardson, I.G. Model Structures for C-(A)-S-H(I). Acta Crystallogr B Struct Sci Cryst Eng Mater 2014, 70, 903–923. [Google Scholar] [CrossRef]
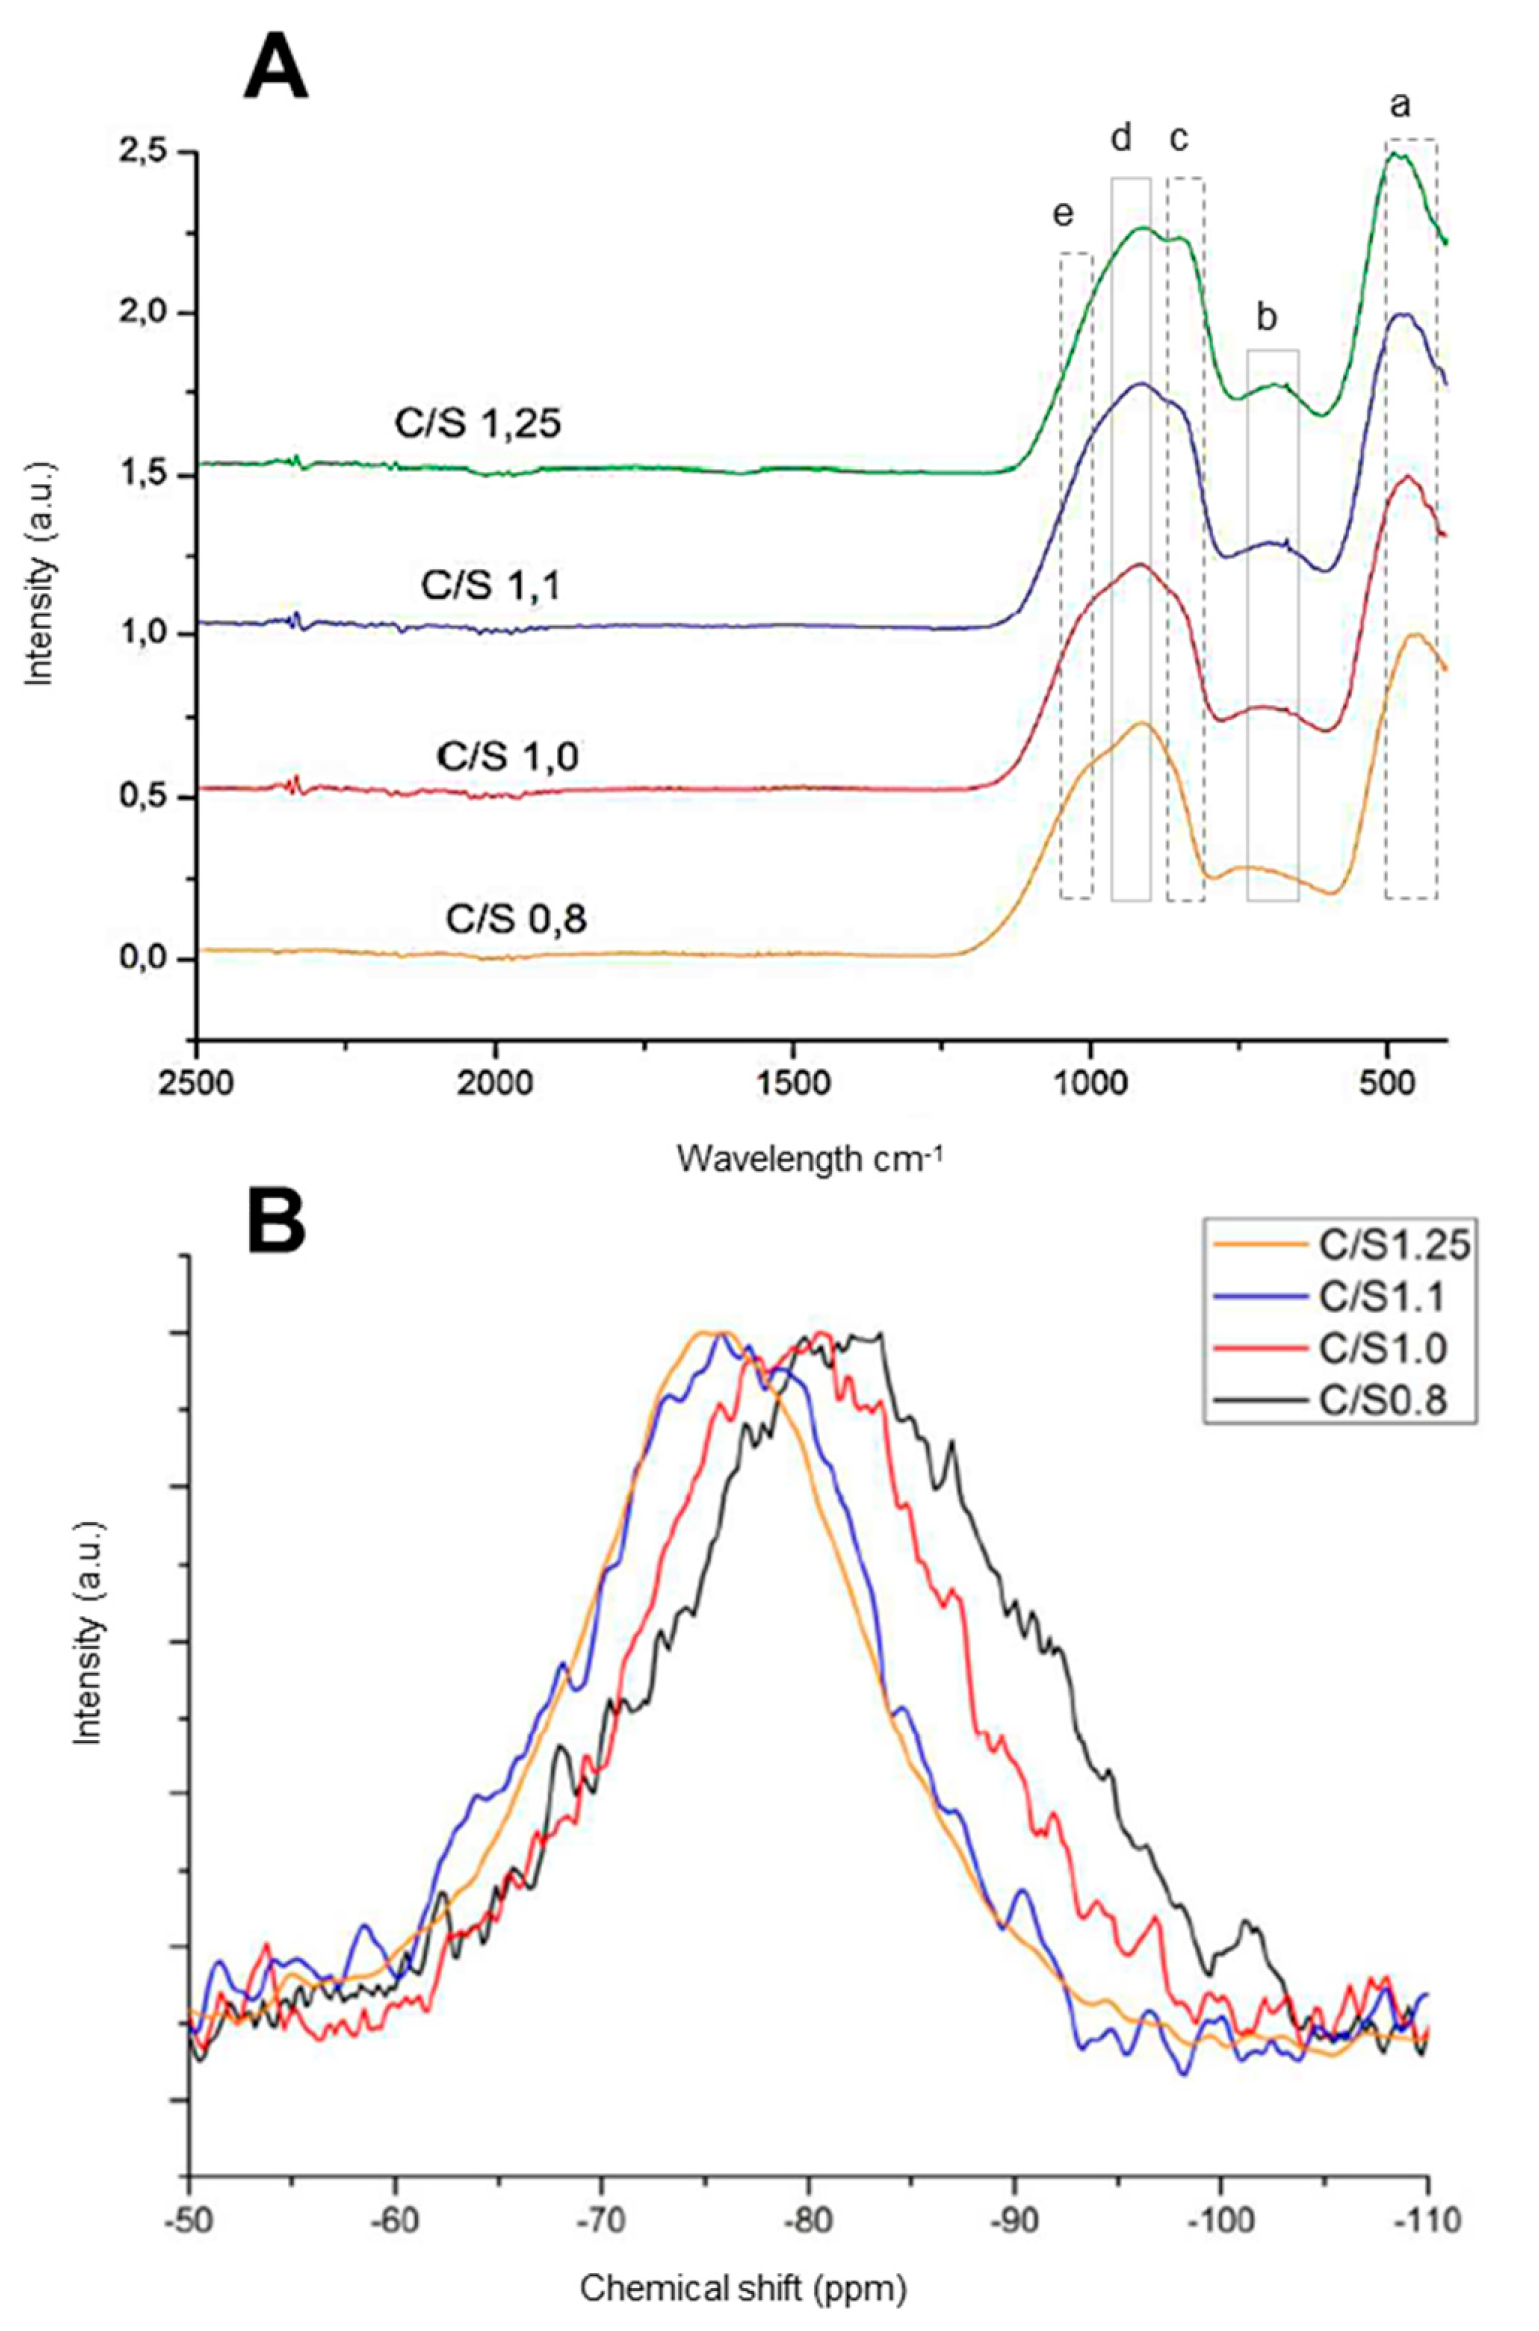
Figure 1. A) FTIR spectra results of AWLC samples produced with a Ca/Si ratio in a range between 0.8 and 1.25, and B) 29Si MAS NMR spectra of AWLC samples produced with a Ca/Si ratio in a range between 0.8 and 1.25, adapted from [25].
Preprints 76666 g001
Figure 2. Normalized heat flow and normalized cumulative heat curves as a function of time of hydration of an AWLC paste with a 0.325 water/binder ratio and a specific surface area of 51.315 cm2/g, adapted from [26]. The calorimetric curve was divided into 3 sections: I) the initial period, II) the acceleration period, and III) the deceleration period.
Preprints 76666 g002
Figure 3. Comparison of the anhydrous AWLC FTIR spectra with a 28 and a 90-day hydrated sample. The tests were performed on binders with either a Ca/Si ratio of either 1.1 or 1.25, A and B respectively, from [17].
Preprints 76666 g003
Figure 4. Comparison of the anhydrous AWLC 29SiMAS NMR spectra with a 28 and a 90-day hydrated sample. The tests were performed on binders with either a Ca/Si ratio of either 1.1 or 1.25, A and B respectively, from [17].
Preprints 76666 g004
Figure 5. Selected area electron diffraction of TEM observations of a hydrated AWLC sample, from [42].
Preprints 76666 g005
Figure 6. Comparison of a Rietveld XRD analysis with a 7 and a 90-day hydrated AWLC sample. P- Pseudowollastonite; T - Tobermorite; * - internal standard Al2O3, adapted from [42].
Preprints 76666 g006
Figure 7. Correlation between the pseudowollastonite (PW blue) and tobermorite (T orange) content with the compressive strength of AWLC paste at 7, 28, and 90 days of hydration. The studied binders had a Ca/Si ratio of 1.1 (top row) or 1.25 (down the row) and were produced with a melting temperature between 1485 and 1530ºC, adapted from [14].
Preprints 76666 g007
Figure 8. Compressive strength evolution as a function of time of hydration for AWLC paste with (A) different w/b ratios, and (B) different specific surface areas, from [26].
Preprints 76666 g008
Figure 9. Comparison of the compressive strength of OPC (black squares) at 7, 28, and 90 days of hydration with the compressive strength of AWLC with different Ca/Si ratios. Blue dots Ca/Si 1.1 and green dots Ca/Si 1.25, adapted from [17].
Preprints 76666 g009
Figure 10. Correlation between the pseudowollastonite (PW blue) and tobermorite (T orange) content with the compressive strength of AWLC paste at 7, 28, and 90 days of hydration. The studied binder was produced at 1500ºC and was alkali-activated with a Na2SiO3 solution. Based on [15].
Preprints 76666 g010
Figure 11. Hydration degree in relation to the curing time of Type I OPC (black line) based form [56], water-hydrated AWLC binder (blue line), and activated AWLC binder (red line).
Preprints 76666 g011
Figure 12. Normalized heat flow (A) and normalized cumulative heat curves (B) in the function of time of hydration of AWLC samples with different amounts of Na2SiO3. Adapted from [30].
Preprints 76666 g012
Figure 13. Compressive strength evolution over time for paste samples with different Na2SiO3 content. Adapted from [30].
Preprints 76666 g013
Figure 14. Plot of weight percentage of CSH formed versus compressive strength for water-hydrated OPC pastes and AWLC pastes hydrated with either water or Na2SiO3 solution, from [14,17,30].
Preprints 76666 g014
Table 1. Deconvolutions results of the NMR spectra, adapted from [25].
Ca/Si ratio 0.8 1 1.1 1.25
Qn Area (%)
Q0 18.1 18.4 28.1 21.5
Q1 26.8 37.5 40.2 50.1
Q2 34.7 30.4 27.6 26.8
Q3 20.4 13.6 4.1 2.6
Table 2. Comparative summary of main features of the AWLC binder with OPC [10,16,25,30,42].
OPC AWLC
Production Method The raw mix is fed into a kiln and fired to a temperature of 1400–1450ºC Melting at ~1500ºC of the mixture followed by a fast quenching
Process-Related CO2 (kg/ton) 535* 340**
The density of the material (g/cm3) 3.1 2.94±0.05
Main phases of the binder Alite (50-70%)
Belite (15-30%)
C3A and C4AF ( <20%)
Amorphous (90%)
Pseudowollastonite (< 18%)
Activation Energy (kJ/mol) 51-55 82-85
Cumulative Heat after 72h (J/g) 250 53 when activated with Na2SiO3 solution with 1.8%wt Na2O content
Main hydration products CSH and portlandite CSH and tobermorite 9A
Ca/Si ratio of CSH ~1.7 ~1.1
MCL ~2.4 ~5
Paste compressive strength 2 days (MPa) 33 11 when activated with Na2SiO3 solution with 1.8%wt Na2O content
Paste compressive strength 28 days (MPa) 65 63 when activated with Na2SiO3 solution with 1.8%wt Na2O content
* To mitigate CO2 emissions in OPC production different methods have been approached [10], namely, the reduction of the cement-to-clinker ratio; the use of alternative fuels, an increase in efficiency of the kiln process, and carbon capture and storage of the emitted CO2. ** Since the entire process of AWCL can be electrified, and assuming that it is completely powered by green energy, this amount of pure CO2 is the only gas released during the production process, facilitating its capture and use.
Disclaimer/Publisher’s Note: The statements, opinions and data contained in all publications are solely those of the individual author(s) and contributor(s) and not of MDPI and/or the editor(s). MDPI and/or the editor(s) disclaim responsibility for any injury to people or property resulting from any ideas, methods, instructions or products referred to in the content.
Copyright: This open access article is published under a Creative Commons CC BY 4.0 license, which permit the free download, distribution, and reuse, provided that the author and preprint are cited in any reuse.
Prerpints.org logo

Preprints.org is a free preprint server supported by MDPI in Basel, Switzerland.

Subscribe

© 2024 MDPI (Basel, Switzerland) unless otherwise stated