1. Introduction
Because natural gas is one of the sources of energy production in the transmission industry and domestic use, its production and distribution is very important [
1]. Natural gas is mainly composed from methane (80 to 90 percent), a small amount of ethane-propane and butane. In addition, gas compounds often include other compounds such as H2O and CO2 that the presence of these compounds in gas causes problems during transportation and consumption [
2,
3]. Because natural gas often leaves the reservoirs as saturated from water, A slight change in gas pressure or temperature causes water condensation or formation of hydrates [
4]. Hydrates are compounds very similar to ice which are obtained from the bonds between water and ice molecules [
5]. The formation of hydrates during gas transmission causes blockage of the pipeline and consequently, permanent interruption of gas flows [
6]. In addition to hydrate formation, the presence of liquid water in pipelines can cause pipe corrosion, therefore, it is necessary to be removed from the composition of natural gas [
7]. Removal of moisture from natural gas is due to the need to prevent from reducing the calorific value of gas and purifying gas in order to achieve the necessary standards for delivering gas to Petrochemicals, industries and household uses [
8,
9]. Also, in addition, in the facilities department in the gas industry, the presence of water in gas pipelines can cause two main problems:
The presence of small amounts of water along with the presence of some sour gases causes widespread acid corrosion in gas transmission pipelines that this issue will be cause the imposition of costs and the possibility of risks due to gas leakage [
10,
11].
Also, water is one of the main bases for the formation of gas hydrates [
12], and formation of solid methane hydrates in pipes containing gas in different parts of the facility can change the flow pattern, pressure changes and also, with its rapid growth, it can stop the gas transmission operation due to the blockage of the pipe and the possibility of its bursting [
13]. As a result, dehumidification of natural gas from the formation of gas hydrates causes proper transmission and reduction of corrosion. There are various methods for dehumidifying natural gas on an industrial scale [
14,
15], the most important of which are as follows:
- 1)
Direct cooling
- 2)
Surface adsorption
- 3)
Absorption by liquid
Dehumidification of natural gas is done in two main ways: Towers filled with surfactants and the wider method that is ethylene glycol dehumidification units [
16].
The first method includes towers filled with solid surface absorbents such as silica gel or alumina [
17], which have the problems as follows:
The need for several towers (on average 3 or 4 towers); restriction of use due to weight and large dimensions, the need for permanent and accurate operation controls, extensive destruction and high price of absorbent, also this method often has the problems of ethylene glycol dehumidification units [
18].
A more widespread method of dehumidification unit is tri-ethylene glycol (TEG) [
19]. This method only involves the use of two towers that is contacted with ethylene glycol which is a liquid of water absorbent in the gas absorption tower in the form of counter flow on the bubble cap trays and then in the solvent recycling operations disposal tower, is required to separate moisture from tri-ethylene glycol [
20]. Some of the main problems with glycolic dehumidifiers are:
- 1)
Absorbent wide flammability; Result: safety issues.
- 2)
Complex unit operation in absorption and disposal towers; Result: high investment, operating and maintenance costs.
- 3)
Energy supply of towers and facilities; Result: consuming part of gas as fuel.
- 4)
Requiring solvent warehouse and storage, replacing, neutralizing and reproducing it; Result: the need for a large space.
- 5)
Emission of hazardous volatile organic compounds (VOCs), especially benzene, toluene, ethylbenzene, and xylenes (BTEX); Result: release of 40 tons of VOCs per year from a typical dehumidification unit that half of which is BTEX [
21,
22,
23].
If the goal is to dehumidify of large volume of gas to reach a dew point of 40 to 140 degrees Fahrenheit, liquid absorption systems are more economical [
24]. But if the dew point is above 180 degrees Fahrenheit, membrane absorption units are more suitable [
25]. Due to the disadvantages of moisture, extensive studies are carried out in the field of investigating the effect of various parameters such as the type of adsorbent, feed flow intensity, temperature and process pressure on the moisture absorption performance of the gas flow [
26]. Therefore, temperature, pressure, moisture concentration in feed, Intensity of feed flow (independent variable) as variables affecting moisture absorption performance in a nanostructure membrane system are investigated [
22]. In terms of the growing trend of problems caused by the method of dehumidification conventionally, the necessity of conducting research by promising technologies such as nano is more apparent.
2. Materials and Methods
2.1. Synthesis of Preparation of Titanium Dioxide Nanowire by Eutectic Method
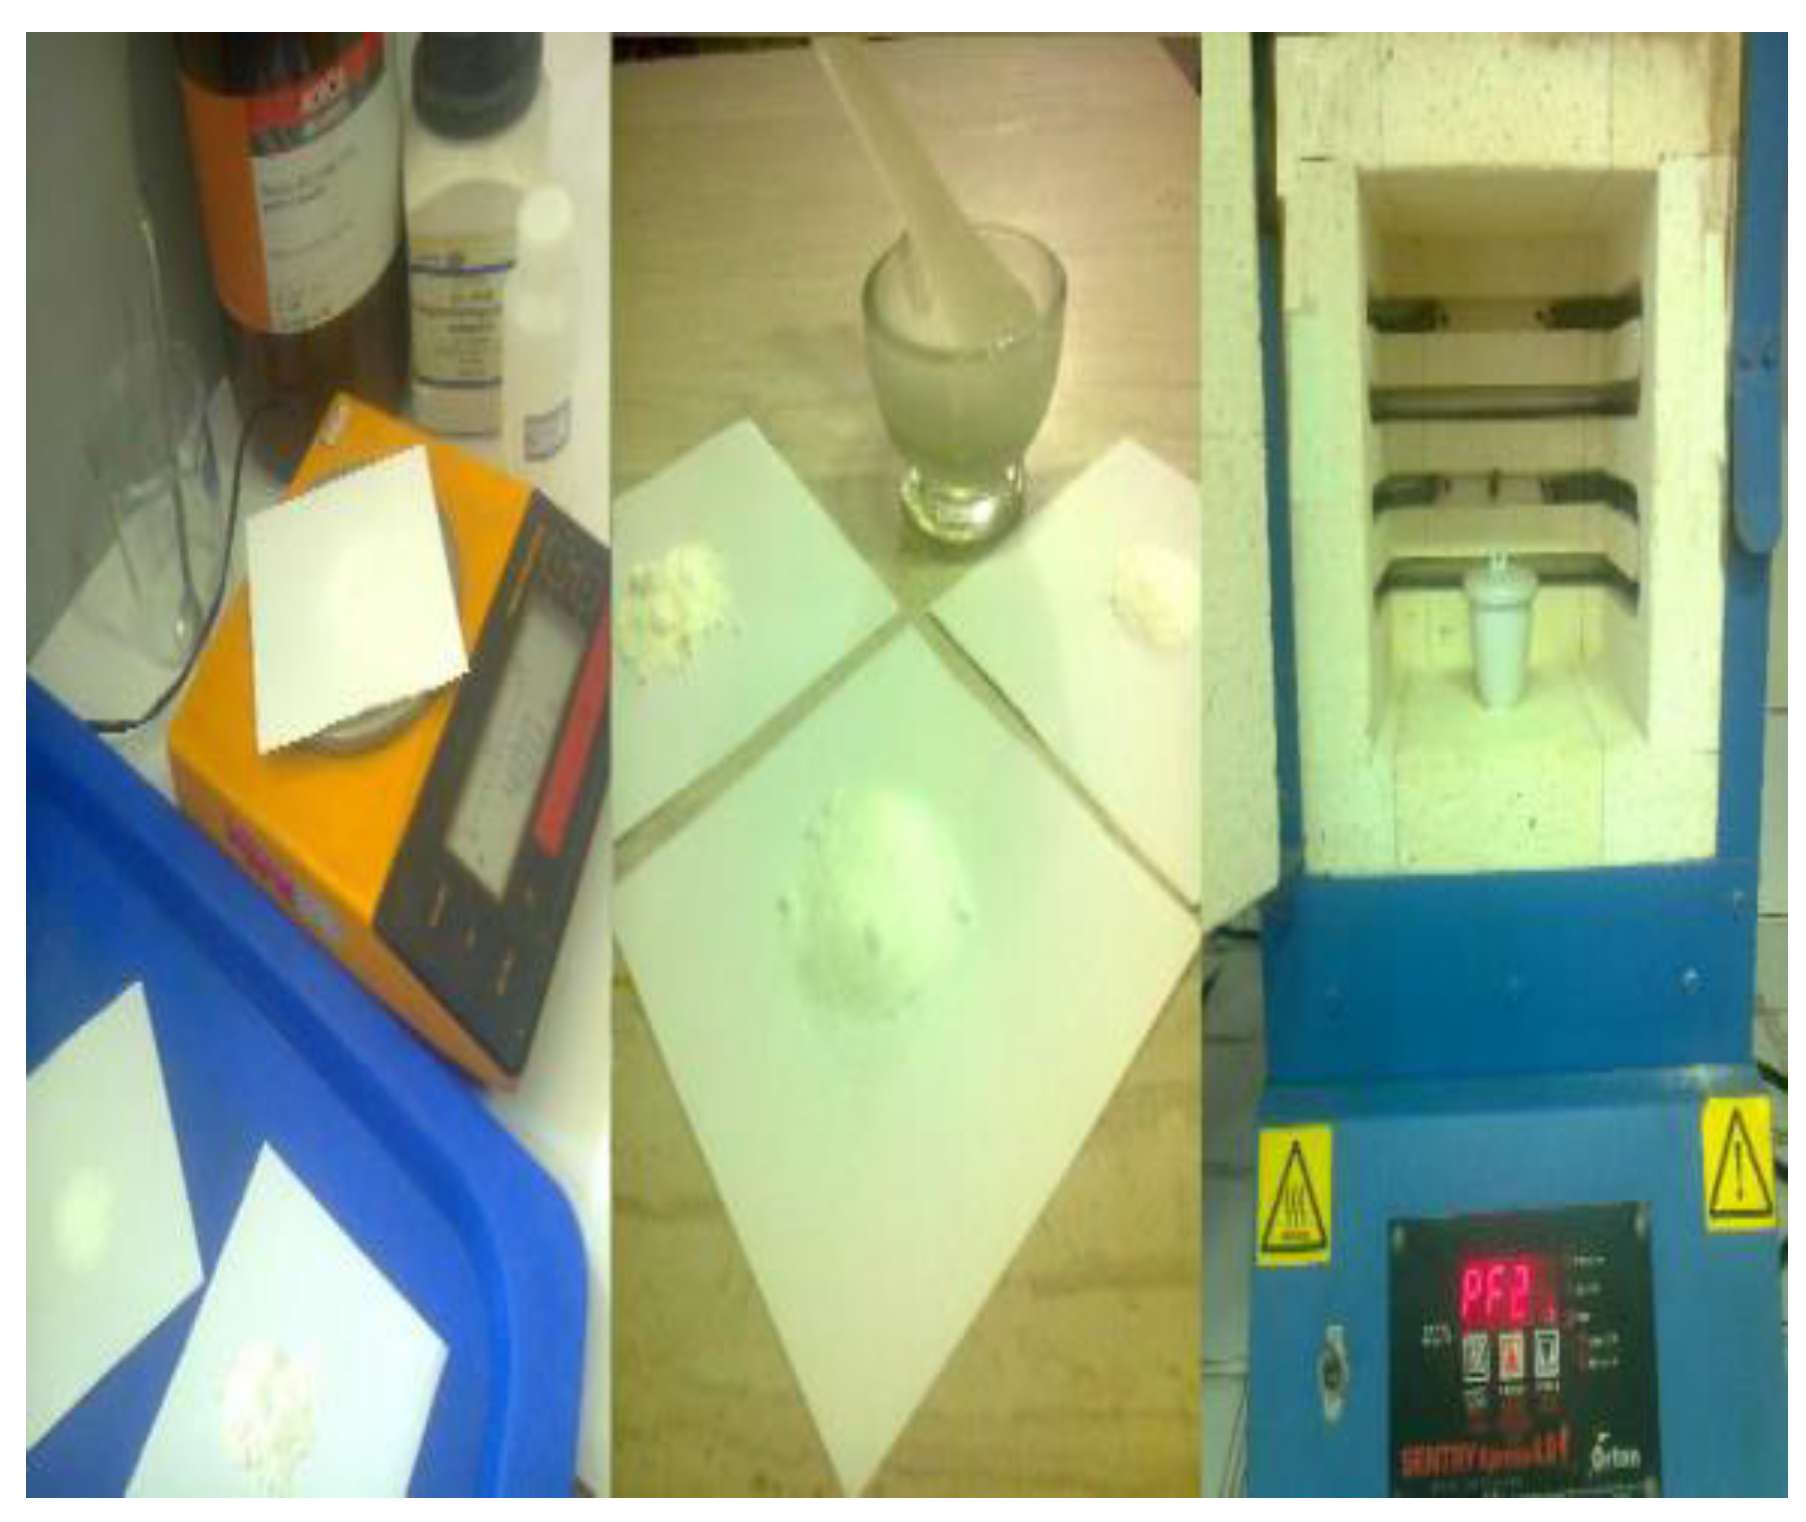
Due to the methods of preparation of nanostructures and also checking the condition of the equipment and available facilities, eutectic method has been used for fabrication of titanium nano oxide. Because the selected equipment used in this method is relatively cheap, the need for low temperature in the process, low energy consumption and compatible with the environment. To prepare titanium dioxide One-dimensional nano structures (nanowire) by eutectic method, a mixture of disodium phosphate salts (Na2HPO4) and sodium chloride (NaCl) and titanium dioxide raw material (TiO2) with specific weight ratios (1:4:1) was prepared and ground in a mortar, then transferred to the furnace in the porcelain crucible and the reaction was performed at temperature 825 C° for 8 h. After cooling, the crucible is removed from the furnace and then several times washing was done with boiled distilled water. During this step, the excess salts in the products were washed. At finally, the sediments from washing are dried in the furnace (
Figure 1).
2.2. Synthesis of Zeolite-NaA Membrane
The synthesis of zeolite was done by micro emulsion method and according to the report of Shams et al. (2013) [
27]. The surfactant used in this work was sodium di-decyl sulfate (SDS)5 with the general formula CH3(CH2)11OSO3Na which is an anionic surfactant with HLB=40 and its structure is as follows:

The numerical value of HLB plays an important role in deciding to choose the type of surfactant and indicates the polarity and non-polarity ratio of surfactant groups. To form a water-in-oil emulsion, HLB is needed between 5.3 to 8. But, SDS has a general mode and is used for most tests. In order to prepare micellar solution, surfactant (SDS) and auxiliary surfactant (butanol) with a weight ratio of 2:1 are mixed with solvent (Hexane). Auxiliary surfactant is used to neutralize electrostatic charges caused by side co-positioning of the charged heads of the ionic surfactant and stabilizing the micelles. To dissolve SDS in hexane, the resulting mixture is kept night and day in a closed glass container and mixed by a magnetic stirrer to achieve complete uniformity. Then the composition of zeolite is prepared with the molar ratio of Al3O3, 2.1SiO2, 3Na2O, 150H2O. In short, 2gr of aluminum sulfate and 0.58gr of sodium hydroxide is dissolved in 6.22gr of deionized water and will be poured into syringe A. 1.41gr of sodium silicate solution is poured into syringe B.
The contents of two syringes are added drop by drop to the micellar solution under ultrasonication. The weight ratio of mixing materials was 3H:1S:1Z, where H, S and Z represent solvent, the mixture of surfactants and aluminosilicate gel (the total weight of aluminum solution and silicate solution) respectively. Mixing of the ingredients continued for 30 min and then the resulting mixture was transferred to a steel reactor which its inner body was covered with Teflon and placed in an oven at a temperature of 75°C for 6 h. After this period, the contents of the reactor are removed and centrifuged to separate zeolite particles from the water and oil mixture, which are two separated phases. Then zeolite particles are washed several times with water and acetone to reduce the PH of the water after washing. Then zeolite particles were placed inside the oven to dry at a temperature of 120°C for 12 h. In order to calcine and remove the remaining surfactants, zeolite particles are placed at a temperature of 550°C for 5 h.
2.3. SiO2. Deposition on TiO2
In this step, 1gr of particles (TiO2) obtained from step 1 is dispersed in deionized water by a homogenizer and the resulting mixture is placed in a water bath at a temperature of 90°C. Then the amount of 3.7 g of sodium silicate (the weight ratio of ) is added to the solution. At this time, 0.1M hydrochloric acid solution is added drop by drop to the solution until the PH of the solution reaches 0.5. Stirring of the solution continues for 1h and after this period, the solution is cooled at room temperature and the covered particles (TiO2) with SiO2 are separated with a sieve. (TiO2) @SiO2 particles were washed and dried at 50°C. These particles were called P−TiS.
2.4. P−TiS Covering with NaA Zeolite
In order to coat P-TiS particles by zeolite, the vapor phase transport method (VPT) will be used which is a method in synthesis of high silica zeolites. In 1990, Sheva et al. reported that dry aluminosilicate gel was converted to MFI when exposed to water vapors and volatile amines. In fact, in this method, amorphous aluminosilicate gel is crystallized in contact with vapors of a structure-forming material without direct contact with it [
28]. In this research, this method was used to integrate the SiO
2 layer in zeolite. In short, the synthesized zeolite particles in step 2 were mixed with 30mL of toluene and placed in a closed container on a magnetic stirrer for one day and night. Then P-TiS particles were added to the mixture under vigorous stirring by a homogenizer. The weight ratio of P−TiS to zeolite is 1:1. Stirring was continued for 10 min. Then the mixture was placed statically to deposit TiO
2 particles covered with zeolite. The resulting particles were placed under vacuum and at ambient temperature for 2 h to evaporate the remaining toluene. The resulting solid was transferred to a steel reactor with Teflon inner body.
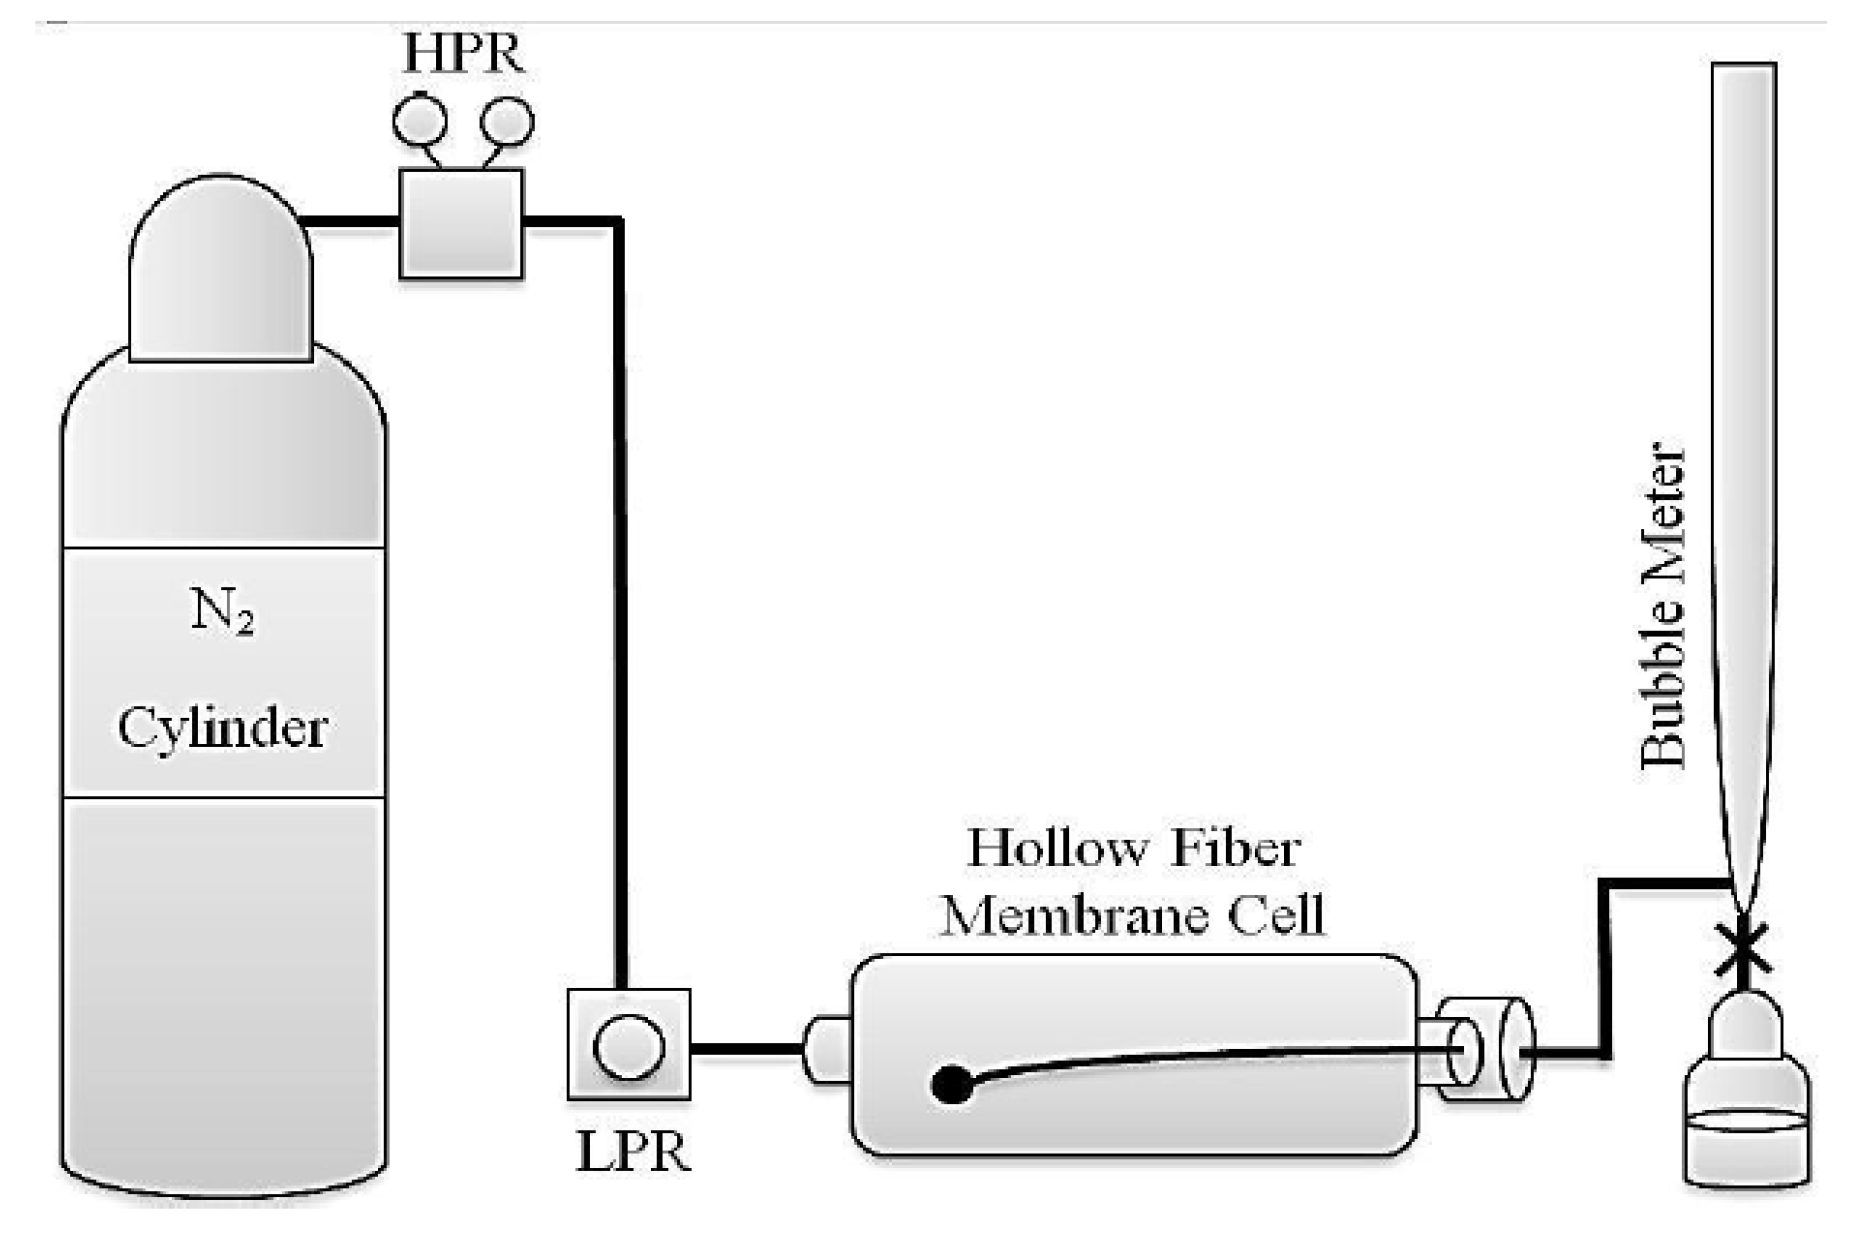
In (
Figure 2), an overview of the used reactor can be seen. The particles were placed on the cylinder inside the reactor and a solution containing 4g of deionized water and 2g of triethylamine was poured around it. Reactor was kept at a temperature of 140°C for 3 days. Then the resulting particles were removed from the reactor and dried at 40°C. These particles are named with TiZ−V [
29].
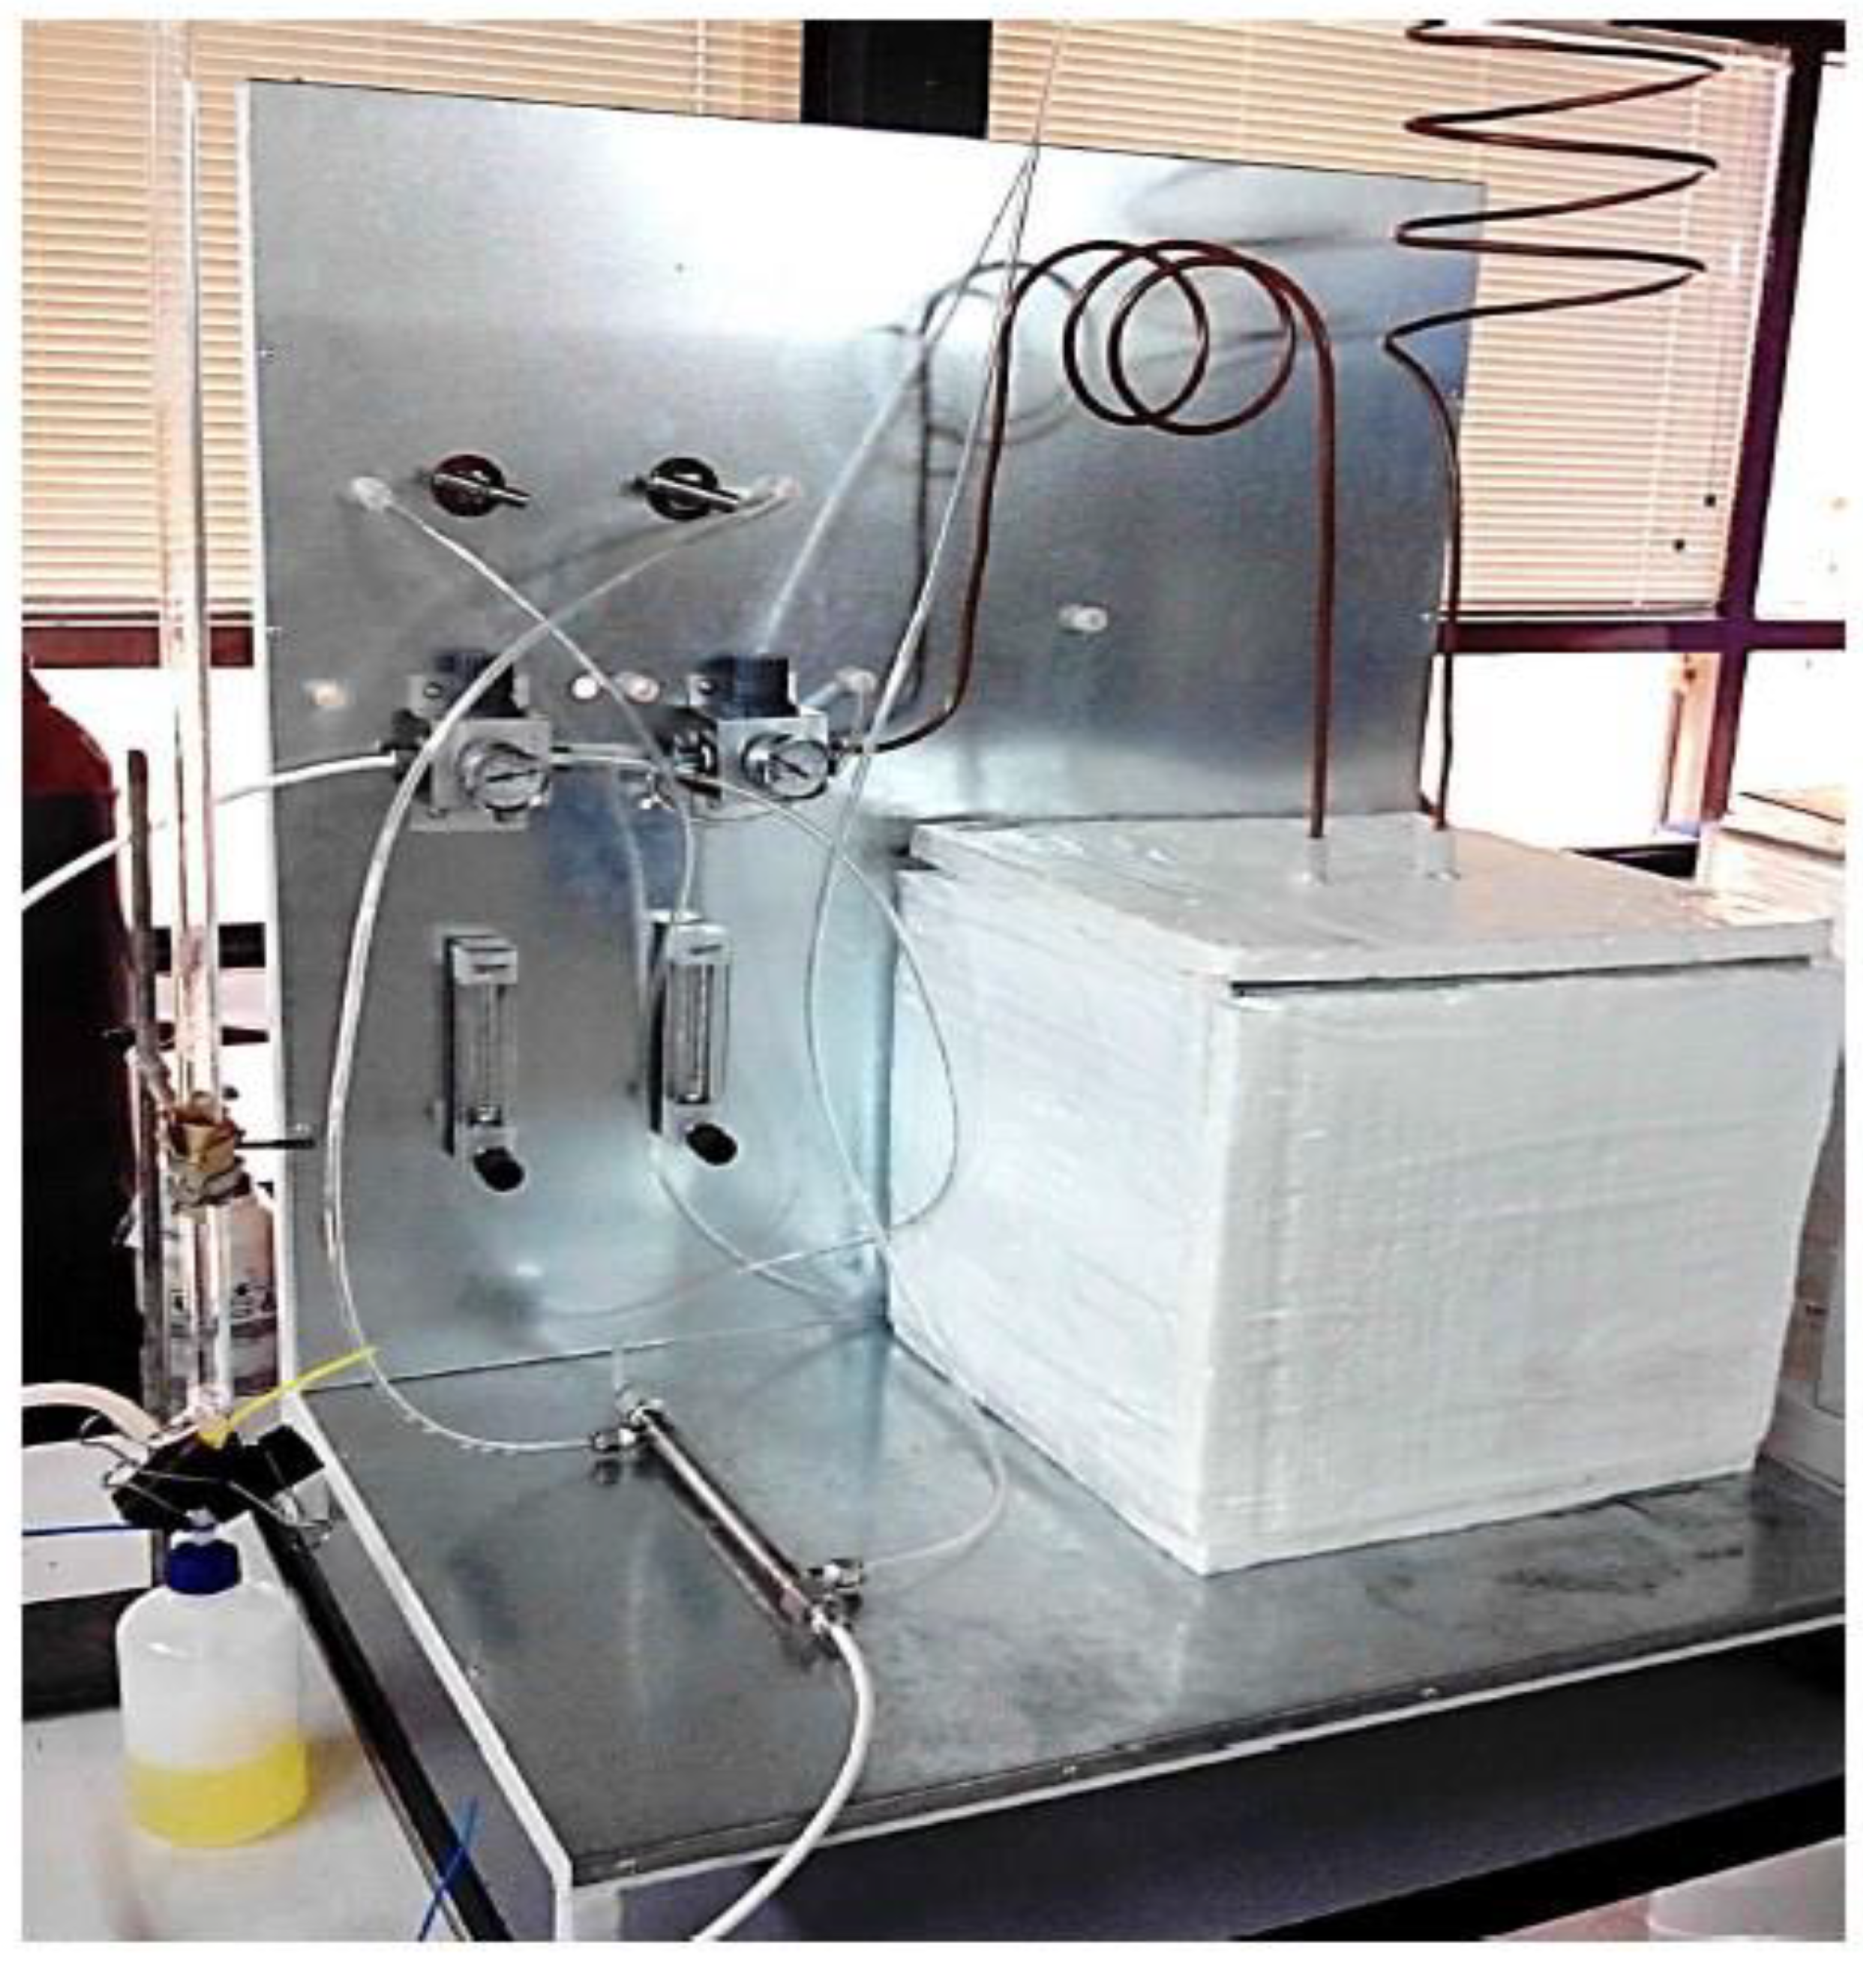
The entering gas from the cylinder enters to the chamber with a certain pressure. This gas goes from the side of the shell by passing through membrane wall to the inside of the hollow fiber and from there is directed to the bubble flow meter. According to the amount of permeated gas in the bubble flowmeter, gas permeability will be calculated (
Figure 3).
In order to determine the selectivity of membrane, the data obtained from the experiments are used as input for the calculations include; different pressures of the inlet gas(P[bar]), a certain volume of the bubble flow meter(V[ml]), The gas flow time in the bubble flow meter for a given volume (t[s]), ambient temperature and vapor generator tank temperature (T [°C]), relative humidity of feed RHF, relative humidity of penetrant flow RHP, relative humidity of residual RHR and feed flow (Lit/hr) which are used to measure the dehumidification performance of the constructed membrane. It should be noted that the considered standard operational conditions in performance tests include relative humidity of feed, 80%, the gas flow is 50 [Lit/hr] and without sweep flow which, these conditions in all operations except those mentioned in the measurement section of the effect of change operating parameters are followed by default.
3. Findings
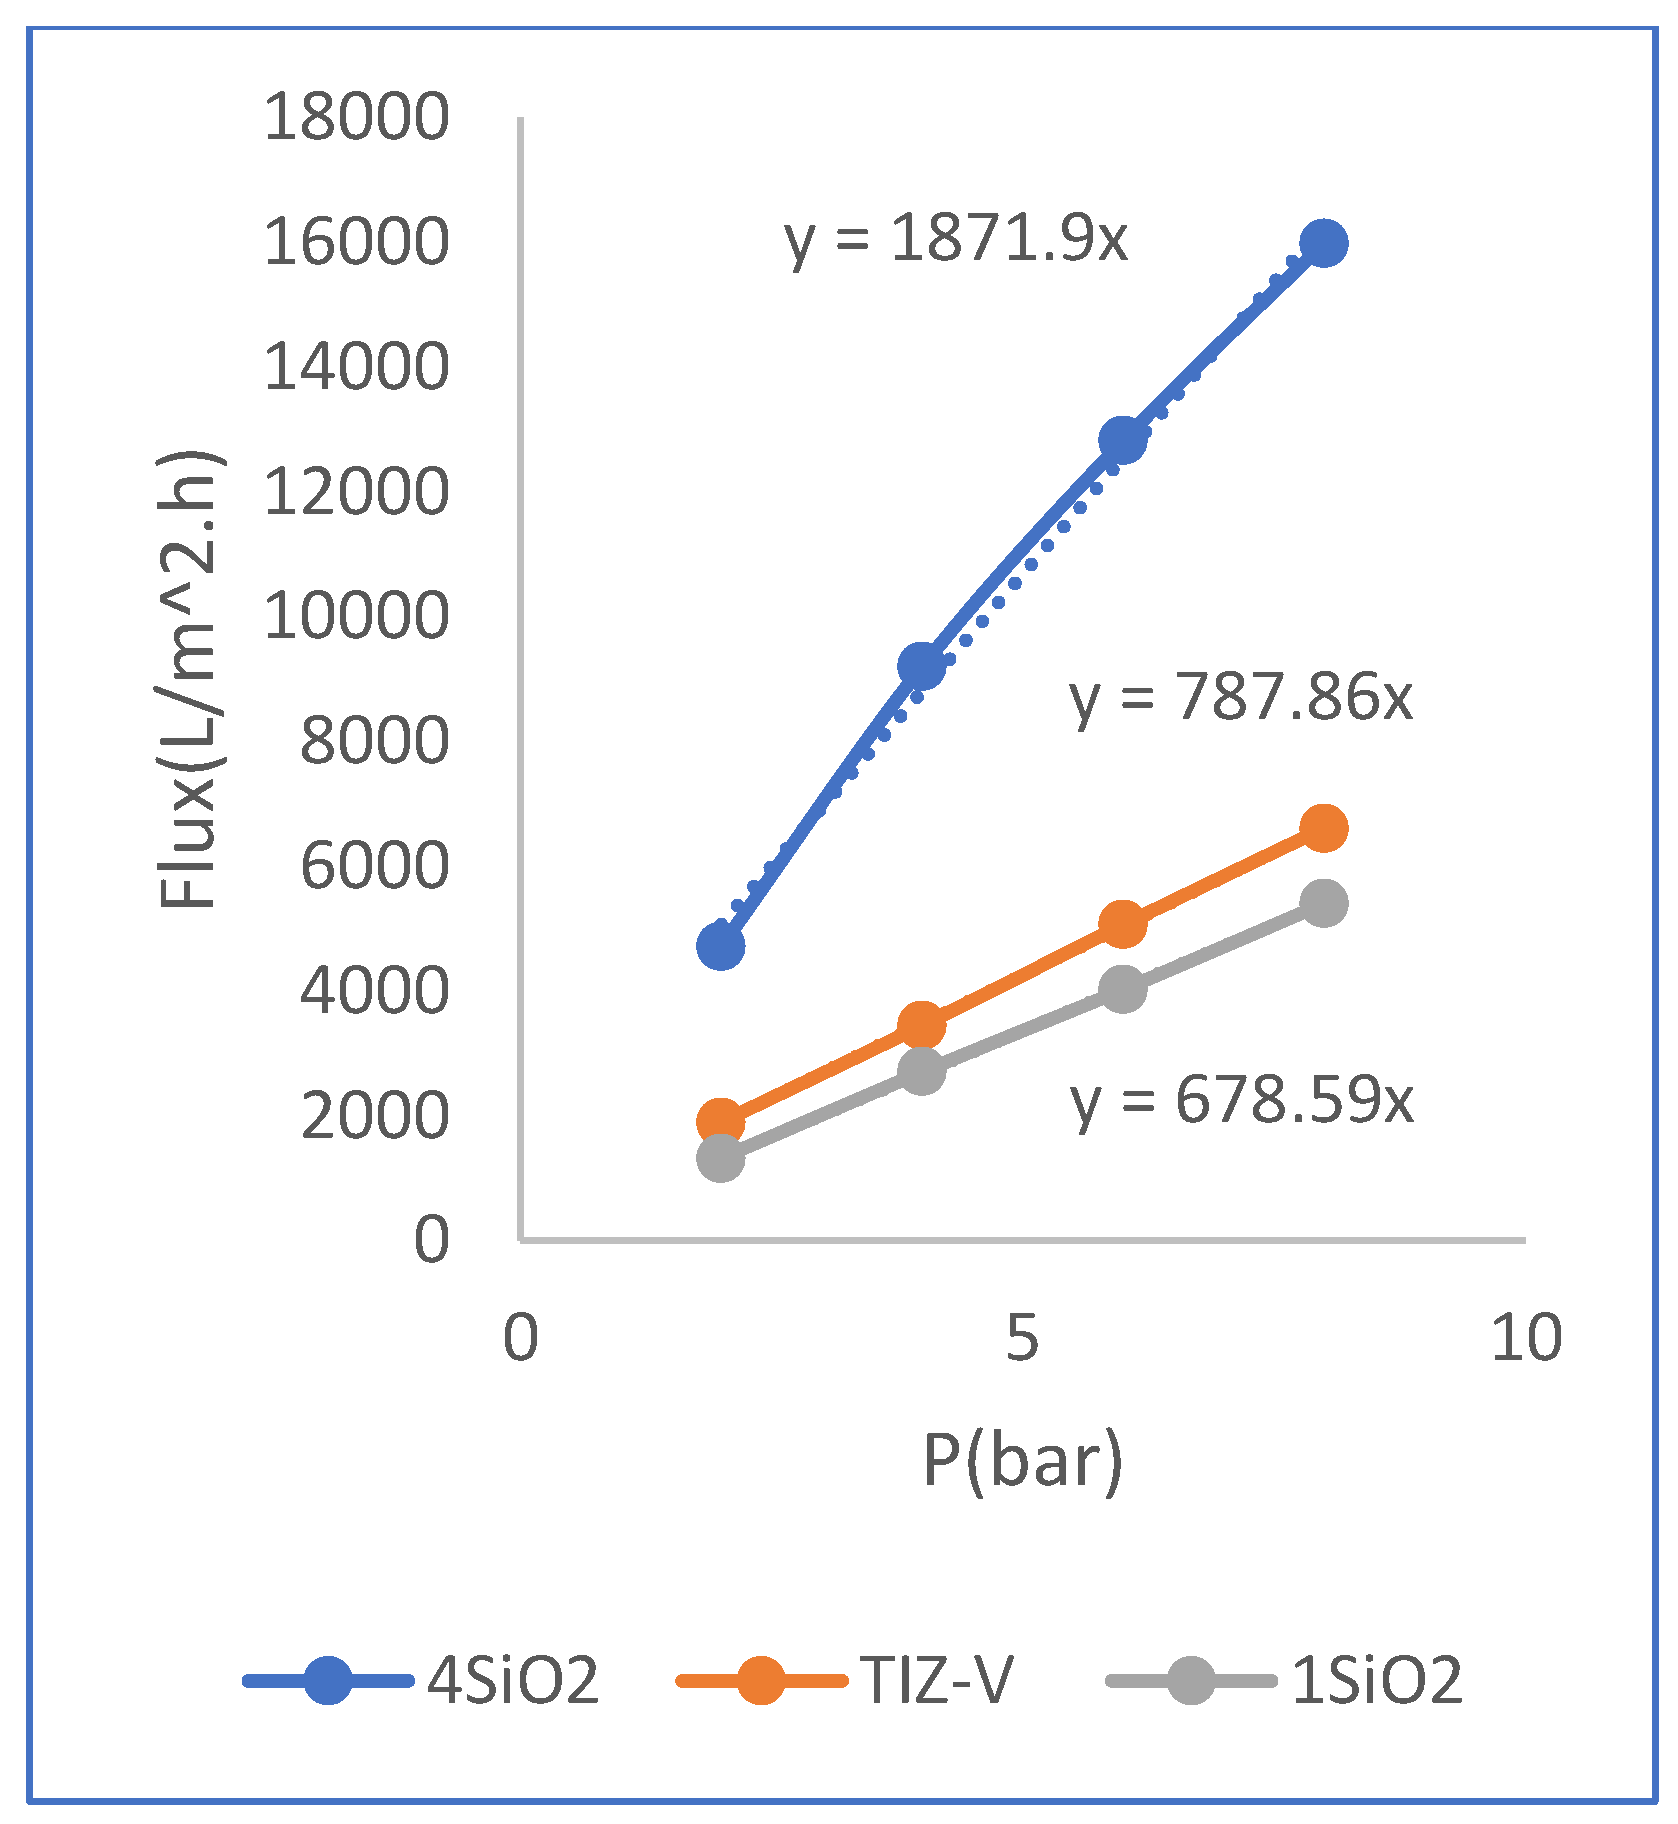
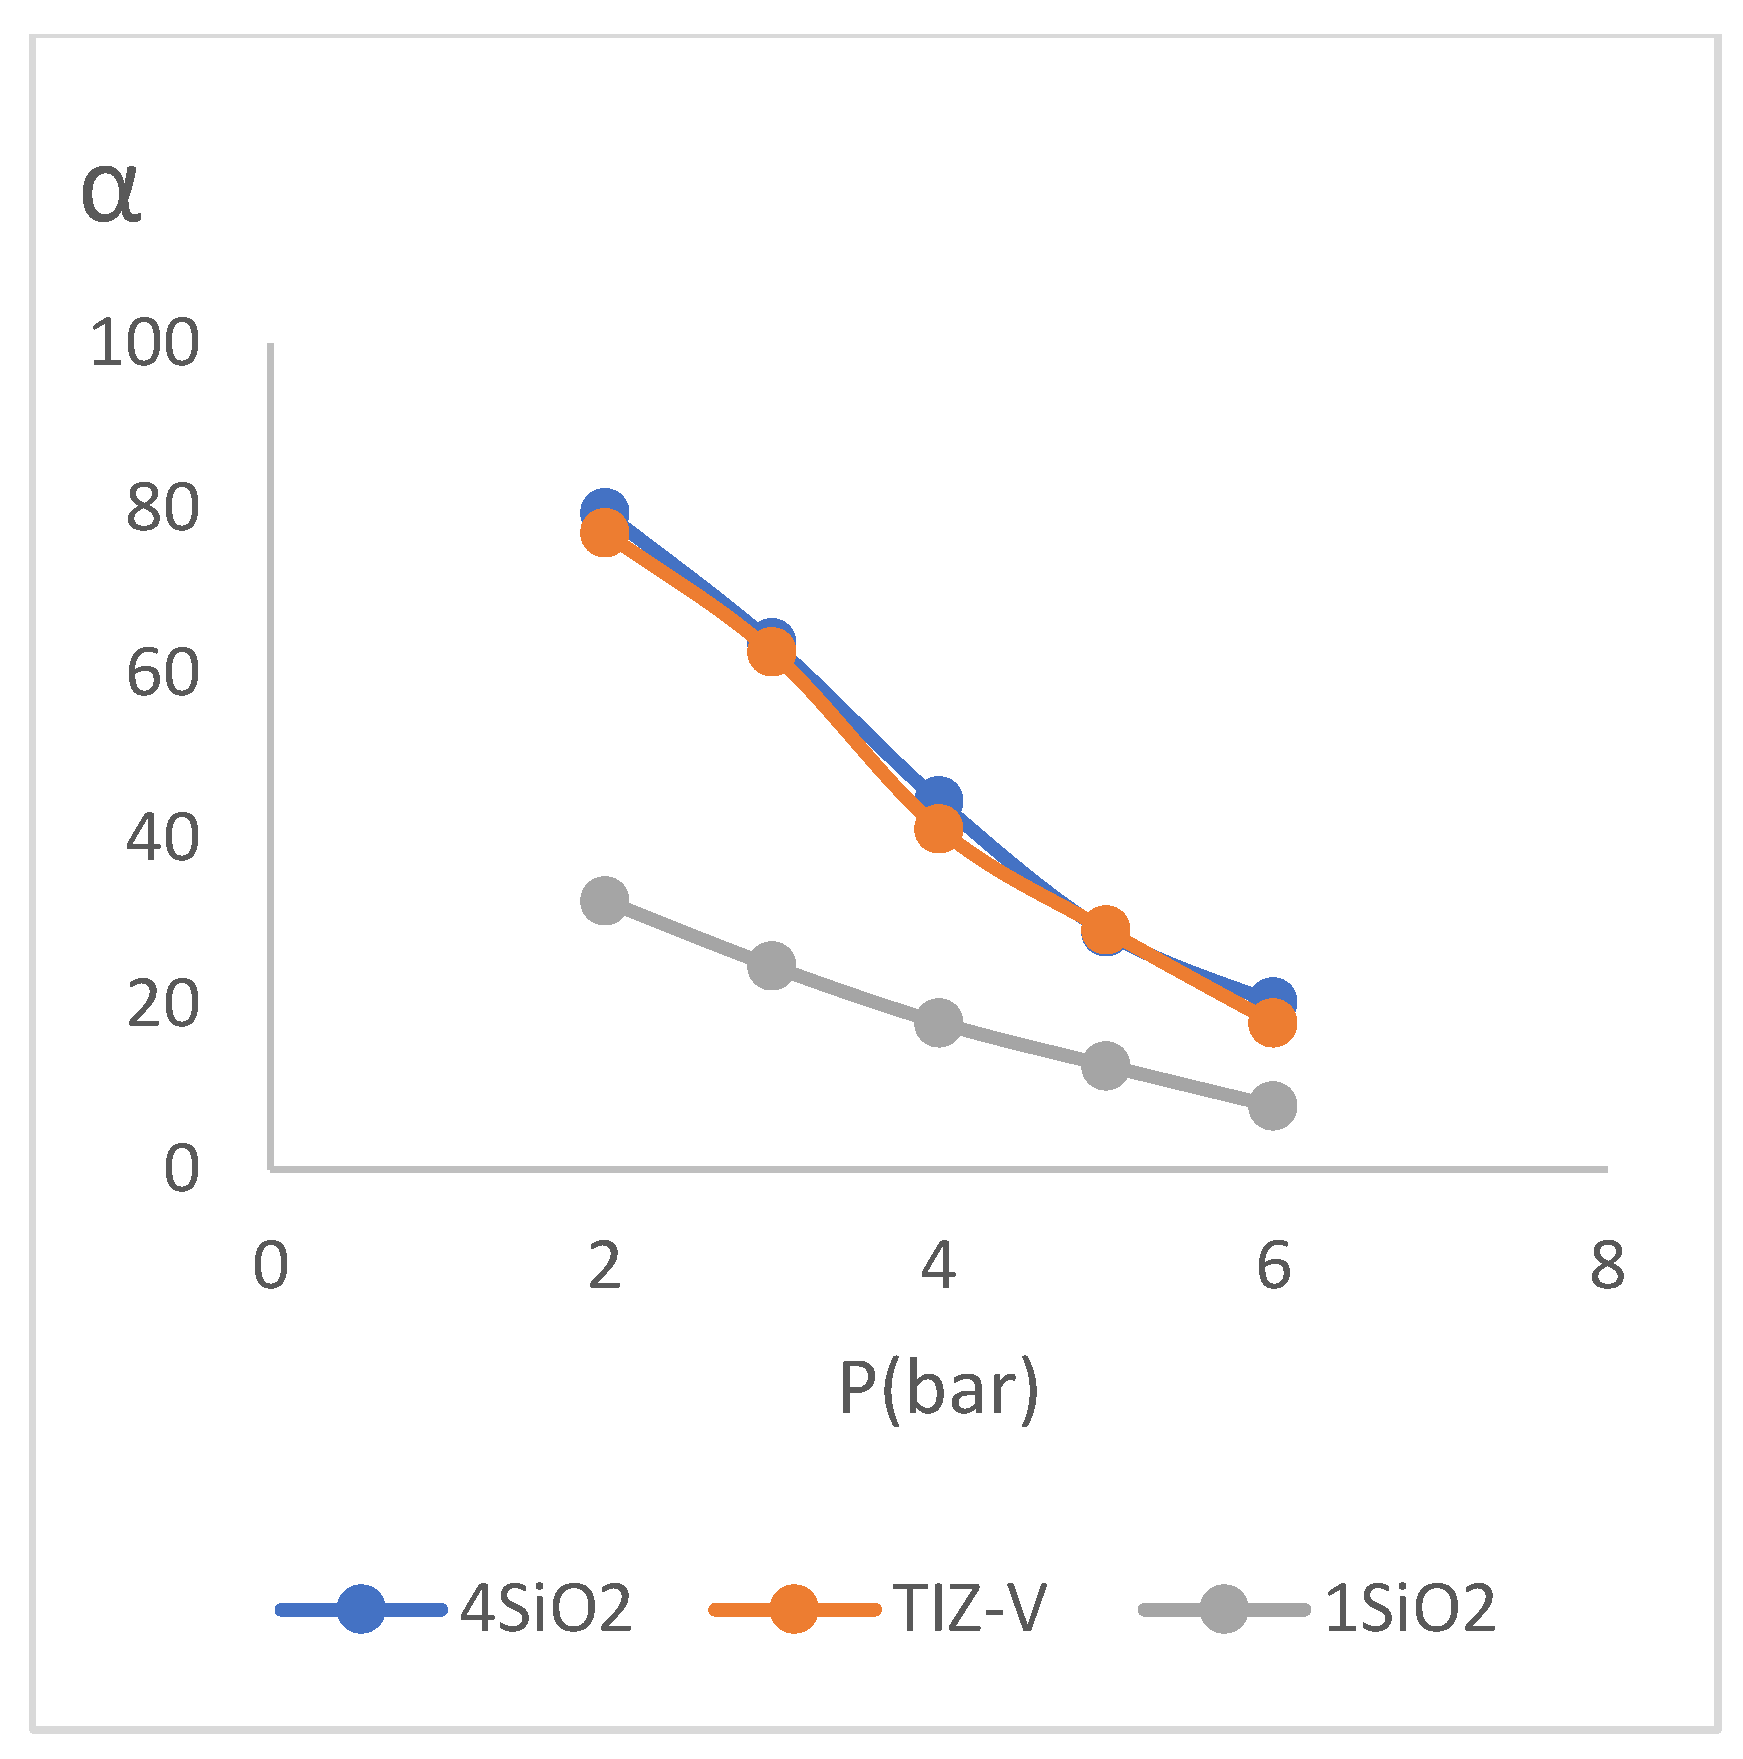
3.1. SiO2 Concentration
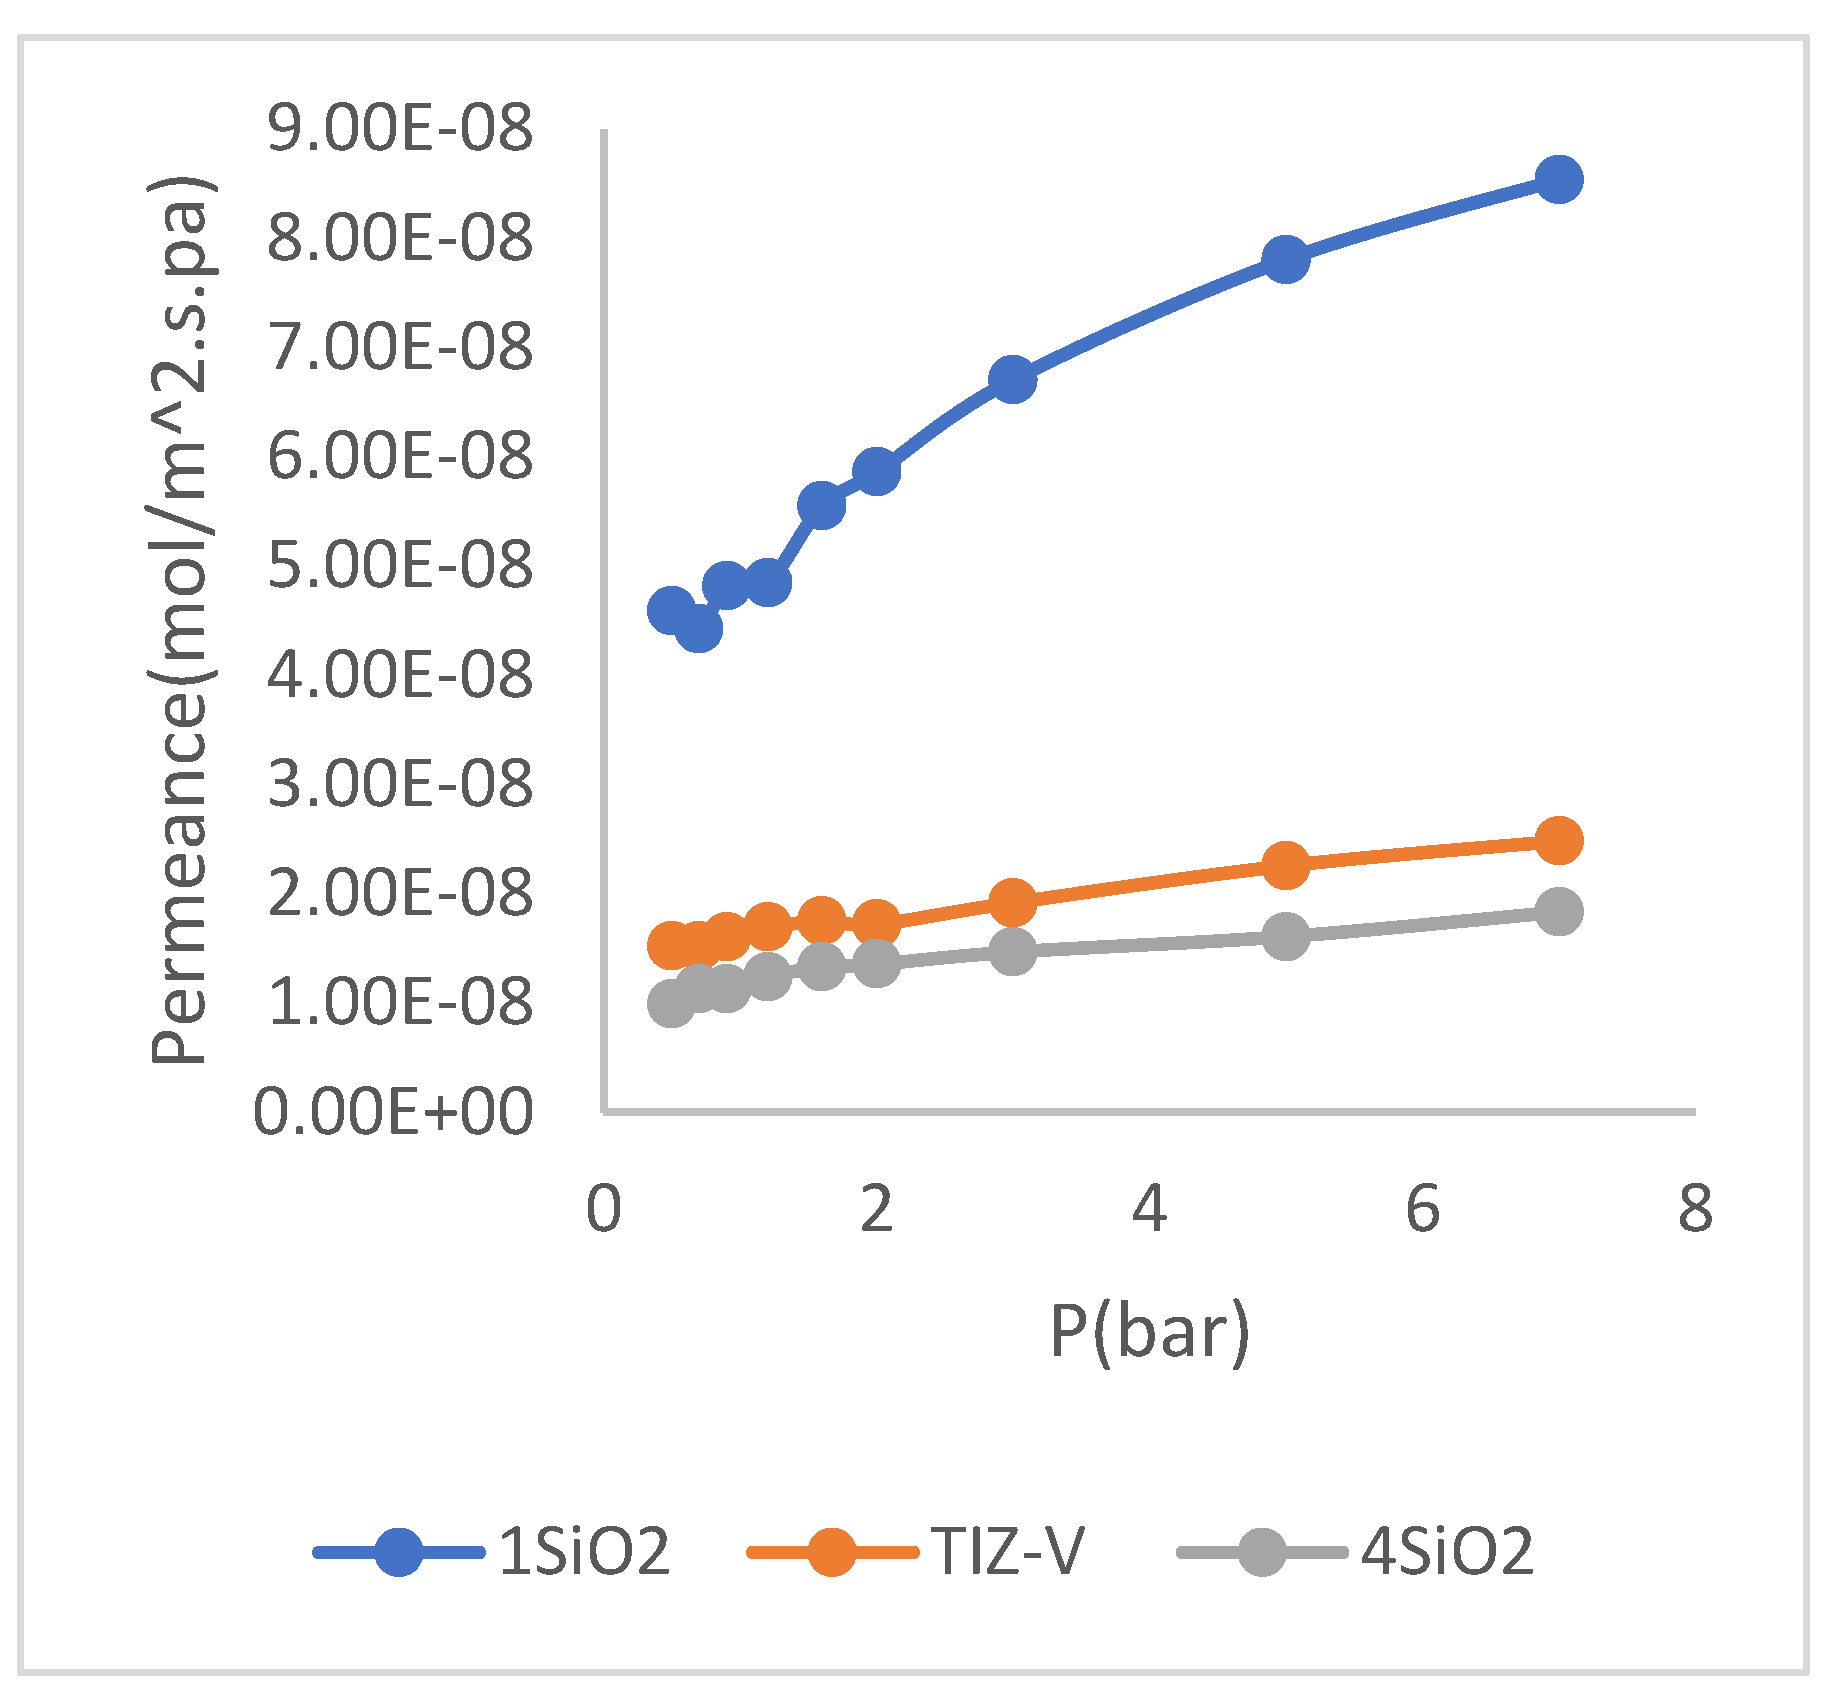
The effect of change the concentration of SiO
2 on the results of gas, water and performance tests is shown in (
Figure 4,
Figure 5) and (
Figure 6) respectively.
3.1.1. The Effect of Decrease in the SiO2 Concentration
According to the comparison between the concentrations of 𝑆𝑖𝑂2 in (
Figure 6), respect to TiZ-V membrane, it is concluded that the decrease in the concentration of 𝑆𝑖𝑂2 increased the gas permeability. An increase in gas permeability is considered as an unfavorable state because membrane must have minimum gas permeability and maximum water permeability. The cause of this phenomenon is due to the decrease in the concentration of 𝑆𝑖𝑂2 and as a result, the failure to complete the cross-linking process on the surface of membrane, which causes the cross-linking layer of membrane, especially at higher pressures (according to (
Figure 4)) loses the possibility of resistance to prevent penetration of nitrogen molecules and then, the permeability of nitrogen gas increases.
Perusing the diagram in (
Figure 5), regarding membrane 1SiO
2, shows that the decrease in water permeability of membrane have been with the decrease in the concentration of SiO
2. This is also considered as an unfavorable state. The decrease in the concentration of the silicate phase in the aqueous solution of SiO
2 has caused a decrease in the hydrophilicity of membrane and consequently, a decrease in the water permeability of membrane. Membrane performance test results of 1SiO
2 is presented in (
Table 1).
According to (
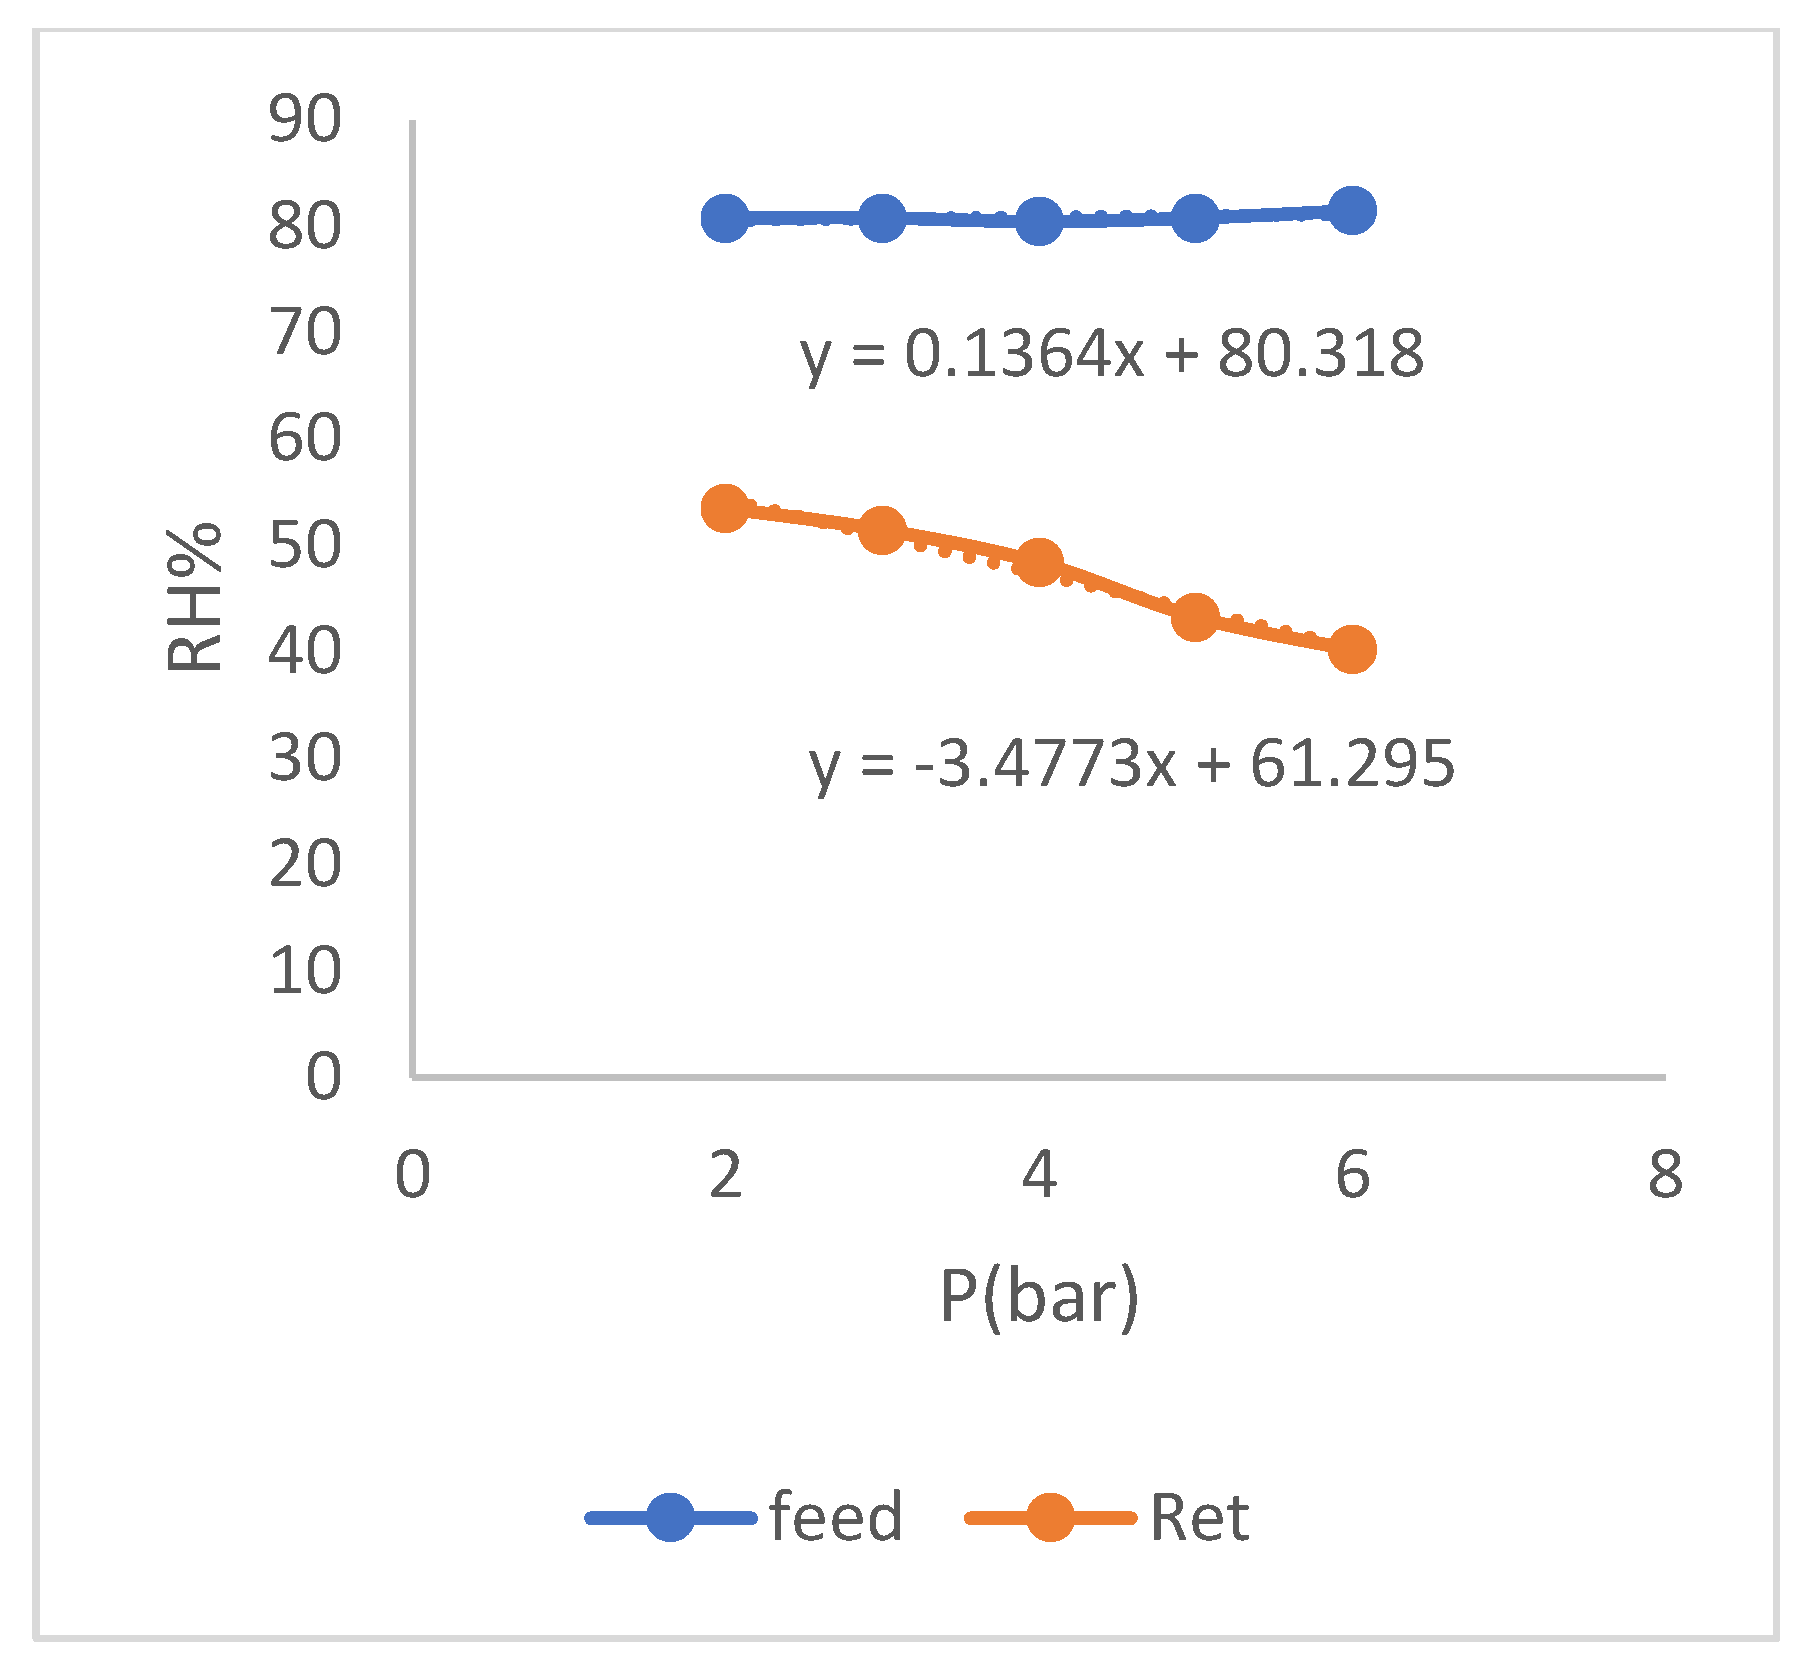
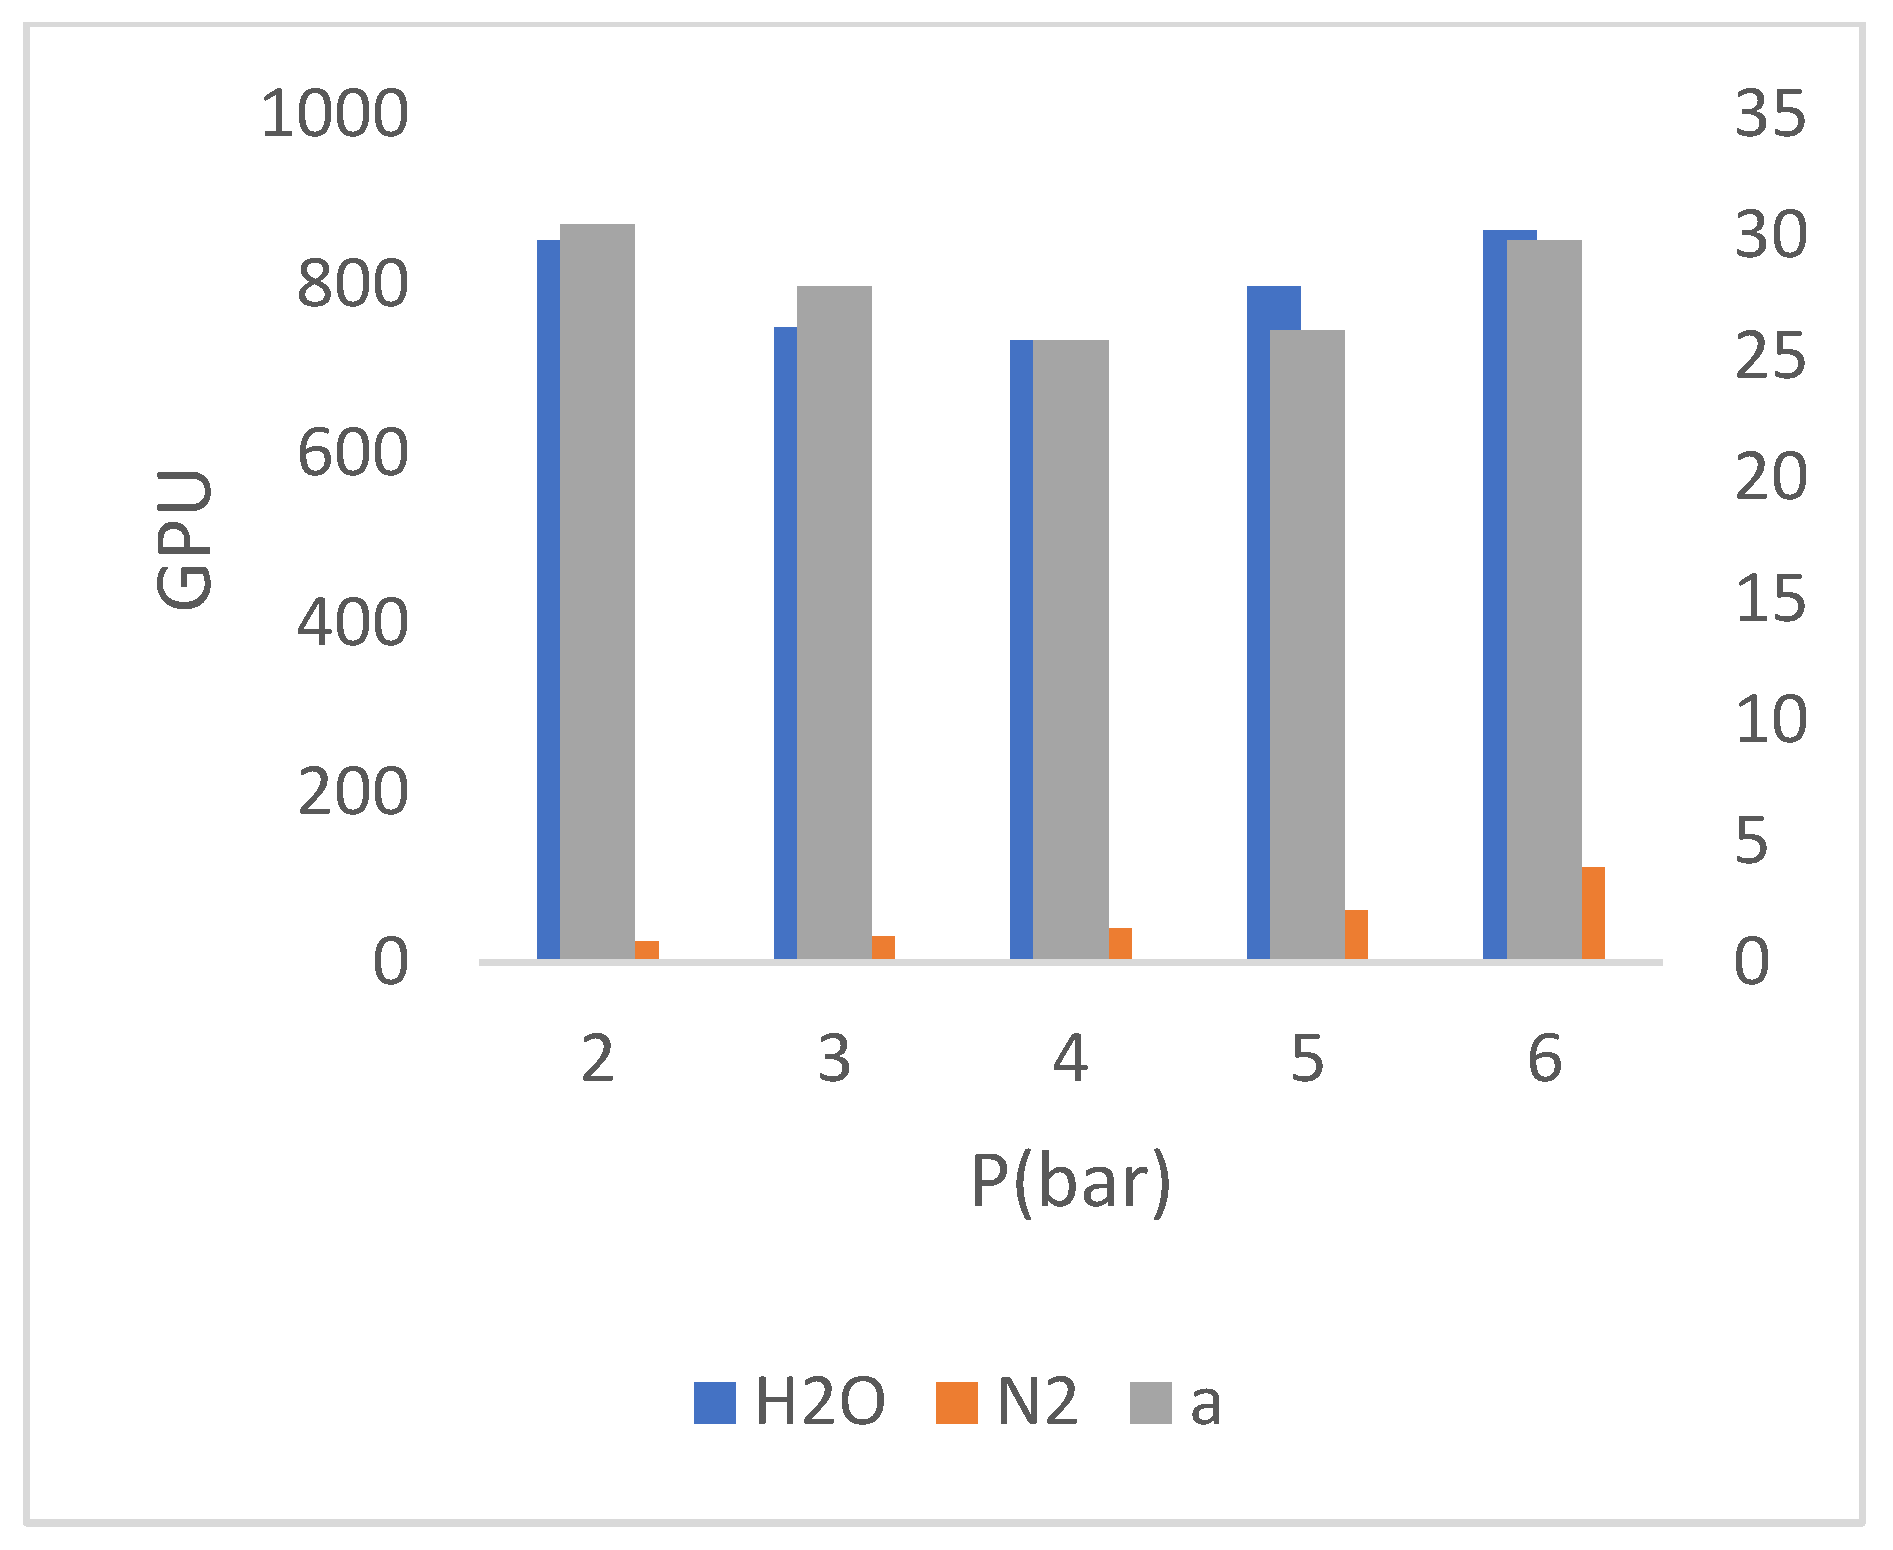
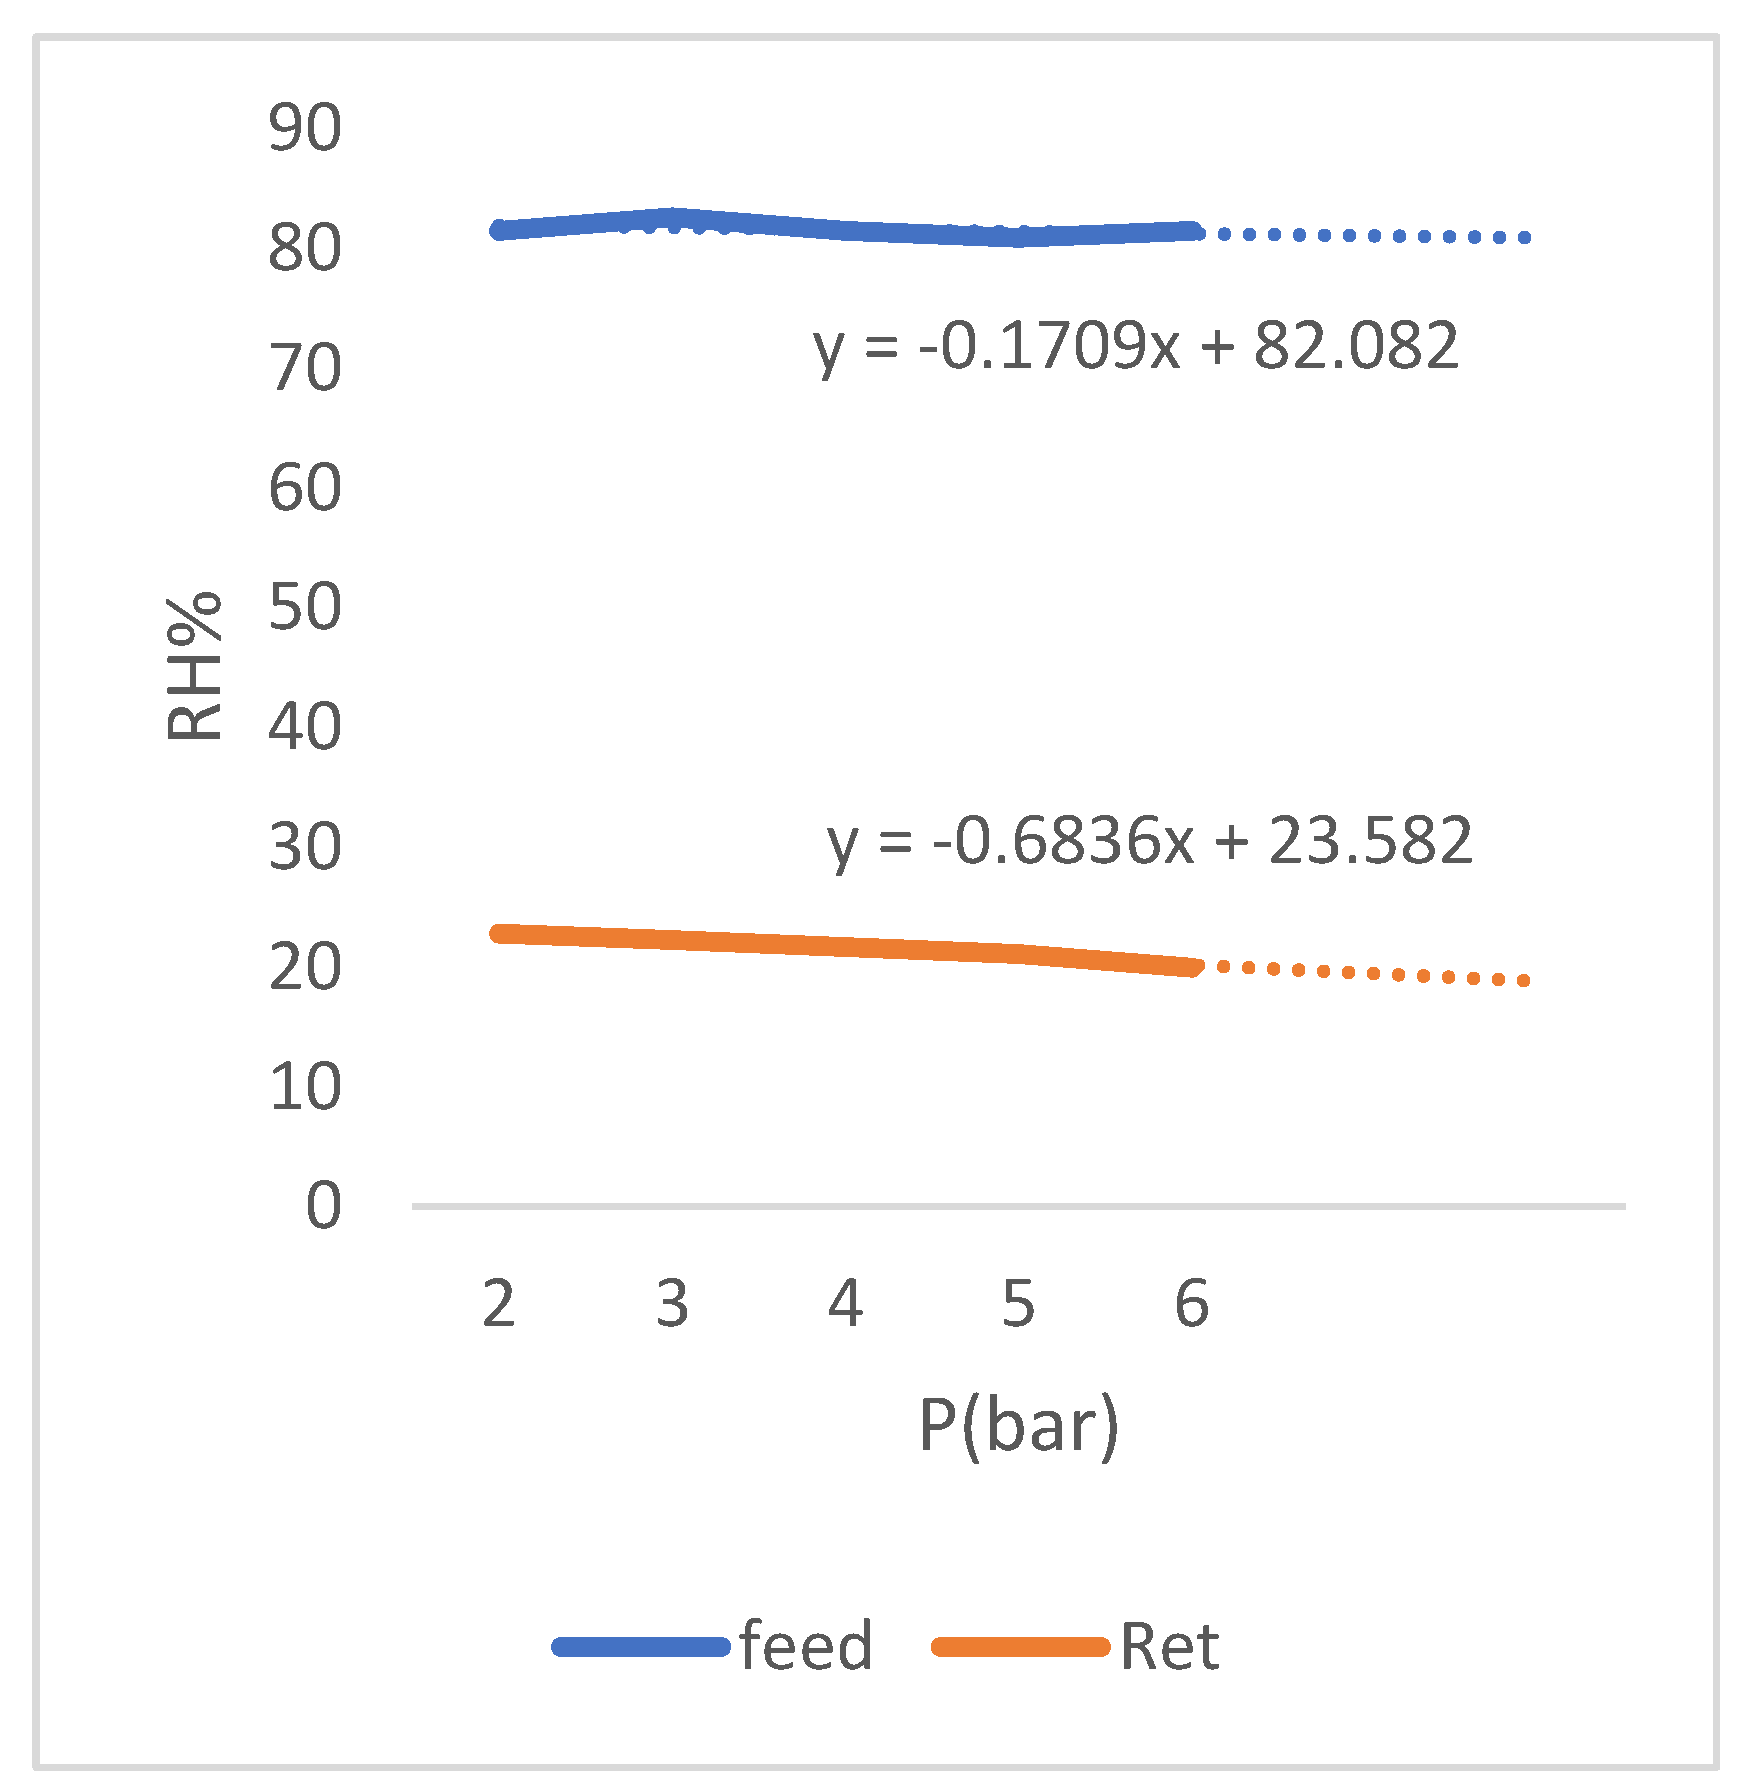
Table 1), regarding the state of penetrant, it indicates that water component is lower compared to gas even in the lowest measured pressure. This state means an increase in gas permeability from the penetrant side, which means an increase in gas loss from the penetrant side in the form of wet gas which, corresponds to the result of gas test of this membrane. Also, the lower water content in the penetrant corresponds to the result of water test of this membrane, i.e., the decrease in water permeability. These two unfavorable states have caused a general decrease in the selectivity of the mixed gas of membrane. Relative humidity change diagram of membrane 1𝑆𝑖𝑂2 is also presented in (
Figure 7). Finally, (
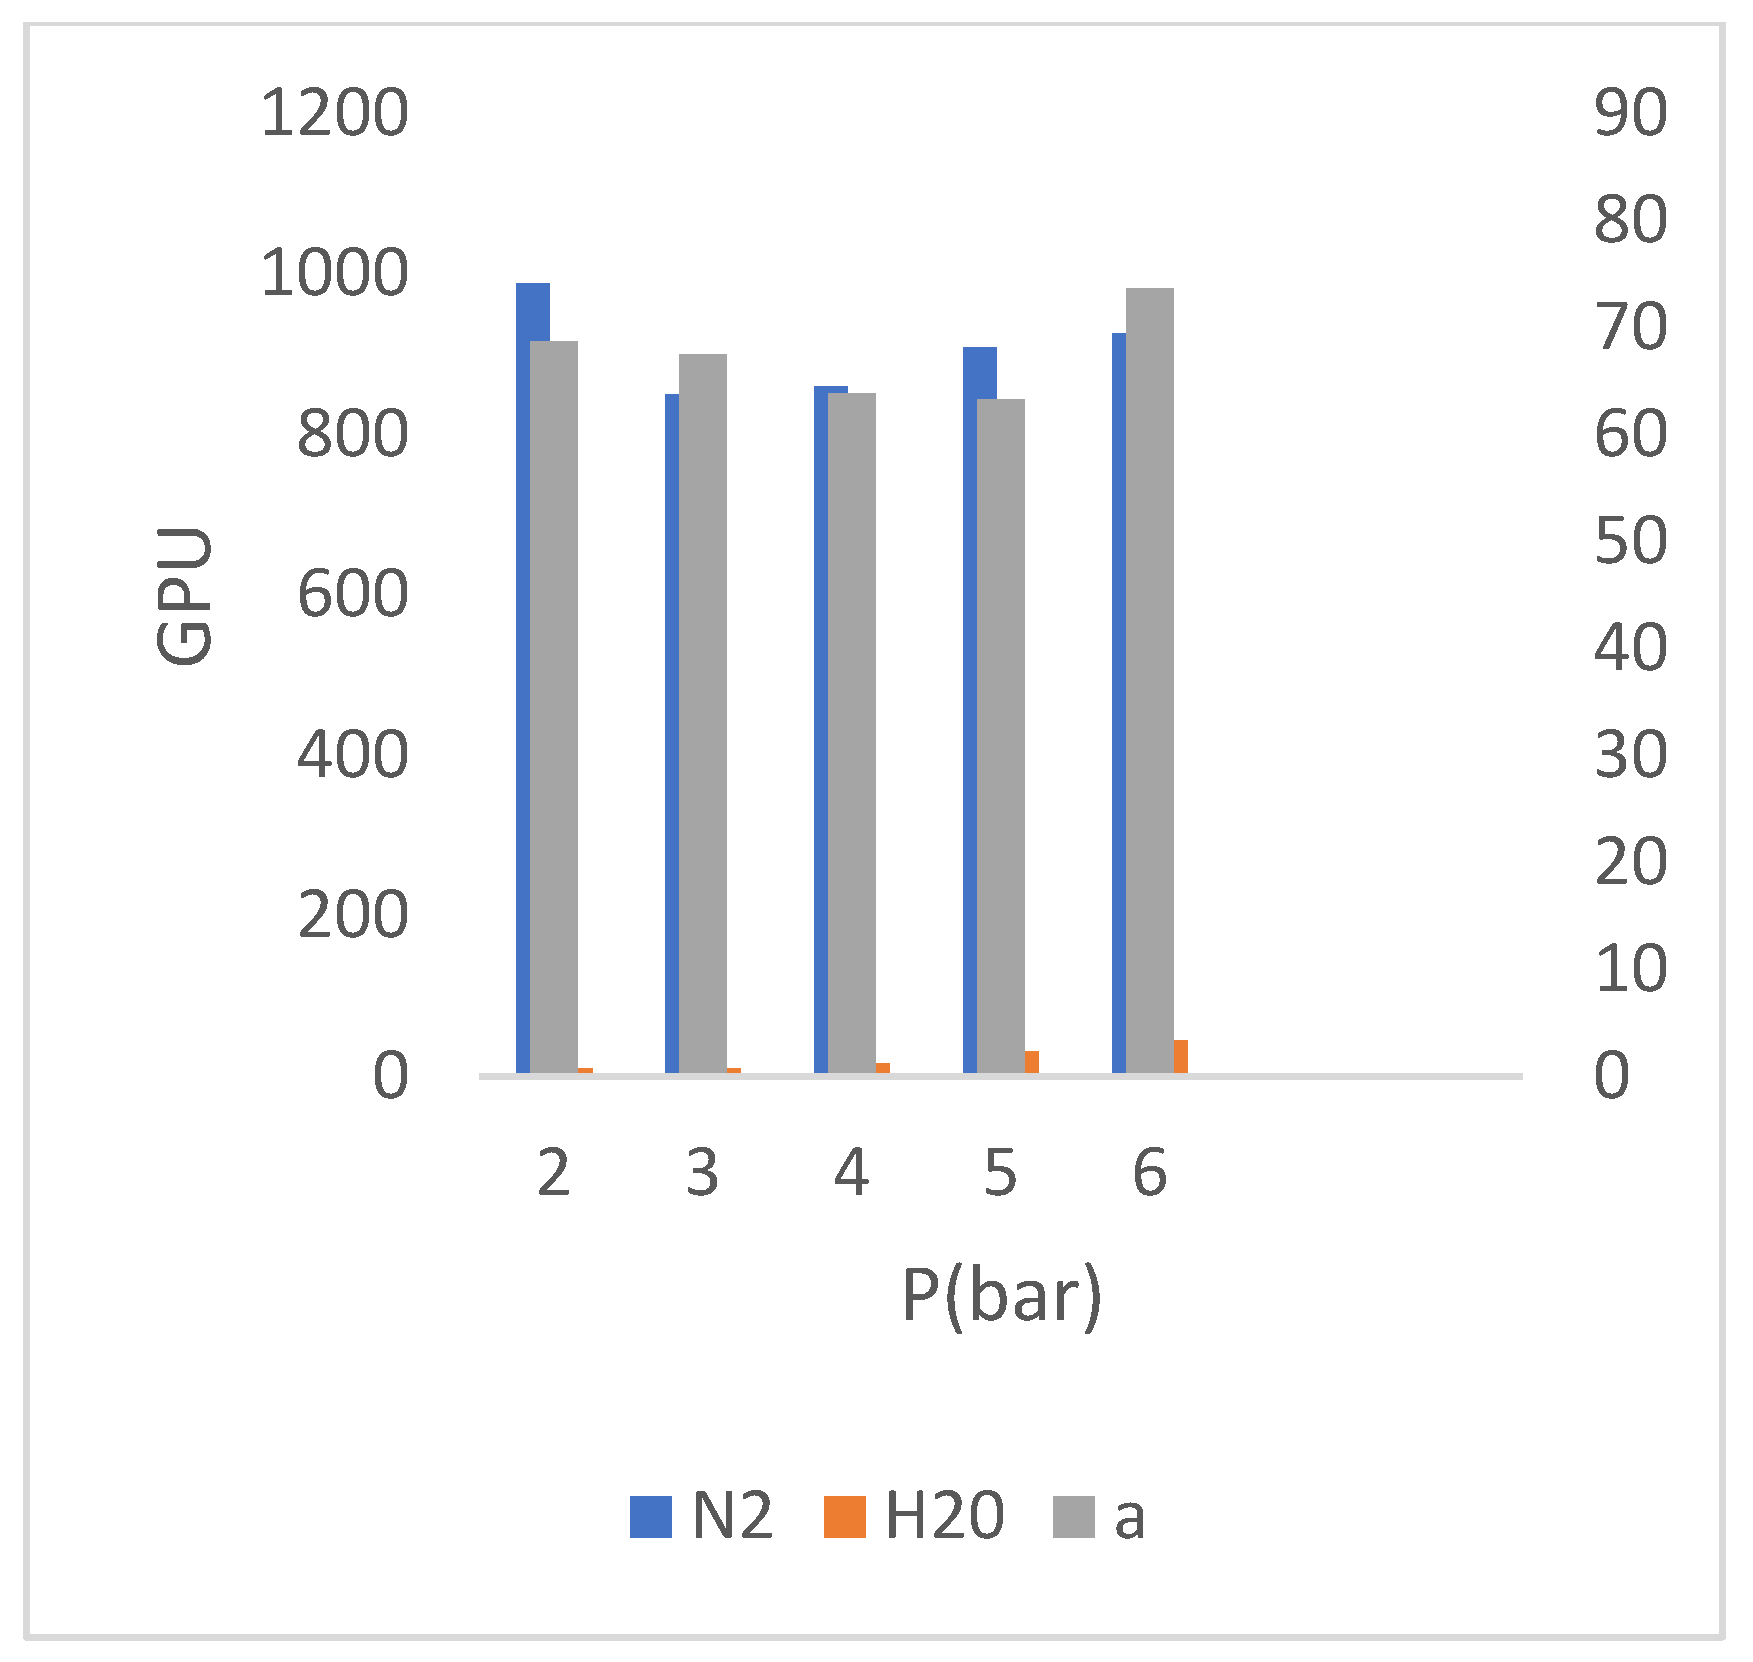
Figure 8) presents the gas and water permeability of the 1𝑆𝑖𝑂2 membrane at different pressures and their corresponding selectivity.
3.1.2. The Effect of Increase of the SiO2concentration (4SiO2 Membrane)
According to the comparison between the concentrations of 𝑆𝑖𝑂2 in (
Figure 6), relative to TiZ-V membrane, it is concluded that the increase in the concentration of 𝑆𝑖𝑂2 has caused a slight decrease in gas permeability. The increase in SiO
2 provides the required values for the reaction with the existing value of 𝑃−𝑇𝑖𝑆, but its higher values will not cause more crosslinking of the network due to the no reaction with 𝑃−𝑇𝑖𝑆, therefore, as the results show, the major no change in permeability values of the 4SiO
2 membrane was due to the major no change in the crosslinking of the selective layer compared to TiZ-V membrane.
Perusing the diagram in (
Figure 5), regarding to the 4𝑆𝑖𝑂2 membrane, shows the increase in membrane water permeability with increasing (increase in) 𝑆𝑖𝑂2 concentration. Increasing (Increase in) the concentration of the silicate phase in the 𝑆𝑖𝑂2 mixture has increased the hydrophilicity of membrane and (as a result) then increased the permeability of water through membrane. The test results of 4𝑆𝑖𝑂2 membrane performance (performance) are presented in (
Table 2).
Examining (Perusing) (
Table 2), regarding to the state of penetrant, it shows that water component is higher than the gas from low pressures up to 4 bar pressure, which compared to the 1𝑆𝑖𝑂2 membrane, it is concluded that the increase in the concentration of 𝑆𝑖𝑂2 has improved the state of permeability by increasing the its water content. According to the results of relative humidity change diagram of the 4𝑆𝑖𝑂2 membrane presented in (
Figure 9), the same improvement is clear compared to membrane 1𝑆𝑖𝑂2. But according to the diagram in (
Figure 6) regarding to the comparison of performance with standard TiZ-V membrane, a slight improvement has been achieved in selectivity which is similar to relative humidity change graph data in (
Figure 9). This means that increasing the concentration of 𝑆𝑖𝑂2 increases the water permeability in water test. Finally, (
Figure 10) presents the gas and water permeability of the 4𝑆𝑖𝑂2 membrane at different pressures and their corresponding selectivity.
3.2. The Effect of Operating Conditions
After measuring the effect of different parameters in membrane construction, in this section, this membrane is measured under changes in some operating conditions. For this purpose, the 0.4 TiZ-V membrane has been subjected to the measurement of relative humidity change of feed, the change of the flow rate of dry gas, the effect of the sweeper gas and the test of increasing the operation time.
3.2.1. Change Relative Humidity of Feed
In this experiment, by change the element temperature in the steam generator, it changes relative humidity of the inlet wet gas to the module. The results of performance tests in relative humidity values of about 50%, 65% and 80% are presented in (
Table 3). It should be noted that relative humidity data were 100% in this experiment as well as all experiments in the present study which indicates the high humidity of the penetrant flow in TiZ-V membranes and it has been due to the high absorption of water from the humid gas.
According to (
Table 3), it can be seen that at any given relative humidity of feed, selectivity has decreased with increase of pressure which, is due to the decrease of water component relative to the gas with increase of pressure. It is also seen that decrease of relative humidity of feed from 80% to 50% increased the selectivity value. This is due to the fact that the incoming gas is drier which means less moisture content with the gas.
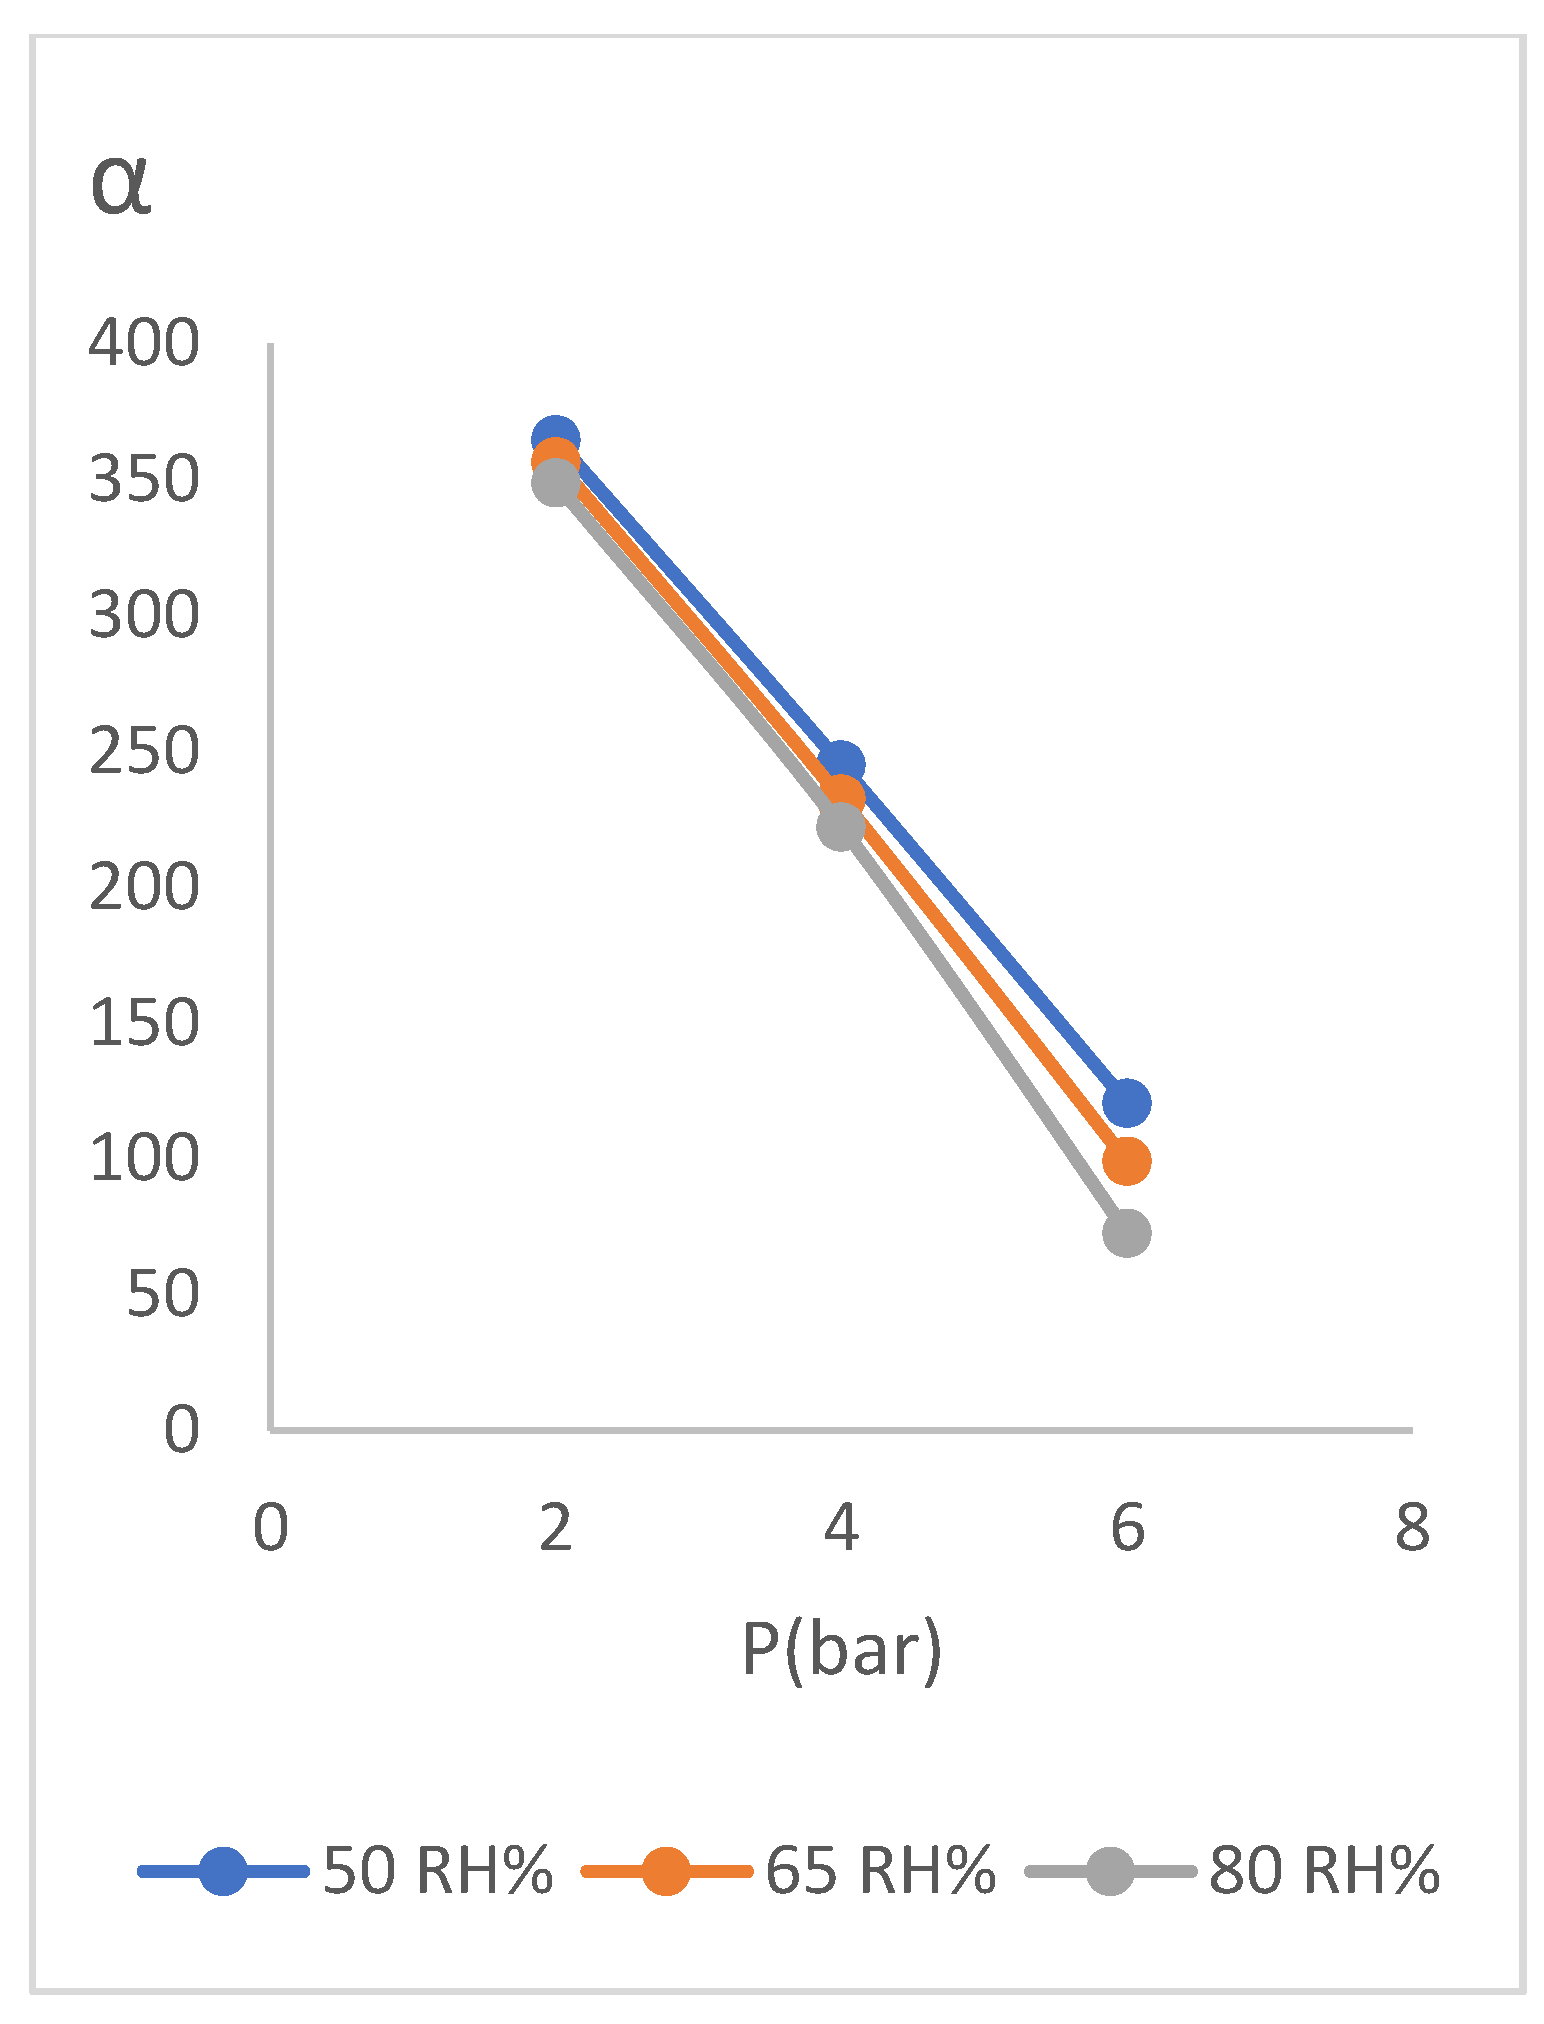
As it can be seen in the graph (
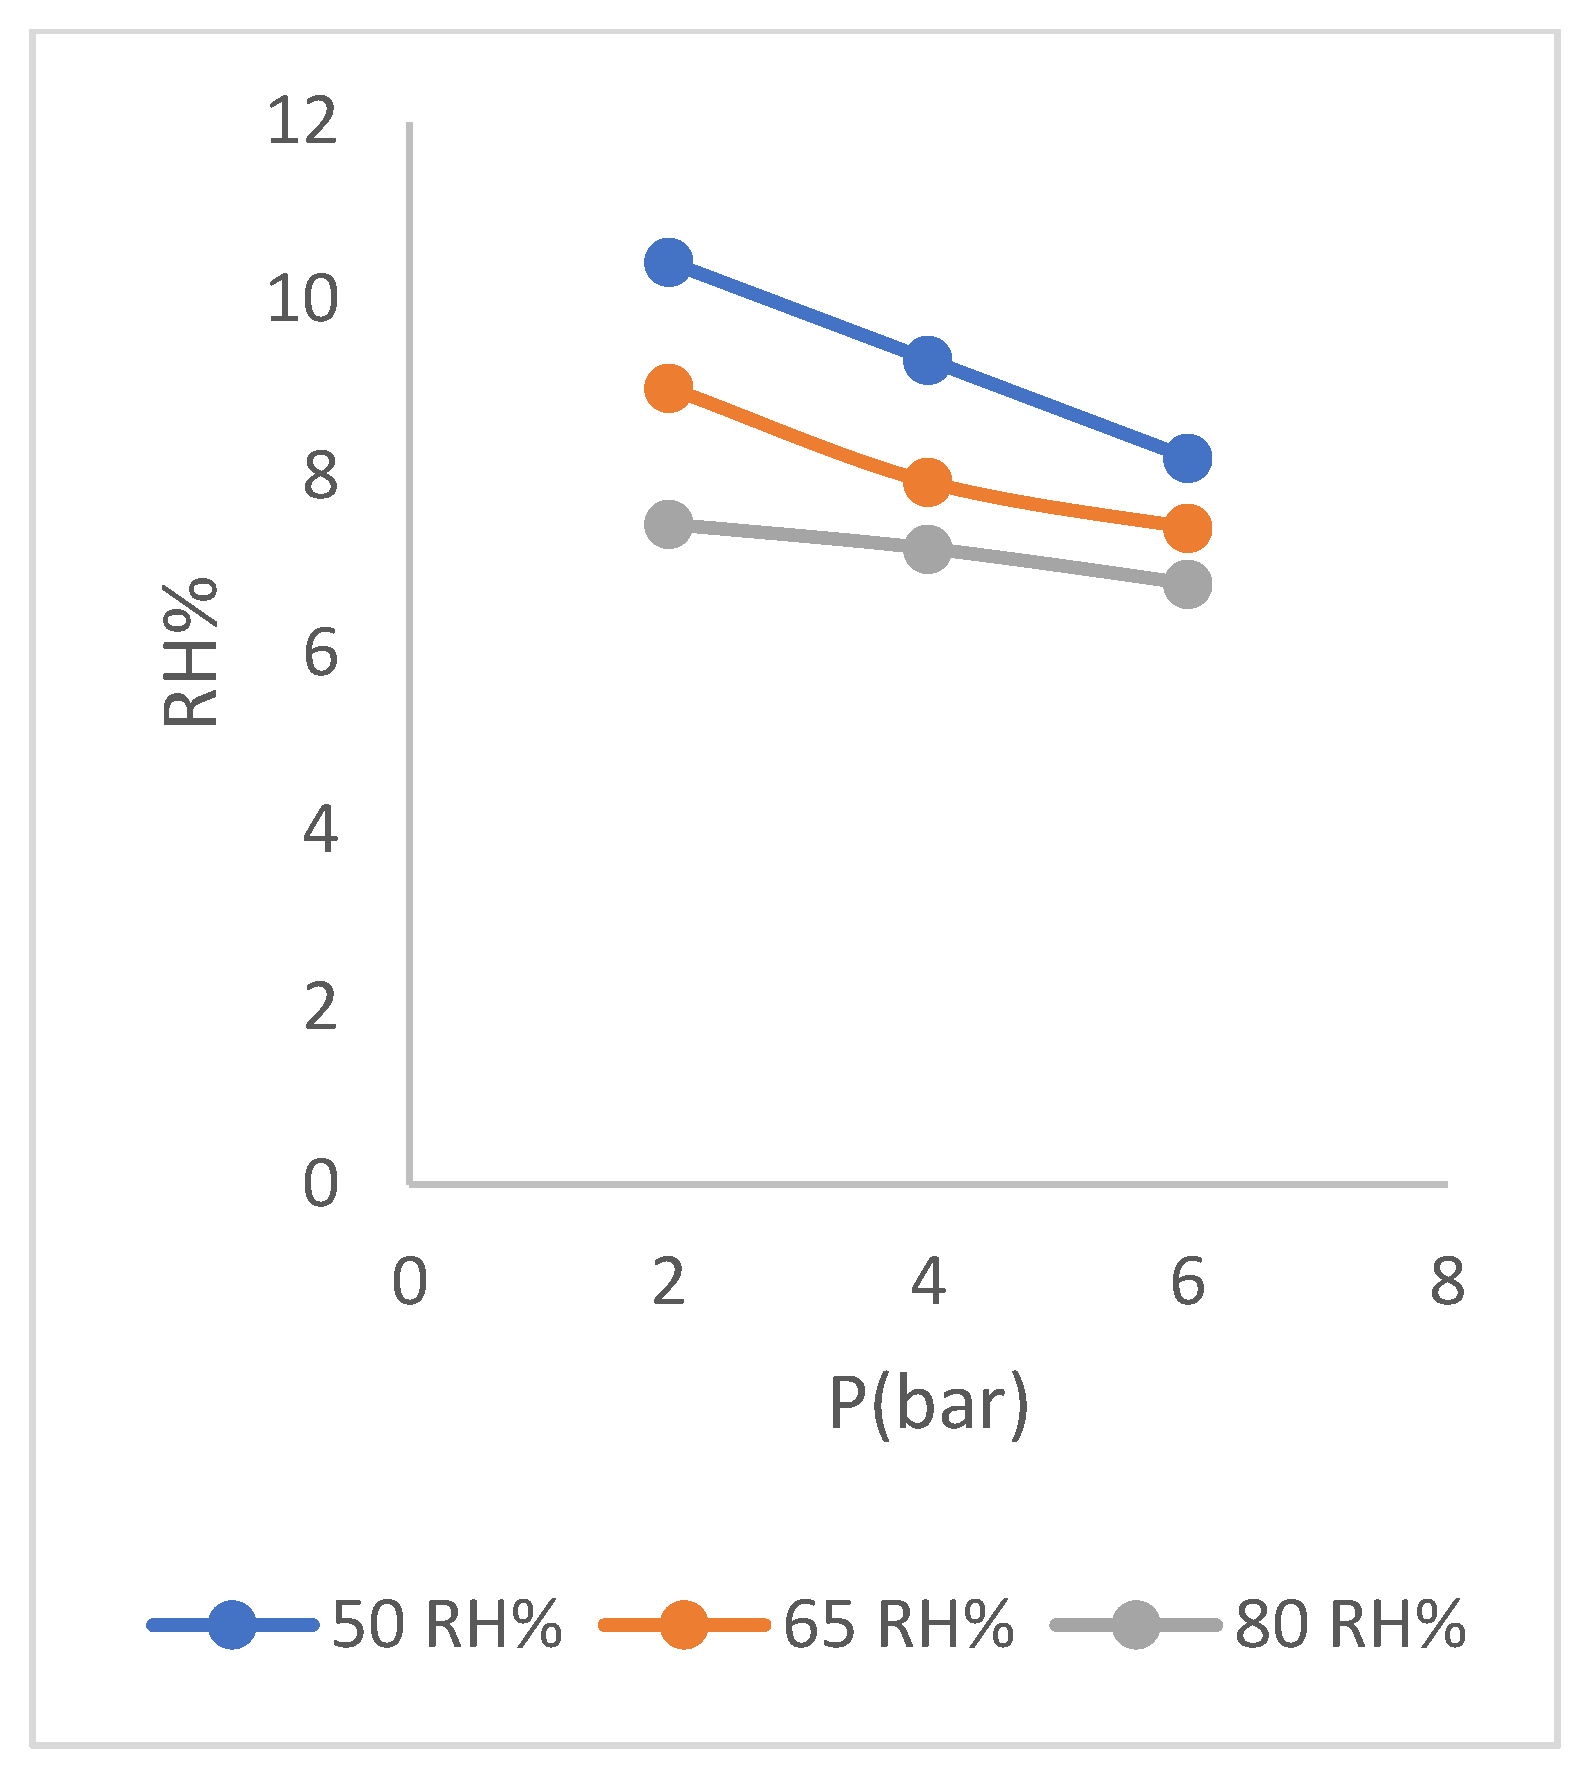
Figure 11), the selectivity of membrane has increased with decrease in relative humidity of feed and the remarkable case is small change of the selectivity values with the change of relative humidity of feed. This matter shows the stability of membrane function under the operating conditions of change relative humidity, so that with a decrease in relative humidity, we see an increase in selectivity of membrane and with an increase in relative humidity, decrease in selectivity is slight. This matter can also be seen in the diagram of (
Figure 12) which shows the change in relative humidity of the residue.
3.3. Change the Gas Flow Rate
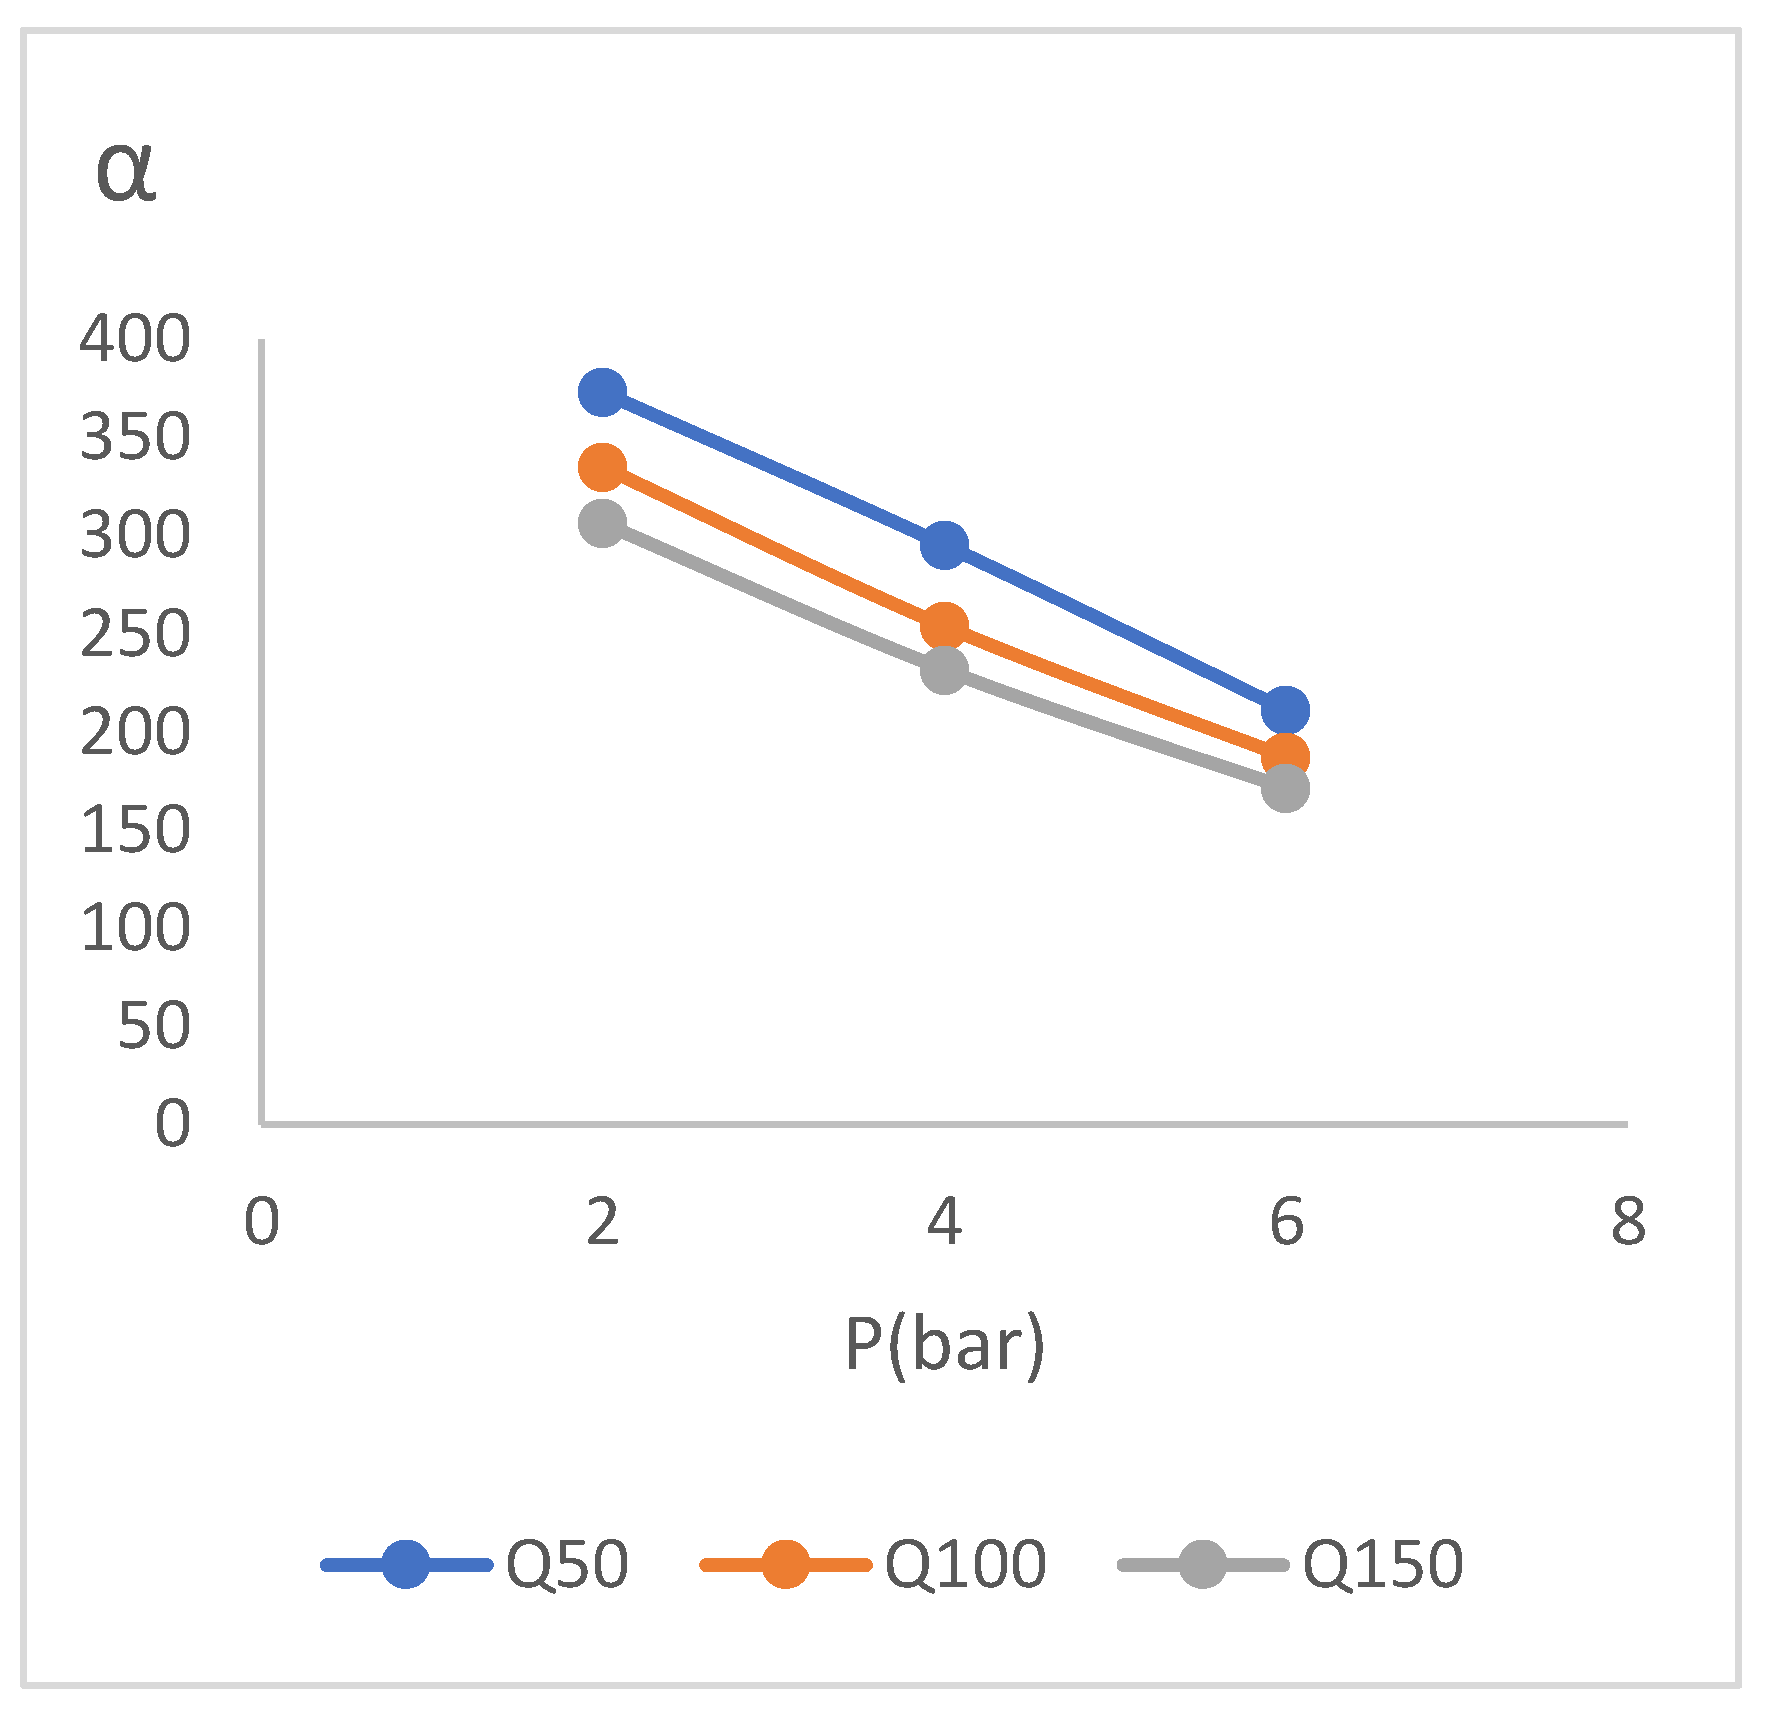
In this section, by adjusting the flow meter placed on the residue side, we set and check the total flow rate of the gas flow in different values. It should be noted that the gas flow rate was 50 [𝐿/ℎ𝑟.] in other tests except for this test which is related to the change of gas flow rate. In addition to the flow rate of 50[𝐿/ℎ𝑟], values of 100 and 150 have also been investigated. Performance test results for the gas flow rate change test are presented in (
Table 4).
Relative humidity of feed in this experiment is set at 65%.
The data in (
Table 4) shows the decrease in membrane selectivity with increasing gas flow rate. This matter which has been occurred due to the reduction of the molecules stopping time in the vicinity of membrane in order to separate the moisture from the gas, has been drawn in the diagram of (
Figure 13). (
Table 4) also shows maintaining the superiority of the difference between water component and the gas in all the pressures and all the investigated flow rates, which is a completely favorable state. Another result obtained from the gas flow rate change test is the possibility of membrane performance with a selectivity of 170 to 304 at investigated high flow rate.
3.4. The Effect of Sweeper Gas Test
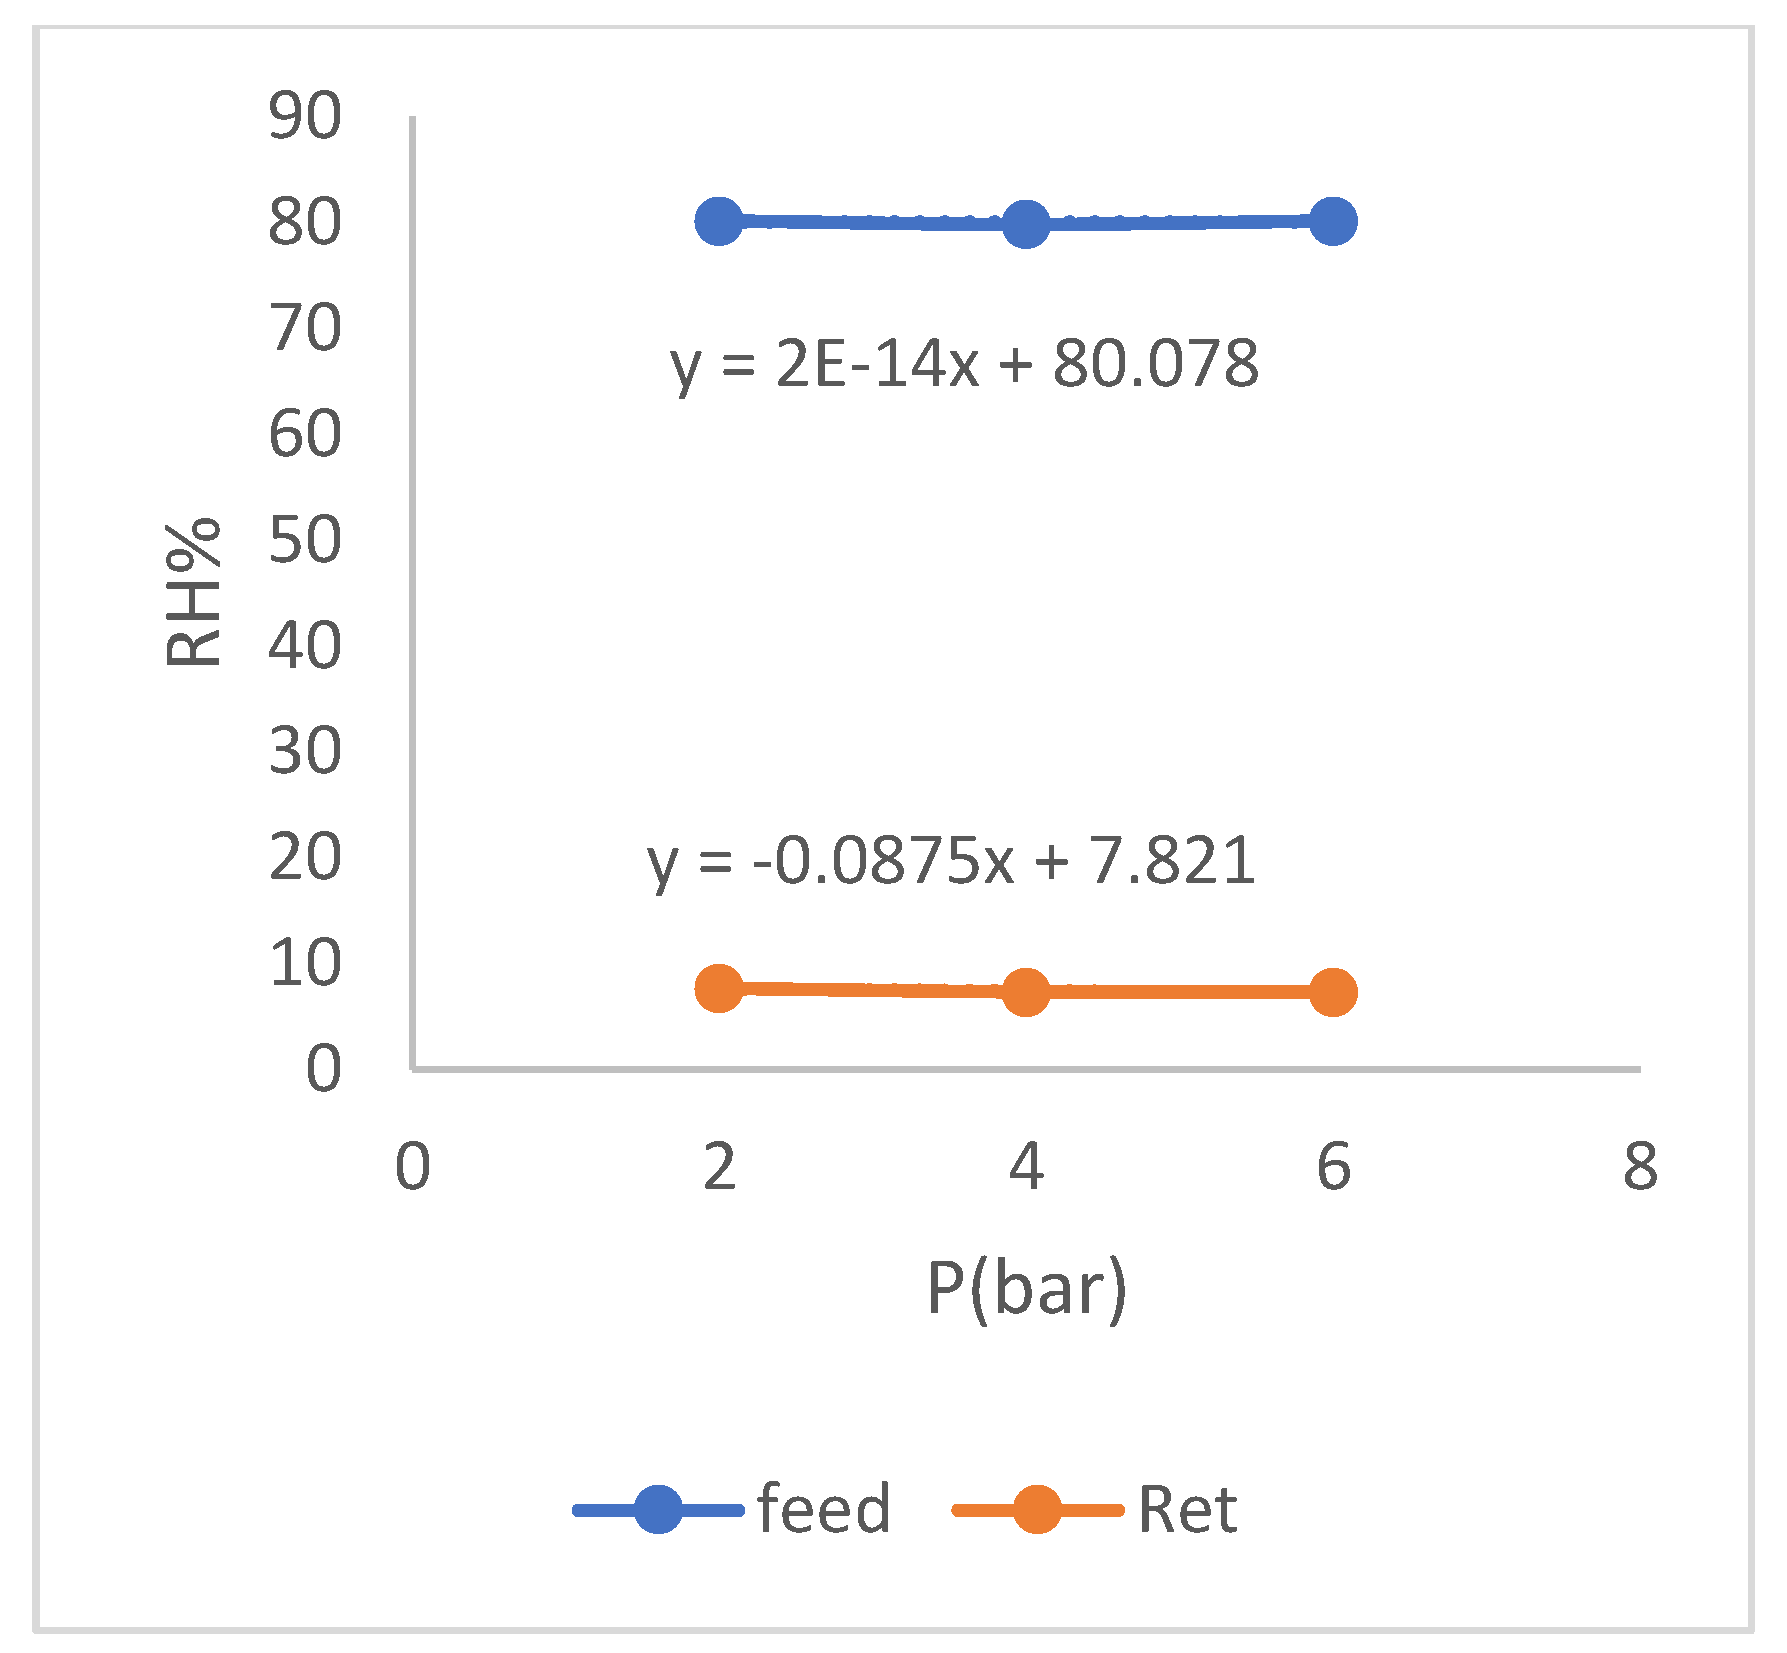
In this section, the effect of adding sweeper gas to the inner side of the hollow fibers is investigated on increasing the selectivity. For this purpose, dry nitrogen is inserted with pressure close to zero at different flow rates from the end side of the module that we blocked by placing the cap in the previous tests. Also, regarding the other operating conditions of this experiment, it should be mentioned that the flow rate and the humidity level of feed are set at 50 [𝐿/ℎ𝑟.] and 80% respectively. The results of the sweep gas effect test are presented in (
Table 5).
As can be seen in the above table, the entry and increase of sweeper gas has a significant effect on increase of membrane selectivity. This phenomenon is due to the role of the sweeper gas in reducing the gas concentration gradient on the outer and inner sides of membrane, so that due to the presence of gas inside the hollow fibers, the external gas has less possibility and tendency to penetrates into membrane. As can be seen in the table about, gas component in penetrant has decreased with the increase in the sweeper gas flow rate, which indicates to this matter. Another positive role of the sweeping gas is in moving the resulting moisture inside the fibers which causes an increase of the water gradient pressure inside and outside of membrane by faster movement and exit of the amount of water inside the fiber. And as a result, the water in the wet flow has a greater possibility and tendency to penetrate into membrane which is a very favorable role. The factor that limits the use of high amounts of sweep gas in industries is the economic debate about the cost of dry gas especially the use of the same type of under operation gas.
The diagram of changes in relative humidity of the residue relative to feed for this case is drawn in (
Figure 14) which shows the decrease of relative humidity of the wet gas from 80% to an average of about 7% during only one membrane phase.
3.5. Increase the Operation Time Test
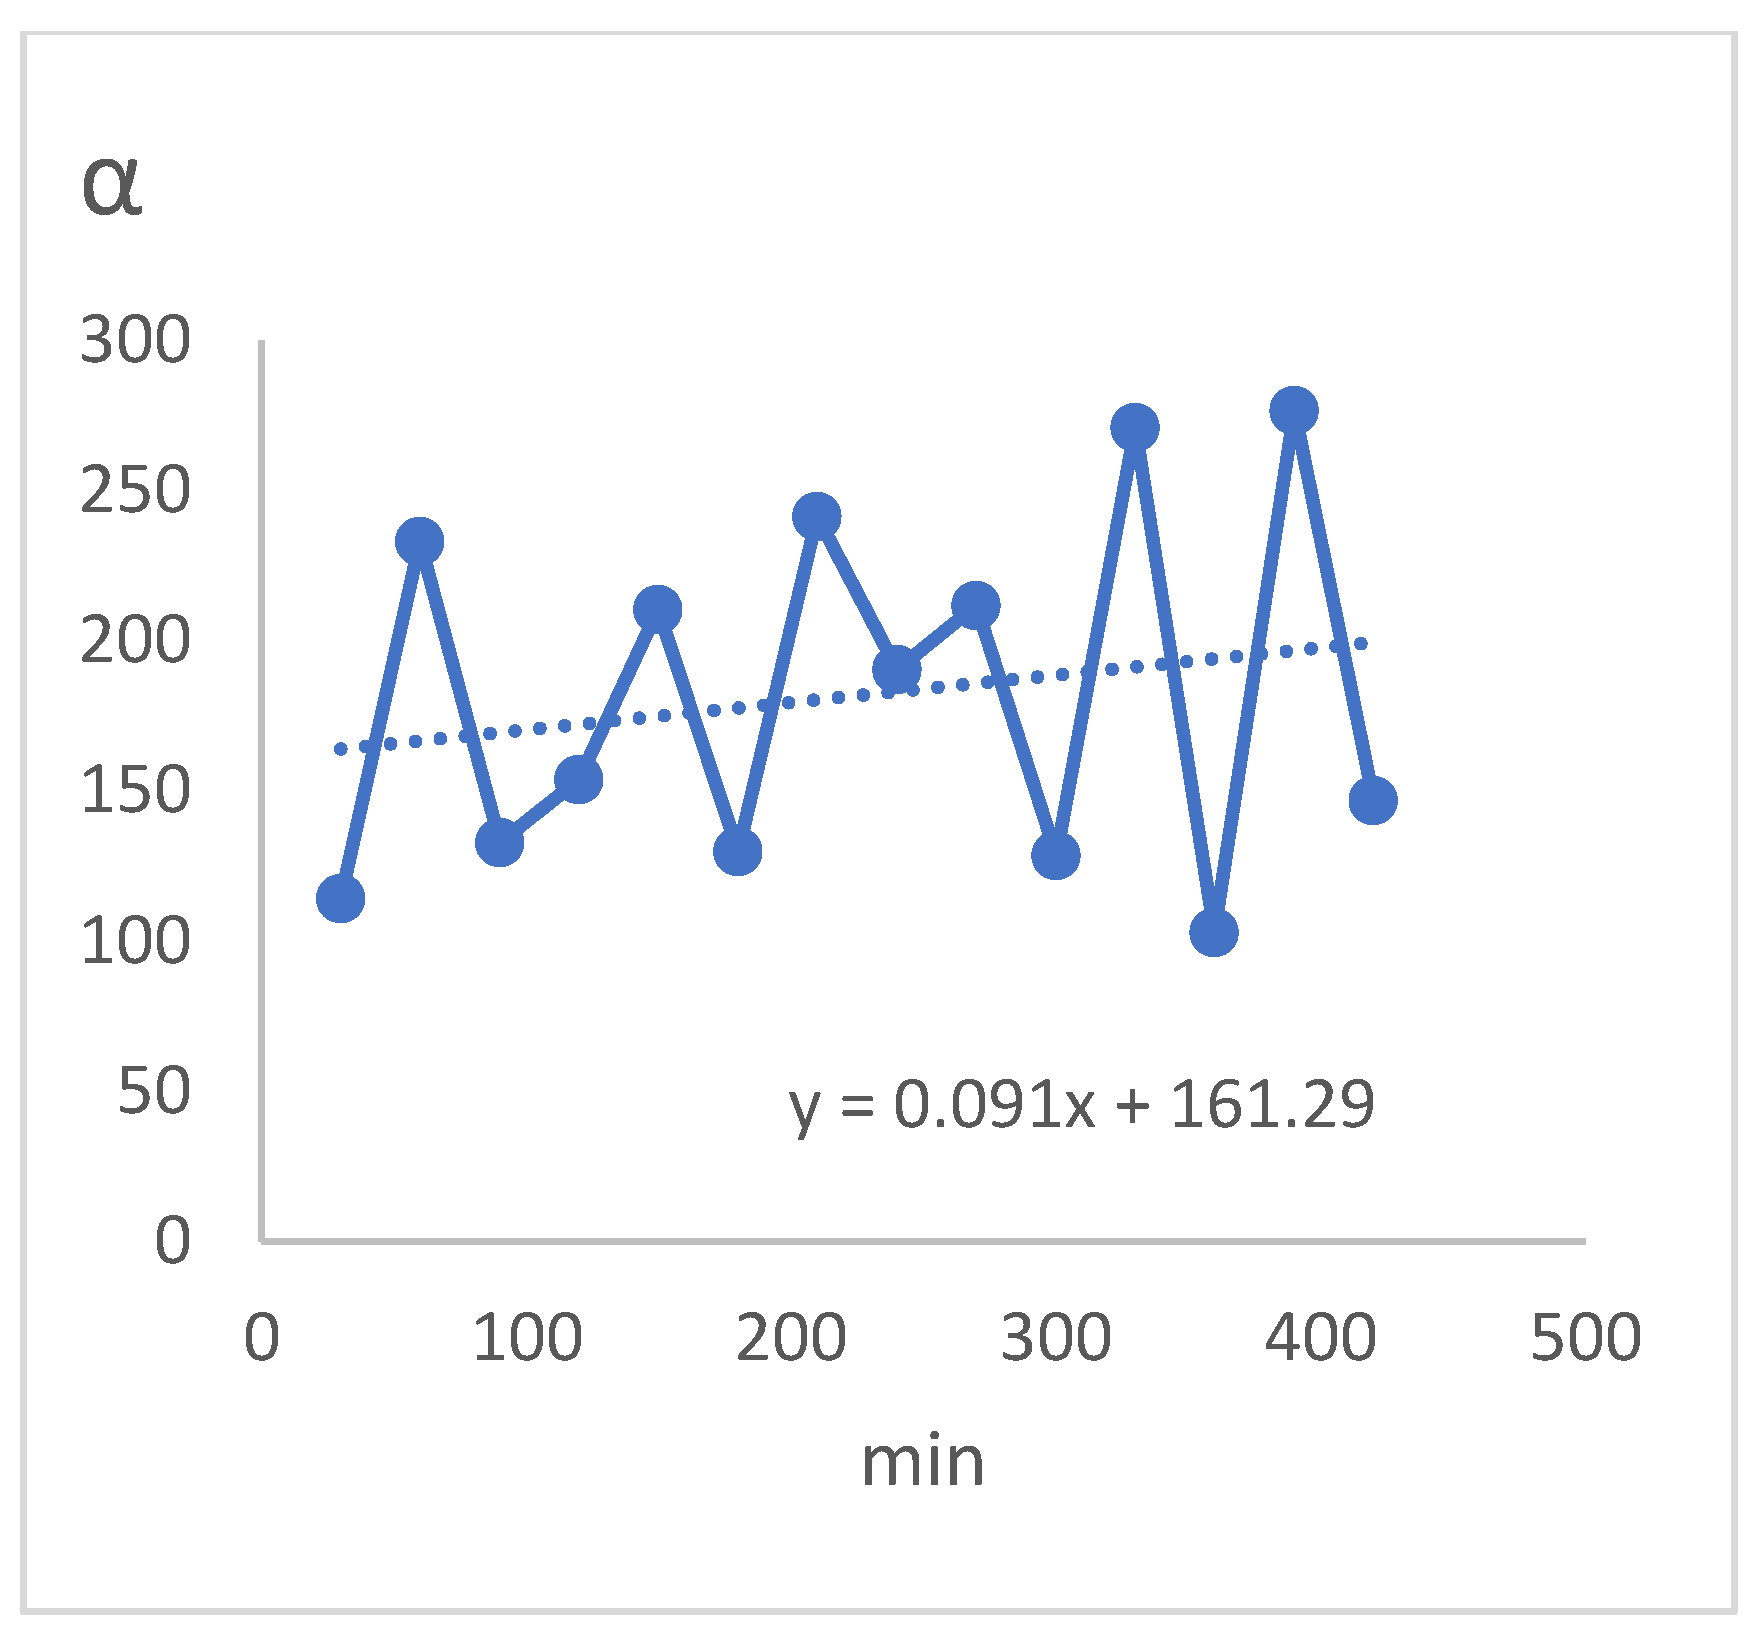
In this section, the changes in the performance of membrane selectivity are investigated during the increase in the duration of membrane operations in such a way that operational data has recorded every 30 min during 7 h of continuous operations to obtain the graph of selectivity changes during this period. The operational conditions include feed relative humidity equal to 80%, feed gas pressure equal to 4 bar, gas flow rate equal to 50 [𝐿/ℎ𝑟.] and without using sweeper gas.
The results of the increase the operations time test and its changes are presented in (
Table 6) and (
Figure 15) respectively. These results indicate the stability of membrane performance over time. As can be seen, this stability of the results is also seen in the removal of moisture from the gas which in all results, the gas moisture has decreased from about 80% to about 90% during only one membrane phase and also regarding the superiority of water component in the penetrant relative to the gas component, there is this stability which indicates the performance of membrane to operate at higher pressures. In addition, it can be seen that the rate of selectivity with an average of 288 in the investigated time period according to the above graph has also had a relatively increasing trend. In particular, as shown in the diagram of (
Figure 15), the changes in selectivity of membrane in all investigated times has been varied only between 287.5 and 289.5 which shows the stability of membrane performance with increasing time of operations.
4. Conclusions
The study was conducted on the possibility of using 𝑻𝒊𝑶𝟐 zeolite nanocomposite membranes in order to remove moisture from gas with the approach of natural gas and nitrogen and with the aim of influencing membrane manufacturing parameters.
Selection and construction of a specific TiZ-V membrane as a reference membrane were done which was the result of the initial estimation of a suitable membrane for gas dehumidification and this membrane was used as a criterion to measure the effect of manufacturing parameters, in such a way, in each step, a membrane was made that was different from the criterion TiZ-V membrane in terms of only one parameter. This type of investigation caused to determine the effect of different effective parameters in membrane manufacturing on performance.
The findings showed that increasing the concentration of 𝑆𝑖𝑂𝟐 has the greatest effect on increasing membrane water flux. According to the other findings of this study, the effect of increasing the reaction time of the vapor phase carrier on reducing the selectivity reduction (drop trend) was at higher pressures. Although this measurement was not done due to the safety limitation of the equipment to measure the performance of membrane at pressures higher than 7 bar, but some graphs were presented regarding the state of penetrant which were a measure of the superiority of water component in the penetrant relative to gas component and the higher water component in the penetrant, is an indicator of the appropriateness of membrane’s performance at its corresponding pressure, in such a way that the investigation of the difference trend of this two diagrams shows the possibility of using membrane at higher pressures.
Next, in order to increase the performance of membrane as much as possible, the sweeper gas was added from the inside of membrane. Increase in the sweeper gas, which increases the water concentration gradient and decreases the gas concentration gradient on the sides of membrane wall, increases the selectivity of membrane to the best level of 543. Finally, in order to investigate the stability of membrane in longer operation times, the test of increase the operation times was carried out and no change in relative humidity reduction data and insignificant changes in its selectivity indicate the stability of membrane performance with the increase in the dehumidification operation time.
Acknowledgments
This research was done with the cooperation of the Southern Oil Regions Company. We are grateful to Dr. Seyyed Jalil Pour mohamadian as an industrial consultant for this research.
References
- Zito, P.F.; Brunetti, A.; Caravella, A.; Drioli, E.; Barbieri, G. Water vapor permeation and its influence on gases through a zeolite-4A membrane. Journal of Membrane Science. 2019, 574, 154–63. [Google Scholar] [CrossRef]
- Liang, C.Z.; Chung, T.-S. Robust thin film composite PDMS/PAN hollow fiber membranes for water vapor removal from humid air and gases. Separation and Purification Technology. 2018, 202, 345–56. [Google Scholar] [CrossRef]
- Zhao, B.; Wang, L.-Y.; Chung, T.-S. Enhanced membrane systems to harvest water and provide comfortable air via dehumidification & moisture condensation. Separation and Purification Technology. 2019, 220, 136–44. [Google Scholar]
- Casado-Coterillo, C.; Fernández-Barquín, A.; Irabien, A. Effect of humidity on CO2/N2 and CO2/CH4 separation using novel robust mixed matrix composite hollow fiber membranes: Experimental and model evaluation. Membranes. 2019, 10, 6. [Google Scholar] [CrossRef]
- Shirazian, S.; Ashrafizadeh, S.N. Synthesis of substrate-modified LTA zeolite membranes for dehydration of natural gas. Fuel. 2015, 148, 112–9. [Google Scholar] [CrossRef]
- Khulbe, K.; Matsuura, T.; Feng, C.; Ismail, A. Recent development on the effect of water/moisture on the performance of zeolite membrane and MMMs containing zeolite for gas separation; review. RSC advances. 2016, 6, 42943–61. [Google Scholar] [CrossRef]
- Scholes, C.A.; Stevens, G.W.; Kentish, S.E. Membrane gas separation applications in natural gas processing. Fuel. 2012, 96, 15–28. [Google Scholar] [CrossRef]
- Xu, J.; Zhang, C.; Ge, T.; Dai, Y.; Wang, R. Performance study of sodium alginate-nonwoven fabric composite membranes for dehumidification. Applied Thermal Engineering. 2018, 128, 214–24. [Google Scholar] [CrossRef]
- Salafi, M.; Asasian-Kolur, N.; Sharifian, S.; Ghadimi, A. A flat-plate spiral-channeled membrane heat exchanger for methane dehumidification: Comparison of kraft paper and thin-film composite membrane. International Journal of Thermal Sciences. 2021, 167, 107046. [Google Scholar] [CrossRef]
- Baker, R.W.; Low, B.T. Gas separation membrane materials: a perspective. Macromolecules. 2014, 47, 6999–7013. [Google Scholar] [CrossRef]
- Bui, D.; Vivekh, P.; Islam, M.; Chua, K. Studying the characteristics and energy performance of a composite hollow membrane for air dehumidification. Applied Energy. 2022, 306, 118161. [Google Scholar] [CrossRef]
- Sun, H.; Chen, B.; Zhao, G.; Zhao, Y.; Yang, M.; Song, Y. The enhancement effect of water-gas two-phase flow on depressurization process: Important for gas hydrate production. Applied Energy. 2020, 276, 115559. [Google Scholar] [CrossRef]
- Zhao, J.; Liu, D.; Yang, M.; Song, Y. Analysis of heat transfer effects on gas production from methane hydrate by depressurization. International Journal of Heat and Mass Transfer. 2014, 77, 529–41. [Google Scholar] [CrossRef]
- Zhao, E.; Hou, J.; Du, Q.; Liu, Y.; Ji, Y.; Bai, Y. Numerical modeling of gas production from methane hydrate deposits using low-frequency electrical heating assisted depressurization method. Fuel. 2021, 290, 120075. [Google Scholar] [CrossRef]
- Zhao, X.; Qiu, Z.; Zhang, Z.; Zhang, Y. Relationship between the gas hydrate suppression temperature and water activity in the presence of thermodynamic hydrate inhibitor. Fuel. 2020, 264, 116776. [Google Scholar] [CrossRef]
- Norouzi, N.; Shiva, N.; Khajehpour, H. Optimization of energy consumption in the process of dehumidification of natural gas. Biointerface Research in Applied Chemistry. 2021, 11, 14634–9. [Google Scholar]
- Fakharnezhad, A.; Masoumi, S.; Keshavarz, P. Analysis of design parameter effects on gas dehumidification in hollow fiber membrane contactor: Theoretical and experimental study. Separation and Purification Technology. 2019, 226, 22–30. [Google Scholar] [CrossRef]
- Shadanfar, H.; Elhambakhsh, A.; Keshavarz, P. Air dehumidification using various TEG based nano solvents in hollow fiber membrane contactors. Heat and Mass Transfer. 2021, 57, 1623–31. [Google Scholar] [CrossRef]
- Petukhov, D.; Komkova, M.; Brotsman, V.; Poyarkov, A.; Eliseev, A.A.; Eliseev, A.A. Membrane condenser heat exchanger for conditioning of humid gases. Separation and Purification Technology. 2020, 241, 116697. [Google Scholar] [CrossRef]
- Nikooei, E.; AuYeung, N.; Zhang, X.; Goulas, K.; Abbasi, B.; Dyall, A.; et al. Controlled dehumidification to extract clean water from a multicomponent gaseous mixture of organic contaminants. Journal of Water Process Engineering. 2021, 43, 102229. [Google Scholar] [CrossRef]
- Lotfi, Z.; Keshavarz, P. High-efficiency water vapor absorption by tri-ethylene glycol combined with methyldiethanolamine. Separation and Purification Technology. 2021, 270, 118841. [Google Scholar] [CrossRef]
- Zhao, W.; Lu, H.; Li, C. Composite hollow fiber membrane dehumidification: A review on membrane module, moisture permeability and self-cleaning performance. International Journal of Heat and Mass Transfer. 2021, 181, 121832. [Google Scholar] [CrossRef]
- Madhumala, M.; Nagamani, T.; Sridhar, S. Hollow Fiber Membrane Contactors for Dehumidification of Air. Hollow Fiber Membrane Contactors: CRC Press; 2020. p. 195-206.
- Kaibollahi, M.M.; Keshavarz, P. Study of Water Vapor Absorption from Gas Using Tetra-Ethylene Glycol (TREG). Iranian Chemical Engineering Journal. 2023, 21, 57–68. [Google Scholar]
- Kian Jon, C.; Islam, M.R.; Kim Choon, N.; Shahzad, M.W.; Kian Jon, C.; Islam, M.R.; et al. Membrane Air Dehumidification. Advances in Air Conditioning Technologies: Improving Energy Efficiency. 2021:225-55.
- Bucșă, S.; Năstase, G.; Șerban, A.; Ciocan, M.; Drughean, L. Cooling and Dehumidification Systems Used in air Separation. International Multidisciplinary Scientific GeoConference: SGEM. 2019, 19, 139–44. [Google Scholar]
- Shams, K.; Ahi, H. Synthesis of 5A zeolite nanocrystals using kaolin via Nano emulsion-ultrasonic technique and study of its sorption using a known kerosene cut. Microporous and mesoporous materials. 2013, 180, 61–70. [Google Scholar] [CrossRef]
- Matsukata, M.; Ogura, M.; Osaki, T.; Rao, P.R.H.P.; Nomura, M.; Kikuchi, E. Conversion of dry gel to microporous crystals in gas phase. Topics in Catalysis. 1999, 9, 77–92. [Google Scholar] [CrossRef]
- Liu, X.; Li, Y.; Chen, B.; Wang, Y. Cleaner process for synthesis of zeolite MCM-22 by vapor-phase transport method. Asia-Pacific Journal of Chemical Engineering. 2009, 4, 607–11. [Google Scholar] [CrossRef]
Figure 1.
Different stages of synthesis by Eutectic method.
Figure 1.
Different stages of synthesis by Eutectic method.
Figure 2.
Design of gas test device of the hollow fiber membrane.
Figure 2.
Design of gas test device of the hollow fiber membrane.
Figure 3.
Image of the constructed gas dehumidification membrane device.
Figure 3.
Image of the constructed gas dehumidification membrane device.
Figure 4.
Diagram of the effect of change the 𝑺𝒊𝑶𝟐 concentration on gas test results.
Figure 4.
Diagram of the effect of change the 𝑺𝒊𝑶𝟐 concentration on gas test results.
Figure 5.
Diagram of the effect of change the 𝑺𝒊𝑶𝟐 concentration on the results of water test.
Figure 5.
Diagram of the effect of change the 𝑺𝒊𝑶𝟐 concentration on the results of water test.
Figure 6.
Diagram of the effect of change the SiO2 concentration on performance test results.
Figure 6.
Diagram of the effect of change the SiO2 concentration on performance test results.
Figure 7.
Diagram of changes in relative humidity of residue versus relative humidity of feed in the SiO2 membrane.
Figure 7.
Diagram of changes in relative humidity of residue versus relative humidity of feed in the SiO2 membrane.
Figure 8.
Diagram of gas and water permeability values of SiO2 membrane and its corresponding selectivity.
Figure 8.
Diagram of gas and water permeability values of SiO2 membrane and its corresponding selectivity.
Figure 9.
Diagram of changes in the residue relative humidity relative to feed in the 4MPD membrane.
Figure 9.
Diagram of changes in the residue relative humidity relative to feed in the 4MPD membrane.
Figure 10.
Diagram of gas and water permeability values of 4SiO2 membrane and its corresponding selectivity.
Figure 10.
Diagram of gas and water permeability values of 4SiO2 membrane and its corresponding selectivity.
Figure 11.
Diagram of selectivity with change of relative humidity of feed.
Figure 11.
Diagram of selectivity with change of relative humidity of feed.
Figure 12.
Relative diagram of the residue with change of relative humidity of feed.
Figure 12.
Relative diagram of the residue with change of relative humidity of feed.
Figure 13.
Membrane selectivity graph with change gas flow rate.
Figure 13.
Membrane selectivity graph with change gas flow rate.
Figure 14.
Diagram of changes in relative humidity of the residue relative to feed in Sw10 mode.
Figure 14.
Diagram of changes in relative humidity of the residue relative to feed in Sw10 mode.
Figure 15.
Diagram of selectivity changes with increase the operations time.
Figure 15.
Diagram of selectivity changes with increase the operations time.
Table 1.
Membrane performance test result of SiO2.
Table 1.
Membrane performance test result of SiO2.
| p(bar) |
|
|
|
|
|
| 2 |
5.797E-04 |
1.120E-05 |
0.460 |
0.540 |
8.32 |
| 3 |
5.827E-04 |
1.41973E-05 |
0.395 |
0.605 |
0.25 |
| 4 |
5.877E-04 |
1.92646E-05 |
0.320 |
0.680 |
1.18 |
| 5 |
5.981E-04 |
1.96823E-05 |
0.251 |
0.749 |
8.12 |
Table 2.
4SiO2 membrane performance test results.
Table 2.
4SiO2 membrane performance test results.
| p(bar) |
|
|
|
|
|
| 2 |
5.845E-05 |
1.601E-05 |
0.674 |
0.674 |
3.79 |
| 3 |
5.863E-05 |
1.78387E-05 |
0.628 |
0.628 |
6.63 |
| 4 |
5.893E-05 |
2.08073E-05 |
0.536 |
0.536 |
2.44 |
| 5 |
5.952E-05 |
2.6619E-05 |
0.427 |
0.427 |
6.28 |
| 6 |
6.032E-05 |
3.46833E-05 |
0.345 |
0.345 |
0.20 |
Table 3.
Test results of relative humidity change of feed.
Table 3.
Test results of relative humidity change of feed.
|
|
|
|
|
|
|
% |
| 9.376 |
0.144 |
0.856 |
8.944E-06 |
5.774E-04 |
5.7 |
2 |
8.49 |
| 3.303 |
0.170 |
0.830 |
8.47891E-06 |
5.779E-04 |
2.7 |
4 |
6.50 |
| 0.225 |
0.218 |
0782 |
0.0867E-05 |
5.786E-04 |
8.6 |
6 |
3.50 |
| 5.371 |
0.144 |
0.886 |
1.157E-05 |
5.800E-04 |
9.0 |
2 |
3.65 |
| 2.295 |
0.140 |
0.860 |
1.21519E-05 |
5.806E-04 |
9.7 |
4 |
3.65 |
| 4.211 |
0.185 |
0.815 |
1.29161E-05 |
5.814E-04 |
4.7 |
6 |
1.65 |
| 3.367 |
0.096 |
0.904 |
1.411E-05 |
5.826E-04 |
4.10 |
2 |
2.80 |
| 4.288 |
0.118 |
0.882 |
1.48941E-05 |
5.834E-04 |
3.9 |
4 |
1.81 |
| 2.195 |
0.165 |
0.835 |
1.59014E-05 |
5.844E-04 |
2.8 |
6 |
6.80 |
Table 4.
Results of the gas flow rate change test.
Table 4.
Results of the gas flow rate change test.
|
|
|
|
|
% |
|
|
| 5.371 |
0.114 |
0.886 |
1.157E05 |
5.800E-04 |
9.0 |
2 |
50 |
| 2.295 |
0.140 |
0.860 |
1.21519E05 |
5.806E-04 |
9.7 |
4 |
50 |
| 4.211 |
0.185 |
0.815 |
1.29161E05 |
5.814E-04 |
4.7 |
6 |
50 |
| 4.336 |
0.125 |
0.875 |
2.230E05 |
1.159E-03 |
6.11 |
2 |
100 |
| 2.255 |
0.158 |
0.842 |
2.38157E05 |
1.161E-03 |
2.10 |
4 |
100 |
| 8.188 |
0.203 |
0.797 |
2.56262E05 |
1.163E-03 |
3.9 |
6 |
100 |
| 8.304 |
0.136 |
0.864 |
3.219E05 |
1.738E-03 |
2.14 |
2 |
150 |
| 8.231 |
0.172 |
0.828 |
3.4146E05 |
1.740E-03 |
3.13 |
4 |
150 |
| 1.170 |
0.220 |
0.780 |
3.74936E05 |
1.743E03 |
9.11 |
6 |
150 |
Table 5.
The results of the sweeper gas effect test.
Table 5.
The results of the sweeper gas effect test.
|
|
|
|
|
% |
(bar) |
|
| 3.367 |
0.096 |
0.904 |
1.411E-05 |
5.826E-04 |
4.10 |
2 |
0 |
| 4.288 |
0.118 |
0.882 |
1.448941E-05 |
5.834E-04 |
3.9 |
4 |
0 |
| 2.195 |
0.165 |
0.835 |
1.59014E-05 |
5.844E-04 |
2.8 |
6 |
0 |
| 1.416 |
0.086 |
0.914 |
1.421E-05 |
5.827E-04 |
9.8 |
2 |
1 |
| 5.323 |
0.107 |
0.893 |
1.47108E-05 |
5.832E-04 |
5.8 |
4 |
1 |
| 6.216 |
0.152 |
0.848 |
1.55579E-05 |
5.840E-04 |
2.8 |
6 |
1 |
| 8.494 |
0.073 |
0.927 |
1.409E-05 |
5.826E-04 |
6.8 |
2 |
5 |
| 7.381 |
0.093 |
0.907 |
1.44097E-05 |
5.829E-04 |
3.8 |
4 |
5 |
| 9.276 |
0.123 |
0.877 |
1.50901E-05 |
5.836E-04 |
9.7 |
6 |
5 |
| 1.543 |
0.067 |
0.933 |
1.413E-05 |
5.826E-04 |
1.8 |
2 |
10 |
| 5.418 |
0.085 |
0.915 |
1.44652E-05 |
5.829E-04 |
7.7 |
4 |
10 |
| 1.315 |
0.110 |
0.890 |
1.49611E-05 |
5.834E-04 |
4.7 |
6 |
10 |
Table 6.
Test results of increase the operations time.
Table 6.
Test results of increase the operations time.
|
|
|
|
|
% |
|
|
| 6.287 |
0.119 |
0.881 |
1.476E-05 |
5.831E-04 |
5.9 |
30 |
6.287 |
| 9.288 |
0.118 |
0.882 |
1.47808E-05 |
5.832E-04 |
1.9 |
60 |
9.288 |
| 8.287 |
0.119 |
0.881 |
1.47096E-05 |
5.832E-04 |
2.9 |
90 |
8.287 |
| 0.288 |
0.119 |
0.881 |
1.46857E-05 |
5.832E-04 |
4.9 |
120 |
0.288 |
| 6.288 |
0.119 |
0.881 |
1.46873E-05 |
5.832E-04 |
1.9 |
150 |
6.288 |
| 6.287 |
0.119 |
0.881 |
1.47496E-05 |
5.832E-04 |
1.9 |
180 |
6.287 |
| 0.288 |
0.118 |
0.882 |
1.47595E-05 |
5.832E-04 |
2.9 |
210 |
0.288 |
| 4.288 |
0.119 |
0.881 |
1.47439E-05 |
5.832E-04 |
2.9 |
240 |
4.288 |
| 6.288 |
0.119 |
0.881 |
1.48048E-05 |
5.833E-04 |
9.8 |
270 |
6.288 |
| 8.287 |
0.119 |
0.881 |
1.46909E-05 |
5.832E-04 |
2.9 |
300 |
8.287 |
| 3.289 |
0.119 |
0.881 |
1.47404E-05 |
5.832E-04 |
1.9 |
330 |
3.289 |
| 5.287 |
0.119 |
0.881 |
1.467E-05 |
5.831E-04 |
4.9 |
360 |
5.287 |
| 3.279 |
0.118 |
0.882 |
1.47591E-05 |
5.832E-04 |
1.9 |
390 |
3.279 |
| 0.288 |
0.119 |
0.881 |
1.47657E-05 |
5.832E-04 |
2.9 |
420 |
0.288 |
|
Disclaimer/Publisher’s Note: The statements, opinions and data contained in all publications are solely those of the individual author(s) and contributor(s) and not of MDPI and/or the editor(s). MDPI and/or the editor(s) disclaim responsibility for any injury to people or property resulting from any ideas, methods, instructions or products referred to in the content. |
© 2023 by the authors. Licensee MDPI, Basel, Switzerland. This article is an open access article distributed under the terms and conditions of the Creative Commons Attribution (CC BY) license (http://creativecommons.org/licenses/by/4.0/).

