Introduction
The trace elements iodine (I) and selenium (Se) are essential for the normal function of the thyroid gland (Schomburg and Köhrle, 2008). Simultaneous biofortification of crops with iodine and selenium is crucial in areas where there is a deficiency of these two elements in the soils. The main reason for the deficiency of both elements in humans is the insufficient intake of iodine and selenium from vegetables (El-Ramady et al., 2015: Jerše, 2018). As a result, their absorption and transfer along the food chain is low. Selenium is an essential micronutrient element that plays a vital role in various physiological processes such as thyroid hormone metabolism, antioxidant defense system and also improving the function of the immune system in the body (Santhosh Kumar and Priyadarsini, 2014). Furthermore, selenium plays multiple essential roles in the growth and function of living cells as well as important biological activities in animals and humans (El-Ramady et al., 2016). Epidemiological studies have confirmed that the lack of selenium in the diet increases the incidence of cardiovascular disease and dysfunction of the thyroid gland, as well as immune system and nervous systems (Rayman, 2000).
Iodine is also a micronutrient that is essential for the proper physiological function of humans and animals mainly mammals (Krzepiłko et al., 2019). The World Health Organization has identified iodine deficiency as one of the main factors affecting human health (Allen et al., 2020). Iodine deficiency disorders are insufficient secretion of thyroid hormones, which results in goiter (Zimmermann et al., 2008). Although studies showed that iodine plays a role in some physiological and biochemical processes it is not essential for plant growth (Gonzali et al., 2017). Application of selenium in agricultural practices is aimed at enriching agricultural food products for humans (Wu et al., 2015). Selenium has a significant influence on the growth and quality of vegetables. Selenium application culminates in a significant increase of selenium levels in spinach (Ferrarese et al., 2012), broccoli (Sindelaˇrova et al., 2015), cabbage (Mechora et al., 2014), radish (Schiavon et al., 2016) without any negative effects on the biomass and quality of plants. Research conducted by Rui et al., (2020) demonstrated that the amount of carotenoid, total phenol, total flavonoid, total sugar and total protein, nutritional value, dry weight, selenium amount and mineral amounts (potassium, calcium and zinc) of edible sprouts of broccoli increased significantly under the influence of selenium (100 micromol/l) and LED lights (blue, red and green) combinations. Also, the application of selenium and iodine separately or simultaneously, increased the content of these two elements in lettuce leaves (Puccinelli et al., 2021).
Previous studies showed that total chlorophyll values of lettuce (Alsina et al., 2012) and broccoli (Ghasemi et al., 2016) increased via selenium application. In another study selenium application reduced the chlorophyll content of mint while increasing the carotenoids (Oraghi Ardebili et al., 2015). Selenium has also been reported to increase total sugar in tomato fruit (Lee et al., 2007).
Literature reviews showed that the treatment of lettuce plants with blue/red light (10/90) enhanced leaf selenium content (Brazaitytė et al., 2021). Blue light facilitates protein biosynthesis in plants and also increases plant photosynthetic capacity (Li and Pan, 1995). Plant chemicals such as anthocyanins, polyphenols and flavonoids play an important role in protecting cardiovascular health and preventing some cancers (Costa et al., 2015). Blue light increased total phenol and antioxidant capacity of red lettuce leaves (Son and Oh, 2015). Total phenol and flavonoid values and antioxidant capacity of lettuce grown under higher proportions of blue light were significantly higher compared to other spectra (Son and Oh, 2013). The amounts of calcium, magnesium, manganese and iron in lettuce under blue light increased compared to other spectra (Shin et al., 2013). Gonnella et al. (2019) showed that in the hydroponic cultivation of cabbage, adding iodine to the nutrient solution increases the dry weight and iodine content of the plant tissue. It has been proved that blue light is required for efficient photosynthesis in various crops including spinach, radish, lettuce and cucumber (Yorio et al. 2001; Hogewoning et al. 2010). Terfa et al. (2013) showed that the increase of blue light from 5 to 20% increases the thickness of the leaf and therefore resulted in increased photosynthetic activity. Wang et al. (2014) found that increasing blue light in cucumber increases stomatal conductance and net photosynthesis.
It has been reported that under a higher percentage of blue light of LED lamps, a significant increase in net photosynthesis of cucumber (Hernández and Kubota, 2015), branch tissue pigments, glucosinolates, nutritional value of microgreens and essential mineral elements in microgreens of cabbage (Kopsell et al., 2012), increase in the nutritional value of microgreens (Vaštakaitė et al., 2015) as well as the content of mineral elements of mustard (Gerovac et al., 2016) is observed. Blue light alone causes a 69% increase in total phenol content in Chinese cabbage sprouts compared to darkness (Qian et al., 2016). In addition, increasing the ratio of blue light in the combination of blue and far red light, leads to more accumulation of total phenol in lettuce (Son and Oh, 2013). Blue LED light is useful in improving crop nutritional quality including higher phenolic compounds (Son and Oh, 2015; Taulavuori et al., 2016), ascorbic acid (Xin et al., 2015), carotenoids, anthocyanin content, and leaf color (Mizuno et al., 2015). A higher ratio of dry and fresh mass accumulation in coriander plants was observed under different ratios of red and blue light compared to plants grown under 100% red light (Naznin et al., 2016). It has been well established that stomatal opening is controlled by blue light receptors (Ieperen and Trouwborst, 2008). The issue of increasing the dry matter of the branch can be justified by increasing the level of blue light (Nanya et al., 2012).
Most plants are poor in terms of selenium and iodine content, and this sufficiently justifies the necessity of increasing the bioavailability and concentration of these elements in crops. Vegetable biofortification is a reliable method of increasing dietary intake of iodine and selenium. Therefore, the aim of this research was to investigate the effects of selenium, iodine and blue light on growth, biomass weight, physicochemical properties, mineral elements and the medicinal composition of trigonelline in fenugreek seeds and shoots at the 40 and 80-day stage.
Materials and Methods
This research was laid out as a three-factor factorial experiment in a completely randomized design (CRD) with three replications in pots in the research greenhouse of the Faculty of Agriculture of Zabol University in 2022. In this experiment, the first factor had three levels of sodium selenate fertilizer (S1: 0, (S2) 2 and (S3) 4 mg/l) and the second factor had three levels of potassium iodate (I1: 0, I2: 2 and I3: 4 mg/L) and the third factor had two supplement blue light levels (L1: blue light and L2: no radiation/control). Fenugreek seeds were purchased from Pakan Bazar company, Isfahan. After washing with dishwashing liquid, the seeds were rinsed three times with distilled water and then treated with benomyl fungicide (2 g/l water) for 20 minutes. After disinfection, 10 seeds were planted in each pot on a substrate of cocopeat: perlite (1:1 ratio). After germination, thinning was done whereby 5 seedlings were kept and the rest were removed. Fertilizer application using Hoagland's nutrient solution supplemented with sodium selenate (Na2SeO4) and potassium iodate (KIO3) was done. The greenhouse located in the north-south direction, with a polycarbonate cover, equipped with a cooling device, lateral ventilation and shade, with an average daily temperature range of 22-28 degrees ºC, relative humidity of 60-70% and light of 600 micromoles per square meter per second. Twenty days after planting seeds, irradiation of blue light began. The supplementary blue light system was turned on for 2 hours in the morning (at the time of sunrise) until 40 and 80 days after seed sowing and then the samples were taken for following traits measurement.
Morphological Traits
Plant height was measured with a graduated ruler, and fresh weight of shoot, root and seed was measured with a digital scale. Also, the aerial part and the root of each plant were placed in the oven individually for 72 hours at 65 ºC, and then the dried samples were weighed to get dry weight.
Physiological and Biochemical Traits
Leaf Relative Water Content (RWC)
First, the samples were placed in distilled water and kept at a temperature of 4°C for 24 hours. After 24 hours, the saturated weight of the leaves was measured and the leaves were placed in the oven at 70°C for 24 hours and the dry weight of each was measured. RWC was determined by putting the obtained numbers in the following formula (Ritchie and Nguyen, 1990):
Fw: Leaf fresh weight.
Dw: Leaf dry weight.
Sw: Leaf saturated weight.
Total Chlorophyll and Carotenoids
Fresh aerial samples of 0.2 g were placed in 8 ml of ethanol-acetone mixture (ratio 1:1) at room temperature for 24 hours and dark place until the appearance of a white color. The absorbance of the solution was read using a spectrophotometer at wavelengths of 645, 663 and 440 nm. Chlorophyll and carotenoid quantity were calculated using the following formulas (Gratani, 1992):
Total Anthocyanin
Total anthocyanin content was measured according to the method described by Xu et al. (2005). Plant samples were heated with 20 ml of 60% ethanol for 2 hours in a hot water bath, then the samples were filtered. The extract solution was read by a spectrophotometer at a wavelength of 535 nm. After 15 minutes, the solution was read at 705 nm wavelength (Chanwitheesuk et al., 2005).
Trigonelin Content of Shoot and Seed
Spectrophotometric method was used to determine the amount of trigonelline. One g of the plant samples (leaf or seed) was mixed with one g of magnesium oxide and 20 ml of distilled water and placed in a hot water bath at a temperature of 100 ºC for 18 minutes. After cooling, the sample was filtered using filter paper and the volume of the samples was increased to 25 ml using distilled water. The samples were centrifuged at 1200 rpm. The supernatant solution was read using a spectrophotometer at 268 nm wavelength. Using the standard curve, the trigonelline values were reported as milligrams per 100 g fresh weight of aerial parts and milligrams per gram of dry weight of seeds (Badi, et al. al., 2018).
Seed Yield
After harvesting the plants, the amount of seeds per plant was weighed and calculated.
Data Analysis
The obtained data were statistically analyzed by SAS statistical software and comparison of averages was done with the LSD test at the five percent level, and cutting was done based on iodine levels.
Results
Plant Growth and Seed Yield
Plant Height
According to
Table 4, under the conditions of supplementary blue light, the highest (15.77 cm) plant height value was observed at the 40-day stage at 4 mg/L of selenium, which was not significantly different from 2 mg/L treatment at the level of 5% probability. Also, under blue light at the 40-day stage, the lowest (12.44 cm) plant height was obtained in the control level of selenium (0 mg/l). The height of the plant at the 40-day stage in sunlight (control) in all three levels of selenium was in the same statistical group. The results of plant height at the 80-day stage indicated that the highest (34.37 cm) and the lowest (29.50 cm) were observed in the control (sunlight) and blue light treatments, respectively (
Table 3). Also, the highest (35.50 cm) and lowest (28.50 cm) values of plant height at the 80-day stage were related to the selenium 4 and 0 mg/l, respectively (
Table 1).
Fresh Weight of Aerial Shoots
The fresh weight of shoots (FWS) at the 40-day stage in the blue light and sunlight treatments was 55.91 g and 50.53 g, respectively (
Table 2). Also, no significant difference was observed in the control selenium level (0 mg/l) between the iodine levels of 2 and 4 mg/l, and the lowest (44.73 g) values of the fresh weight of shoots at the 40-day age stage was at the level of 0 mg/l iodine. At the level of 2 and 4 mg/l of selenium, there was no significant difference between iodine levels in the FWS trait (at the 40-day stage) at the 5% probability level (
Table 6). The results associated with shoot fresh weight at the 80-day stage showed that the highest and lowest (75.99 and 69.20 g) amounts were found in blue light and sunlight (control), respectively (
Table 3). Moreover, no statistically significant difference between 0 and 2 mg/l levels of selenium was found (<5%), and the highest (76.85 g) values of shoot fresh weight at the 80-day stage were detected in 4 mg/l selenium (
Table 1).
Dry Weight of Shoot
The highest and the lowest of shoot dry weight values (11.44 and 9.55 g) at the 40-day stage were found in the blue light and sunlight (control) treatments, respectively (
Table 2). Also, according to
Table 6, in the conditions of no selenium application (0 mg/L), the maximum shoot dry weight at the 40-day stage was recorded in 4 mg/L of iodine, which was not significantly different from 0 mg/L iodine level. Furthermore, in application of 2 mg/l of selenium conditions, the highest (11.25 g) shoot dry weight at the 40-day stage was related to the iodine level of 2 mg/l, followed by 0 mg/l iodine. At the 4 mg/L of selenium, there was no statistical difference between all three levels of used iodine (0, 2 and 4 mg/L) in terms of shoot dry weight at the 40-day stage and were in a statistical group (p<5%). The results of shoot dry weight at the 80-day stage showed that under blue light conditions, the highest (22.78 g) value was observed in the selenium control group. Also in light conditions, no significant difference was detected between the level of 2 and 4 of mg/l selenium, and also in sunlight conditions (control), no significant difference was found between all three levels of selenium (
Table 5).
Root Fresh Weight
The highest and lowest root fresh weight (11.31 and 8.29 g) at the 40-day stage are related to no light (control) and blue light treatments, respectively (
Table 2). The results of root fresh weight at the 80-day stage showed that in the blue light conditions, there was no significant difference between various levels of selenium (
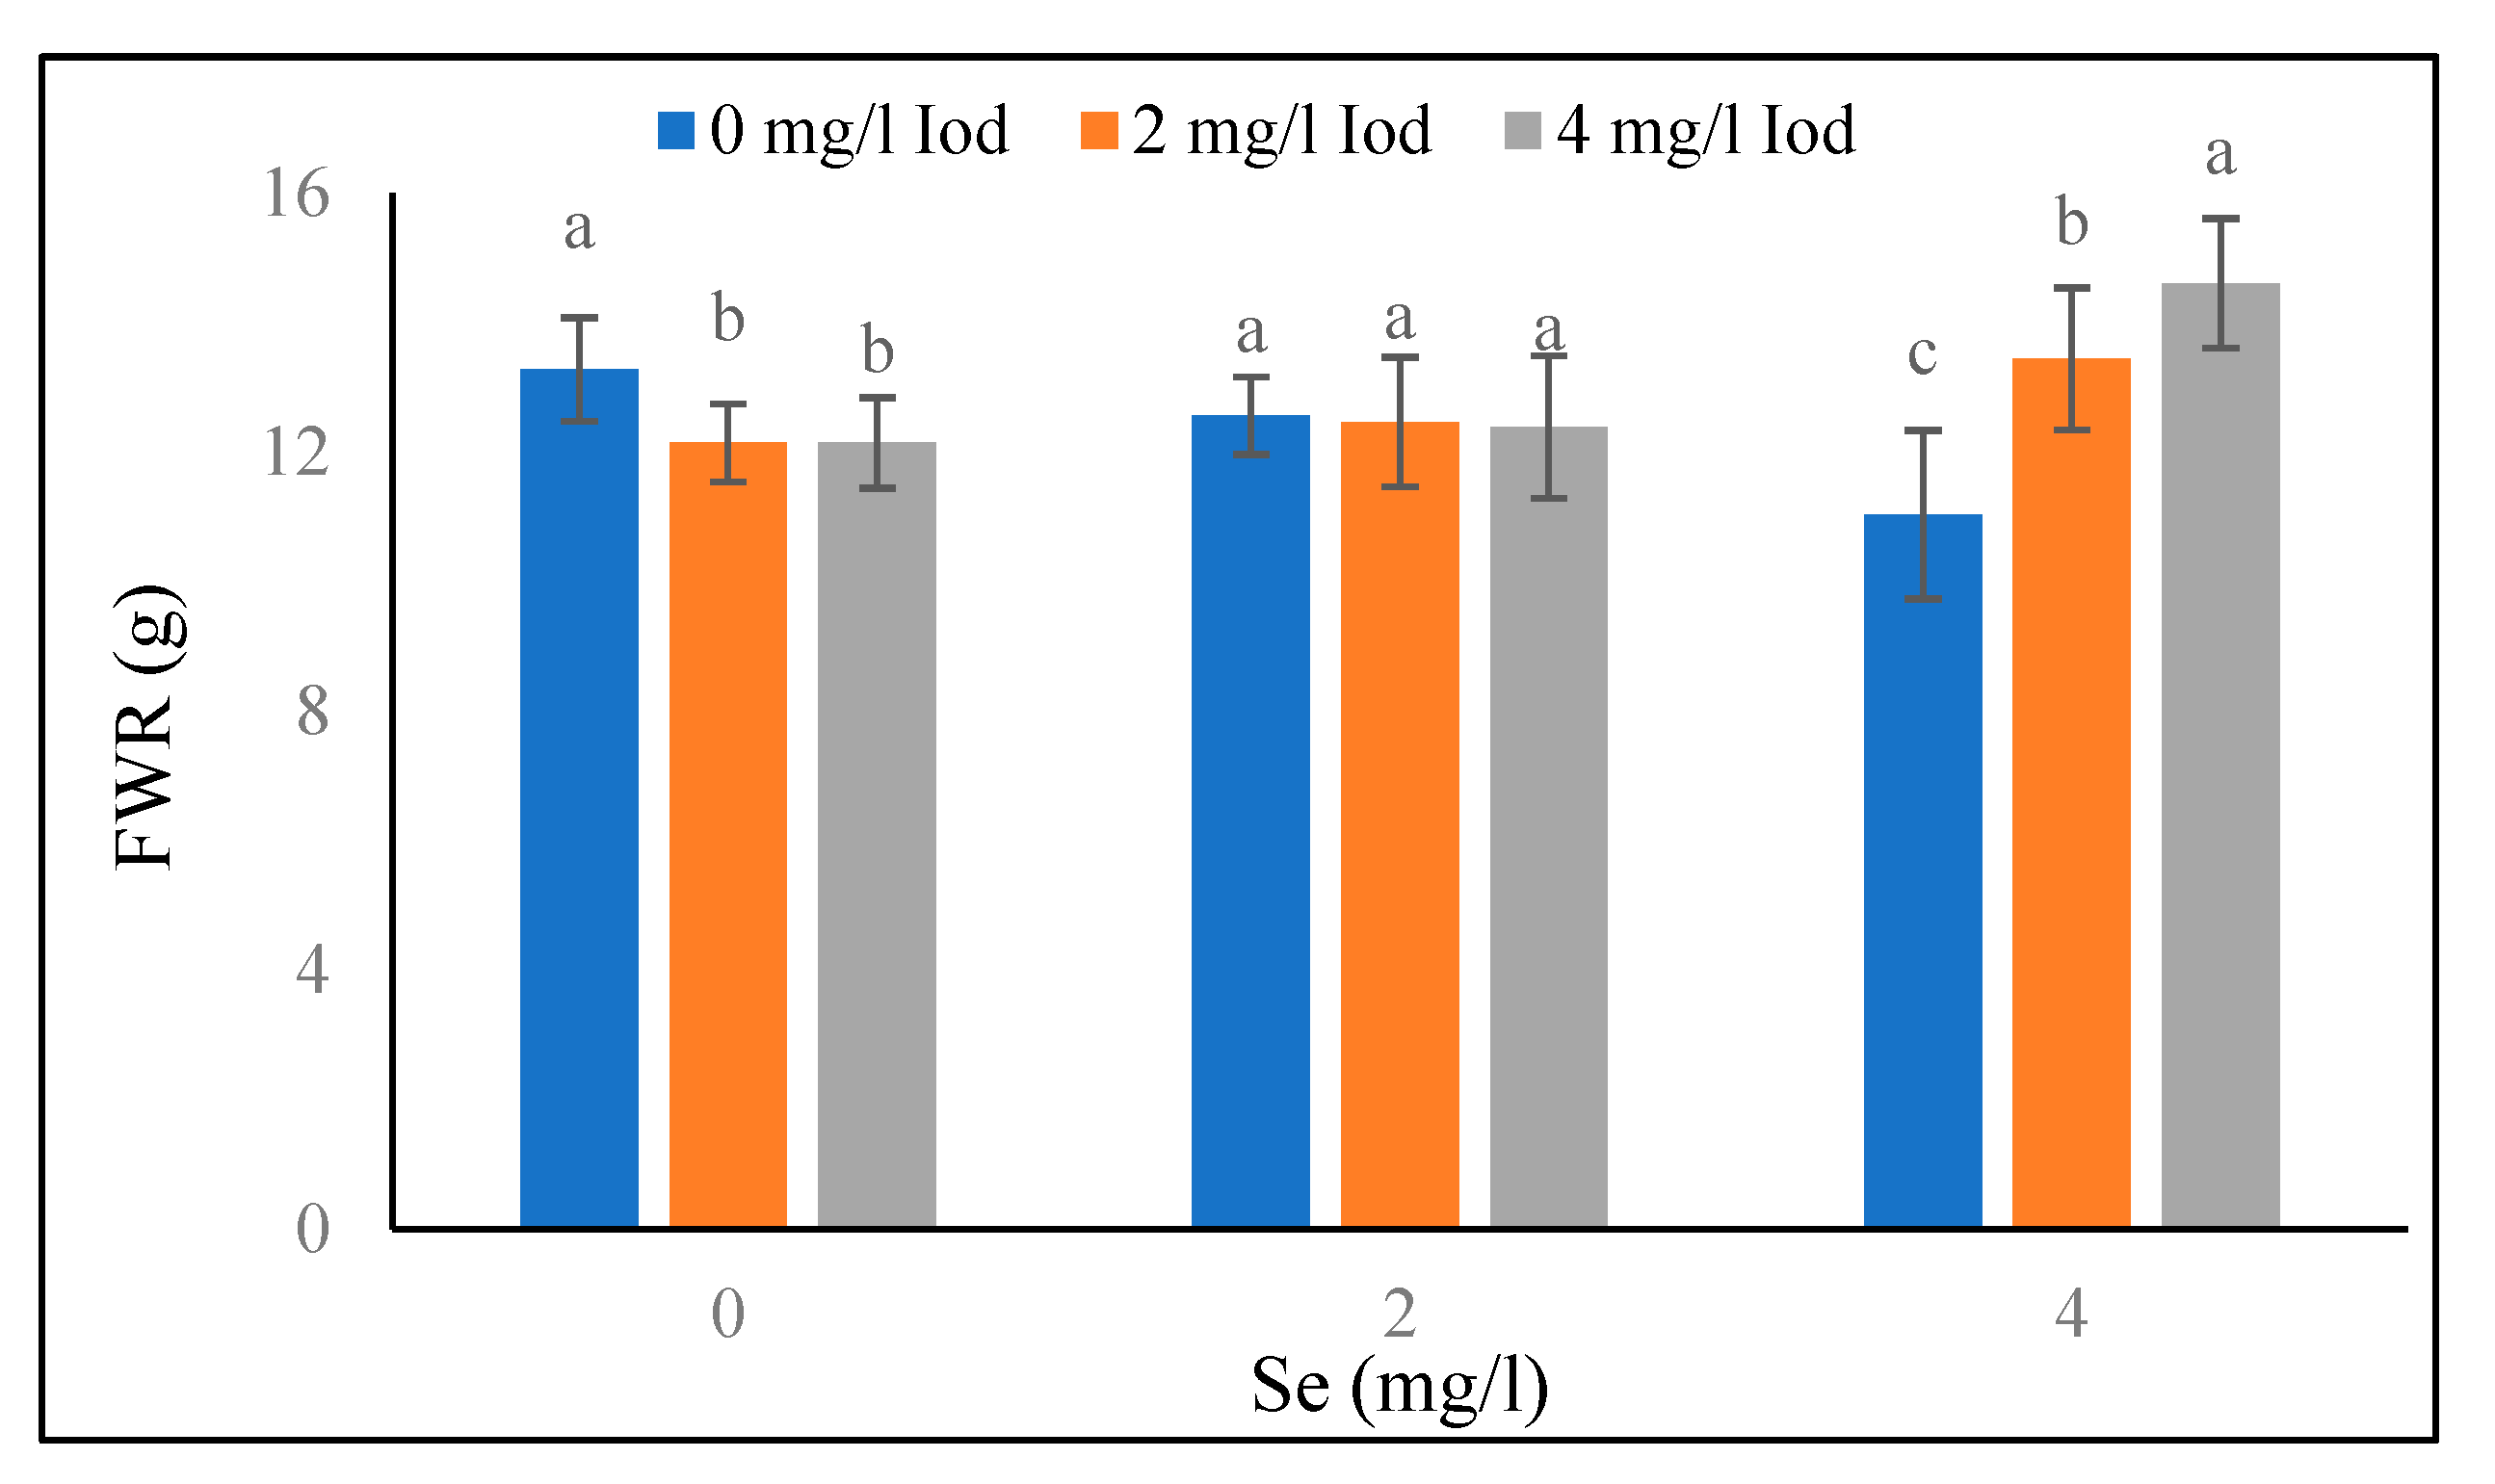
Table 5). Also, in no light treatment, the highest of root fresh weight (14.7 g) was observedat the 80-day stage of selenium at the level of 4 mg/l. Also, there was no significant difference between the levels of 0 and 2 mg/l of selenium. According to
Figure 5, at the 0 mg/l of selenium, the highest value of root fresh weight (13.28 g) at the 80-day stage was achieved in the iodine control (0 mg/l, and also significant difference was not observed between the levels of 2 and 4 mg/l of iodine. At the selenium level of 2 mg/l, there was no significant difference between the iodine levels. At the selenium level of 4 mg/l, the highest root fresh weight (14.60 g) at the 80-day stage was detected at the 4 mg/l of iodine.
Root Dry Weight
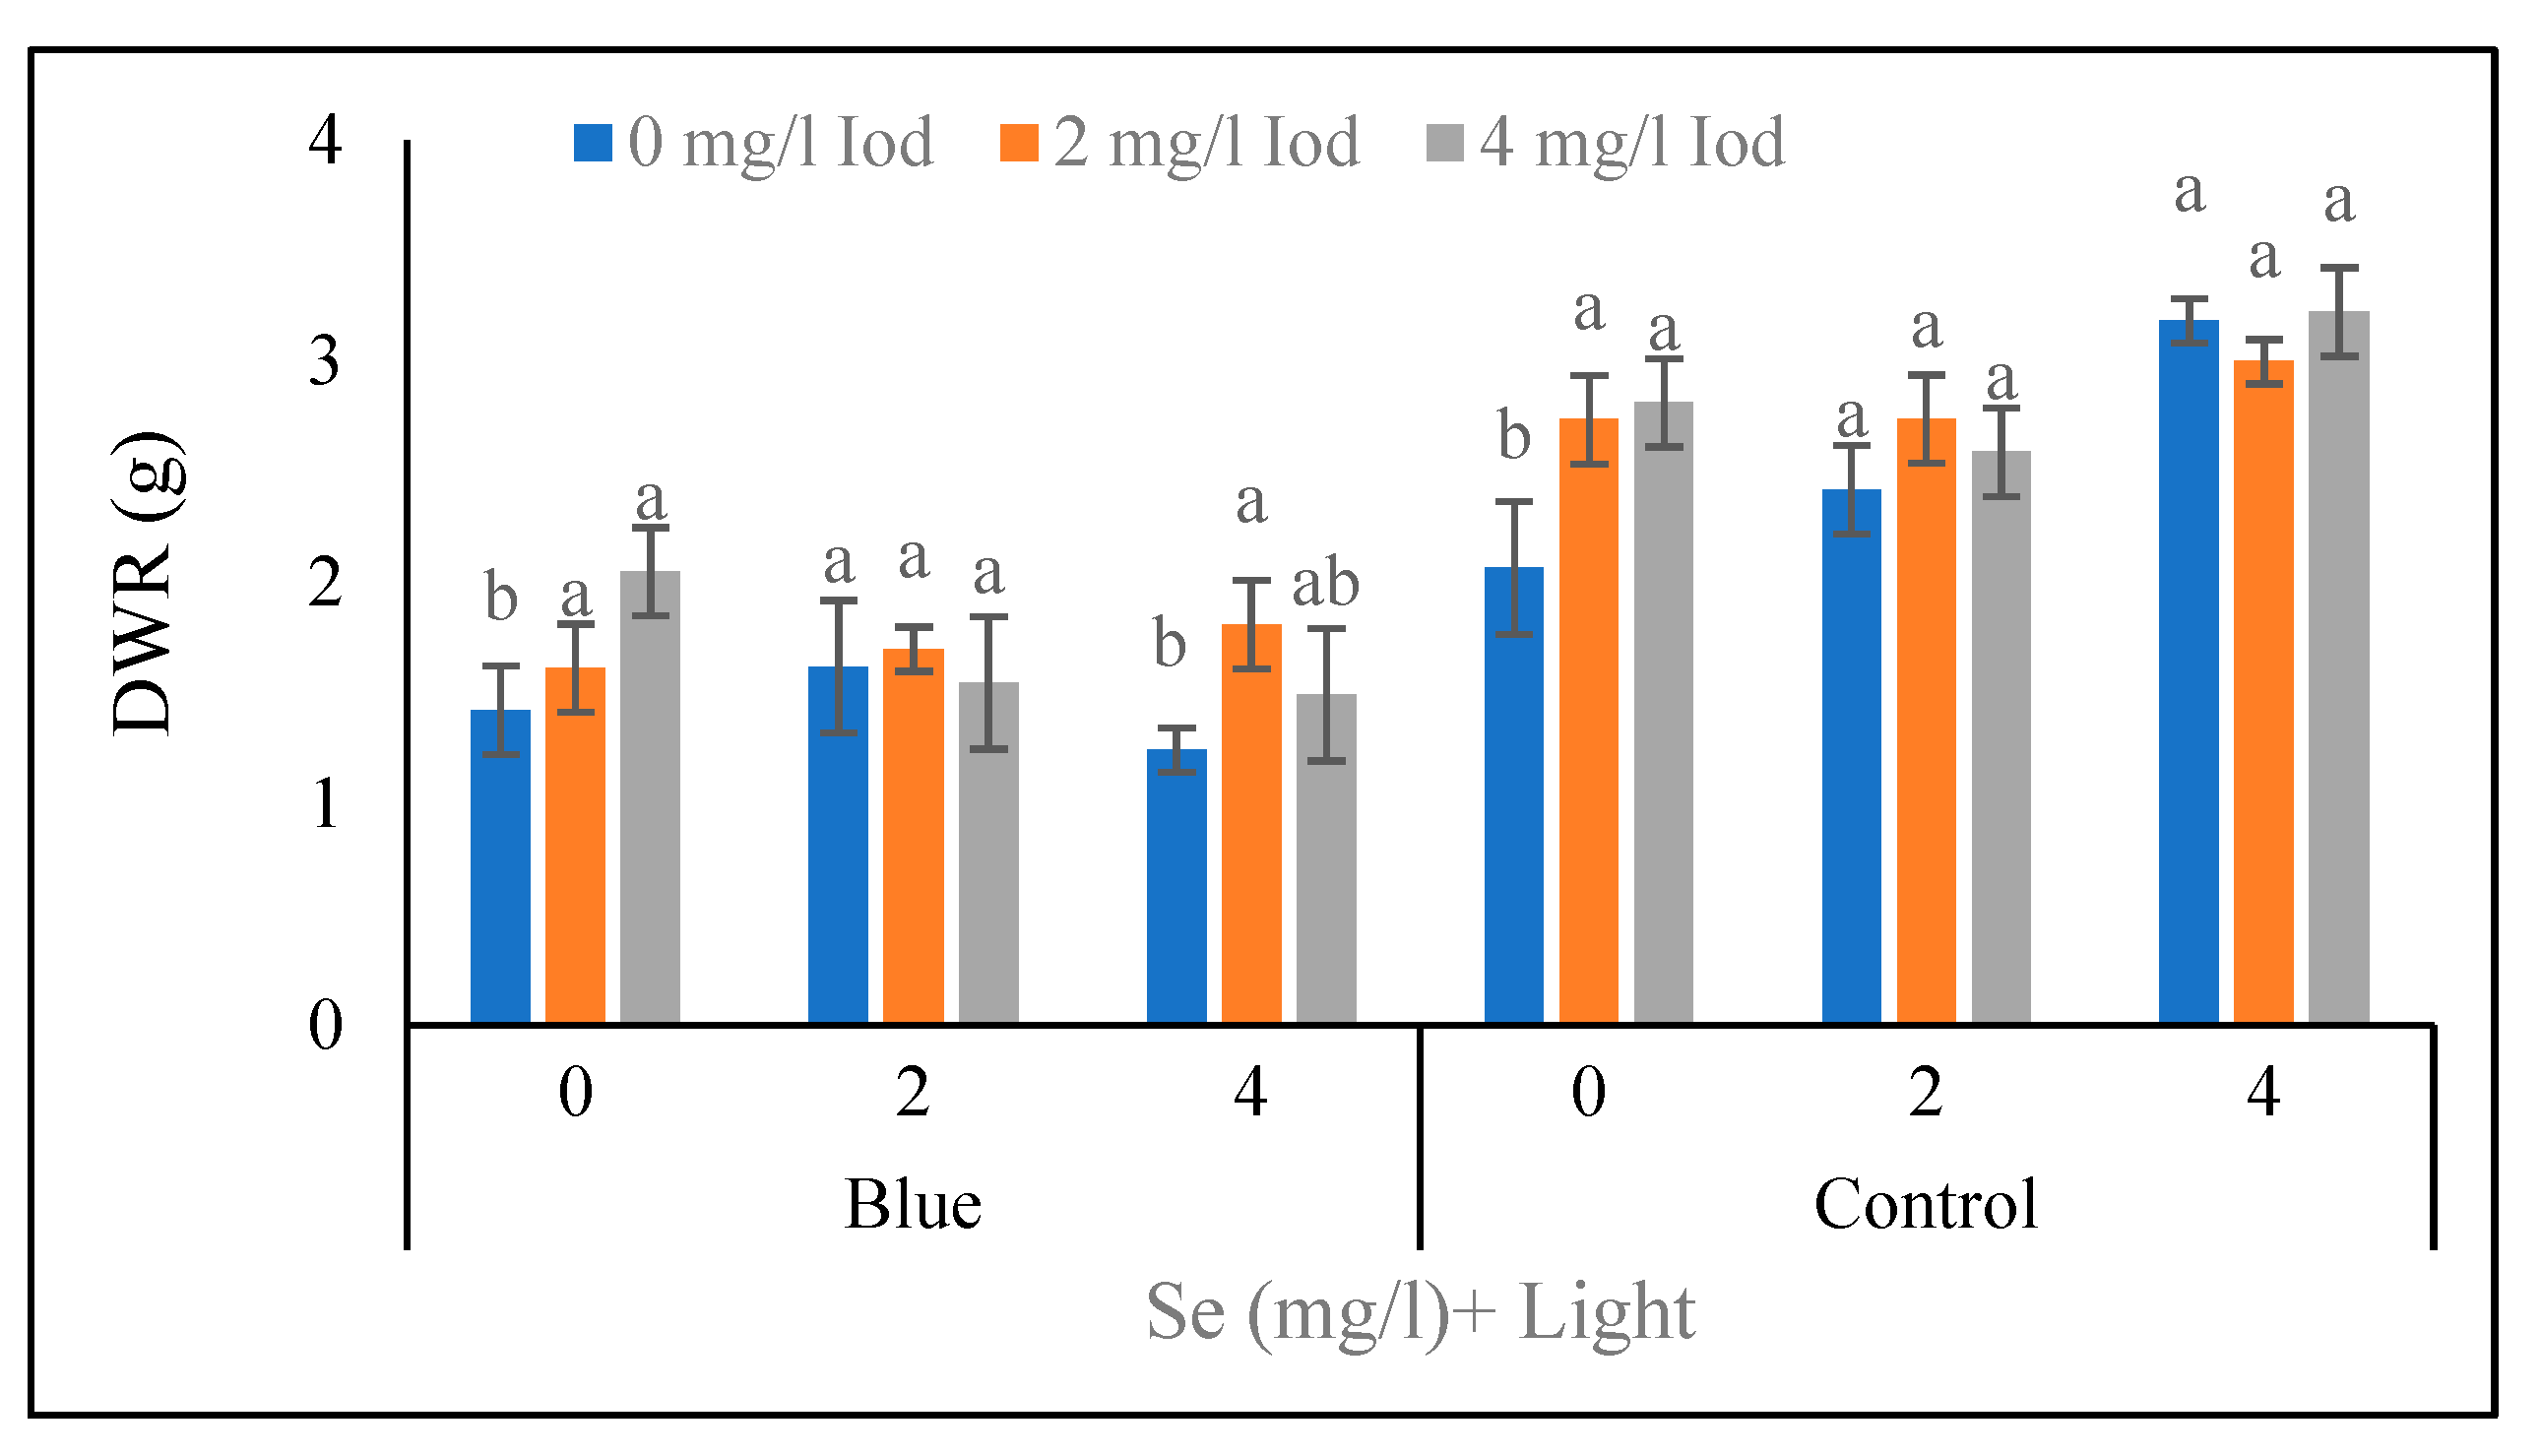
The results of root dry weight at the 40-day stage showed that under the conditions of supplementary blue light and 0 mg/l of selenium, the heaviest weight (2.05 g) was obtained in 4 mg/l of iodine which was in a same statistical group (p<0.05) with 2 mg/l of iodine (
Figure 7). Under the conditions of blue light and 2 mg/l of selenium, no significant difference was observed between iodine levels, and under the same light treatment (blue light) and 4 mg/l of selenium, the greatest values (1.81 g) were detected in 2 mg/l of iodine, and it was not significantly different with 4 mg/l of iodine. Under sunlight (control treatment) and 0 mg/l of selenium, no significant difference was found between the levels of 2 and 4 mg/l of iodine. Also, under the same light treatment (sunlight) and 2 mg/l of selenium, there was no significant difference between all three iodine levels (<5%). The same trend was observed under control light and 4 mg/l of selenium conditions, no significant difference was observed between all three iodine levels in terms of root dry weight at the 40-day stage (
Figure 7). The results related to the root dry weight at the 80-day stage (
Table 5) revealed that under blue light conditions, no significant difference was found between the levels of 0 and 2 mg/l of selenium. Similarly, under sunlight conditions, all three levels of selenium were in the same statistical group, and also in the control selenium (0 mg/l), there was no significant difference detected between various iodine amounts at the 80-day stage (
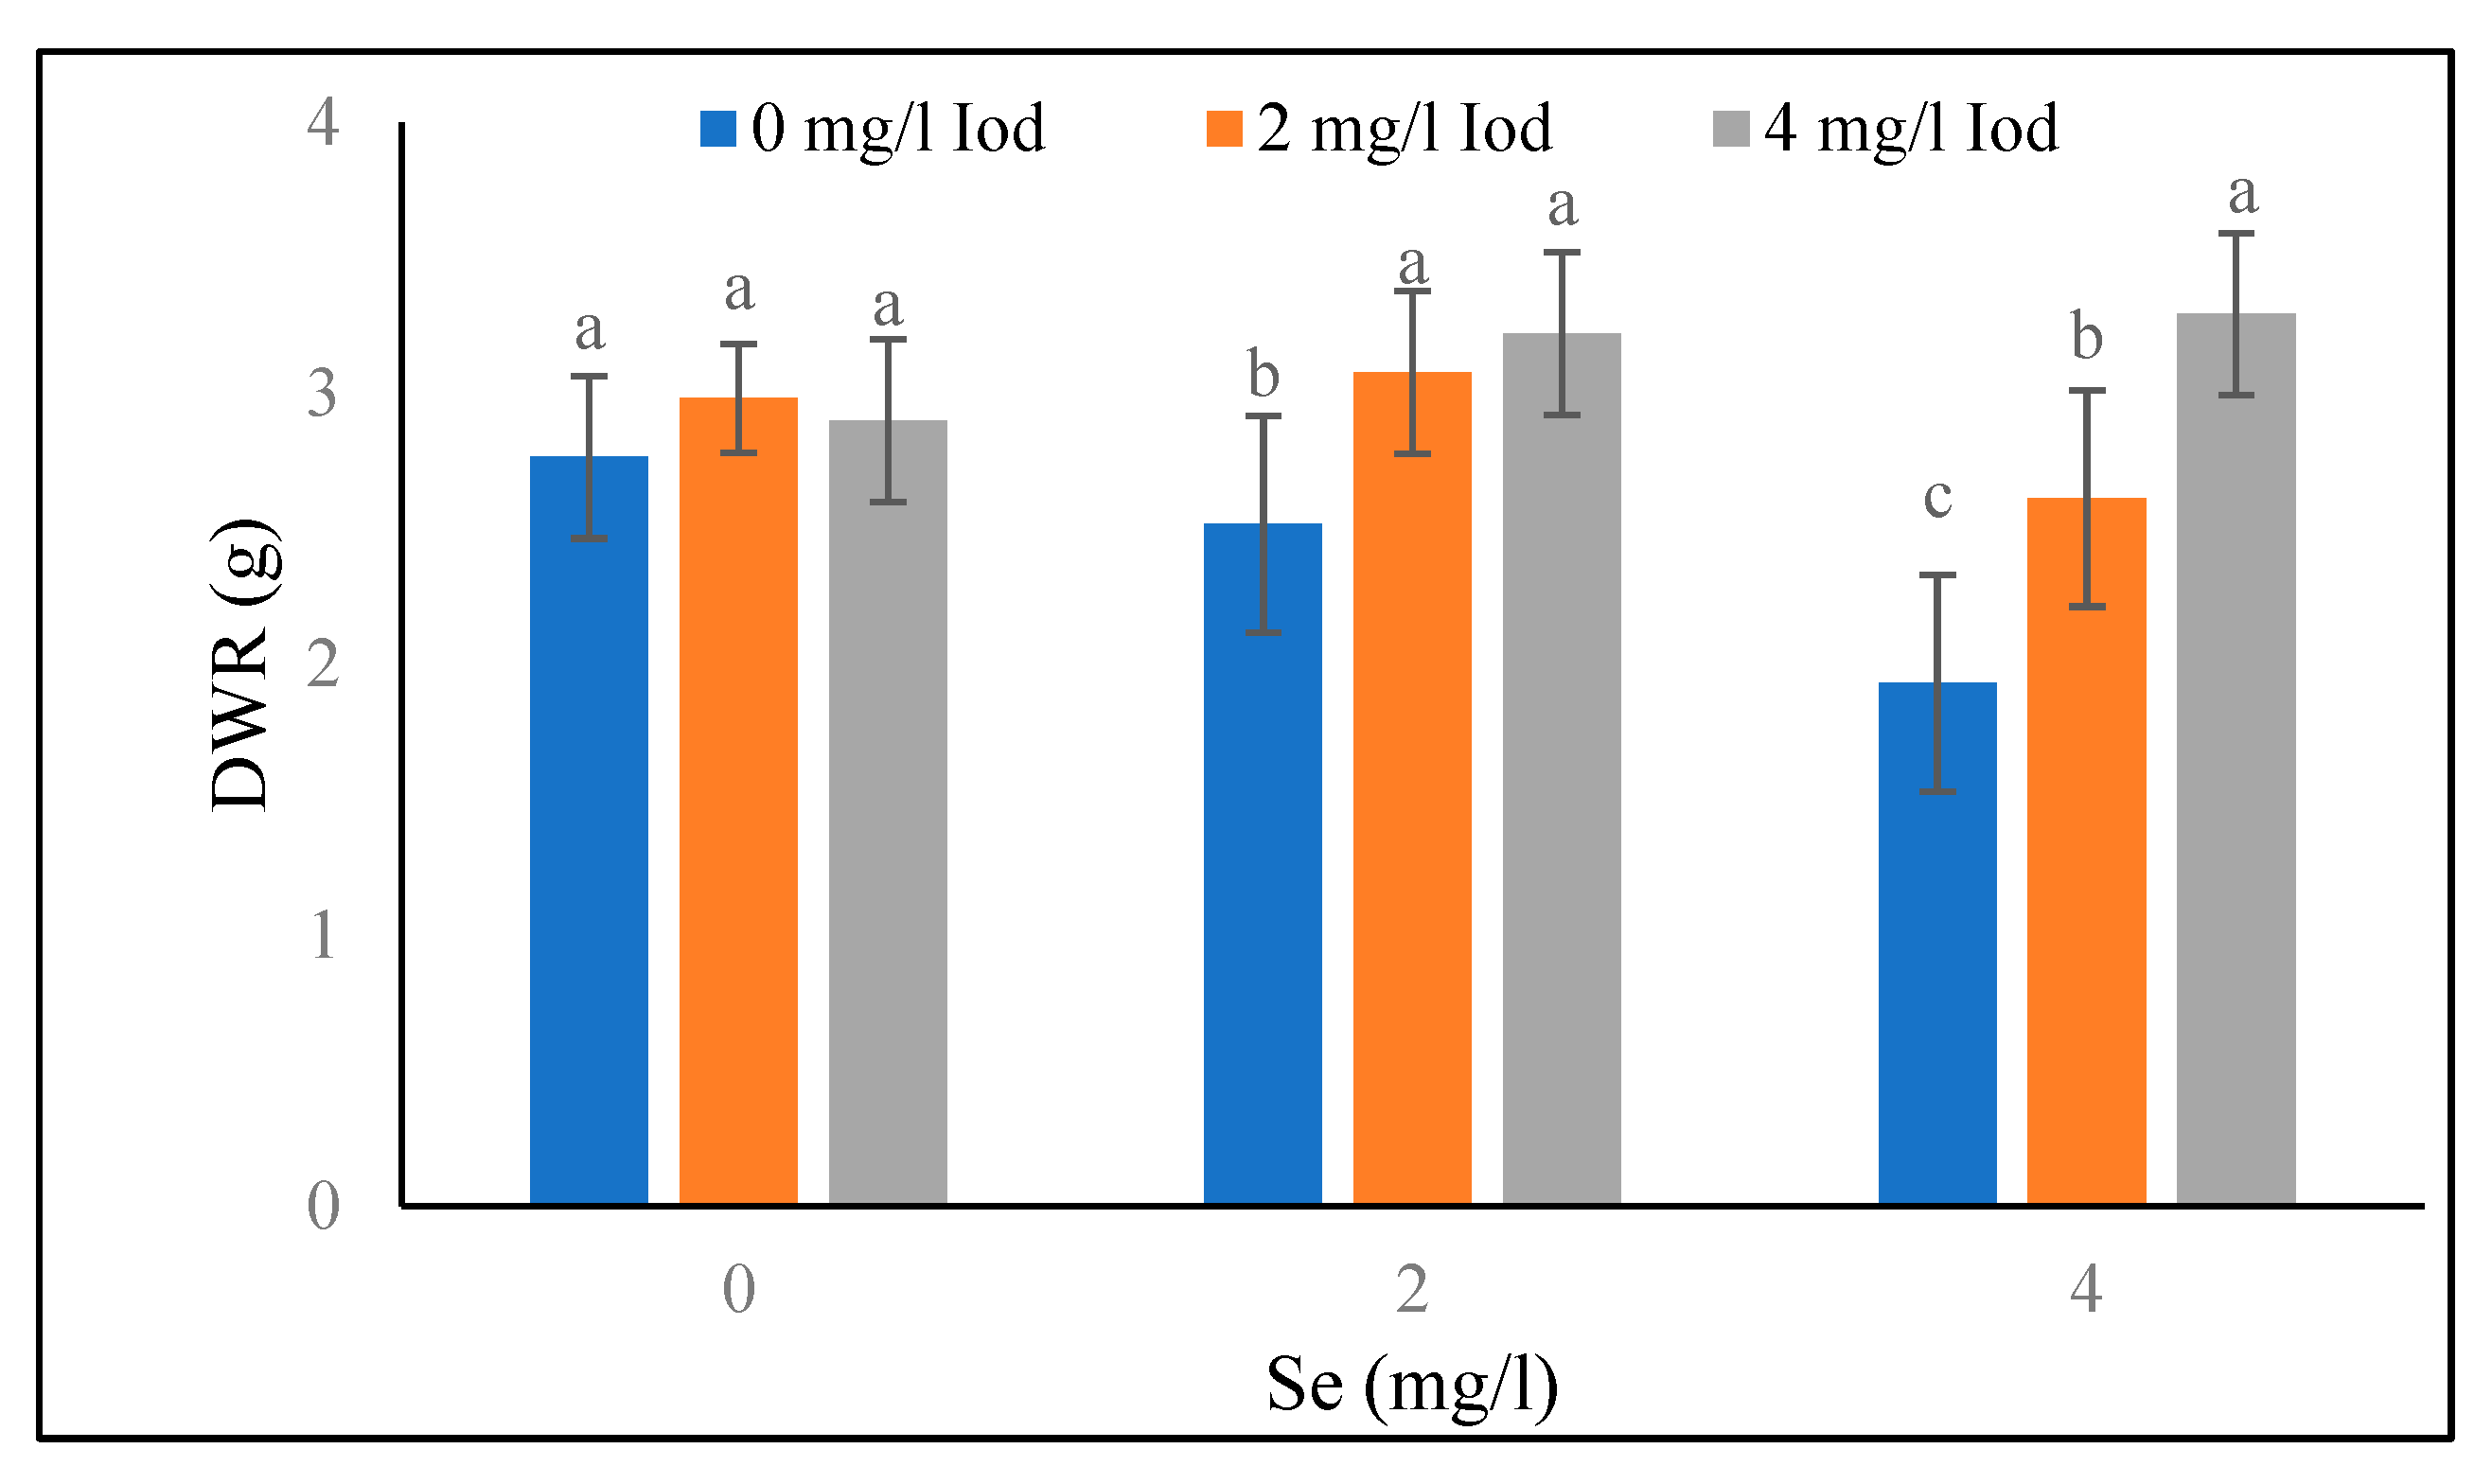
Figure 6). Furthermore, no significant difference was observed between the levels of 2 and 4 mg/l iodine under the treatment of 2 mg/l selenium. At 4 mg/l of selenium level, the highest and the lowest (3.29 and 1.93 g) values of root dry weight at the 80-day stage were related to the 4 and 0 mg/l of iodine, respectively (
Figure 6).
Relative Water Content of Leaves
According to the data in
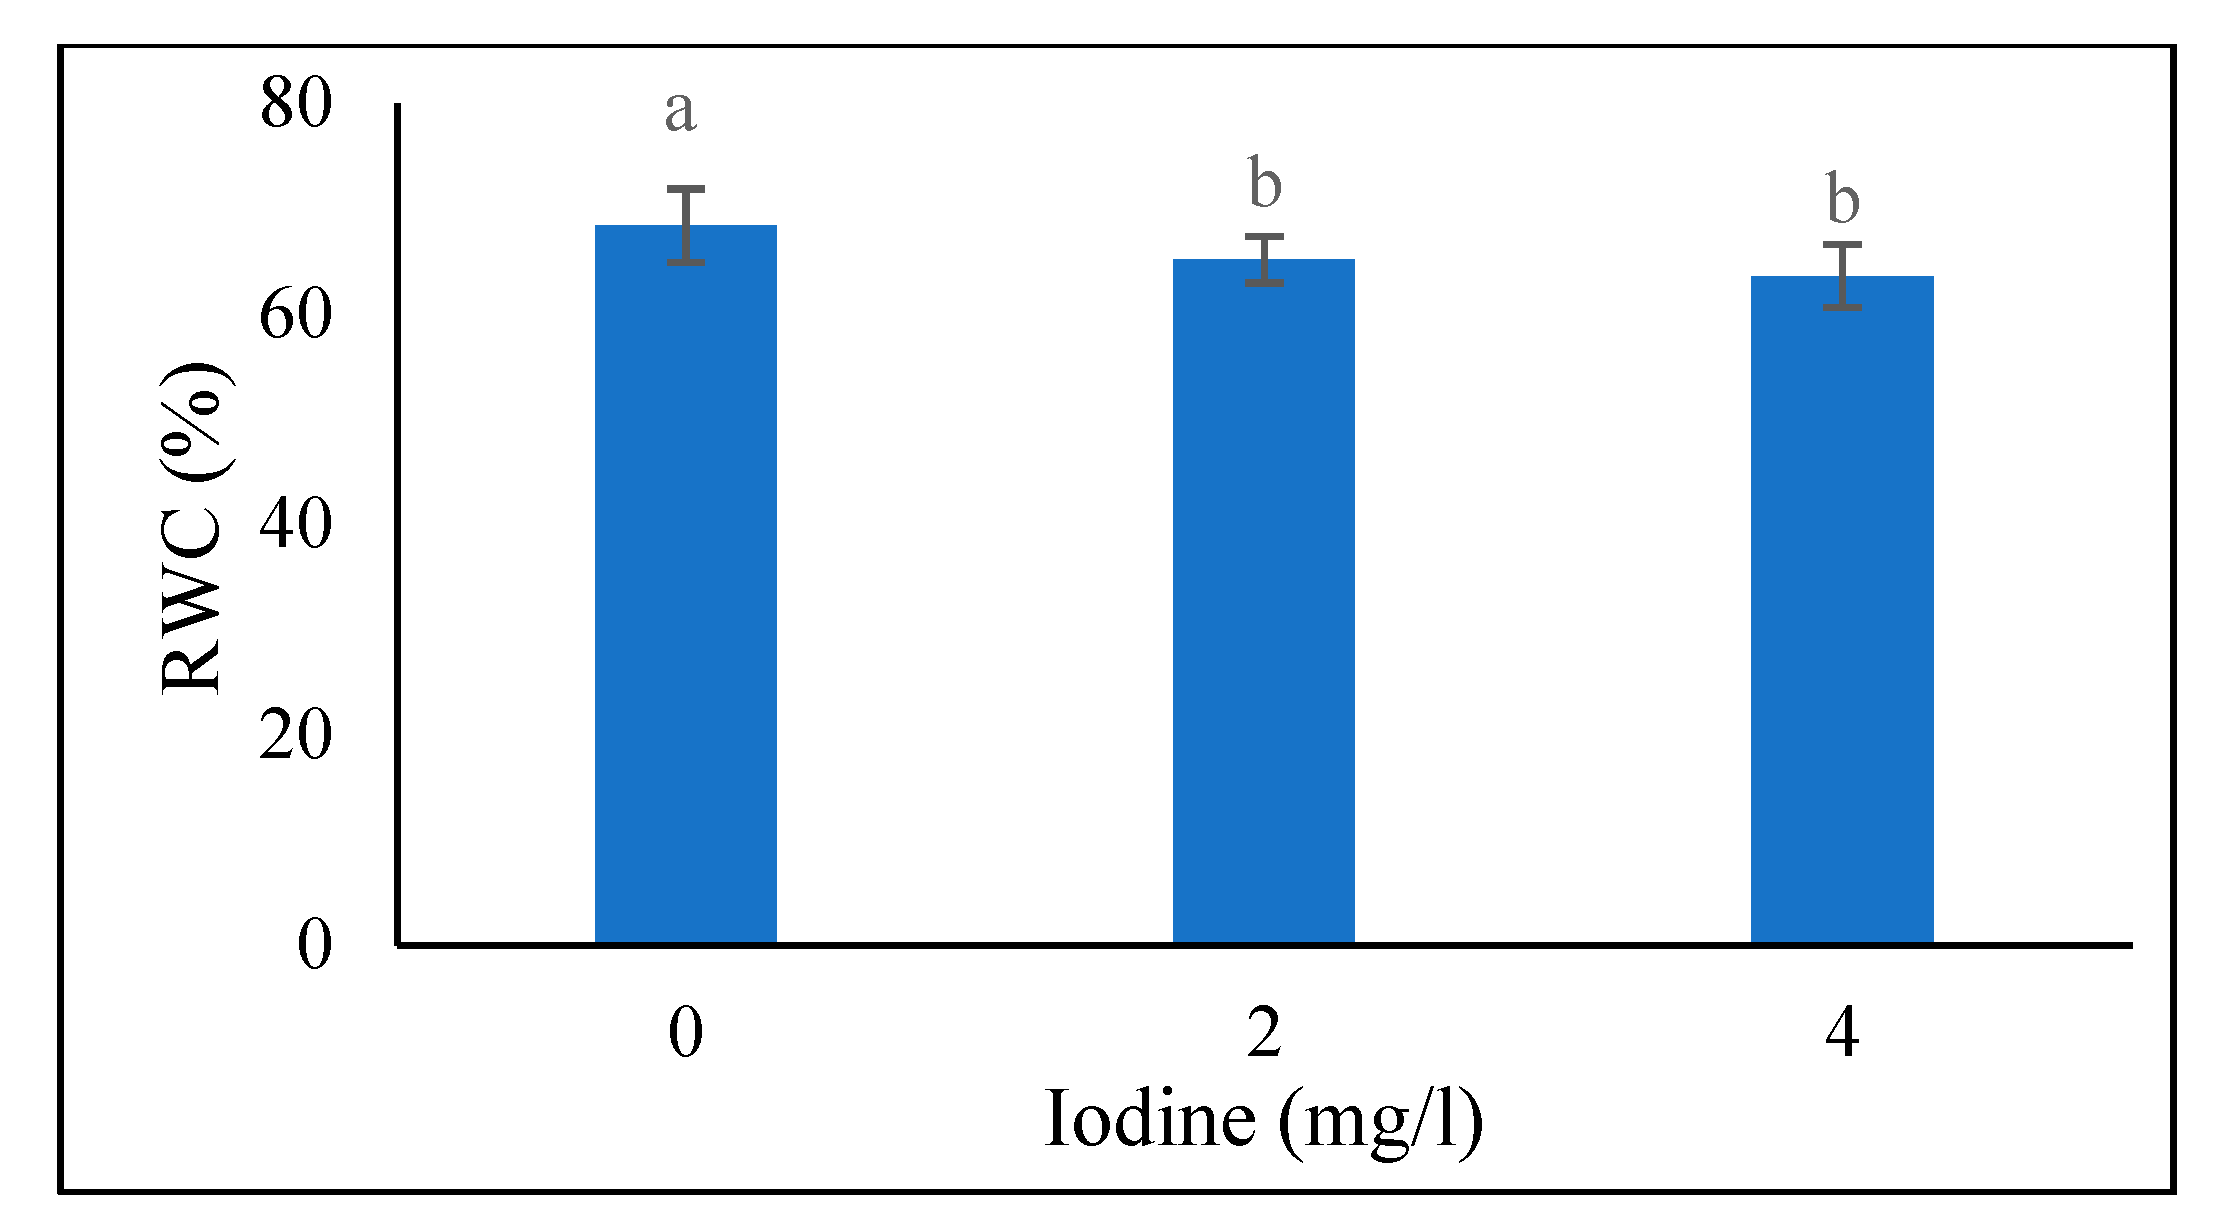
Figure 1, the highest (68.33%) RWC of the leaves at the 40-day stage was recorded in the 0 mg/l of iodine treatment, and also there is no a significant difference between the levels of 2 and 4 mg/l of iodine. The data from
Table 4 showed that in the supplementary blue light treatment, the highest RWC (72.66%) at the 40-day stage was related to the treatment of 4 mg/l of selenium, and also there is no significant difference (< 5%) between the 0 and 2 mg/l of selenium in this light treatment (blue light). In the control light (sunlight) treatment there was no significant difference between the levels of 0 and 4 mg/l of selenium. The results of RWC at the 80-day stage showed that the highest and lowest (54.07 and 46.63%) values were obtained in blue light and sunlight, respectively (
Table 3). The data from table 1 shows that the highest and lowest (54.22 and 44.16%) values of the RWC at the 80-day stage recorded in 4 and 0 mg/l of selenium, respectively.
Seed Yield
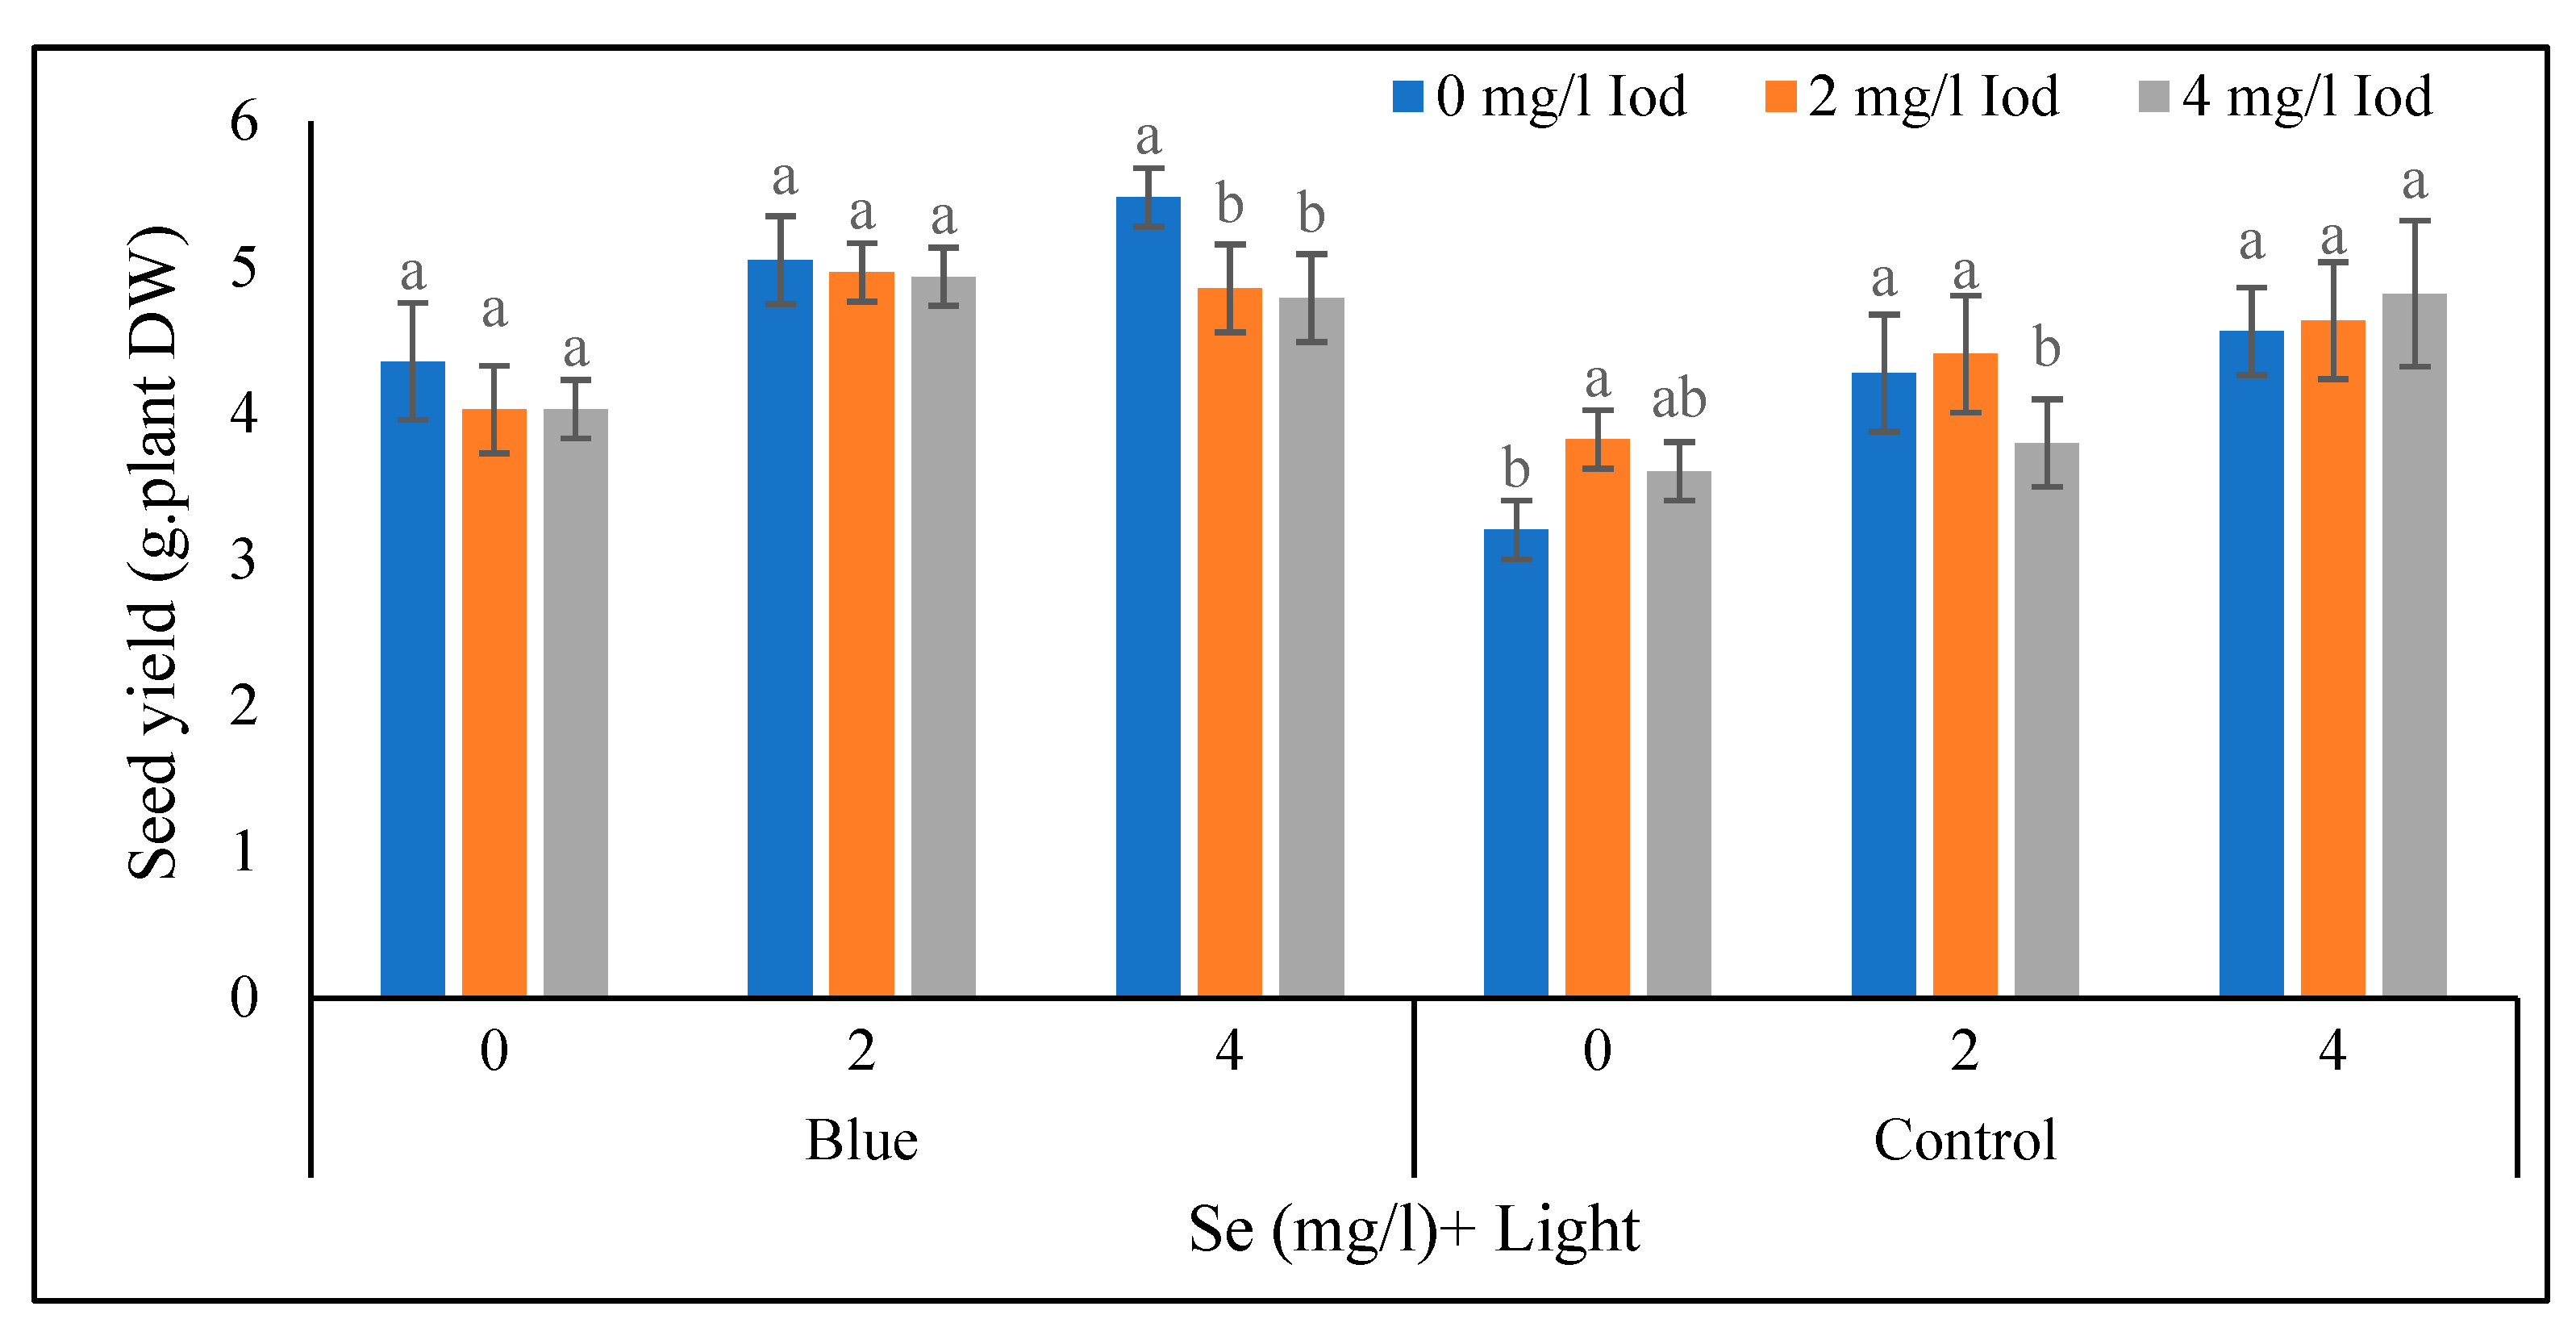
In the selenium control with supplementary blue light treatment, there was no significant difference (< 5%) in terms of seed yield between different iodine levels (
Figure 10). Also, in the blue light treatment with a selenium level of 2 mg/l, the various iodine levels had no significant influence on seed yield. Under the mentioned light conditions with a 4 mg/l of selenium, the highest (4.48 g/plant) seed yield was recorded in the iodine control level and no significant difference was detected between the levels of 2 and 4 mg/l of iodine. Under the conditions of sunlight with control level of selenium, the highest seed yield (2.82 g/plant) is obtained in 2 mg/l of iodine and there was no significant difference between levels of 2 and 4 mg/l of iodine. In the sunlight with 2 and 4 mg/l of selenium, no difference was observed between iodine levels of 0 and 2 mg/l (< 5%) (
Figure 10).
Vegetable Pigments
Total Leaf Chlorophyll
Under the both conditions of supplementary blue light and sunlight conditions, the highest and lowest (5.85 and 3.38 mg/g; 4.20 and 2.71 mg/g fresh weight of leaves) leaf chlorophyll content at the 40-day stage were noted in the treatment of 4 and 0 mg/l of selenium, respectively (
Table 4). Also, there was no significant difference between the iodine levels of 0 and 2 mg/l in combination with 0 mg/l of the selenium (
Table 6). Also, at the selenium level of 2 mg/l, the highest (4.54 mg/g) leaf chlorophyll amount at the 40-day stage was related to 4 mg/l of the iodine and also no significant difference was observed between iodine levels at the selenium level of 4 mg/l. The highest and lowest (3.49 and 2.69 mg/g) leaf chlorophyll values at the 80-day stage were obtained in supplementary blue light and sunlight treatments, respectively (
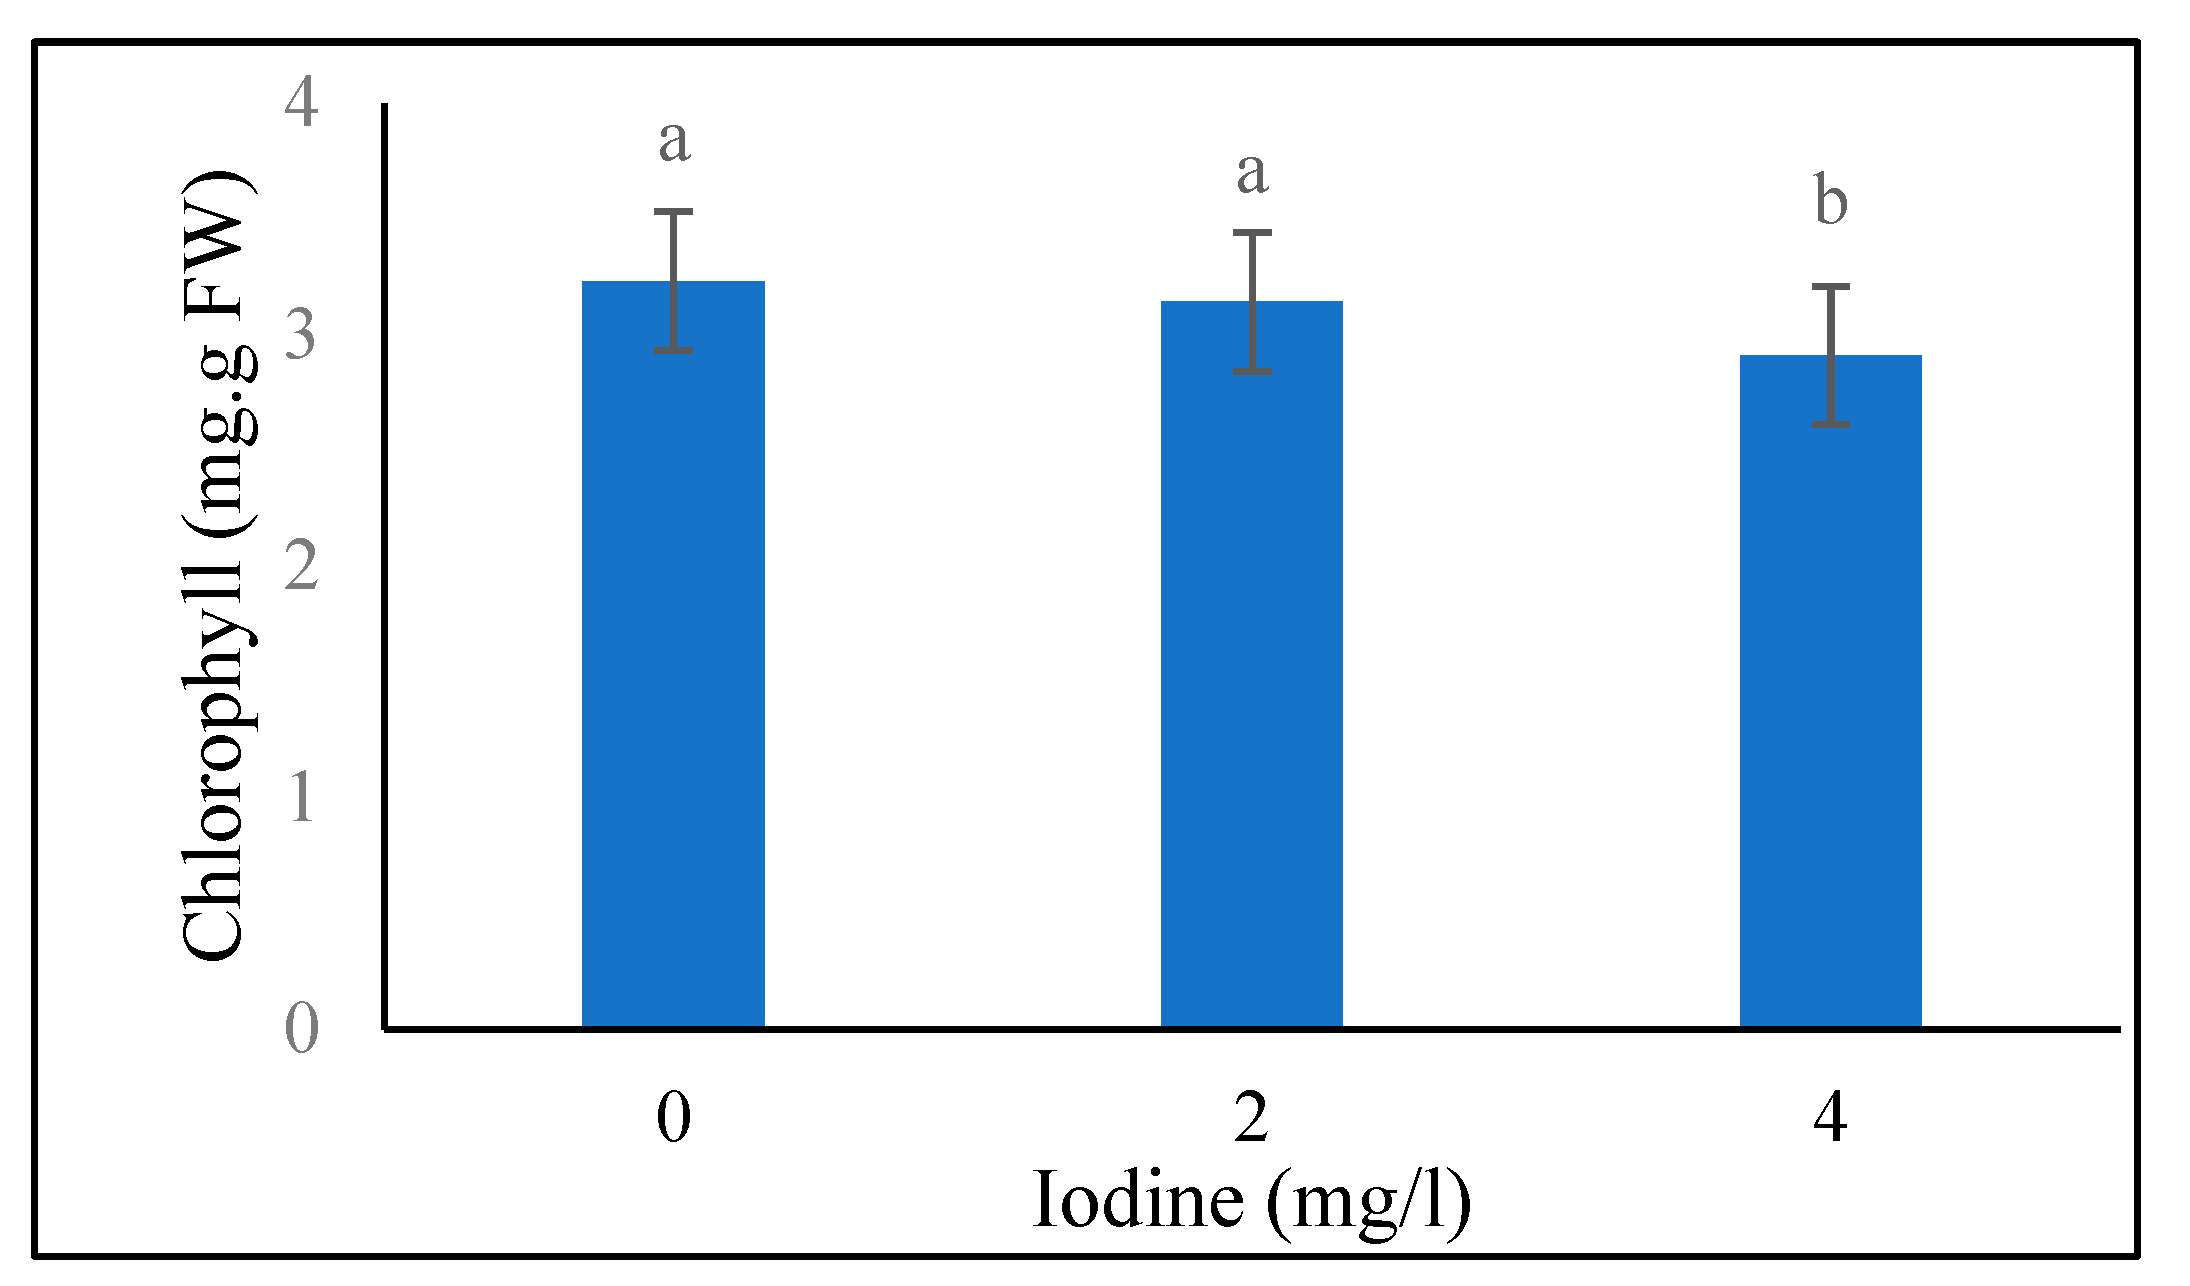
Table 3). Also, the data in table 1 shows that the highest and lowest (3.59 and 2.67 mg/g) leaf chlorophyll content at the 80-day stage were recorded at 4 and 0 mg/l selenium, respectively. No significant difference in leaf chlorophyll values at the 80-day stage was found between the levels of 0 and 2 mg/l of iodine (
Figure 2).
Leaf Anthocyanin
The highest and the lowest (5.24 mg/g and 4.76 mg/g fresh weight) leaf anthocyanin values at the 40-day stage are related to blue light and sunlight treatments, respectively (
Table 2) and the maximum and the lowest (5.85 and 3.68 mg/g fresh weight) leaf anthocyanin values at the 40-day stage are found at the 4 and 0 mg/l levels of selenium, respectively (
Table 1). According to table 3, the highest and the lowest (8.10 and 6.92 mg/g fresh weight) leaf anthocyanin contents at the 80-day stage were obtained in the supplementary blue light and sunlight treatments, respectively. The data in table 1 shows that the highest and the lowest (8.37 and 6.54 mg/g fresh weight) leaf anthocyanin levels at the 80-day stage are recorded at 4 and 0 mg/l of selenium, respectively (
Table 1).
Leaf Carotenoid
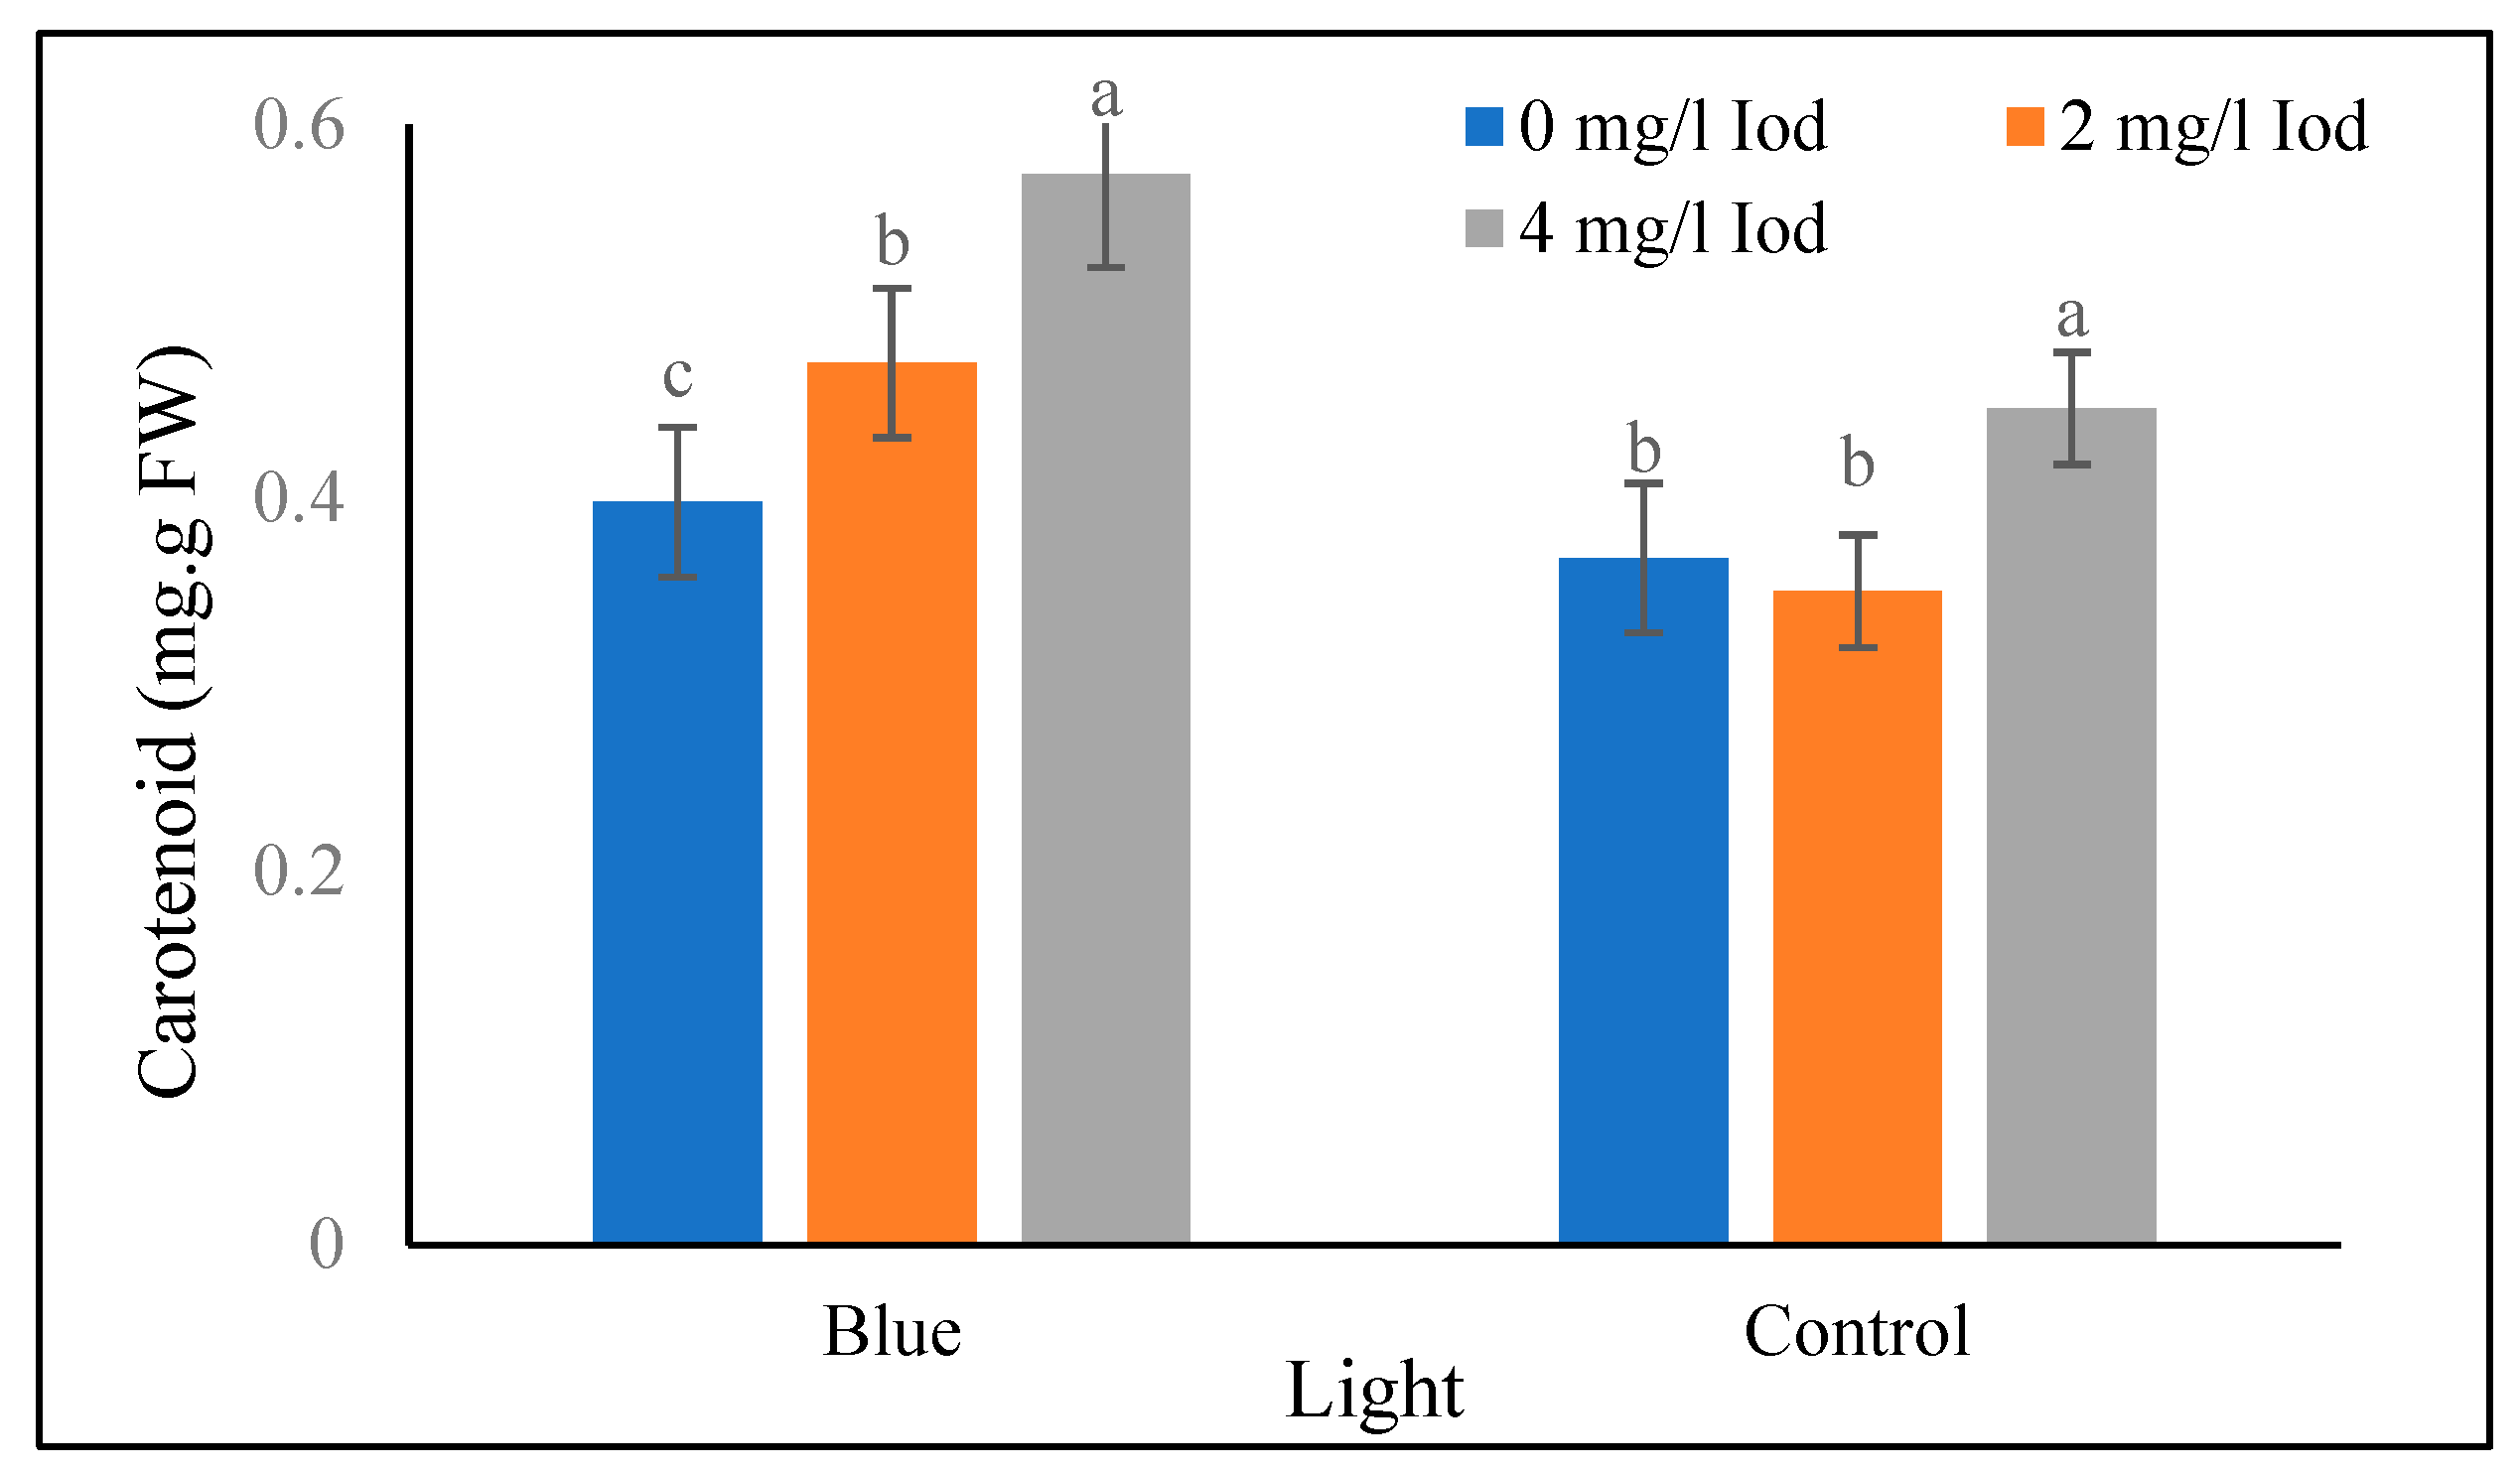
The data in table 1 shows that the highest and the lowest (0.54 and 0.34 mg/g fresh weight) leaf carotenoid values at the 40-day stage were obtained at 4 and 0 mg/l of selenium, respectively. Additionally, in the supplementary blue light treatment, the highest and the lowest (0.57 and 0.39 mg/g fresh weight) carotenoid values in the 40-day stage were recorded at iodine 4 and 0 mg/l, respectively. Under sunlight treatment, the highest and the lowest (0.44 and 0.35 mg/g fresh weight) leaf carotenoid values at the 40-day stage were related to iodine levels of 4 and 2 mg/l, respectively, and there was no significant difference between the levels of 0 and 2 mg/l iodine at the 40-days stage (
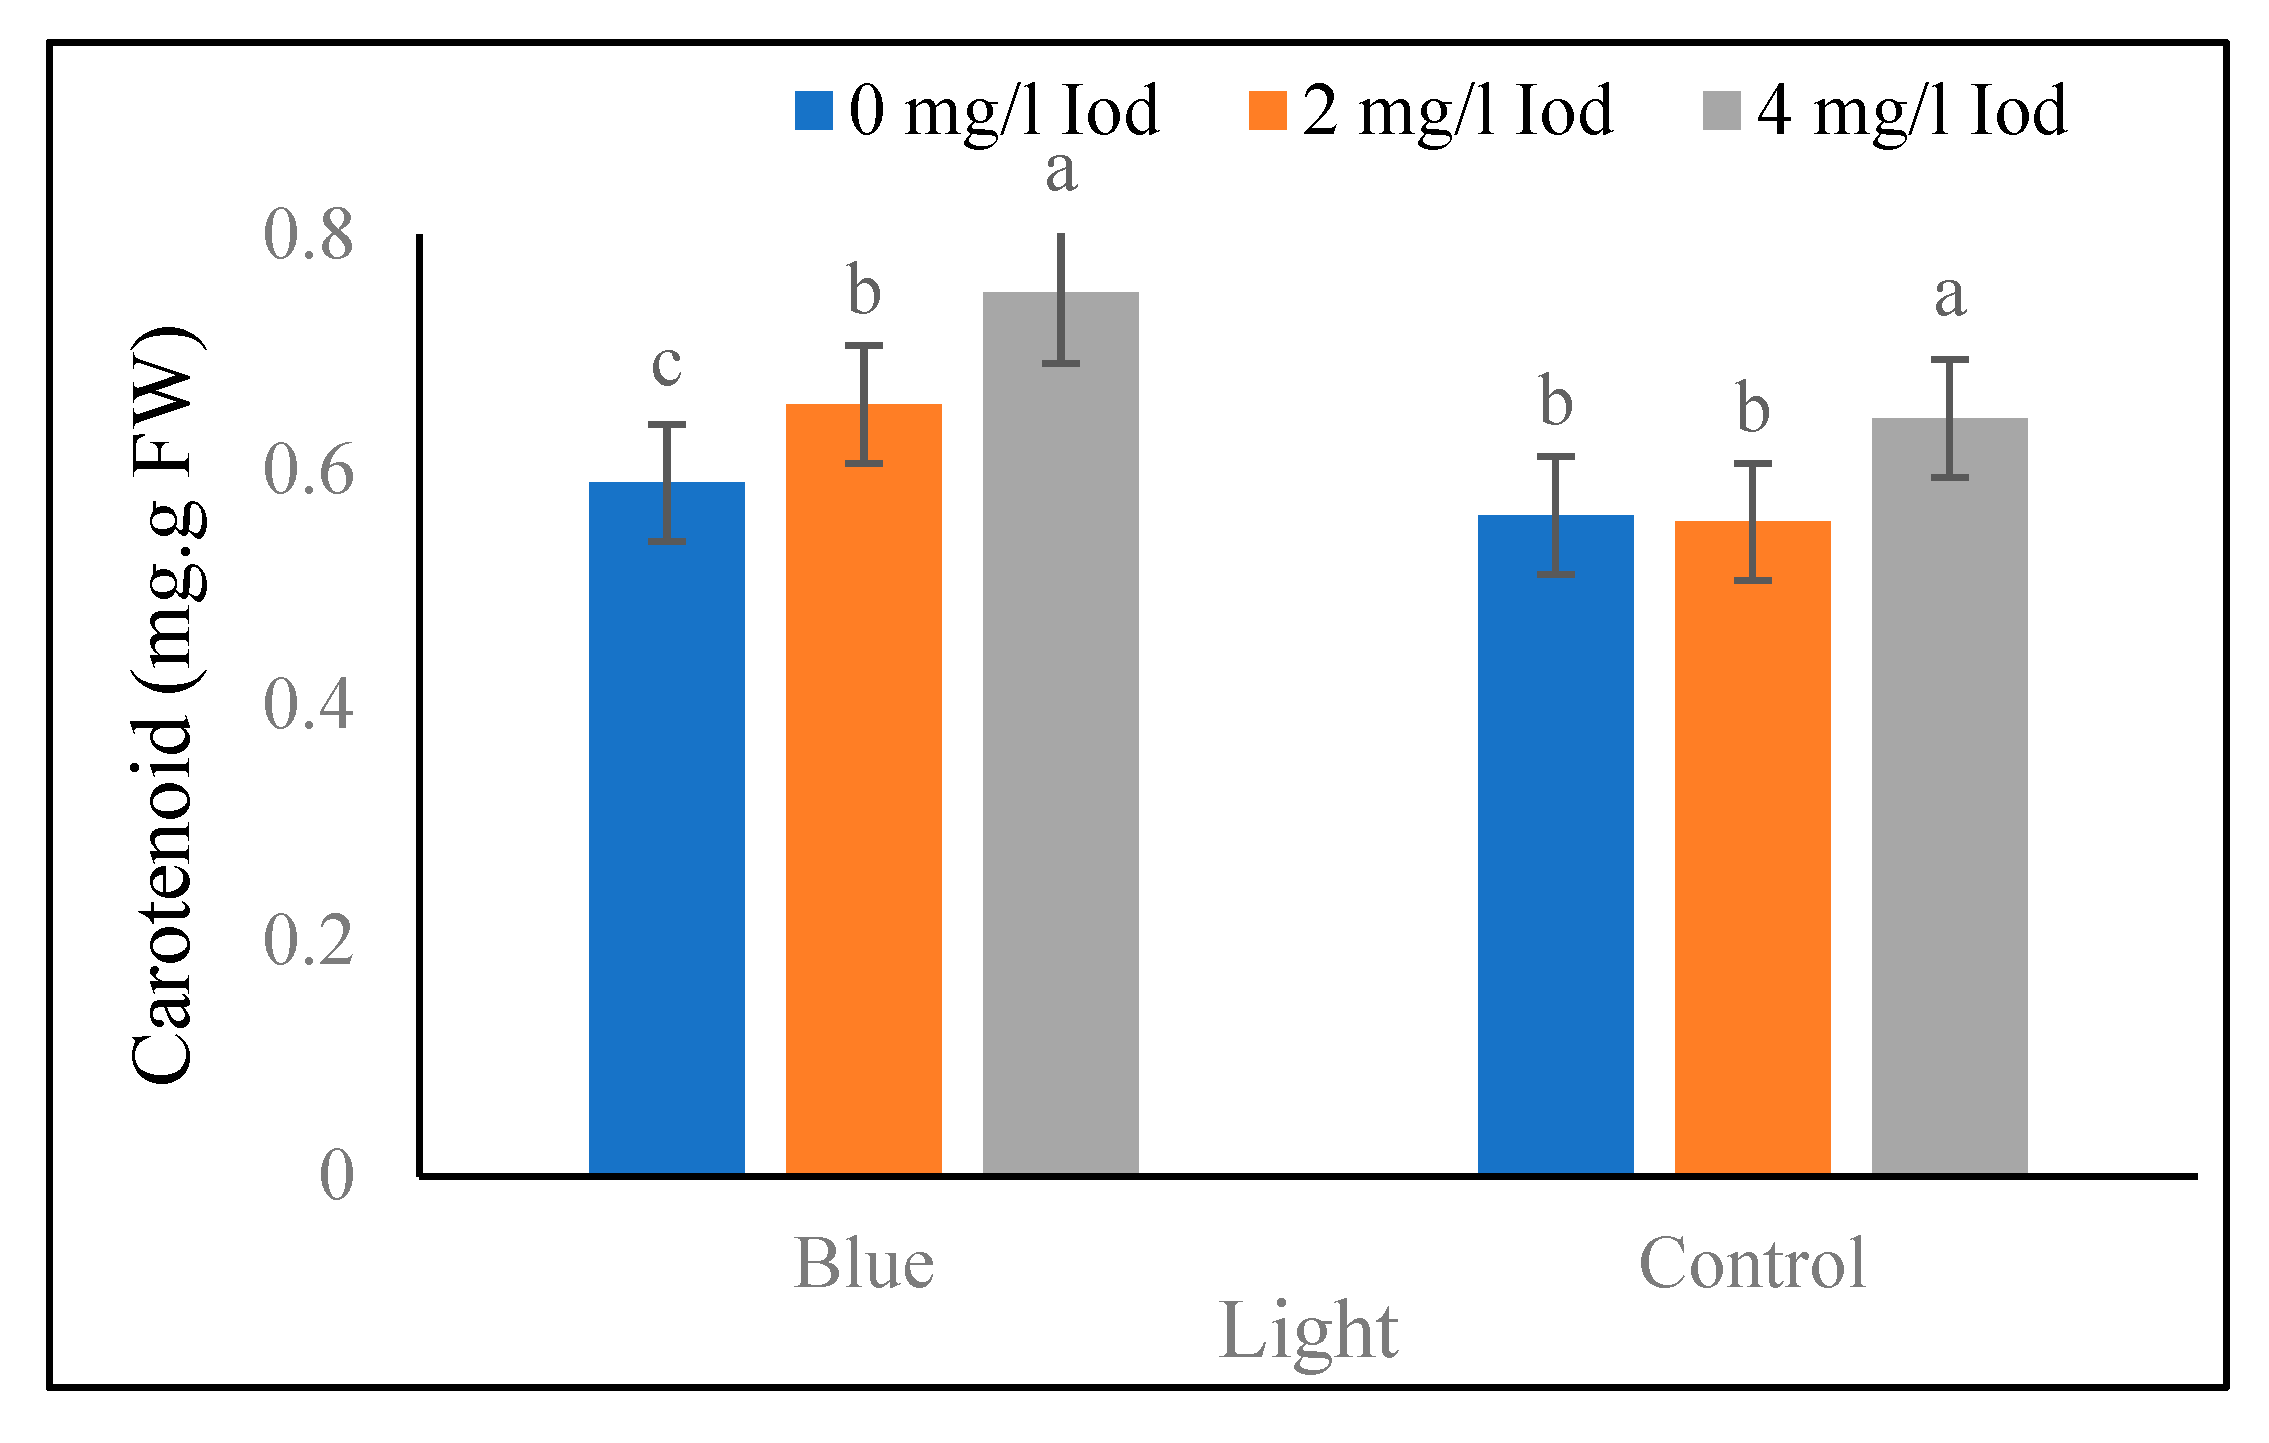
Figure 3). The data of the leaf carotenoid at the 80-day stage showed that under the blue light treatment, the highest and the lowest (0.75 and 0.58 mg/g fresh weight) leaf carotenoid values at the 80-day stage were found at the iodine levels of 4 and 0 mg/l, respectively. In addition to that, the highest and the lowest (0.64 and 0.55 mg/g fresh weight) carotenoid content of leaves in the sunlight treatment at the 80-days stage corresponded with iodine levels of 4 and 2 mg/l, respectively, and no significant difference was detected between iodine levels of 0 and 2 mg/l (
Figure 4).
Trigonelin Content of Shoot and Seed
Shoots Trigonelline Content
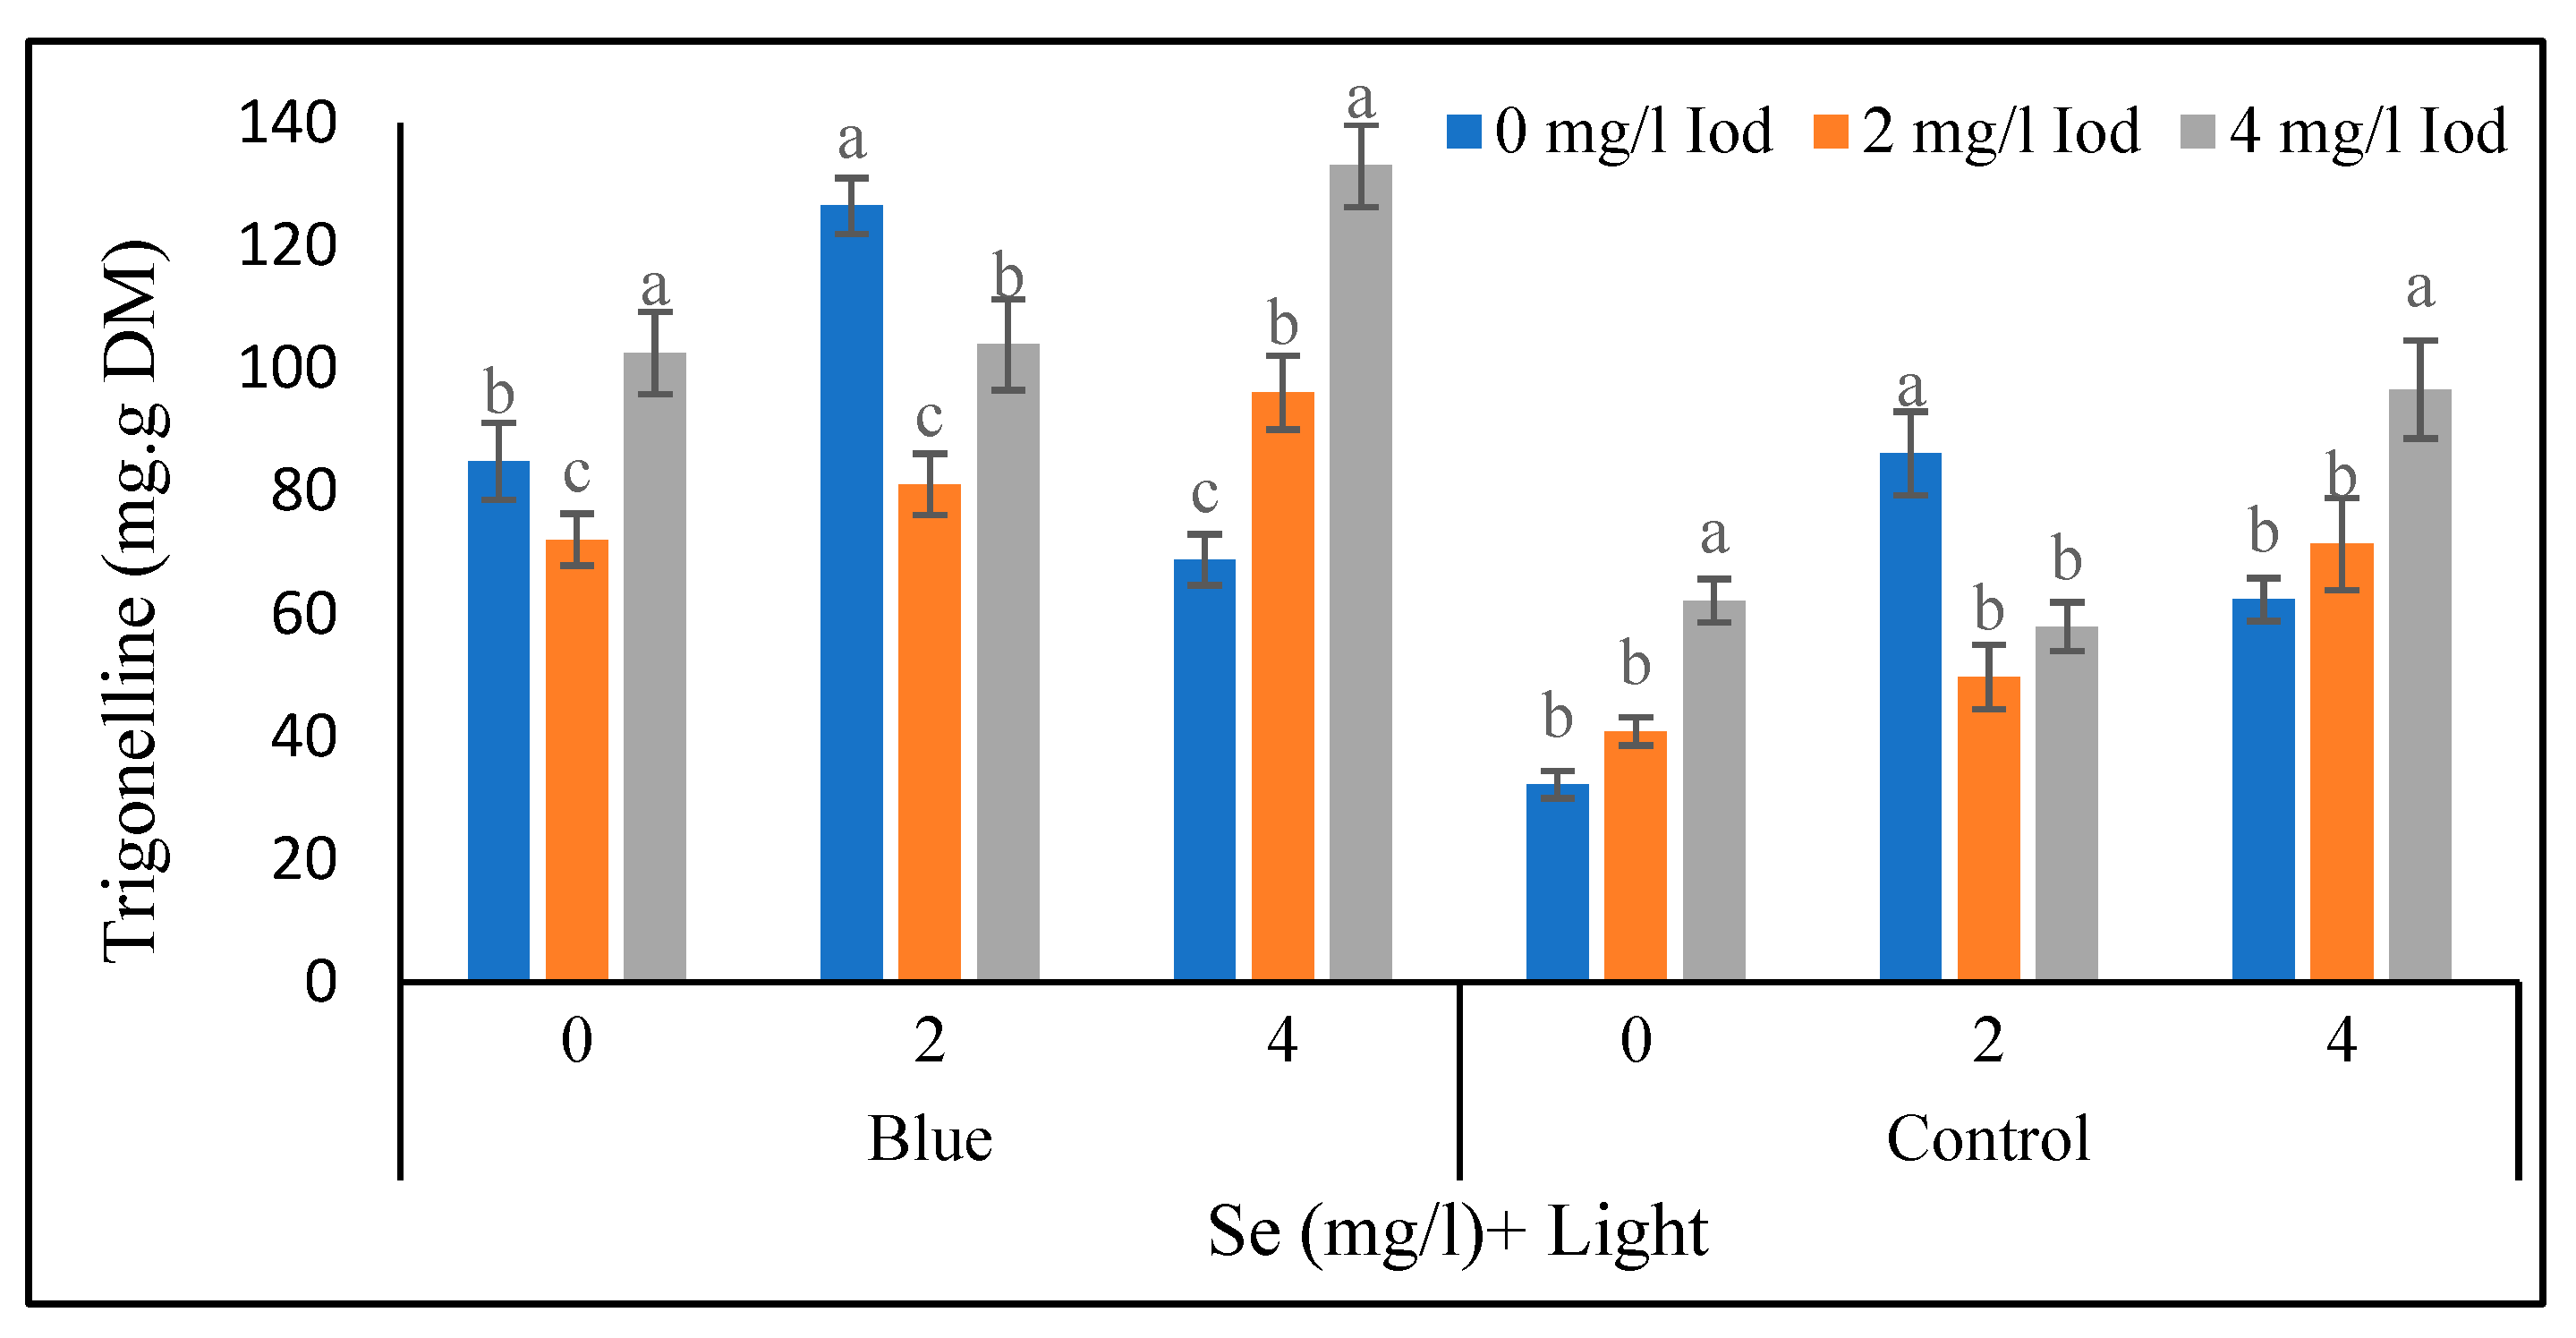
According to the
Figure 8, in the supplementary blue light and the 0 mg/l of selenium conditions, the highest and the lowest (102.56 and 72.14 mg/100 g fresh weight) trigonelline shoot contents were observed at 4 and 2 mg/l of iodine, respectively. Moreover, in the same light treatment with 2 mg/l of selenium, the highest and the lowest (126.51 and 81.18 mg/100 g fresh weight) amount of trigonelline in the shoot at the 40-day stage was recorded at the 0 and 2 mg/l of iodine, respectively. In the blue light treatment with 4 mg/l of the selenium, the highest and the lowest (133.10 and 68.88 mg/100 g fresh weight) trigonelline values at the 40-day stage corresponded with 4 and 0 mg/l of iodine, respectively. In the sunlight and 0 mg/l of selenium conditions, the highest and the lowest (62.19 and 32.22 mg/100 g fresh weight) amounts of trigonelline in the 40-day stage was noted at 4 and 0 mg/l of iodine, respectively and no significant difference was detected between 0 and 2 mg/l of iodine (< 5%). Under the mentioned light conditions with 2 mg/l of selenium, the highest and the lowest (86.18 and 49.75 mg/100 g fresh weight) content of trigonelline at the 40-day stage was recorded at 0 and 2 mg/l of iodine, respectively, and no significant difference was detected between iodine levels of 2 and 4 mg/l. In the control light (sunlight) and 4 mg/l of selenium, the highest and the lowest (60.96 and 62.38 mg/100 g fresh weight) amounts of trigonelline at the 40-day stage were observed at 4 and 0 mg/l of the iodine, respectively (
Figure 8). According to
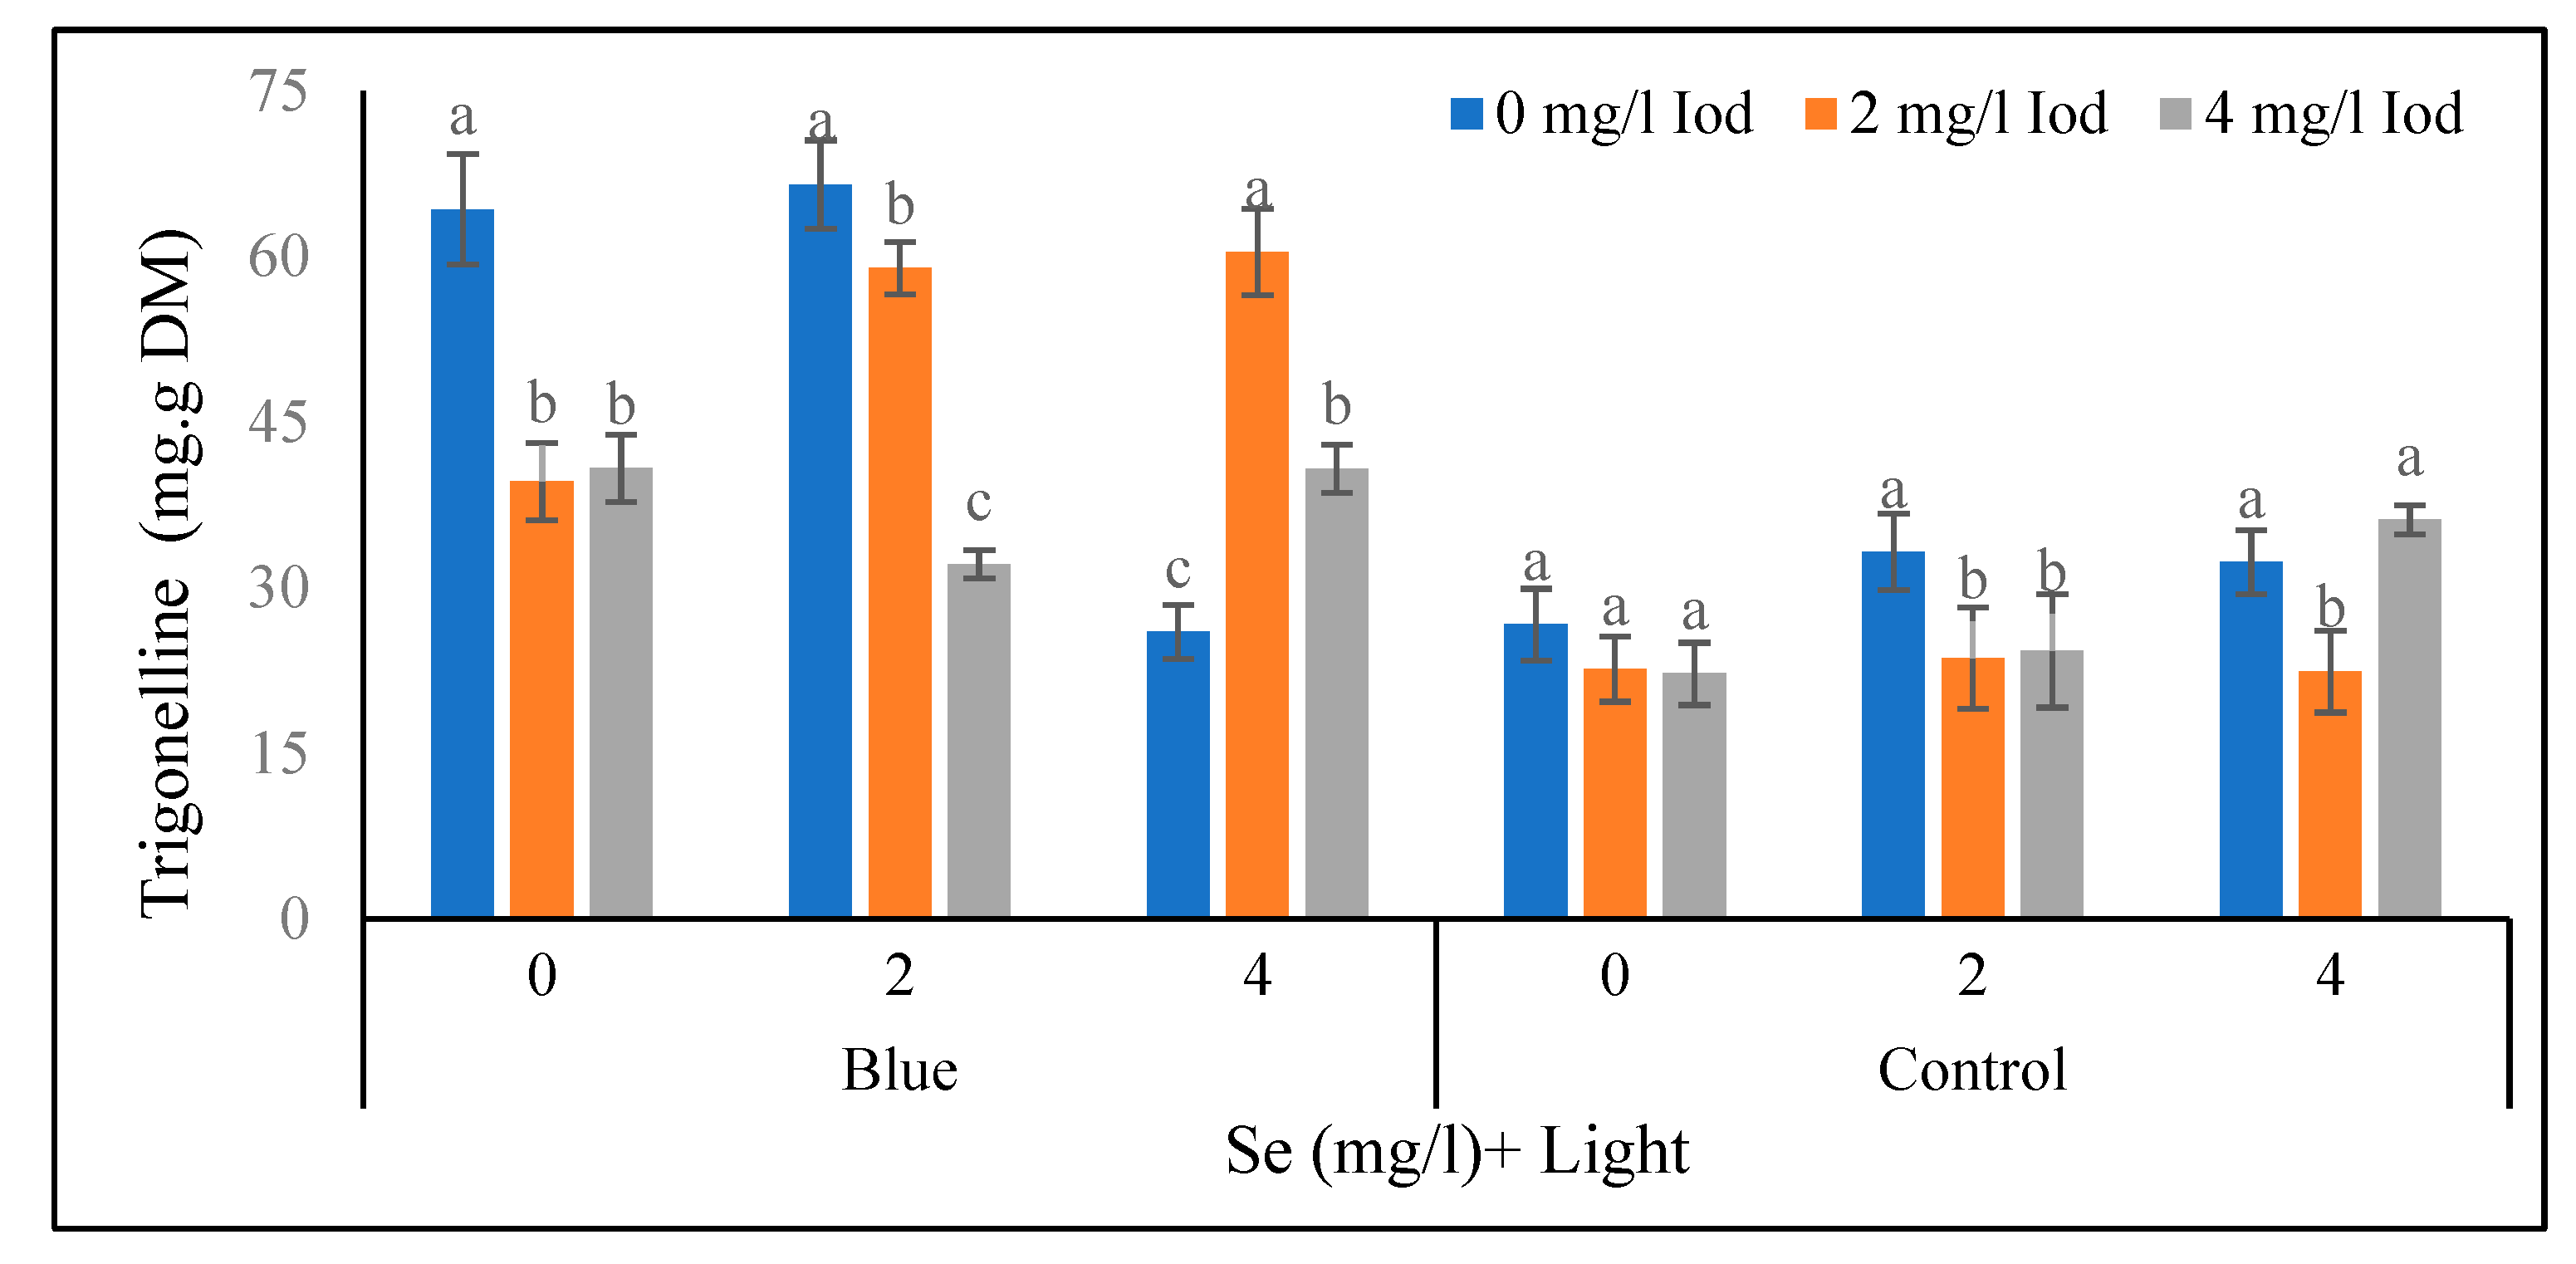
Figure 9, in the blue light treatment with 0 mg/l of iodine, the highest and the lowest (64.27 and 39.61 mg/100 g fresh weight) values of trigonelline at the 80-day stage corelated with 0 and 2 mg/l of iodine, respectively and no significant difference was found between the levels of 2 and 4 mg/l of iodine. In the mentioned light with 2 mg/l of selenium treatment, the maximum and the lowest (66.53 and 32.11 mg/100 g fresh weight) amounts of trigonelline in the 80-day stage was related to 0 and 4 mg/l of iodine. Furthermore, in blue light with 4 mg/l of selenium, the highest and the lowest (60.40 and 25.99 mg/100 g fresh weight) trigonelline content in the 80-day stage were obtained at 2 and 0 mg/l of iodine, respectively. On the other hand, in the sunlight with 0 mg/l of the selenium conditions, no significant difference between the iodine levels was detected. Additionally, in the mentioned light treatment with 2 mg/l of selenium, the highest and the lowest (33.25 and 23.62 mg/100 g fresh weight) contents of trigonelline at the 80-day stage was related to the 0 and 2 mg/l of iodine, respectively and there was no significant difference between the 2 and 4 mg/l levels of iodine (< 5%). Under the mentioned light treatment with 4 mg/l of selenium, the highest and the lowest (36.14 and 22.42 mg/100 g fresh weight) values of trigonelline at the 80-day stage was recorded at the 4 and 0 mg/l of iodine treatments, respectively so that no significant difference was observed between 0 and 4 mg/l of iodine (
Figure 9).
Seed Trigonelline Content
According to the data in
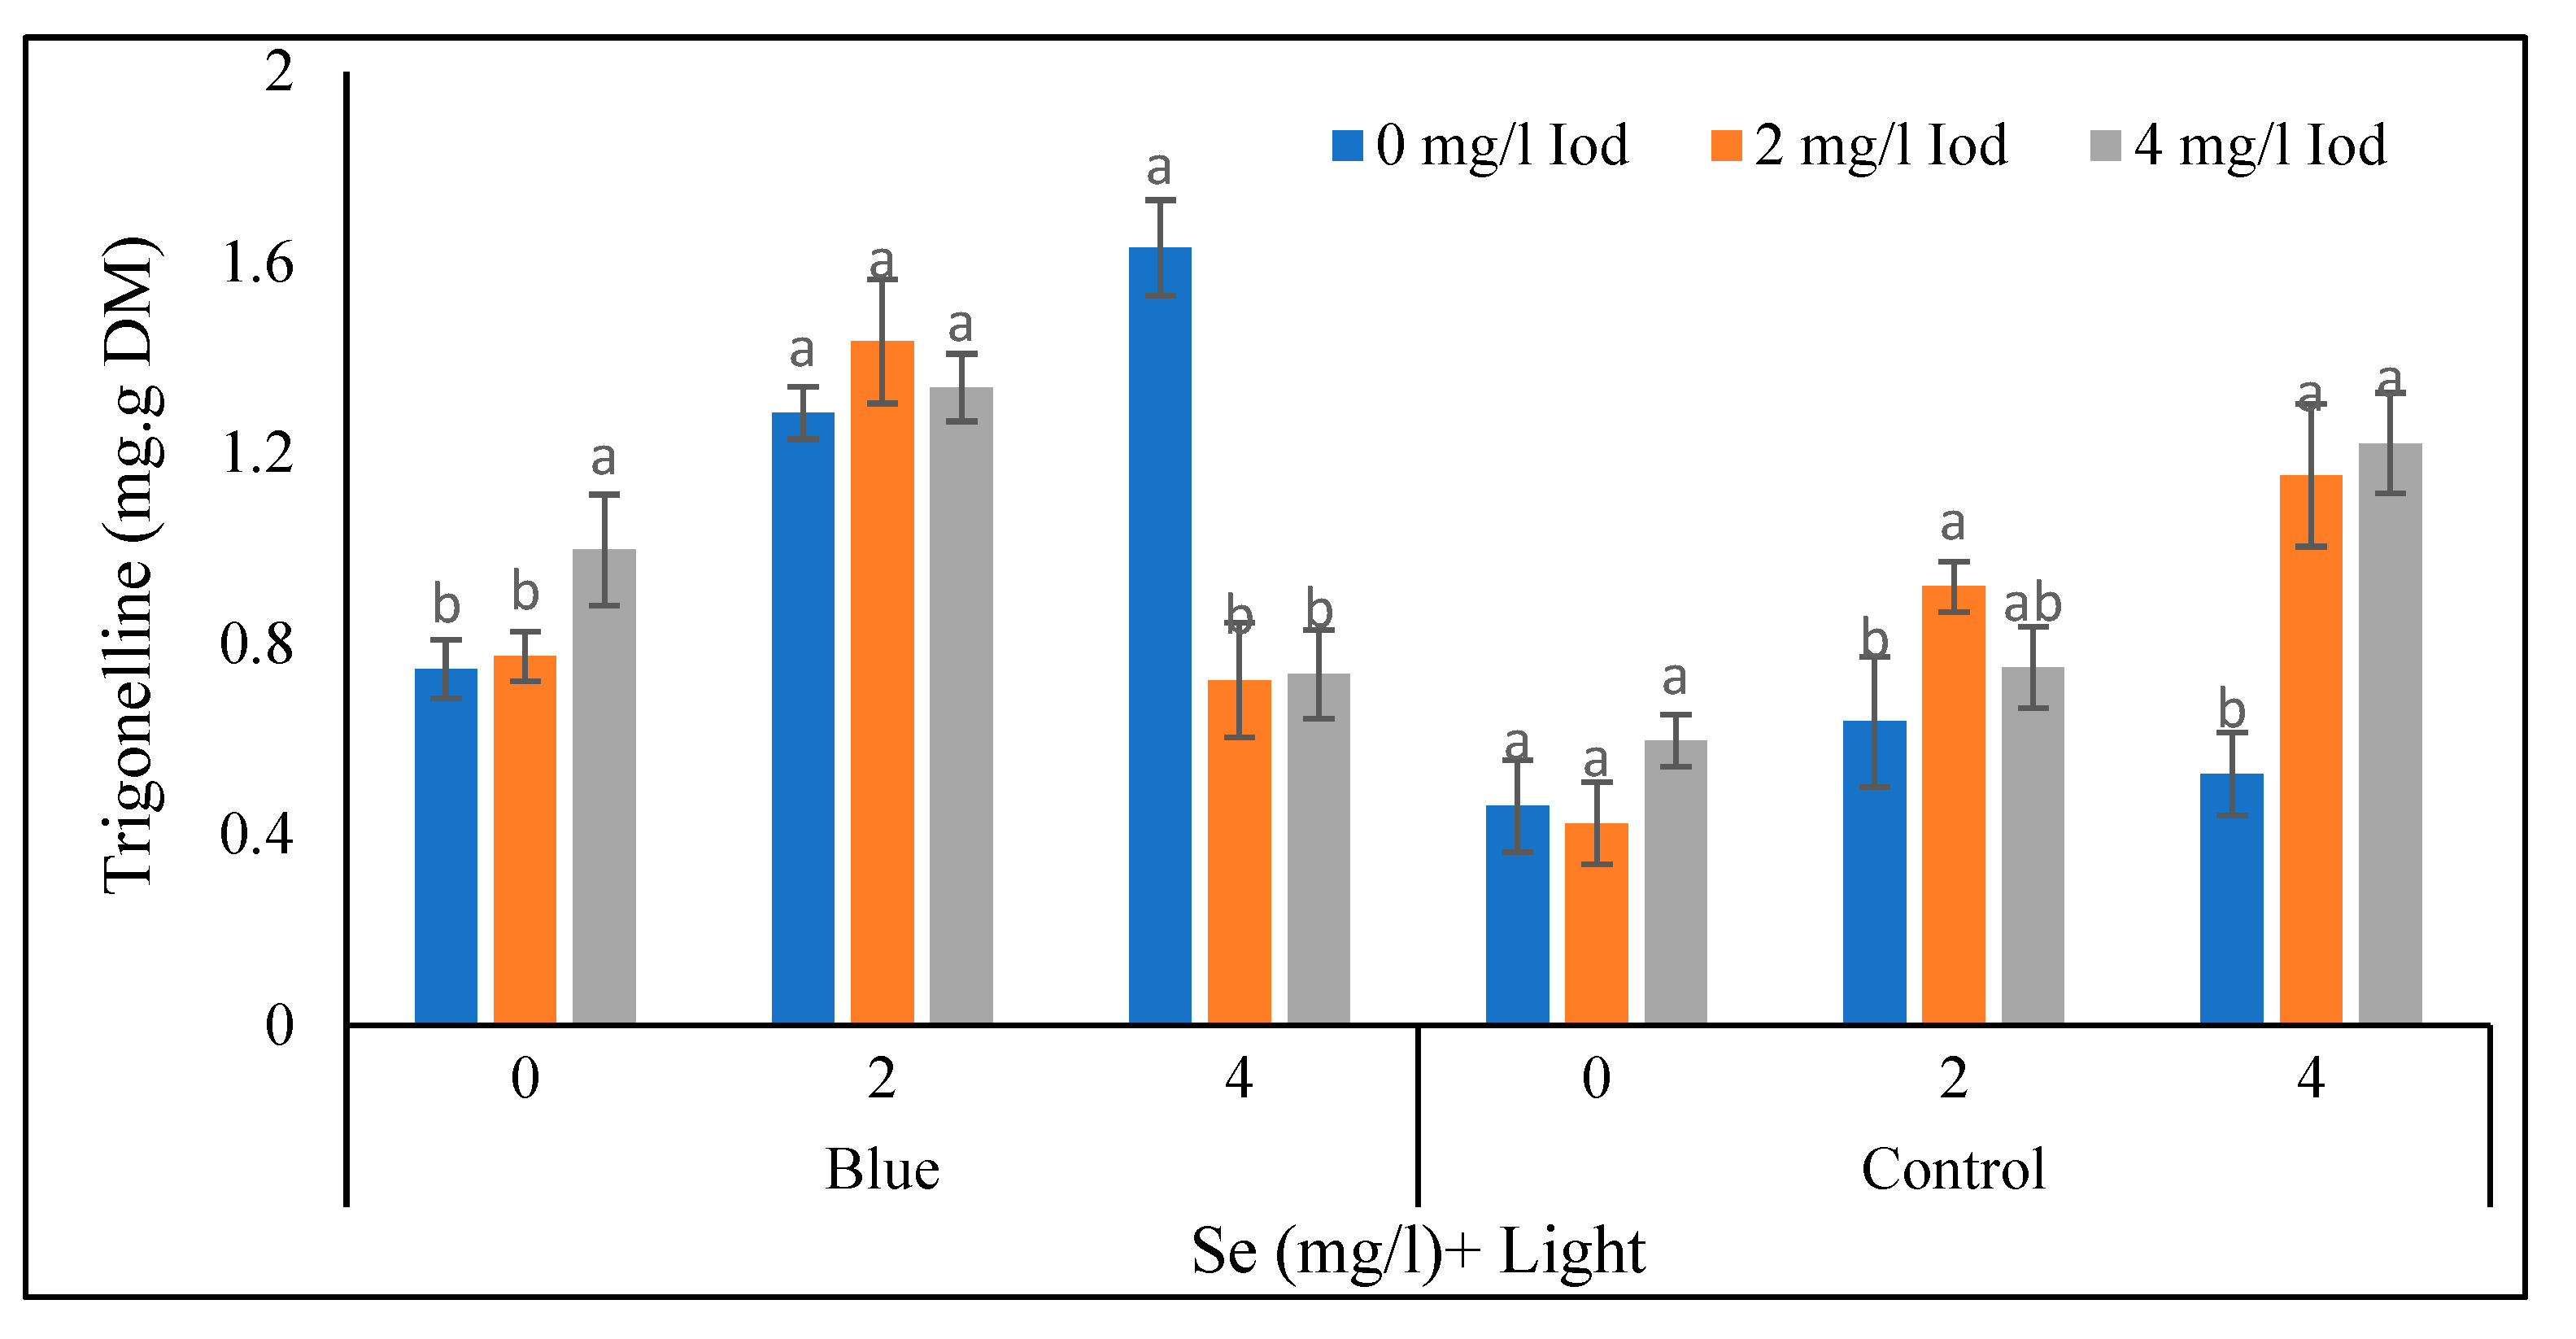
Figure 11, in the supplementary blue light with 0 mg/l of selenium treatment, the highest and the lowest (0.99 and 0.74 mg/g dry weight) seed trigonelline contents were related to the 4 and 0 mg/l of iodine, respectively. No significant difference was observed between the 0 and 2 mg/l levels of iodine (< 5%). Moreover, in the mentioned light and 2 mg/l of the selenium treatment, no significance difference was observed between iodine levels in terms of seed trigonelline content. In the blue light treatment and 4 mg/l of selenium, the highest and the lowest (1.63 and 0.72 mg/g dry weight) seed trigonelline values were corelated to 0 and 2 mg/l of iodine, respectively. Also, no significant difference was detected between 0 and 2 mg/l of iodine (< 5%). In the sunlight and 0 mg/l of selenium conditions, no significant difference was found between iodine levels. Under the mentioned light treatment and 2 mg/l of selenium, the highest and the lowest (0.92 and 0.63 mg/g of dry matter) seed trigonelline amounts were recorded in 2 and 0 mg/l levels of iodine, respectively., There was no significant difference between 2 and 4 mg/l levels of iodine. In the sunlight treatment, the highest and the lowest (1.22 and 0.52 mg/g dry matter) seed trigonelline values corresponded to the iodine level of 4 and 0 mg/l, respectively such that there was no significant difference between 2 and 4 mg/l of iodine (
Figure 11).
Discussion
Combined Effects of Light, Selenium and Iodine on Fenugreek Plant Growth Characteristics
It seems that blue light inhibits plant height but increases biomass weight. In research done by Rui et al. (2000) the total dry weight of edible broccoli sprouts increased significantly under the influence of selenium (100 micromoles per liter) and LED light, so that the highest dry weight of broccoli (edible sprouts) corresponded with selenium application combined with red and blue light treatment (1R:2B) (Rui et al., 2020). Blue light increases the photosynthetic capacity of the plant and consequently enhances plant growth (Li and Pan, 1995). It was found that in the hydroponic production of cabbage, adding iodine to the nutrient solution increases the dry weight of plant tissues (Gonnella et al., 2019). Increase in the dry matter of the plant aerial parts can be achieved by increasing the level of blue light (Nanya et al., 2012). In coriander , a higher ratio of dry and fresh mass accumulation was observed in different ratios of red and blue light compared to plants grown under 100% red light (Naznin et al., 2016). The issue of increasing the dry matter of the aerial branch can be ascribed to increment in the amount of blue light (Nanya et al., 2012). It seems that the blue light with its effect on the stomatal cells causes an increase in the force of absorption pressure in the vessels to move more water from the roots to the leaves and causes an increase in the RWC of the leaf. In fact, with the activation of the leaf stomatal guard cells and the opening of the stomatal cell, the transpiration force increases and its increase contributes to the flow of water tension in the xylem, and water and nutrients are absorbed from the roots at a faster rate and is transferred to the aerial organs of the plant, which consequently increases the water content of the leaves and aerial organs.
Combined Effects of Light, Selenium and Iodine on Fenugreek Plant Pigments
The highest amounts of total leaf chlorophyll in both the 40 and 80-day stages of growth were observed with supplementary blue light treatment, and also 4 mg/l of selenium increased the amount of total leaf chlorophyll. It can be explained that, the effects of blue light in the absorption of water and nutrients caused an increase in the greenness of the plant. Previous studies showed that total chlorophyll values of lettuce (Alsina et al., 2012) and broccoli (Ghasemi et al., 2016) increased under selenium treatment. Blue light increases the photosynthetic capacity of the plant and consequently the growth of the plant increases (Li and Pan, 1995). It seems that leaf chlorophyll levels increased due to the modulating effects of selenium. Moreover, in current research the highest amount of leaf anthocyanin in both stages is related to blue light treatment and 4 mg/l of selenium level. At the 80-day stage under the supplementary blue light, the maximum quantity of leaf carotenoids in the 80-day stage were recorded in the 4 mg/l of iodine. Preceding findings revealed that, total carotenoid values of edible broccoli sprouts were significantly increased under the influence of selenium (100 micromol/l) and LED light (Rui et al., 2020). Blue light can activate the expression of genes involved in the production of enzymes such as PAL (phenylalanine ammonia lyase), CHS (calcene synthase) and DFR (Dihydroflavonol-4-reductase), which are key elements in the biosynthetic pathways of anthocyanin compounds. (Son et al., 2012). In fact, stimulating the photoreceptors with a higher fraction of blue light, results in more signals being sent to the plant and the genes that are involved in the production of enzymes responsible for the biosynthesis of anthocyanins will increase. Furthermore, blue light can increase the carotenoids, anthocyanin content and leaf color (Mizuno et al., 2015). Selenium levels of 60 and 120 mg/l reduced the chlorophyll content of mint while increased the carotenoids (Oraghi Ardebili et al., 2015). Iodine is not essential for plants, although some studies showed that it plays a role in some physiological and biochemical processes in plants (Gonzali et al., 2017). Therefore, it seems that the iodine element is effective in some enzyme activities involved in the formation of plant pigments.
The Combined Effects of Light, Selenium and Iodine on the Trigonelline Content in Fenugreek Shoot and Seed
Generally, in the current research the trigonelline contents in fenugreek shoot and seed are highly variable under light, selenium and iodine treatments and also growth stage conditions. It has been proven that blue light can activate the expression of genes involved in the production of enzymes that are key elements in the biosynthetic pathways of medicinal secondary compounds (Son et al., 2012).
Combined Effects of Light, Selenium and Iodine on Fenugreek Seed Yield
Under supplementary blue light treatment with application of 4 mg/l selenium, the highest values of seed yield per plant were observed in the control level of iodine. Under sunlight conditions with the control level of selenium, the maximum seed yield was recorded in 2 mg/l of iodine. It seems that due to the effects of supplementary blue light on plant growth and the stimulation of the production of secondary metabolites, as well as the role of the selenium element in the plant, it is logical to justify the performance of the seed yield of the plants that were subjected to these treatments.
Conclusions
The overall results showed that the highest shoot dry weight values were observed at the 80-day stage under supplementary blue light conditions at a selenium level of 0 mg/l, and the highest total leaf chlorophyll values were found at both the 40 and 80-day stages under the blue light treatment. Moreover, the highest amounts of leaf anthocyanin in both growth stages were related to supplementary blue light and 4 mg/l of selenium. In the blue light treatment at a selenium level of 0 mg/l, the highest content of shoot trigonelline was observed at 4 mg/l of iodine; and in the blue light treatment with 4 mg/l of selenium, the highest value of seed trigonelline was recorded at 0 mg/l of iodine. Additionally, under the conditions of blue light treatment with 4 mg/l of selenium, the highest quantity of seed yield per plant were related to control iodine level.
Acknowledgment
This research was funded by the RUDN University Scientific Grant System (project № 202193-2-000).
Conflicts of Interest
The authors declare no conflict of interest.
References
- Allen, L.; de Benoist, D.; Dary, O.; Hurrell, R. Guidelines on Food Fortification with Micronutrients Geneva: World Health Organization.2006. Available online: http://www.who.int/iris/handle/10665/43412 (accessed on 13 November 2020).
- Alsiņa, I.; Dubova, L.; Smiltiņa, Z.; Stroksa, L.; Dūma, M. The effect of selenium on yield quality of lettuce. Acta Hortic. 2012, 939, 269–275. [Google Scholar] [CrossRef]
- Badi, H.N.; Mehrafarin, A.; Mustafavi, S.H.; Labbafi, M. Exogenous arginine improved fenugreek sprouts growth and trigonelline production under salinity condition. Ind. Crop. Prod. 2018, 122, 609–616. [Google Scholar] [CrossRef]
- Brazaitytė, A.; Miliauskienė, J.; Vaštakaitė-Kairienė, V.; Sutulienė, R.; Laužikė, K.; Stašytė, K.; Duchovskis, P.; Samuolienė, G. The Response of Baby Leaf Lettuce to Selenium Biofortifica-tion under Different Lighting Conditions. Biol. Life Sci. Forum 2021, 3, 10. [Google Scholar]
- Chanwitheesuk, A.; Teerawutgulrag, A.; Rakariyatham, N. Screening of antioxidant activity and antioxidant compounds of some edible plants of Thailand. Food Chem. 2005, 92, 491–497. [Google Scholar] [CrossRef]
- Costa, D.C.; Costa, H.S.; Albuquerque, T.G.; Ramos, F.; Castilho, M.C.; Sanches-Silva, A. Advances in phenolic compounds analysis of aromatic plants and their potential applications. Trends Food Sci. Technol. 2015, 45, 2236–2254. [Google Scholar] [CrossRef]
- El-Ramady, H.; Abdalla, N.; Alshaal, T.; El-Henawy, A.; Faizy, S.E.-D.A.; Shams, M.S.; Domokos-Szabolcsy, E. Selenium and Its Role in Higher Plants; Springer International Publishing: Cham, Switzerland, 2015; pp. 235–296. [Google Scholar]
- El-Ramady, H.; Abdalla, N.; Taha, H.S.; Alshaal, T.; El-Henawy, A.; Faizy, S.E.; Shams, M.S.; Youssef, S.M.; Shalaby, T.; Bayoumi, Y.; et al. Selenium and nano-selenium in plant nutrition. Environ. Chem. Lett. 2016, 14, 123–147. [Google Scholar] [CrossRef]
- Ferrarese, M.; Sourestani, M.; Quattrini, E.; Schiavi, M.; Ferrante, A. Biofortification of Spinach Plants APPLYING Selenium in the Nutrient Solution of Floating System. J. Fruit Ornam. Plant Res. 2012, 76, 127–136. [Google Scholar] [CrossRef]
- Gerovac, J.R.; Craver, J.K.; Boldt, J.K.; Lopez, R.G. Light Intensity and Quality from Sole-source Light-emitting Diodes Impact Growth, Morphology, and Nutrient Content of Brassica Microgreens. HortScience 2016, 51, 497–503. [Google Scholar] [CrossRef]
- Ghasemi, Y.; Ghasemi, K.; Pirdashti, H.; Asgharzadeh, R. Effect of selenium enrichment on the growth, photosynthesis and mineral nutrition of broccoli. Not. Sci. Biol. 2016, 8, 199–203. [Google Scholar] [CrossRef]
- Gonnella, M.; Renna, M.; D’imperio, M.; Santamaria, P.; Serio, F. Iodine Biofortification of Four Brassica Genotypes is Effective Already at Low Rates of Potassium Iodate. Nutrients 2019, 11, 451–465. [Google Scholar] [CrossRef]
- Gonzali, S.; Kiferle, C.; Perata, P. Iodine biofortification of crops: agronomic biofortification, metabolic engineering and iodine bioavailability. Curr. Opin. Biotechnol. 2017, 44, 16–26. [Google Scholar] [CrossRef] [PubMed]
- Gratani, L. A non-destructive method to determine chlorophyll content of leaves. Photosynthetica 1992, 26, 469–473. [Google Scholar]
- Hernández, R.; Kubota, C. Physiological responses of cucumber seedlings under different blue and red photon flux ratios using LEDs. Environ. Exp. Bot. 2016, 121, 66–74. [Google Scholar] [CrossRef]
- Hogewoning, S.W.; Trouwborst, G.; Maljaars, H.; Poorter, H.; van Ieperen, W.; Harbinson, J. Blue light dose-responses of leaf photosynthesis, morphology, and chemical composition of Cucumis sativus grown under different combinations of red and blue light. J. Exp. Bot. 2010, 61, 3107–3117. [Google Scholar] [CrossRef]
- Ieperen, V.W. and Trouwborst, G. 2008. The application of LEDs as assimilation light source in greenhouse horticulture: a simulation study. Acta Hort, 33: 407–141.
- Jerše, A.; Kacjan Marši´c, N.; Krofliˇc, A.; Germ, M.; Šircelj, H.; Stibilj, V. Is foliar enrichment of pea plants with iodine and selenium appropriate for production of functional food. Food Chem. 2018, 267, 368–375. [Google Scholar] [CrossRef] [PubMed]
- Kopsell, D.A.; Pantanizopoulos, N.I.; Sams, C.E.; Kopsell, D.E. Shoot tissue pigment levels increase in “Florida Broadleaf” mustard (Brassica juncea L.) microgreens following high light treatment. Sci. Hortic. 2012, 140, 96–99. [Google Scholar] [CrossRef]
- Krzepiłko, A.; Pra ˙zak, R.; Skwaryło-Bednarz, B.; Molas, J. Agronomic biofortifcation as a means of enriching plant foodstufs with iodine. Acta Agrobot. 2019, 72, 1–9. [Google Scholar] [CrossRef]
- Lee, G.J.; Kang, B.K.; Kim, T.I.; Kim, T.J.; Kim, J.H. Effects of different selenium concentrations of the nutrient solution on the growth and quality of tomato fruit in hydroponics. Acta Hortic. 2007, 761, 443–448. [Google Scholar] [CrossRef]
- Li, S.; Pan, R.C. Effect of blue light on the metabolism of carbohydrate and protein in rice (Oryza sativa L.) seedlings. Acta Phytophisiol. Sin. 1995, 21, 22–28. [Google Scholar]
- Mechora. ; Stibilj, V.; Kreft, I.; Germ, M. The Physiology and Biochemical Tolerance of Cabbage to Se (VI) Addition to the Soil and by Foliar Spraying. J. Plant Nutr. 2014, 37, 2157–2169. [Google Scholar] [CrossRef]
- Mizuno, T. , Amaki, W. and Watanabe, H. 2011. Effects of monochromatic light irradiation by LED on the growth and anthocyanin contents in laves of cabbage seedlings. Acta Hortic. 2011, 907, 179–184. [Google Scholar]
- Nanya, K.; Ishigami, Y.; Hikosaka, S.; Goto, E. Effects of blue and red light on stem elongation and flowering of tomato seedlings. Acta Hortic. 2012, 261–266. [Google Scholar] [CrossRef]
- Naznin, M.; Lefsrud, M.; Gravel, V.; Hao, X. Different ratios of red and blue LED light effects on coriander productivity and antioxidant properties. Acta Hortic. 2016, 223–230. [Google Scholar] [CrossRef]
- Ardebili, Z.O.; Ardebili, N.O.; Jalili, S.; Safiallah, S. The modified qualities of basil plants by selenium and/or ascorbic acid. Turk. J. Bot. 2015, 39, 401–407. [Google Scholar] [CrossRef]
- Puccinelli, M.; Malorgio, F.; Incrocci, L.; Rosellini, I.; Pezzarossa, B. Effects of Individual and Simultaneous Selenium and Iodine Biofortification of Baby-Leaf Lettuce Plants Grown in Two Different Hydroponic Systems. Horticulturae 2021, 7, 590. [Google Scholar] [CrossRef]
- Qian, H.; Liu, T.; Deng, M.; Miao, H.; Cai, C.; Shen, W.; Wang, Q. Effects of light quality on main health-promoting compounds and antioxidant capacity of Chinese kale sprouts. Food Chem. 2016, 196, 1232–1238. [Google Scholar] [CrossRef]
- Rayman, M.P. The importance of selenium to human health. Lancet 2000, 356, 233–241. [Google Scholar] [CrossRef]
- Ritchie, S.W.; Nguyen, H.T.; Holaday, A.S. Leaf Water Content and Gas-Exchange Parameters of Two Wheat Genotypes Differing in Drought Resistance. Crop. Sci. 1990, 30, 105–111. [Google Scholar] [CrossRef]
- He, R.; Gao, M.; Shi, R.; Song, S.; Zhang, Y.; Su, W.; Liu, H. The Combination of Selenium and LED Light Quality Affects Growth and Nutritional Properties of Broccoli Sprouts. Molecules 2020, 25, 4788. [Google Scholar] [CrossRef]
- Santhosh Kumar, B.; Priyadarsini, K.I. Selenium nutrition: How important is it? Biomed. Prev. Nutr. 2014, 4, 333–341. [Google Scholar] [CrossRef]
- Schiavon, M.; Berto, C.; Malagoli, M.; Trentin, A.; Sambo, P.; Dall'Acqua, S.; Pilon-Smits, E.A.H. Selenium Biofortification in Radish Enhances Nutritional Quality via Accumulation of Methyl-Selenocysteine and Promotion of Transcripts and Metabolites Related to Glucosinolates, Phenolics, and Amino Acids. Front. Plant Sci. 2016, 7, 1371. [Google Scholar] [CrossRef] [PubMed]
- Schomburg, L.; Köhrle, J. On the importance of selenium and iodine metabolism for thyroid hormone biosynthesis and human health. Mol. Nutr. Food Res. 2008, 52, 1235–1246. [Google Scholar] [CrossRef] [PubMed]
- Shin, Y.-S.; Lee, M.-J.; Lee, E.-S.; Ahn, J.-H.; Do, H.-W.; Choi, D.-W.; Jeong, J.-D.; Lee, J.-E.; Kim, M.-K.; Park, J.-U.; et al. Effect of Light Emitting Diodes Treatment on Growth and Mineral Contents of Lettuce (Lactuca sativa L. ‘Chung Chi Ma')*. Korean J. Org. Agric. 2013, 21, 659–668. [Google Scholar] [CrossRef]
- Sindelaˇrova, K.; Szakova, J.; Tremlova, J.; Mestek, O.; Praus, L.; Kaˇna, A.; Najmanova, J.; Tlustos, P. The response of broccoli (Brassica oleracea Con. var. italica) varieties on foliar application of selenium: Uptake, translocation, and speciation. Food Addit. Contam. Part. A-Chem. Anal. Control. Expo. Risk Assess. 2015, 32, 2027–2038. [Google Scholar]
- Son, K.-H.; Oh, M.-M. Leaf Shape, Growth, and Antioxidant Phenolic Compounds of Two Lettuce Cultivars Grown under Various Combinations of Blue and Red Light-emitting Diodes. HortScience 2013, 48, 988–995. [Google Scholar] [CrossRef]
- Son, K.-H.; Oh, M.-M. Growth, photosynthetic and antioxidant parameters of two lettuce cultivars as affected by red, green, and blue light-emitting diodes. Hortic. Environ. Biotechnol. 2015, 56, 639–653. [Google Scholar] [CrossRef]
- Son, K.-H.; Oh, M.-M. Leaf Shape, Growth, and Antioxidant Phenolic Compounds of Two Lettuce Cultivars Grown under Various Combinations of Blue and Red Light-emitting Diodes. HortScience 2013, 48, 988–995. [Google Scholar] [CrossRef]
- Son, K.-H.; Park, J.-H.; Kim, D.; Oh, M.-M. Leaf Shape Index, Growth, and Phytochemicals in Two Leaf Lettuce Cultivars Grown under Monochromatic Light-emitting Diodes. Korean J. Hortic. Sci. Technol. 2012, 30, 664–672. [Google Scholar] [CrossRef]
- Taulavuori, K.; Hyöky, V.; Oksanen, J.; Taulavuori, E.; Julkunen-Tiitto, R. Species-specific differences in synthesis of flavonoids and phenolic acids under increasing periods of enhanced blue light. Environ. Exp. Bot. 2016, 121, 145–150. [Google Scholar] [CrossRef]
- Terfa, M.T.; Solhaug, K.A.; Gislerød, H.R.; Olsen, J.E.; Torre, S. A high proportion of blue light increases the photosynthesis capacity and leaf formation rate of Rosa×hybrida but does not affect time to flower opening. Physiol. Plant 2013, 148, 146–159. [Google Scholar] [CrossRef]
- Vaštakaitė, V.; Viršilė, A.; Brazaitytė, A.; Samuolienė, G.; Jankauskienė, J.; Sirtautas, R.; Novičkovas, A.; Dabašinskas, L.; Sakalauskienė, S.; Miliauskienė, J.; Duchovskis, P. The effect of blue light dosage on growth and antioxidant properties of microgreens. Sodininkystė Ir Daržininkystė 2015, 34, 25–35. [Google Scholar]
- Wang, X.Y.; Xu, X.M.; Cui, J. The importance of blue light for leaf area expansion, development of photosynthetic apparatus, and chloroplast ultrastructure of Cucumis sativus grown under weak light. Photosynthetica 2014, 53, 213–222. [Google Scholar] [CrossRef]
- Wu, Z.; Bañuelos, G.S.; Lin, Z.-Q.; Liu, Y.; Yuan, L.; Yin, X.; Li, M. Biofortification and phytoremediation of selenium in China. Front. Plant. Sci. 2015, 6, 1–8. [Google Scholar] [CrossRef]
- Xin, J.; Liu, H.; Song, S.; Chen, R.; Sun, G. Growth and quality of Chinese kale grown under different LEDs. Agric Sci. Technol. 2015, 16, 68–69. [Google Scholar]
- Xu, J.; Zhang, M.; Liu, X.; Lu, G.; Chi, J.; Sun, L. Extraction and antioxidation of anthocyanin of black soybean seed coat. Trans. Chin. Soc. Agric. Eng. 2005, 21, 161–164. [Google Scholar]
- Yorio, N.C. , Goins, G., Kagie, H., Wheeler, R. and Sager, J.C. Improving spinach, radish, and lettuce growth under red LEDs with blue light supplementation. HortScience 2001, 36, 380–383. [Google Scholar] [CrossRef] [PubMed]
- Zimmermann, M.B.; Jooste, P.L.; Pandav, C.S. Iodine-Deficiency disorders. Lancet 2008, 372, 1251–1262. [Google Scholar] [CrossRef]
Figure 1.
Means comparison of iodine effect on RWC in fenugreek plant 40 days after seed planting. Differences letters indicate significantly different values at p < 0.05.
Figure 1.
Means comparison of iodine effect on RWC in fenugreek plant 40 days after seed planting. Differences letters indicate significantly different values at p < 0.05.
Figure 2.
Means comparison of iodine effect on Chlorophyll in fenugreek plant 80 days after seed planting. Differences letters indicate significantly different values at p < 0.05.
Figure 2.
Means comparison of iodine effect on Chlorophyll in fenugreek plant 80 days after seed planting. Differences letters indicate significantly different values at p < 0.05.
Figure 3.
Means comparison of combined effect of light and iodine on carotenoid in fenugreek in 40 days after seed planting. Differences letters indicate significantly different values at p < 0.05.
Figure 3.
Means comparison of combined effect of light and iodine on carotenoid in fenugreek in 40 days after seed planting. Differences letters indicate significantly different values at p < 0.05.
Figure 4.
Means comparison of light and iodine combined effect on carotenoid content in fenugreek in 80 days after seed planting. Differences letters indicate significantly different values at p < 0.05.
Figure 4.
Means comparison of light and iodine combined effect on carotenoid content in fenugreek in 80 days after seed planting. Differences letters indicate significantly different values at p < 0.05.
Figure 5.
Means comparison of selenium and iodine combined effects on fresh weight of root in fenugreek in 80 days after seed planting. Differences letters indicate significantly different values at p < 0.05.
Figure 5.
Means comparison of selenium and iodine combined effects on fresh weight of root in fenugreek in 80 days after seed planting. Differences letters indicate significantly different values at p < 0.05.
Figure 6.
Means comparison of selenium and iodine combined effects on dry weight of root in fenugreek in 80 days after seed planting. Differences letters indicate significantly different values at p < 0.05.
Figure 6.
Means comparison of selenium and iodine combined effects on dry weight of root in fenugreek in 80 days after seed planting. Differences letters indicate significantly different values at p < 0.05.
Figure 7.
Means comparison of selenium, iodine and light combined effects on dry weight of root in fenugreek in 40 days after seed planting. Differences letters indicate significantly different values at p < 0.05.
Figure 7.
Means comparison of selenium, iodine and light combined effects on dry weight of root in fenugreek in 40 days after seed planting. Differences letters indicate significantly different values at p < 0.05.
Figure 8.
Means comparison of selenium, iodine and light combined effects on trigonelline in fenugreek shoots in 40 days after seed planting. Differences letters indicate significantly different values at p < 0.05.
Figure 8.
Means comparison of selenium, iodine and light combined effects on trigonelline in fenugreek shoots in 40 days after seed planting. Differences letters indicate significantly different values at p < 0.05.
Figure 9.
Means comparison of Selenium, Iodine and light combined effects on trigonelline in fenugreek shoots in 80 days after seed planting. Differences letters indicate significantly different values at p < 0.05.
Figure 9.
Means comparison of Selenium, Iodine and light combined effects on trigonelline in fenugreek shoots in 80 days after seed planting. Differences letters indicate significantly different values at p < 0.05.
Figure 10.
Means comparison of selenium, iodine and light combined effects on seed yield of fenugreek plant. Differences letters indicate significantly different values at p < 0.05.
Figure 10.
Means comparison of selenium, iodine and light combined effects on seed yield of fenugreek plant. Differences letters indicate significantly different values at p < 0.05.
Figure 11.
Means comparison of selenium, iodine and light combined effects on trigonelline of seed in fenugreek plant. Differences letters indicate significantly different values at p < 0.05.
Figure 11.
Means comparison of selenium, iodine and light combined effects on trigonelline of seed in fenugreek plant. Differences letters indicate significantly different values at p < 0.05.
Table 1.
Means comparison of effect of selenium on carotenoid, anthocyanin, plant height, Fresh weight of shoot, chlorophyll and RWC in fenugreek plant.
Table 1.
Means comparison of effect of selenium on carotenoid, anthocyanin, plant height, Fresh weight of shoot, chlorophyll and RWC in fenugreek plant.
| Selenium |
Carotenoid
(Mg.g FW) |
Anthocyanin
(Ug.g FW) |
Plant Height
(cm) |
FWS
(g) |
Chlorophyll
(Mg.g FW) |
RWC
(%) |
Anthocyanin
(Ug.g FW) |
| DAP40
|
DAP80
|
| 0 |
0.34± 0.04 c |
3.68± 0.2 c |
28.50± 1.7 c |
69.50± 2.3 b |
2.67± 0.3 c |
44.16± 3.5 b |
6.54± 0.4 c |
| 2 |
0.41± 0.04 b |
5.46± 0.3 b |
31.72± 2.1 b |
71.24± 2.9 b |
3.02± 0.3 b |
52.66± 2.4 a |
7.63± 0.4 b |
| 4 |
0.54± 0.05 a |
5.85± 0.3 a |
35.5± 2.0 a |
76.85± 3.0 a |
3.59± 0.3 a |
54.22± 3.0 a |
8.37± 0.5 a |
| LSD |
0.03 |
0.2 |
1.5 |
2.1 |
0.2 |
2.2 |
0.4 |
Table 2.
Means comparison of effect of light on fresh weight of shoot, dry weight of shoot, fresh weight of root and anthocyanin in fenugreek plant in 40 days after seed planting.
Table 2.
Means comparison of effect of light on fresh weight of shoot, dry weight of shoot, fresh weight of root and anthocyanin in fenugreek plant in 40 days after seed planting.
| Light |
FWS (g) |
DWS (g) |
FWR (g) |
Anthocyanin (Ug.g FW) |
| Blue |
55.91± 2.6 a |
11.44± 0.5 a |
8.29± 0.4 b |
5.24± 0.4 a |
| Control |
50.53± 2.8 b |
9.55± 0.6 b |
11.31± 0.5 a |
4.76± 0.3 b |
| LSD |
1.7 |
0.5 |
0.4 |
0.2 |
Table 3.
Means comparison of effect of Light on plant height, fresh weight of shoot, RWC, chlorophyll and anthocyanin in fenugreek plant in 80 days after seed planting.
Table 3.
Means comparison of effect of Light on plant height, fresh weight of shoot, RWC, chlorophyll and anthocyanin in fenugreek plant in 80 days after seed planting.
| Light |
Plant Height (cm) |
FWS (gr) |
RWC (%) |
Chlorophyll (Mg.g FW) |
Anthocyanin (Ug.g FW) |
| Blue |
29.50± 2.0 b |
75.99± 2.6 a |
54.07± 2.8 a |
3.49± 0.3 a |
8.10± 0.5 a |
| Control |
34.37± 2.2 a |
69.20± 2.5 b |
46.63± 3.6 b |
2.69± 0.3 b |
6.92± 0.5 b |
| LSD |
1.3 |
1.8 |
1.8 |
0.2 |
0.3 |
Table 4.
Means comparison of light and selenium combined effects on plant height, chlorophyll and RWC in fenugreek in 40 days after seed planting.
Table 4.
Means comparison of light and selenium combined effects on plant height, chlorophyll and RWC in fenugreek in 40 days after seed planting.
| Light |
Selenium |
Plant Height (cm) |
Chlorophyll (Mg.g FW) |
RWC (%) |
| Blue |
0 |
12.44± 1.1 b |
3.84± 0.2 c |
64.88± 1.9 c |
| 2 |
15.77± 1.1 a |
4.76± 0.2 b |
65.11± 2.2 b |
| 4 |
15.00± 1.0 a |
5.85± 0.2 a |
72.66± 3.3 a |
| Control |
0 |
18.66± 1.2 a |
2.71± 0.3 c |
64.55± 2.4 c |
| 2 |
18.22± 1.1 a |
3.39± 0.2 b |
61.55± 2.7 b |
| 4 |
19.44± 1.0 a |
4.20± 0.2 a |
65.55± 2.2 a |
| LSD |
|
1.3 |
0.2 |
4.0 |
Table 5.
Means comparison of light and selenium combined effects on fresh weight root and dry weight of shoot and root in fenugreek in 80 days after seed planting.
Table 5.
Means comparison of light and selenium combined effects on fresh weight root and dry weight of shoot and root in fenugreek in 80 days after seed planting.
| Light |
Selenium |
DWS(g) |
FWR(g) |
DWR(g) |
| Blue |
0 |
22.78± 1.3 a |
11.48± 0.4 a |
2.53± 0.2 a |
| 2 |
20.72± 1.7 b |
11.08± 0.5 a |
2.42± 0.1 a |
| 4 |
20.10± 0.6 b |
11.34± 0.3 a |
1.95± 0.2 b |
| Control |
0 |
16.91± 0.4 a |
13.56± 0.4 b |
3.22± 0.2 a |
| 2 |
17.53± 0.9 a |
13.86± 1.0 b |
3.45± 0.4 a |
| 4 |
17.06± 0.7 a |
14.70± 1.0 a |
3.27± 0.3 a |
| LSD |
|
0.9 |
0.4 |
0.3 |
Table 6.
Means comparison of selenium and iodine combined effects on fresh weight shoot, dry weight shoot and chlorophyll in fenugreek in 40 days after seed planting.
Table 6.
Means comparison of selenium and iodine combined effects on fresh weight shoot, dry weight shoot and chlorophyll in fenugreek in 40 days after seed planting.
| Selenium |
Iodine |
FWS (g) |
DWS (g) |
Chlorophyll (Mg.g FW) |
| 0 |
0 |
44.73± 3.8 b |
10.25± 0.5 ab |
3.11± 0.3 ab |
| 2 |
53.06± 2.0 a |
9.72± 0.7 b |
3.27± 0.3 a |
| 4 |
51.47± 1.9 a |
11.30± 0.7 a |
2.76± 0.2 b |
| 2 |
0 |
54.17± 2.0 a |
10.97± 0.7 ab |
3.84± 0.4 b |
| 2 |
52.96± 1.9 a |
11.25± 0.7 a |
3.84± 0.4 b |
| 4 |
52.80± 1.7 a |
10.15± 0.7 b |
4.54± 0.3 a |
| 4 |
0 |
57.63± 3.0 a |
10.70± 0.7 a |
4.78± 0.5 a |
| 2 |
56.57± 2.0 a |
10.03± 0.9 a |
5.12± 0.5 a |
| 4 |
55.61± 3.5 a |
10.12± 1.1 a |
5.17± 0.6 a |
| LSD |
|
2.1 |
1.1 |
0.45 |
|
Disclaimer/Publisher’s Note: The statements, opinions and data contained in all publications are solely those of the individual author(s) and contributor(s) and not of MDPI and/or the editor(s). MDPI and/or the editor(s) disclaim responsibility for any injury to people or property resulting from any ideas, methods, instructions or products referred to in the content. |
© 2023 by the authors. Licensee MDPI, Basel, Switzerland. This article is an open access article distributed under the terms and conditions of the Creative Commons Attribution (CC BY) license (http://creativecommons.org/licenses/by/4.0/).
