1. Introduction
Heart failure is a severe disease that has a major clinical and economic impact on the world’s population [
1,
2]. The overactivation of sympathetic nervous system is the main pathological factor of heart failure, and plays a key role in the occurrence and development of heart failure, including cardiac fibrosis and cardiac inflammation and other pathological manifestations [
3,
4].
β-adrenergic receptor (β-AR), a classical G-protein-coupled receptor, is also an important neuroendocrine receptor and a major effector of cardiac sympathetic stress, which plays an essential role in maintaining the physiological function of the heart [
5]. Meanwhile, isoproterenol (ISO), a β-AR agonist, has been widely used in the establishment of cardiac fibrosis model [
6]. Clinically, β-blocker, as one of the golden triangle drugs in heart failure treatment, has shown promising results in the treatment of patients with heart failure. However, there are still some limitations in clinical application, such as serious side effects [
7,
8]. Therefore, how to maintain the physiological function of the heart while improving the pathological effect, has become an urgent problem for the treatment of heart failure in the future.
Bruton's tyrosine kinase (BTK) belongs to the family of nonreceptor tyrosine kinases in hepatocellular carcinoma (TEC), and was initially recognized to play a key role in the development and function of B cell [
9,
10]. BTK has been reported to be associated with a variety of severe human diseases, including chronic lymphocytic leukemia and certain hyperactivated inflammatory responses after infection [
11,
12]. Interestingly, previous studies have shown that some members of the TEC kinase family are involved in the development and progression of cardiovascular diseases. Bone marrow tyrosine kinase gene (BMX) is involved in the occurrence of cardiac hypertrophy under pressure overload [
13,
14]. Besides, inhibition of IL-2-induced T cell kinase (ITK) can reduce Th1/Th17 response after heart transplantation and significantly prolong the mean survival time of transplanted heart [
15]. However, the role of BTK in non-immune cells and other diseases still remains unclear. The latest research shows that BTK might be a potential drug target for cardiac fibrosis [
16]. Zanubrutinib (ZB), a second-generation BTK inhibitor, is currently used to in the treatment of capsid cell lymphoma (MCL) and chronic lymphocytic leukemia/small lymphocytic lymphoma (CLL/SLL)[
17]. ZB has highly selective for BTK, aiming to increase drug potency and reduce off-target effects [
18].
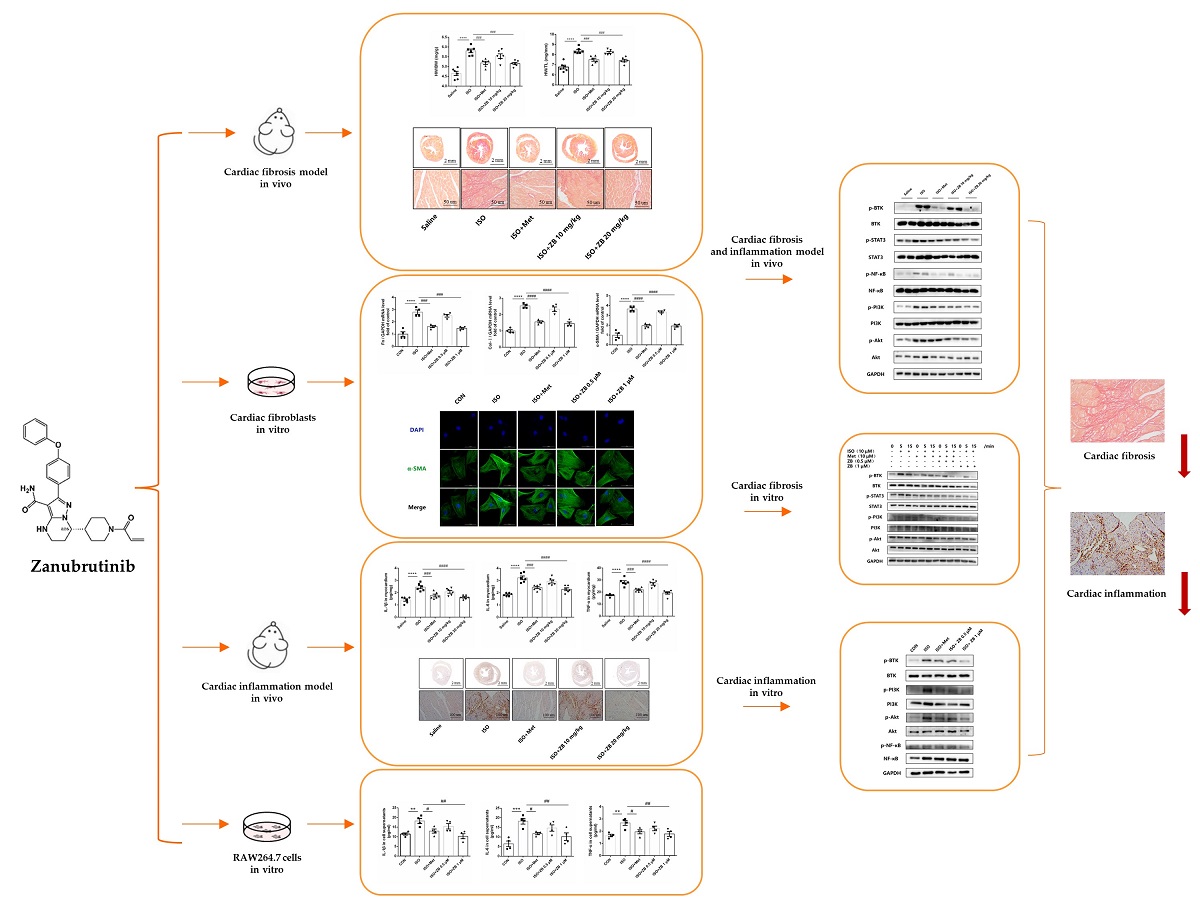
Therefore, our research focus on whether ZB has therapeutic effect on ISO-induced cardiac fibrosis and inflammation both in vivo and in vitro. Then we further explored the mechanism of ZB in cardiac fibrosis and inflammation both in vivo and in vitro.
3. Discussion
BTK is a non-receptor cytoplasmic tyrosine kinase mainly expressed in pre-B cells and B-lymphocytes [
10]. Previous study has shown that the upregulated BTK is primarily localized in cardiac fibroblasts in response to hypertensive or ischemic stimulation. Loss of the expression or pharmacological inhibition of BTK alleviates the process of myocardial fibrosis and cardiac dysfunction under various pathological conditions, suggesting the relationship between the amount of BTK and myocardial fibrosis [
17]. As a tyrosine kinase, BTK functions through the form of phosphorylation. However, whether the role of phosphorylated BTK in myocardial fibrosis deserves to be explored. Moreover, CFs are the main effector cells of cardiac fibrosis, the activation of CFs is a key factor in cardiac fibrosis. Additionally, as a widely distributed receptor in heart, β-AR regulates a variety of CFs behaviors, including proliferation, trans-differentiation and ECM synthesis. By affecting these functions, β-AR promotes cardiovascular diseases and enhances cardiovascular cells growth and metastasis in vivo [
28,
29]. Interestingly, the phosphorylation of BTK increased in β-AR-induced cardiac fibroblasts, which indicated the relationship between the activity of BTK and cardiac fibrosis. ZB is a second-generation small molecule inhibitor of BTK and could form a covalent bond with the cysteine residue in the active site of BTK, and thereby inhibiting BTK activity [
30]. And our research demonstrated that ZB inhibited BTK phosphorylation in cardiac fibrosis model both in vivo and in vitro. Next, we further explored whether blocking BTK alleviated cardiac fibrosis caused by β-AR.
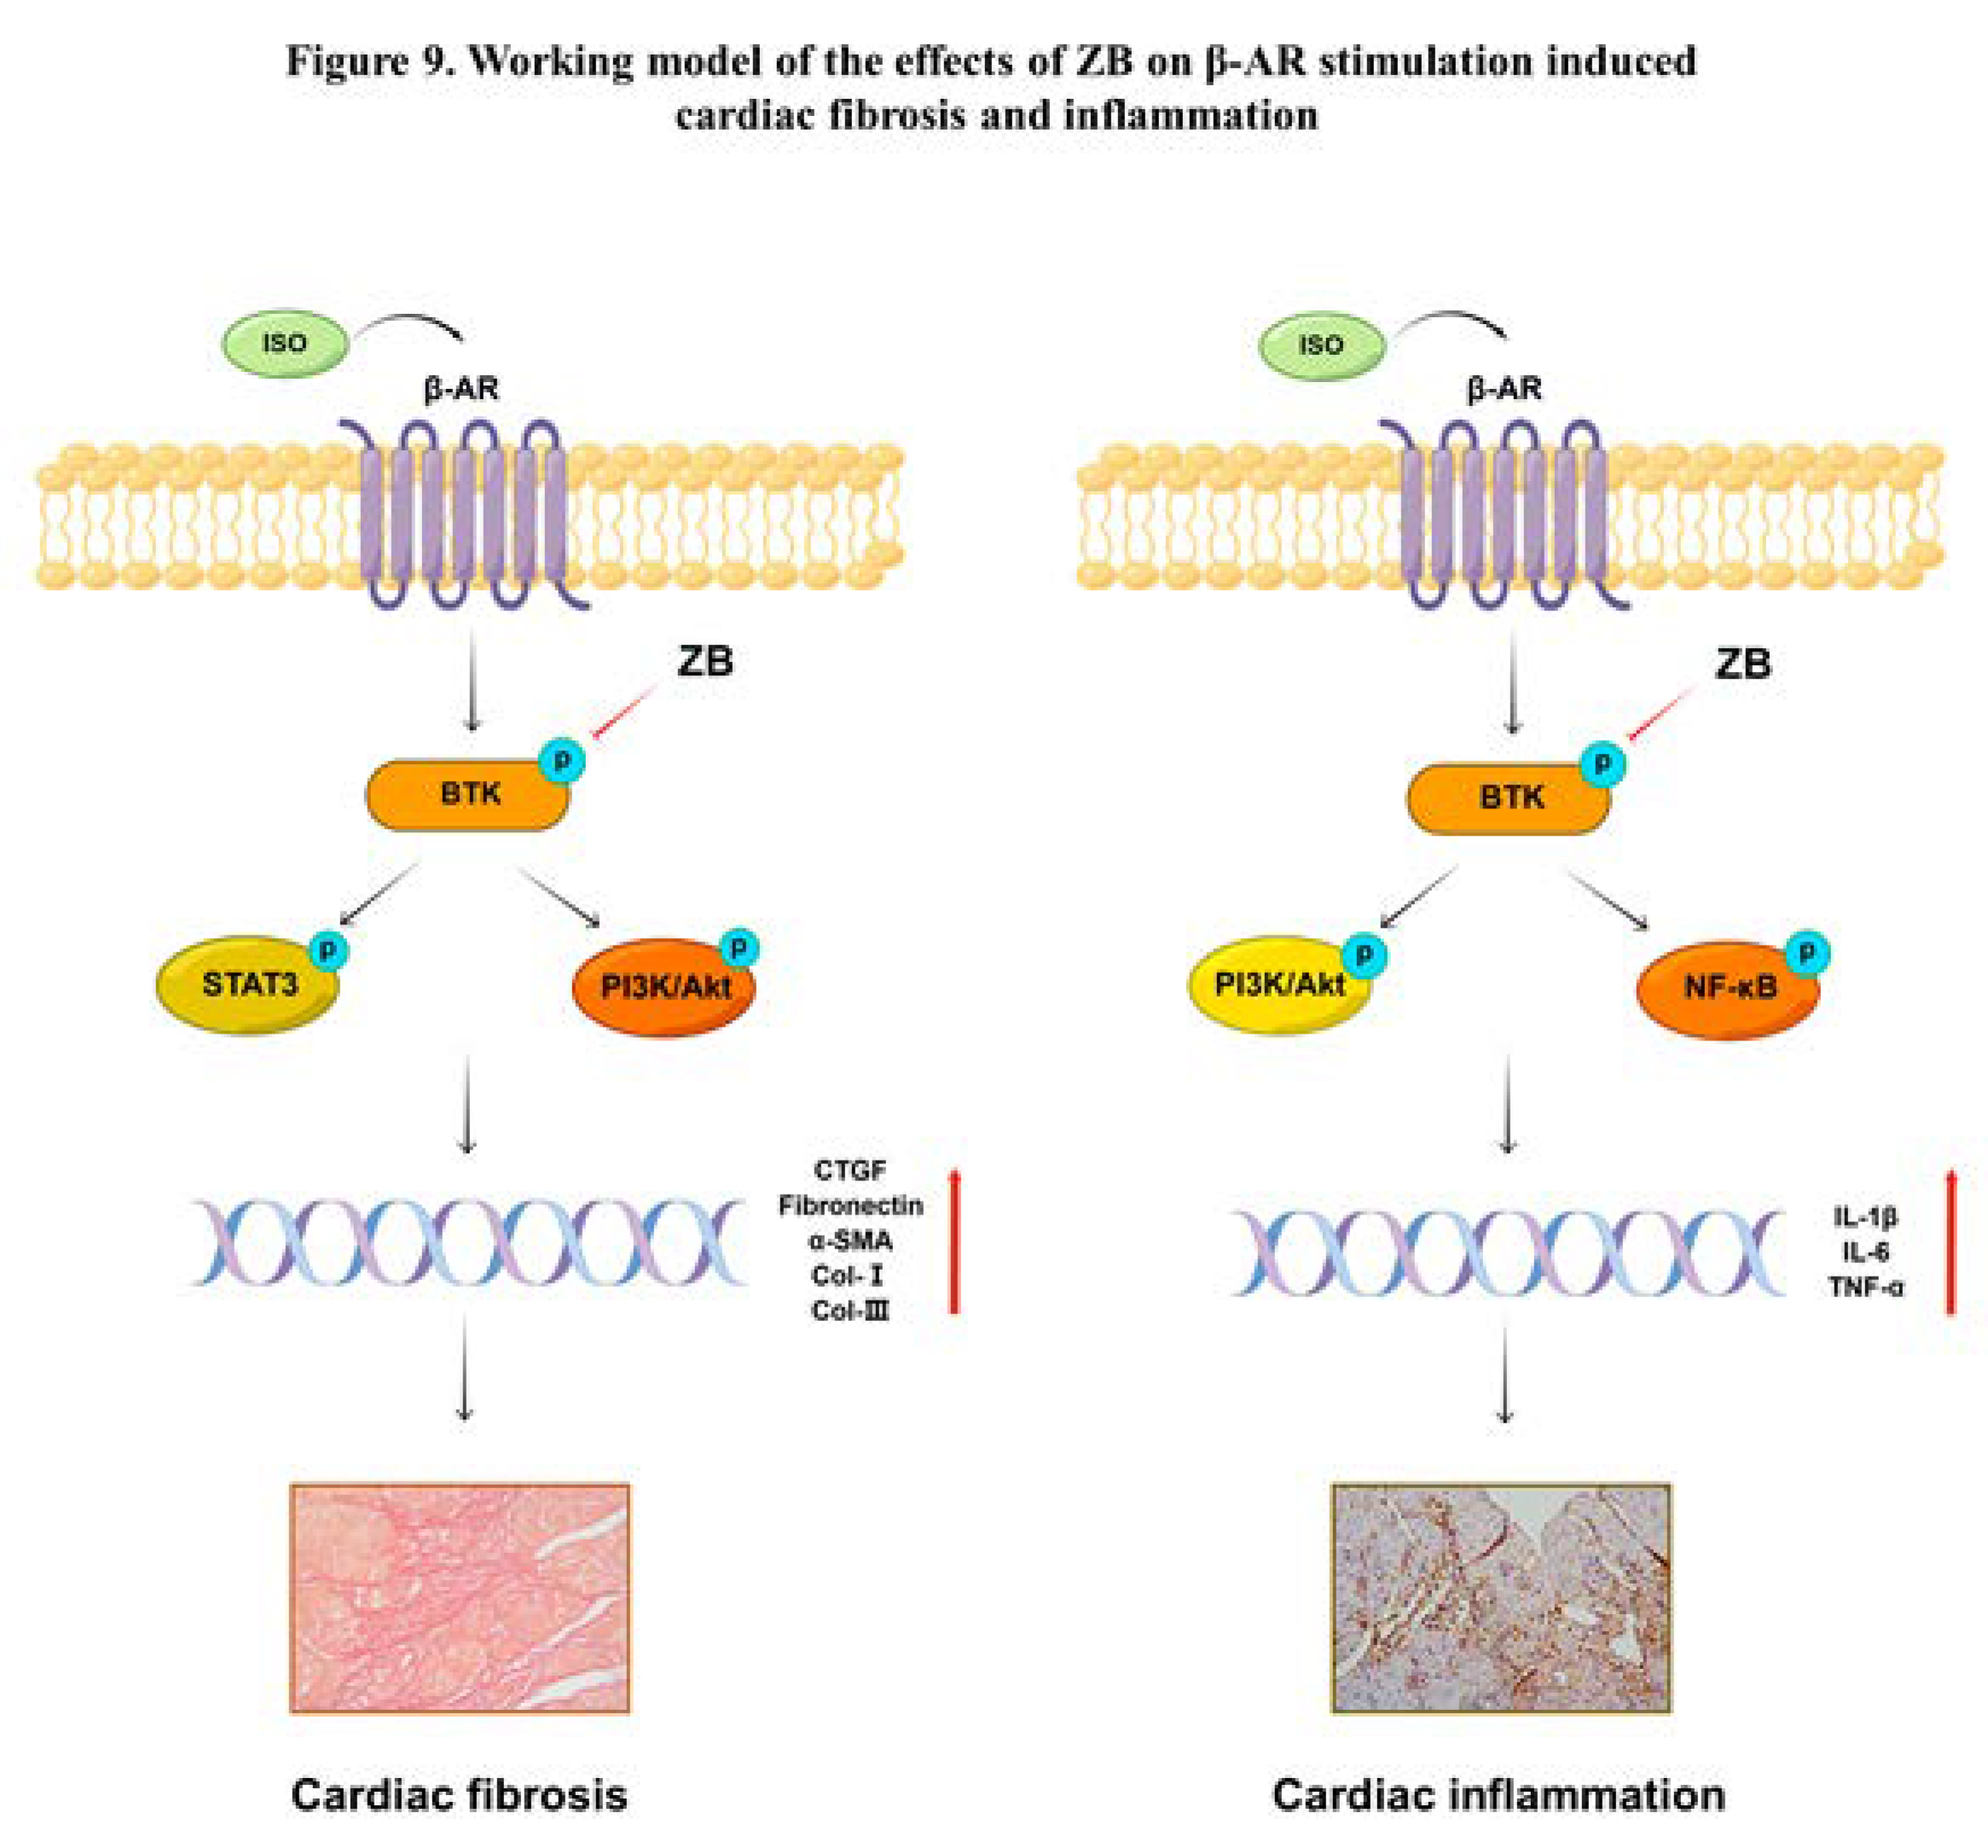
As expected, ZB alleviated β-AR-induced cardiac fibrosis by STAT3 and PI3K/Akt signal pathways both in vivo and in vitro. So far, little is known about the role of BTK in non-immune cells and the relationship between BTK and β-AR-induced myocardial fibrosis. Meanwhile, recent studies have shown that BTK directly binds to phosphorylated TGF-β receptor I (TβRI) at tyrosine 182 in cardiac fibrosis due to pressure overload, and thereby modulates the activation of downstream SMAD-dependent or SMAD-independent TGF-β signaling, leading to the enhanced myofibroblast transition and ECM gene overexpression [
17]. In brief, BTK might be a potential drug target for cardiac fibrosis. Besides, previous studies indicate that ibrutinib, a first-generation small molecule inhibitor of BTK, has anti-fibrotic effect in multiple organ fibrosis diseases, containing tumor fibrosis [
33], liver fibrosis [
34], and chronic pancreatitis [
35]. Meanwhile, STAT3 and PI3K/Akt signaling pathways are one of the most classical downstream signaling pathways of β-AR that regulate cardiac fibrosis. As a second-generation inhibitor of BTK, our study demonstrated that ZB regulated cardiac fibrosis by BTK-mediated STAT3 and PI3K/Akt signal pathway both in vivo and in vitro. In cardiac fibrosis model caused by chronic sympathetic overactivation, whether ZB alleviates cardiac fibrosis through TGF-β signaling pathway needs to be further studied. Moreover, since BTK is an essential molecule of the B-cell receptor signaling pathway, BTK inhibitors may also exert anti-fibrotic effects by reducing B-cell-related inflammation or other intrinsic events in cardiac fibrosis under pathological conditions [
26]. Finally, ZB may also affect ISO-induced cardiac fibrosis in mice by modulating B cell activation, which needs further research and verification.
Cardiac fibrosis is commonly accompanied by cardiac inflammation [
20]. NF-κB and PI3K/Akt signaling pathways are one of the most classical downstream signaling pathways of β-AR that regulate cardiac inflammation. Then, we further investigated whether blocking BTK alleviated cardiac inflammation caused by β-AR. As expected, ZB alleviated β-AR-induced cardiac inflammation by NF-κB and PI3K/Akt signal pathways both in vivo and in vitro. Previous studies indicate that ibrutinib, a first-generation small molecule inhibitor of BTK, ameliorates pulmonary fibrosis by inhibiting inflammation [
31]. Besides, other research demonstrate that ibrutinib reduce the activation of NF-κB and NLRP3 inflammasomes by targeting BTK and finally ameliorate pulmonary inflammation [
32], suggesting that BTK might be a potential drug target for anti-inflammation. However, ibrutinib may have off-target effect in mice pulmonary fibrosis model, which could not represent the role of BTK in organ fibrosis. ZB, which demonstrates better on-target of BTK compared to ibrutinib, was shown well cardiac inflammation both in vivo and in vitro. Moreover, since BTK is an essential molecule of the B-cell receptor signaling pathway, BTK inhibitors may also exert anti-inflammatory effect by reducing B-cell-related inflammation. Finally, ZB may also affect ISO-induced cardiac inflammation in mice by modulating B cell activation, which needs further research and verification.
4. Materials and Methods
4.1. Animal Model and Treatments
Male C57BL/6J mice (8 to 12 weeks old; 20–25 g body weight) and Male Sprague Dawley neonatal rats (1 to 3 days old) were purchased from Weitonglihua Company (Beijing, China). All animal care and experimental procedures were approved by the Institutional Animal Care and Use Committee (IACUC) of Nankai University (Permit No. SYXK 2014-0003). Mice were fed in a 12h light/dark cycle in a room with controlled temperature (22-26 °C), humidity (60 ± 2%), which had open access to food and water.
In animal experiments, 30 mice were randomly divided into 5 groups (
Figure S3): Saline group, ISO (Sigma-Aldrich, I5627, USA)group (10 mg kg–1 d–1), Metoprolol (Met) group (ISO+Met) (30 mg kg–1 d–1), Zanubrutinib (ZB) 10mpk group (ISO+ZB 10 mg/kg) (10 mg kg–1 d–1), and ZB 20mpk group (ISO+ZB 20 mg/kg) (20 mg kg–1 d–1). Met (MedChemExpress, HY-17503, China) was used as the positive control. Cardiac fibrosis model was established by daily subcutaneous injection of 10 mg/kg isoproterenol (ISO) (Sigma-Aldrich, I5627, USA) for 7 days [
19]. For ISO group, 10 mg/kg ISO (Sigma-Aldrich, USA) was injected subcutaneously for 7 days, while the saline group was given equal volume of saline. Met (MedChemExpress, HY-17503, China) and ZB (MedChemExpress, HY-101474A, China) were dissolved in saline, ultrasound shattered and then administered by gavage once a day during 7 days before daily ISO injection [
20,
21].
4.2. Echocardiographic Measurements
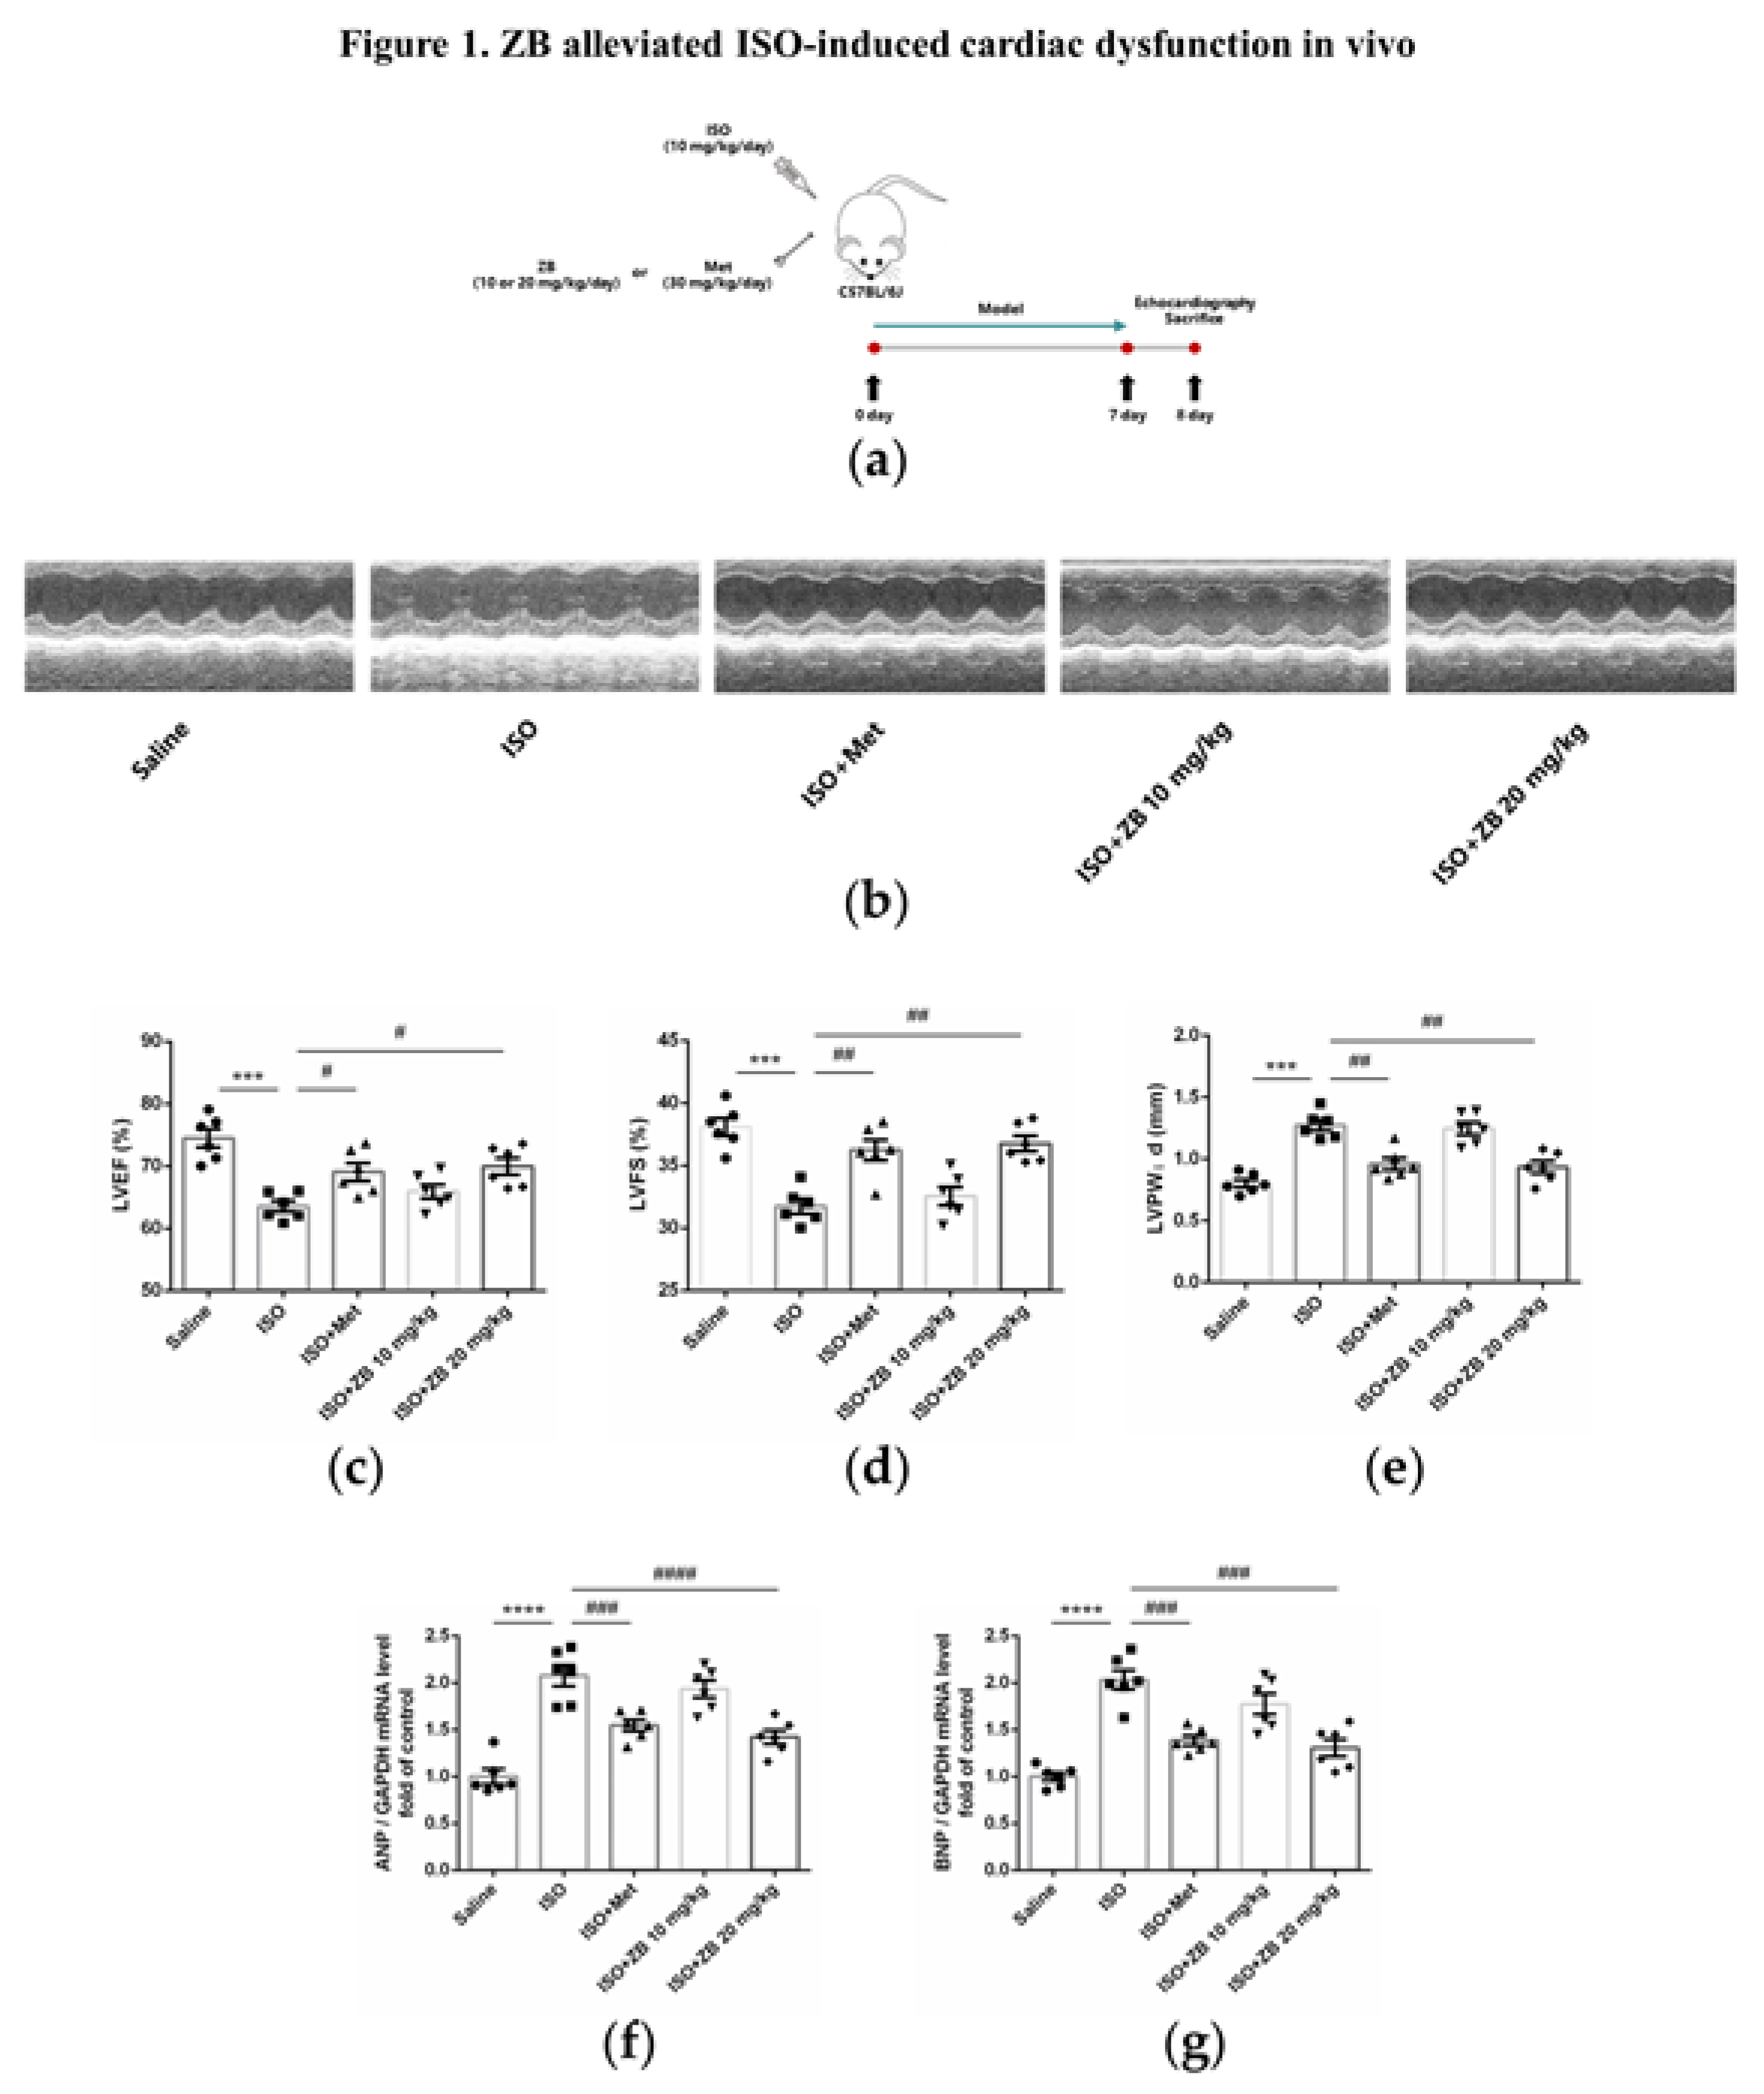
Echocardiography was used to evaluate cardiac function on the 8th day after ISO administration for 24h. The Vevo 2100 system (VisualSonics Inc.,Toronto, Canada) was used to collect data. Mice were anaesthetized with 1.5% isoflurane (Baxter Healthcare Corp, New Providence, RI, R510-22, USA) until the heart rate was at 400–500 beats per minute. The thickness and chamber dimensions were determined from M-mode images acquired at the mid-papillary level in the parasternal short-axis view and B-mode images acquired in the parasternal long- and short-axis views. The ejection fraction (EF%) and fractional shortening could stand for the systolic cardiac function. The diastolic left ventricular posterior wall thickness (LVPW;d) was measured based on the parameters from M-mode, which was to calculate the left ventricular ejection fraction (LVEF) and left ventricular fractional shortening (LVFS). All data were averaged from three consecutive cardiac cycles.
4.3. Isolation of Cardiac Fibroblasts
Primary neonatal rat cardiac fibroblasts (NRCFs) were isolated from 1- to 2-day-old Sprague Dawley rats, which was obtained from Weitonglihua Company (Beijing, China). Neonatal rats were euthanized under the standard protocol. Harvested hearts were washed by sterile PBS and minced in ice-cold PBS. Minced heart tissues were digested with digestion buffer prepared with 0.06% (w/v) pancreatin (Gibco, 27250018, USA) and 0.05% (w/v) collagenase type II (Gibco, 17101015, USA) in PBS. Tissue digestion was performed by incubating minced hearts in digestion solution for 30 min at 37°C. The collected cells were spun down and resuspended in culture medium: DMEM with 10% FBS (Gibco, 10100147, USA) and penicillin–streptomycin (Gibco, 15070063, USA). After washing out digestion buffer with culture medium twice, cells were seeded on cell culture dishes and incubated for 2h in the incubator (37°C, 5% CO2, 90% humidity). After 2h incubation, floating cells and culture medium were removed and attached cells were continued to culture with fresh culture medium. NRCFs at passage 2 were used for this study.
4.4. Histological Analysis
Mice were anesthetized and sacrificed after echocardiography analysis. The hearts were excised and weighed immediately after being washed with cold PBS. The cardiac tissues for histological analysis were fixed with 4% paraformaldehyde for 12 h, dehydrated in 20% sucrose for 24 h, and then embedded in paraffin. Paraffin embedded hearts were cut into 5-µm-thick sections on a microtome and transferred onto glass slides. Then serial sections (5 μm thick) were stained with hematoxylin and eosin stain (H&E) for morphological analysis and picrosirius red (PSR) was used for the detection of fibrosis according to the manufacturer’s instructions [
6]. The percentage of collagen area was measured by a quantitative digital image analysis system (Image-Pro Plus 6.0) to evaluate cardiac fibrosis.
4.5. Total RNA Extraction and Real-Time PCR Analysis
Total RNA was isolated from heart tissues using Trizol Reagent (Invitrogen, 10296028CN, USA), and then 1 µg RNA was reverse transcribed into cDNA using the Reverse SYBR Select Master Mix kit (Tiangen, KR118, China) followed by fluorescence quantitative real-time PCR (Yeasen, 11198ES08, China). Relative mRNA levels were normalized to GAPDH, and then quantified using the comparative 2-ΔΔCT method, and fold changes were compared to the control. Primers used in this study were as followed in
Table 1.
4.6. Cell Culture and Treatments
RAW264.7 was cultured in DMEM medium, supplemented with 10% FBS and 1% penicillin and streptomycin, and maintained at 37℃ with 5% CO2. NRCFs were cultured in DMEM medium, supplemented with 15% FBS and 1% penicillin and streptomycin, and maintained at 37℃ with 5% CO2. NRCFs were prepared from neonatal Sprague Dawley rats as previously described. Before treated with ISO (10 μmol L
–1) (dissoved in sterile water), RAW264.7 was starved for 12 hours with serum-free medium, and NRCFs were starved for 24 hours with serum-free medium. As for Met (10 μmol L
–1) and ZB (0.5 or 1 μmol L
–1) (both dissoved in DMSO), cells were pretreated with Met or ZB prior for 1 hour before ISO. The concentration of ZB was selected according to (
Figure 2c and
Figure 4b).
4.7. Western Blot Analysis
Cells and heart tissue were lysed in protein lysis (1% Deoxycholic acid, 10 mM Na
4P
2O
7, 1% TritonX-100, 10% Glycerol, 100 mM NaCl, 5 mM EDTA (pH=8.0), 20 mM Tris-HCl (pH=7.4), 0.1% SDS, 50 mM NaF, 1 mM Na
3VO
4, 1 mM PMSF, 10 mg/L aprotinin). Equal amounts of protein were separated on 10% SDS-PAGE gels and transferred to nitrocellulose membranes. After blocking with 5% milk for 1h, the membranes were incubated with primary antibodies at 4℃ overnight and incubated with secondary antibodies for 1h at room temperature. After treated with corresponding horseradish peroxidase (HRP)-conjugated secondary antibodies (Abacm, ab97051, USA), the protein bands were detected using a chemiluminescence reagent (Affinity, KF8003, USA). and visualized on a GeneGnome chemiluminescent imaging system (Syngene, USA) [
7]. The relative density of each band was analyzed by ImageJ. β-Tubulin and GAPDH were served as internal references in densitometric analysis. Primary antibodies used in this study were as followed in
Table 2.
4.8. Immunofluorescence
All the steps were the same as previously described. After pretreatment with Met (10 μmol L–1) or ZB (0.5 μmol L–1 and 1 μmol L–1) for 1 hours, ISO (10 μmol L–1) was added in the culture medium for 5 min、15 min and 24 h. Then, the cells were fixed, and the nuclei were stained with DAPI (Solarbio, S2110, China). Fluorescence was examined with a confocal microscope (Nikon, Japan).
4.9. Immunohistochemistry
Mouse hearts were collected on day 8 after ISO injection, harvested, washed with cold phosphate buffered saline, fixed with 4% paraformaldehyde for 6–8 h, and embedded in paraffin. Serial sections (5 μm thick) were stained with antibodies against the macrophage marker Mac-3 (1:200 dilution)(BD Biosciences, 550292, San Jose, CA, USA). Tissue sections were imaged by the NanoZoomer-SQ (Hamamatsu, Japan). Ten fields were randomly selected from the image of each section, and the areas of the Mac-3-positive area was measured with Image-Pro Plus 6.0. The ratio of positive-stained area to total myocardial area was calculated to determine the infiltration of macrophages. The UltraSensitiveTM SP (Mouse/Rabbit) IHC Kit (Maxim, KIT-97, China) and DAB Kit (Maxim, DAB-0031, China) were used according to the instructions to detect the expression of Mac-3 [
20].
4.10. Enzyme-Linked Immunosorbent Assay (ELISA)
The protein levels of Interleukin-1β (IL-1β)(Jianglai Bio, JL18442, China), Interleukin-6 (IL-6)(Jianglai Bio, JL20268, China) and Tumor necrosis factor (TNF-α)(Jianglai Bio, JL10484, China) in heart tissue and the supernatant of RAW264.7 were measured by ELISA kits (Jianglai Bio, JL18442, China). Procedures were conducted according to the manufacturer’s instructions, and absorbances were read at 450 nm (Microplate Reader Model 550, Bio-Rad, Hercules, CA, USA). All concentration values were in the linear range of the standard curve, and the final results are shown as the ratio of total protein concentrations.
4.11. Cell Counting Kit-8 Assay
The cell viability following ISO treatment was measured with Cell Counting Kit-8 (CCK-8) (Dojindo, CK04, Japan). The operations were conducted according to the instructions of the kit. Cardiac fibroblasts of 5000 per well were cultured in 96-well plates overnight. CCK-8 solutions were added and incubated for 3 h. The OD450 nm was detected in a Microplate Reader Model 550 (Bio-Rad, Hercules, CA, USA), and the cell viability and inhibition of cardiac fibroblasts was calculated.
4.12. Statistical Analysis
Data were expressed as mean ± SEM. Differences between more than two groups were analyzed by one-way analysis of variance (ANOVA) with Tukey’s post-hoc multiple comparison tests. P < 0.05 was considered statistical significance.
Author Contributions
Conceptualization, Wenqi Li, Qianyi Zhang, Zhichao Liu, Yue Yang, Li Chen, Xiaowei Guo, Tiantian Zhang, Lingxin Meng, Dan Chai; methodology, Wenqi Li, Yang Miao, Jianwei Zhang, Shimeng Li; software, Wenqi Li, Shuwen Zhu, Jing Liu and Zhigang Liu; validation, Shuwen Zhu, Jing Liu and Zhigang Liu; formal analysis, Wenqi Li; investigation, Wenqi Li; resources, Cheng Yang; data curation, Xiaohe Li; writing—original draft preparation, Wenqi Li; writing—review and editing, Wenqi Li and Xiaohe Li; visualization, Wenqi Li; supervision, Guodong Tang; project administration, Honggang Zhou; funding acquisition, Cheng Yang, Honggang Zhou and Xiaohe Li. All authors have read and agreed to the published version of the manuscript.
Abbreviations
HF, Heart failure; β-AR, β-Adrenergic receptor; ISO, isoproterenol; Met, metoprolol; BTK, Bruton’s tyrosine kinase; BCR, B cell receptor; ZB, Zanubrutinib; CTGF, Connective tissue growth factor; Fn, Fibronectin; Col-I, Collagen-I; Col-III, Collagen-III; ECM, extracellular matrix; TGF-β1, transforming growth factor-β1; NRCFs, Primary neonatal rat cardiac fibroblasts; RAW264.7, mouse leukemia cells of monocyte macrophage; IL-1β, Interleukin-1β; IL-6, Interleukin-6; TNF-α, Tumor necrosis factor; H&E, Hematoxylin–eosin; STAT3, Recombinant Signal Transducer And Activator Of Transcription 3; NF-κB, Nuclear factor-κB; PI3K, PhosphoInositide-3 Kinase; Akt, protein kinase B; LVEF, left ventricular ejection fraction; LVFS, left ventricular fractional shortening; LVPW;d, diastolic left ventricular posterior wall thickness; HW/BW, the ratio of heart weight to body weight; HW/TL, the ratio of heart weight to tibia length.
Figure 1.
ZB prevents ISO-induced cardiac dysfunction. (a) Dosing regimen in ISO-induced cardiac fibrosis model. Mice were treated by daily subcutaneous injection of 10 mg kg–1 d–1 ISO for 7 days. During 7 days, 10 mpk、20 mpk ZB、30 mpk Met or equal Saline was gavaged daily as indicated. Met was used to be a positive control; (b) Representative echocardiographic M-mode images of left ventricles from mice at day 8; (c) Echocardiographic measurement of LVEF (n=6); (d) Echocardiographic measurement of LVFS (n=6); (e) Quantitative analysis of LVPW;d (n=6); (f) The mRNA levels of ANP in heart tissues (n=6); (g) The mRNA levels of BNP in heart tissues (n=6); Quantification of ANP and BNP were normalized to GAPDH. The data are shown as mean±SEM (one-way ANOVA with Tukey’s post-hoc multiple comparison tests). ***, P<0.001, ****, P<0.0001 vs. Saline; #, P<0.05, ##, P<0.01, ###, P<0.001, ####, P<0.0001 vs. ISO.
Figure 2.
ZB prevents ISO-induced cardiac dysfunction. (a) Dosing regimen in ISO-induced cardiac fibrosis model. Mice were treated by daily subcutaneous injection of 10 mg kg–1 d–1 ISO for 7 days. During 7 days, 10 mg kg–1 d–1、20 mg kg–1 d–1 ZB、30 mg kg–1 d–1 Met or equal Saline was gavaged daily as indicated. Met was used to be a positive control; (b) Representative images of heart size. Scale bar: 5 mm; (c) Quantitative analysis of HW/BW ratio (n=6); (d) Quantitative analysis of HW/TL ratio (n=6); (e) Representative 1× and 40× images and quantification of picrosirius red-stained collagen in the heart at the 8th day after ISO treatment for 24 h (n=6). Scale bar (upper): 2 mm, scale bar (lower): 50 μm; (f) The mRNA levels of CTGF in heart tissues (n=6); (g) The mRNA levels of Fn in heart tissues (n=6); (h) The mRNA levels of α-SMA in heart tissues (n=6); (i) The mRNA levels of Col-I in heart tissues (n=6); (j) The mRNA levels of Col-III in heart tissues (n=6). Quantification of CTGF, Fn, α-SMA, Col-I and Col-III were normalized to GAPDH. The data are shown as mean±SEM (one-way ANOVA with Tukey’s post-hoc multiple comparison tests). ****, P<0.0001 vs. Saline; ###, P<0.001, ####, P<0.0001 vs. ISO.
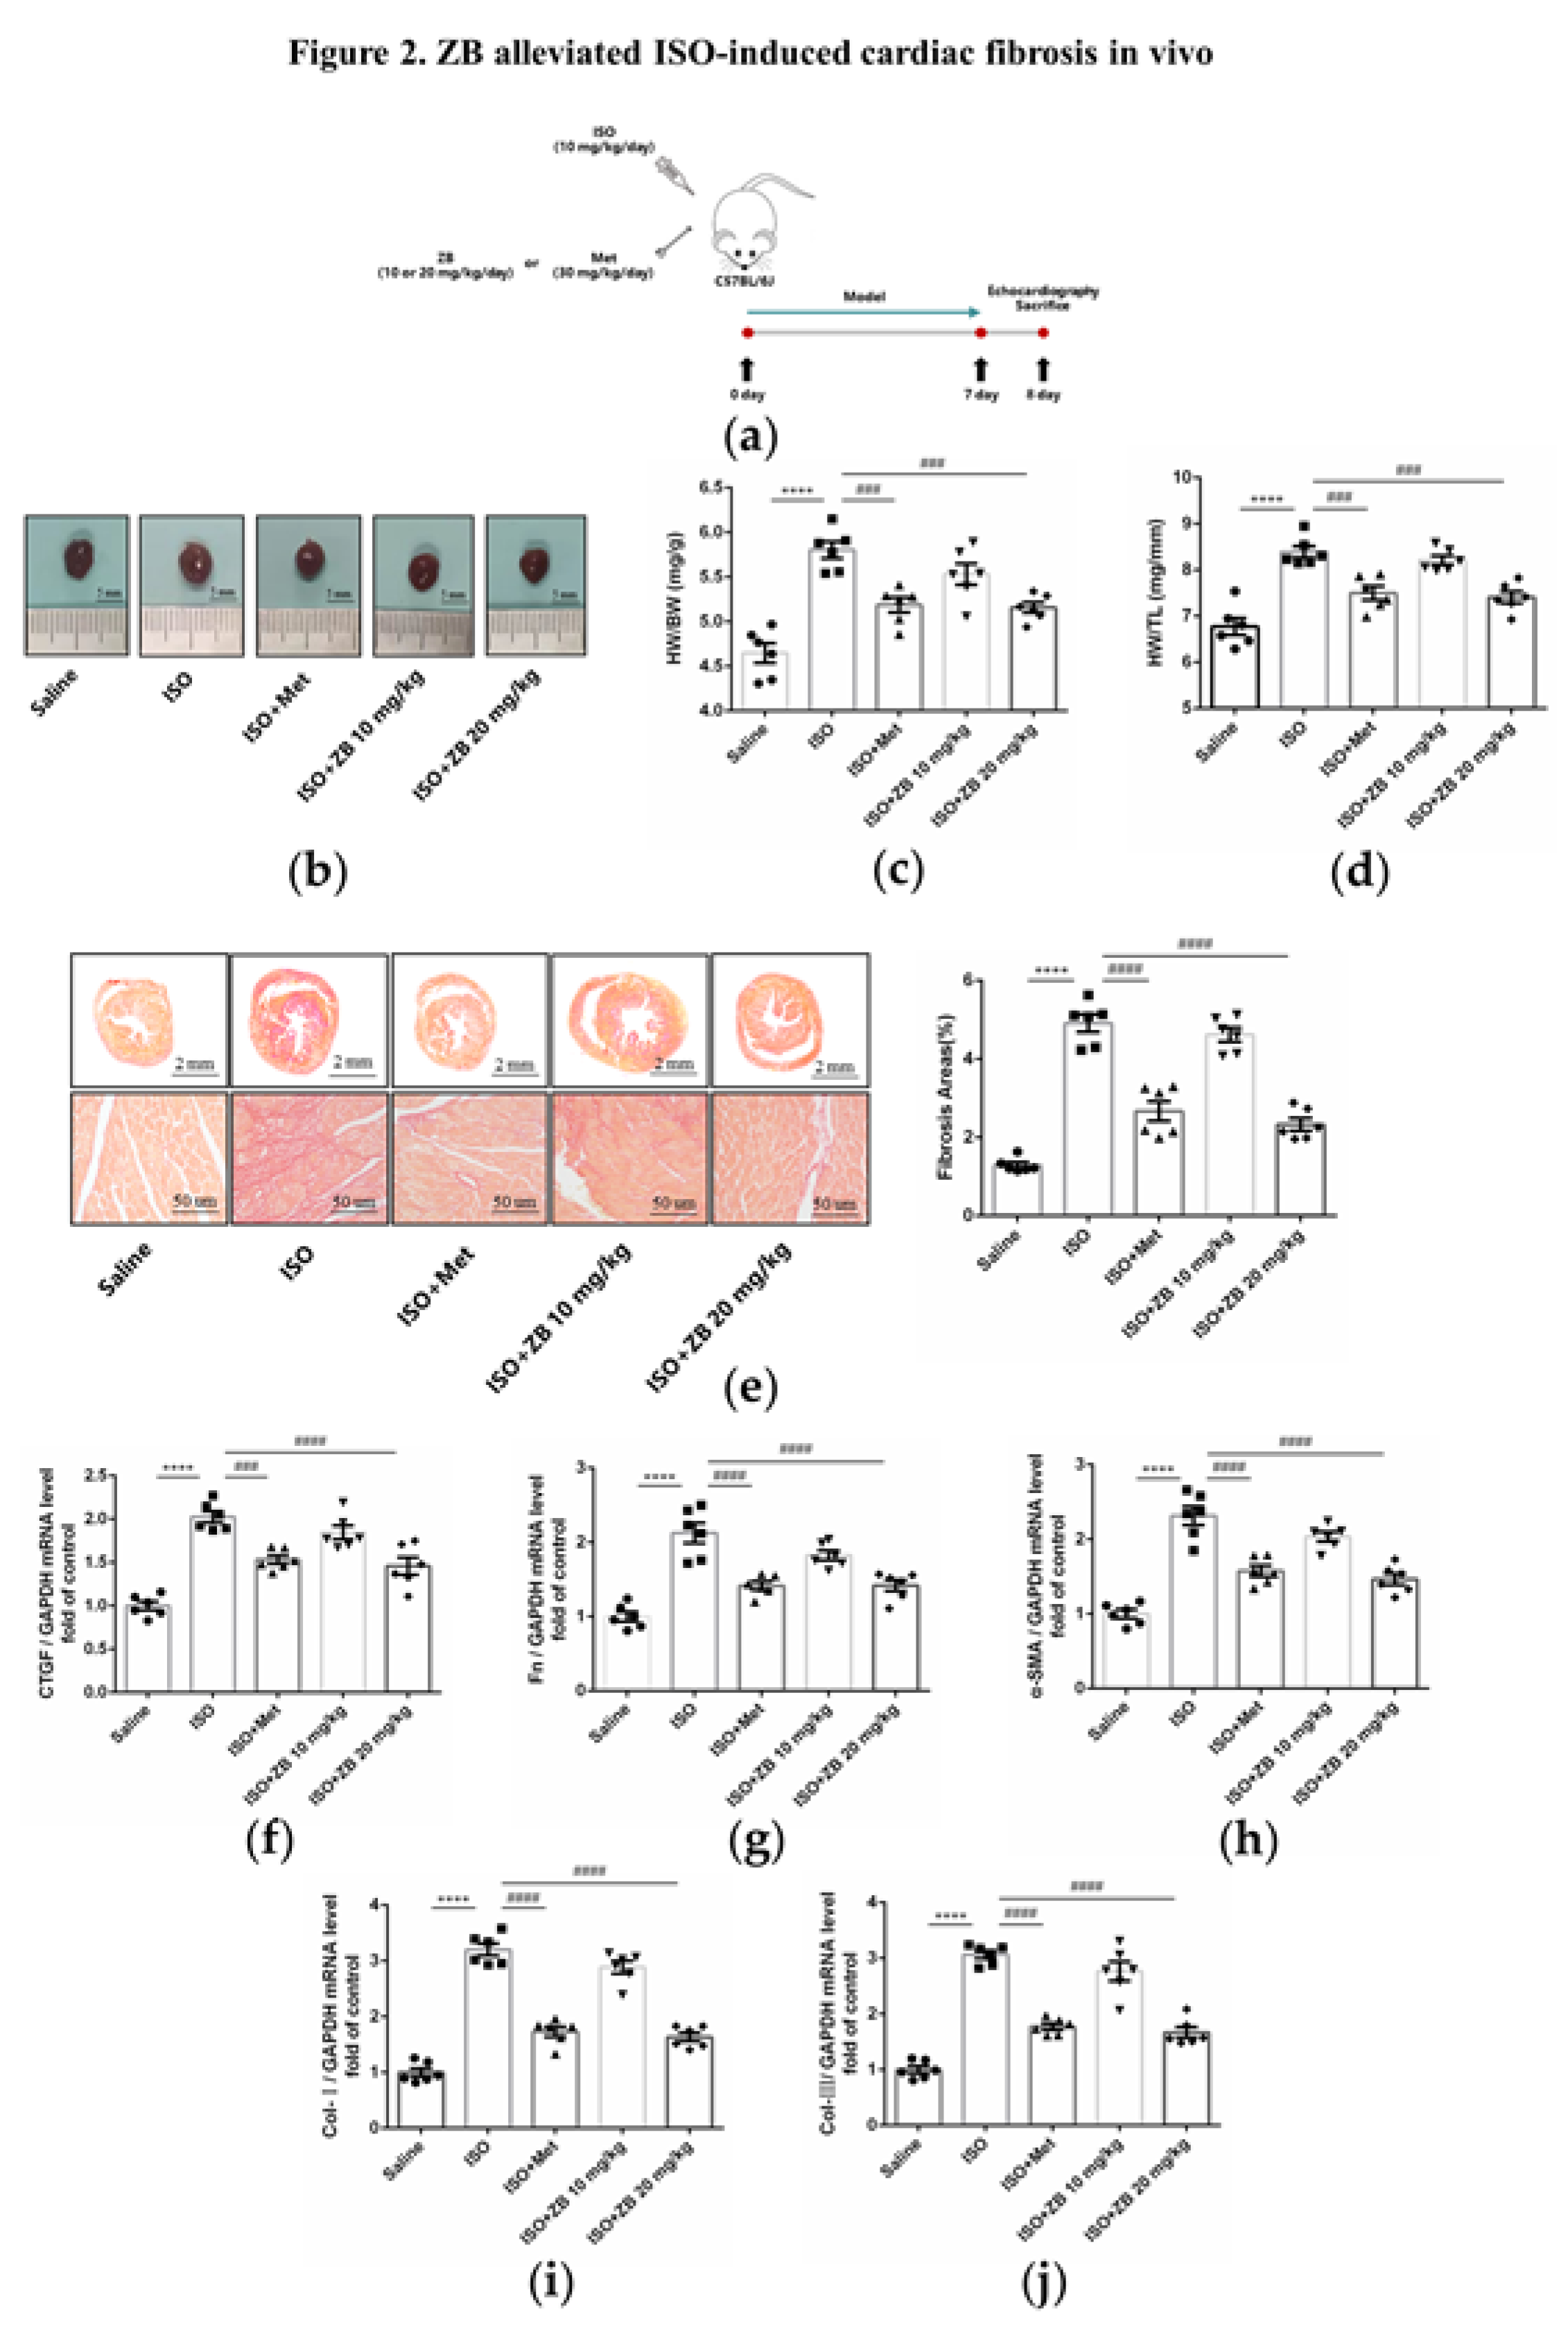
Figure 3.
ZB inhibited ISO-induced cardiac fibroblasts activation. (a) Dosing regimen in ISO-induced NRCFs. NRCFs were starved for 24 h, incubated with ZB (0.5 μmol L–1 or 1 μmol L–1) 、Met (10 μmol L–1) or equal DMSO for 1 h and then treated with ISO (10 μmol L–1) for 24 h. Met was used to be a positive control; (b) Western Blot analysis of expression of Fn to ensure the purity of NRCFs; (c) CCK-8 analysis cell toxicity of ZB in NRCFs (n=3); (d) CCK-8 analysis cell viability of ZB in NRCFs (n=4); (e) The mRNA levels of CTGF in NRCFs (n=4); (f) The mRNA levels of Fn in NRCFs (n=4); (g) The mRNA levels of α-SMA in NRCFs (n=4); (h) Immunofluorescence staining of α-SMA in NRCFs. Scale bar: 50 μm; (i) The mRNA levels of Col-I in NRCFs (n=4); (j) The mRNA levels of Col-III in NRCFs (n=4). Quantification of CTGF, Fn, α-SMA, Col-I and Col-III were normalized to GAPDH. The data are shown as mean±SEM (one-way ANOVA with Tukey’s post-hoc multiple comparison tests). **, P<0.01, ****, P<0.0001 vs. CON; #, P<0.05, ###, P<0.001, ####, P<0.0001 vs. ISO.
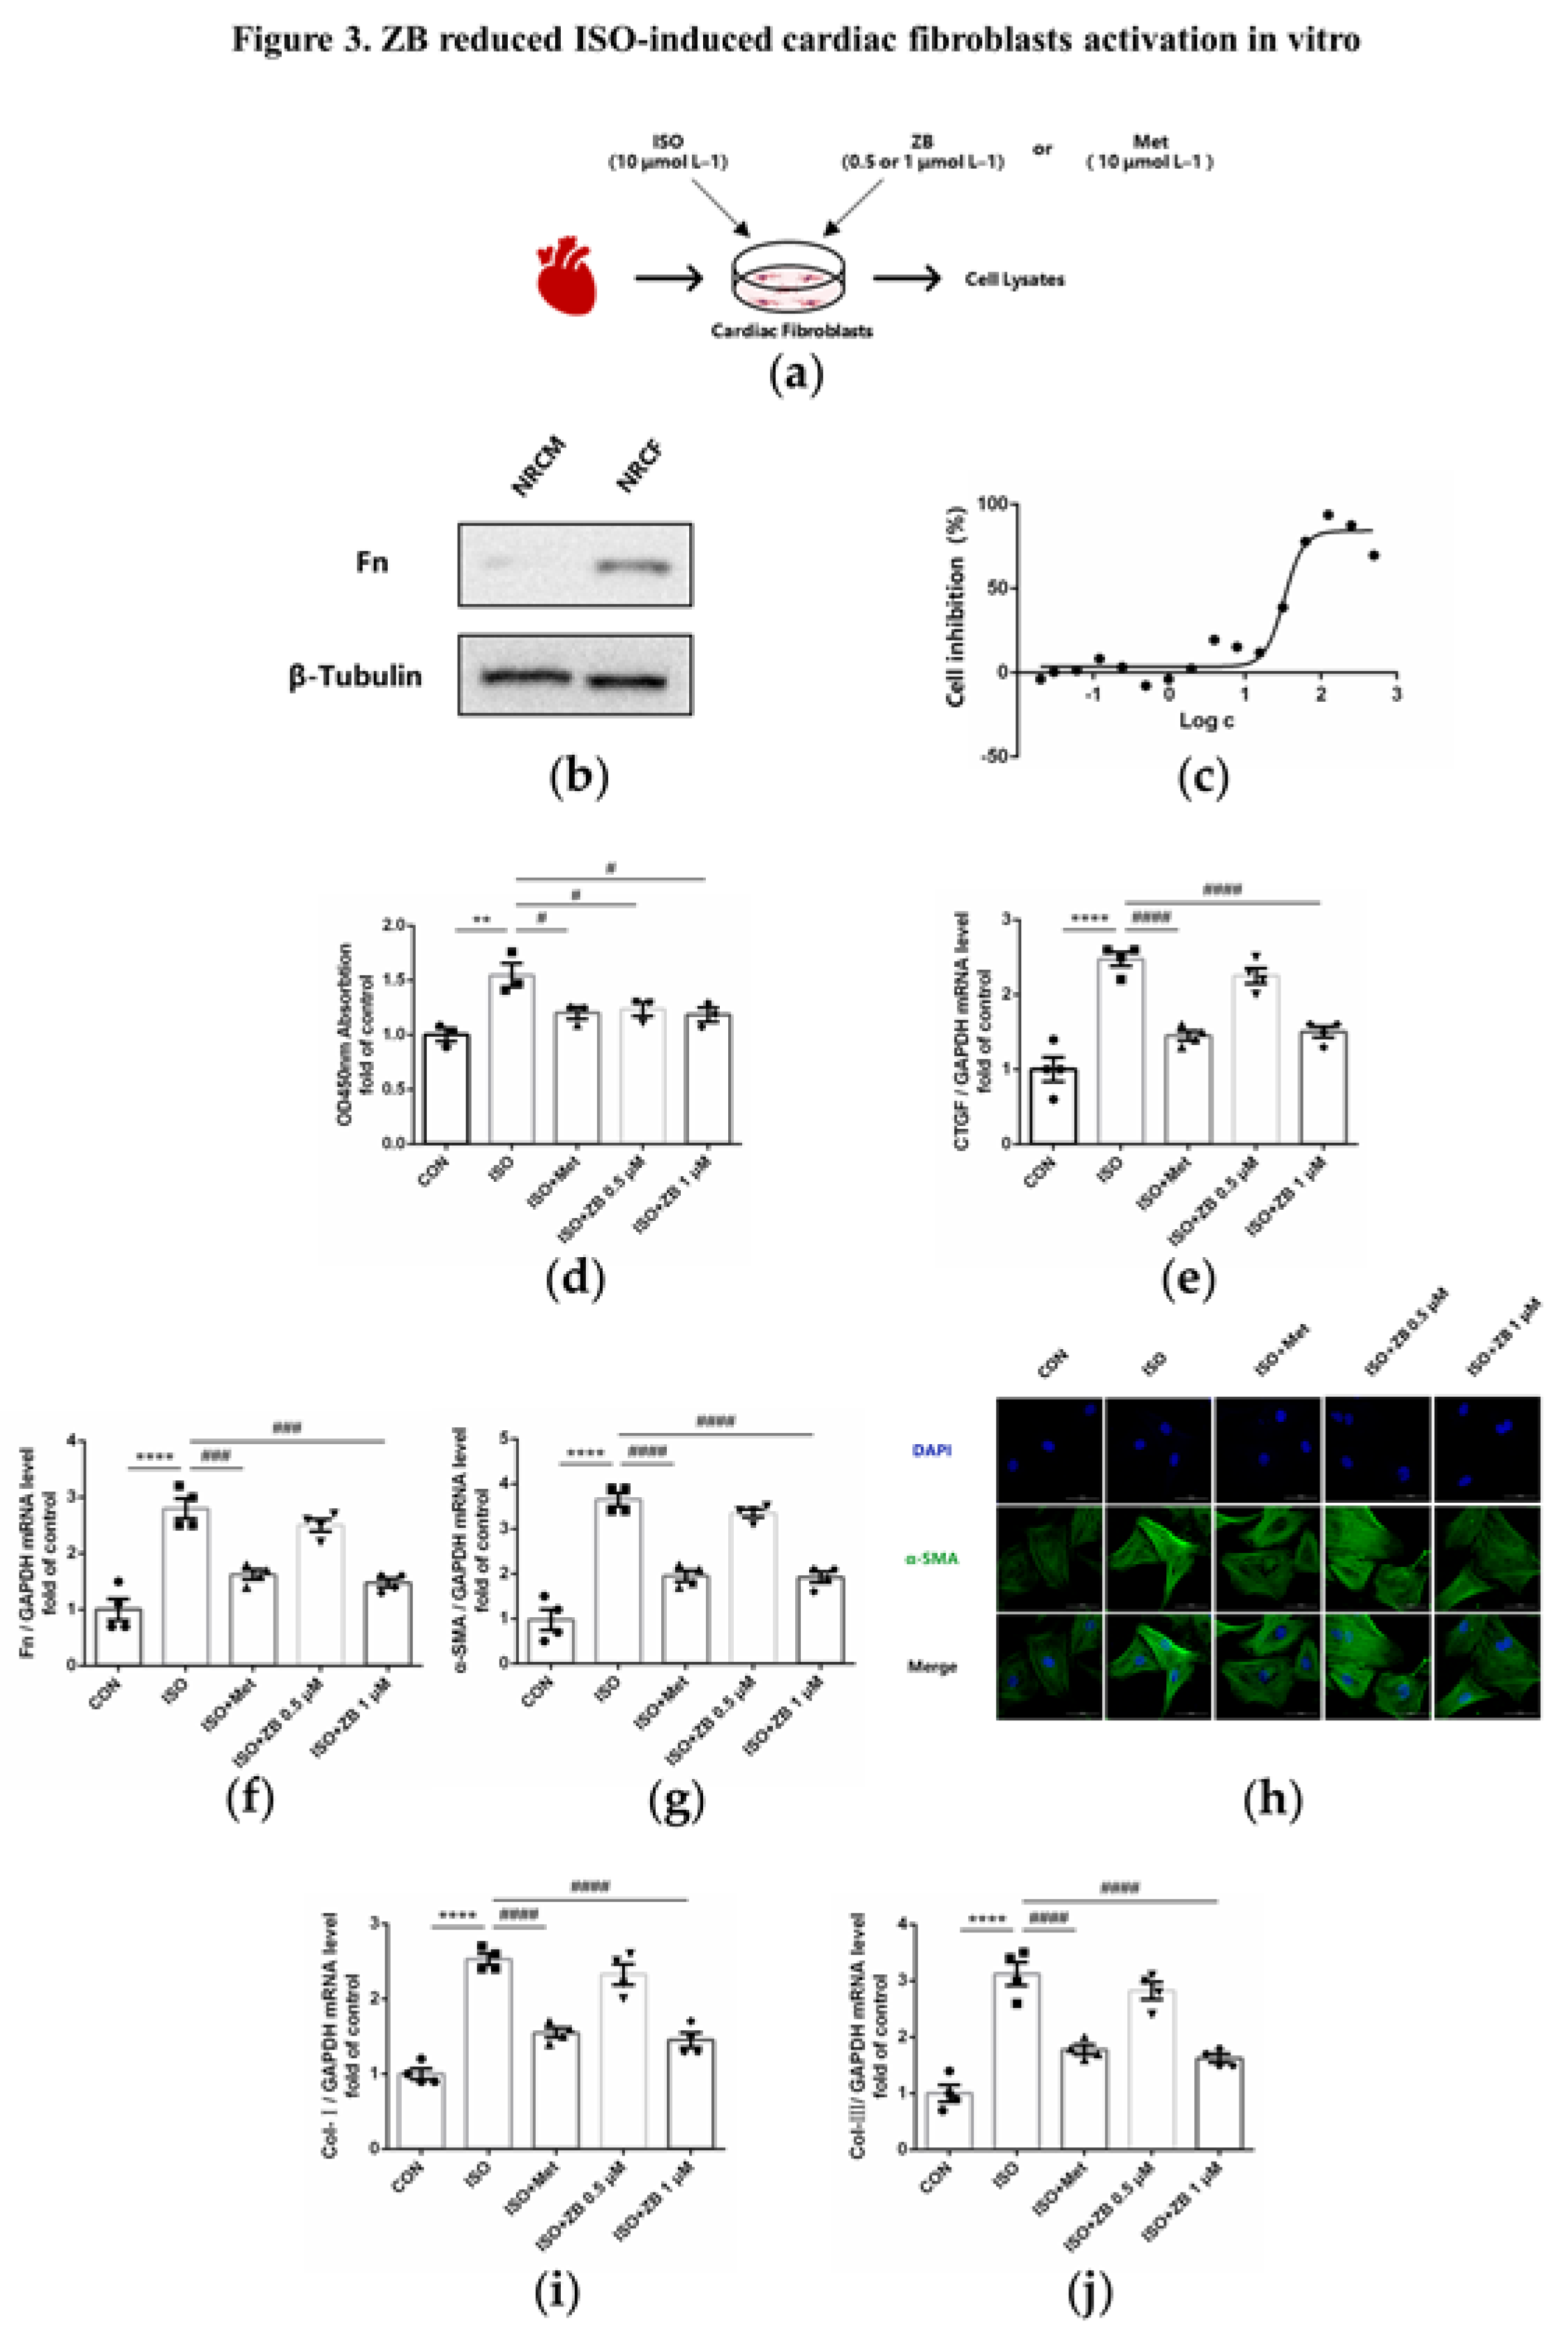
Figure 4.
ZB attenuated ISO-induced cardiac inflammation. (a) Dosing regimen in ISO-induced cardiac inflammation model. Mice were treated by daily subcutaneous injection of 10 mg kg–1 d–1 ISO for 7 days. During 7 days, 10 mg kg–1 d–1、20 mg kg–1 d–1 ZB、30 mg kg–1 d–1 Met or equal Saline was gavaged daily as indicated. Met was used to be a positive control; (b) Representative 1× and 20× images of Mac-3 staining of heart sections. Scale bar (upper): 2 mm, scale bar (lower): 100 μm; (c) The mRNA levels of IL-1β in heart tissue (n=6); (d) The mRNA levels of IL-6 in heart tissue (n=6); (e) The mRNA levels of TNF-α in heart tissue (n=6). Quantification of IL-1β, IL-6 and TNF-α were normalized to GAPDH; (f) The determination of IL-1β in heart tissue (n=6); (g) The determination of IL-6 in heart tissue (n=6); (h) The determination of TNF-α in heart tissue (n=6). The data are shown as mean±SEM (one-way ANOVA with Tukey’s post-hoc multiple comparison tests). ****, P<0.0001 vs. Saline; ##, P<0.01, ###, P<0.001, ####, P<0.0001 vs. ISO.
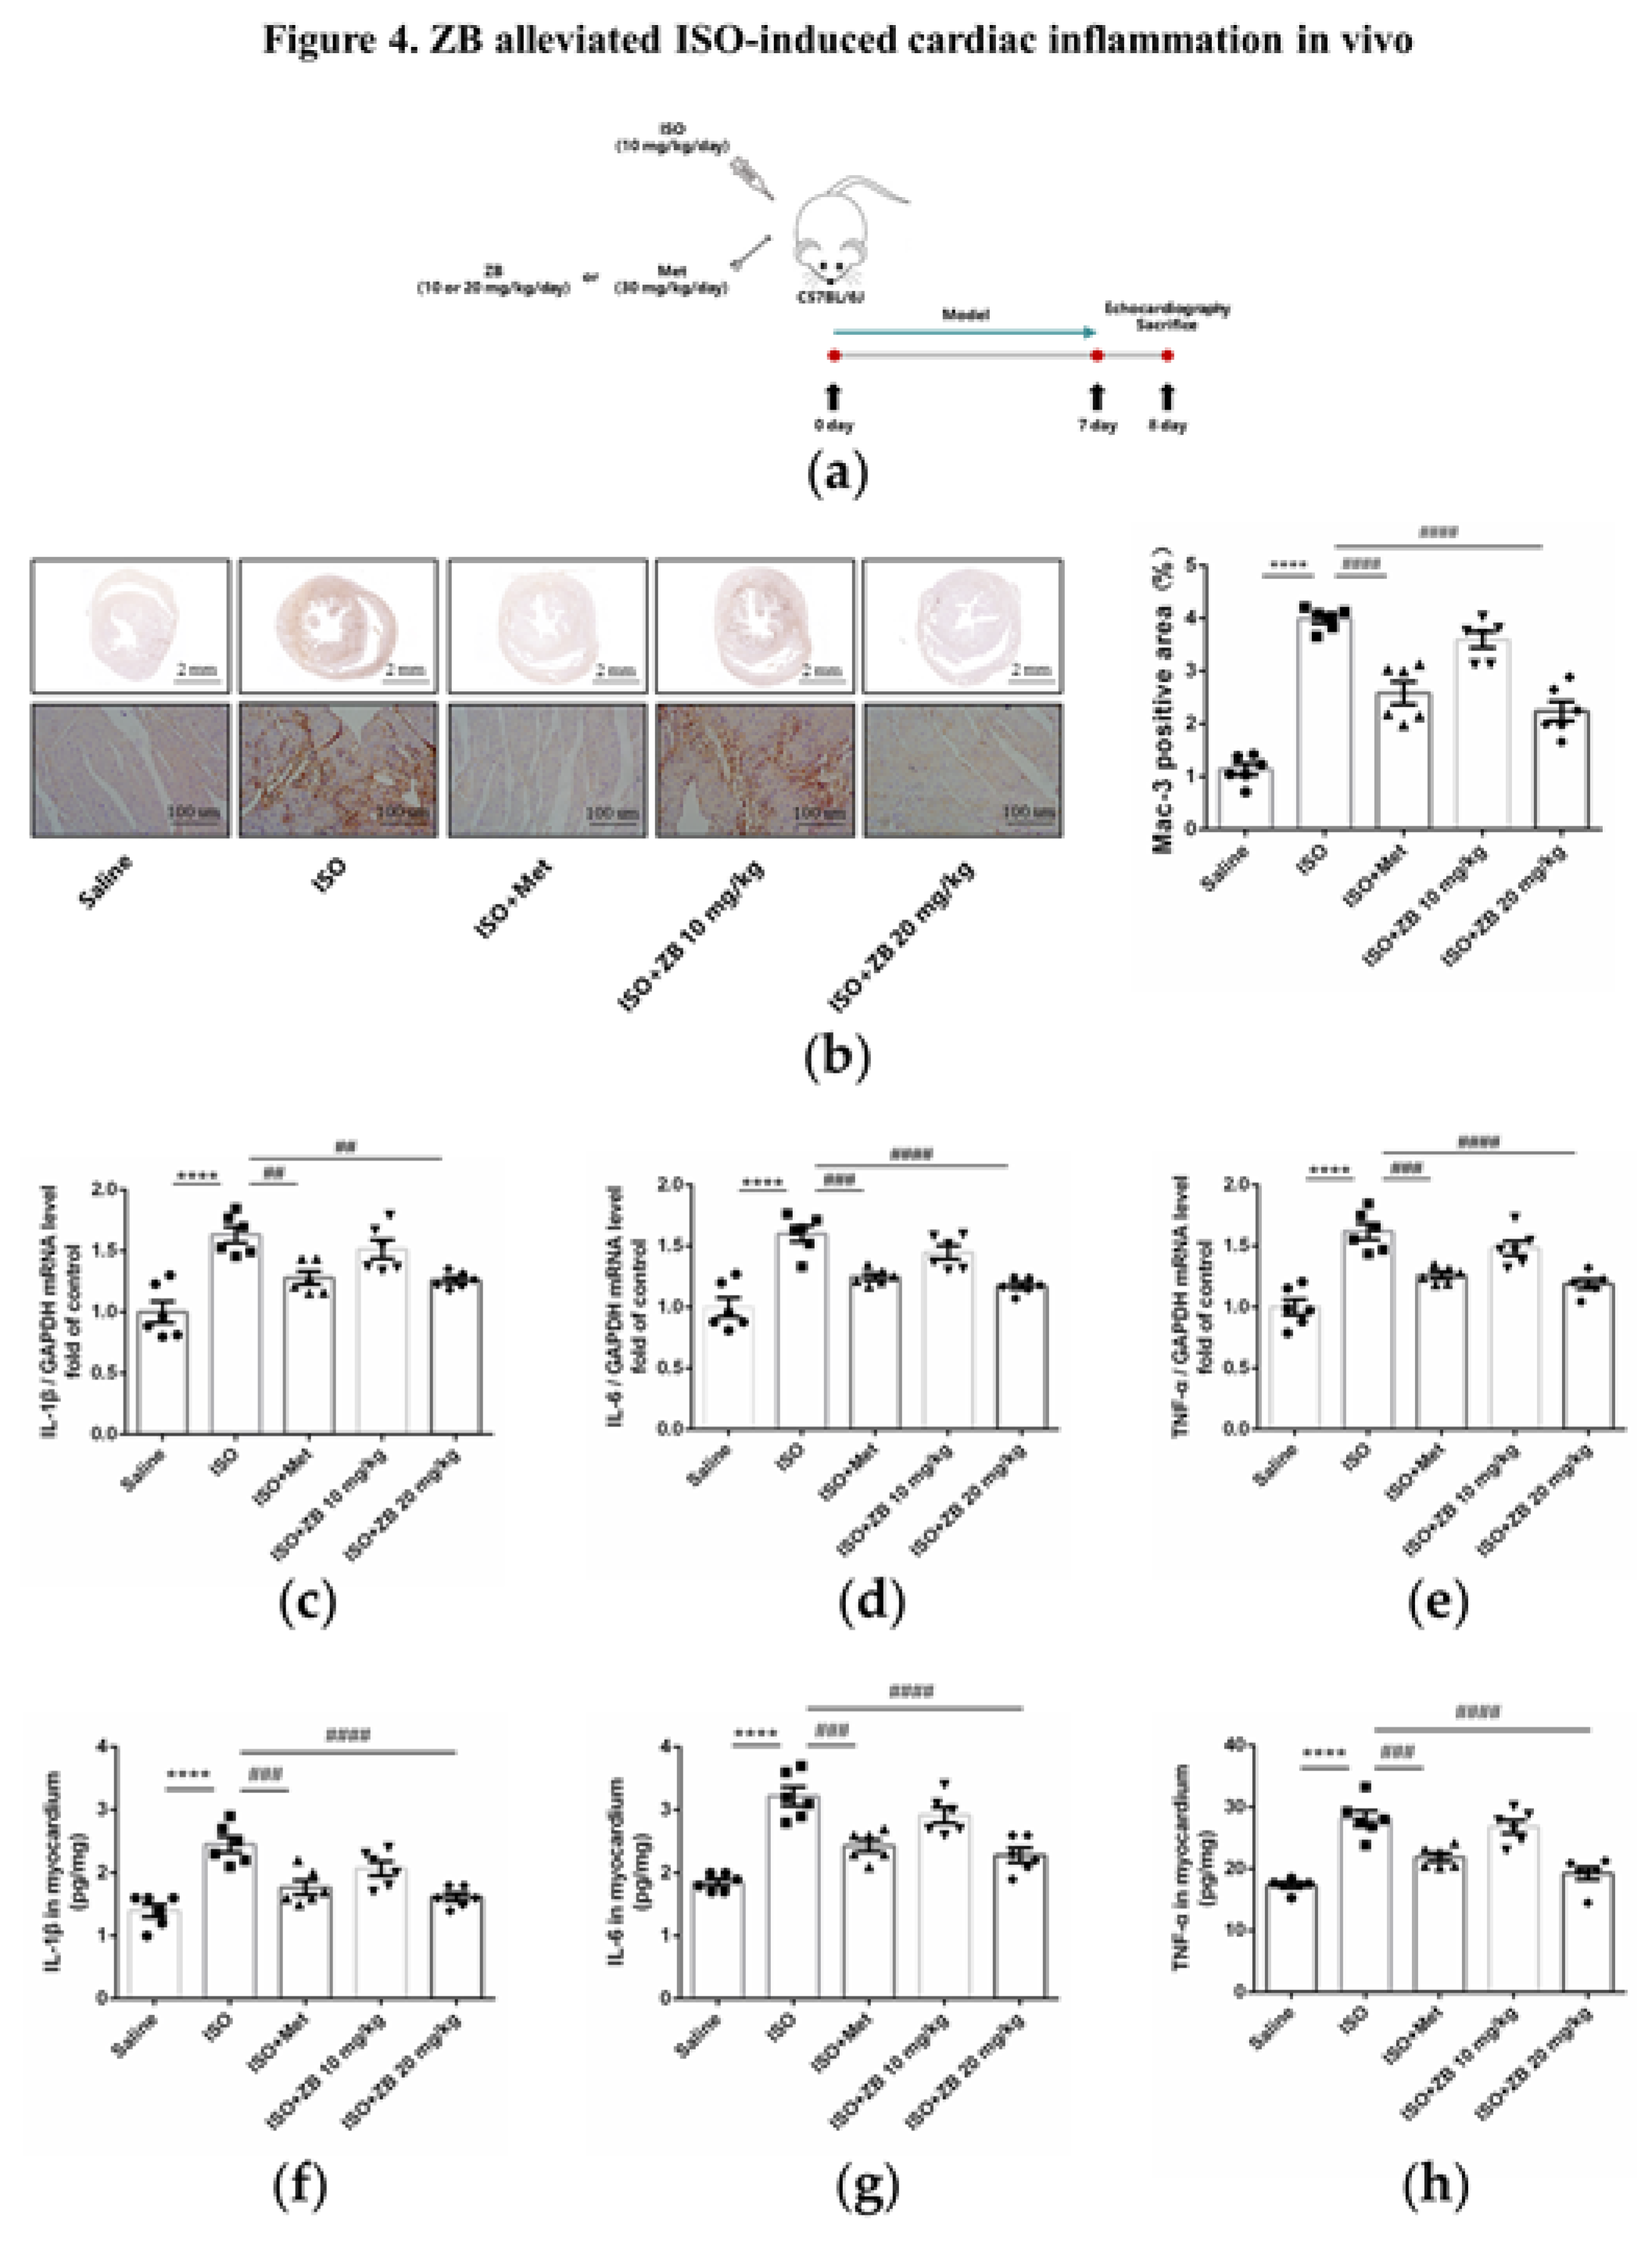
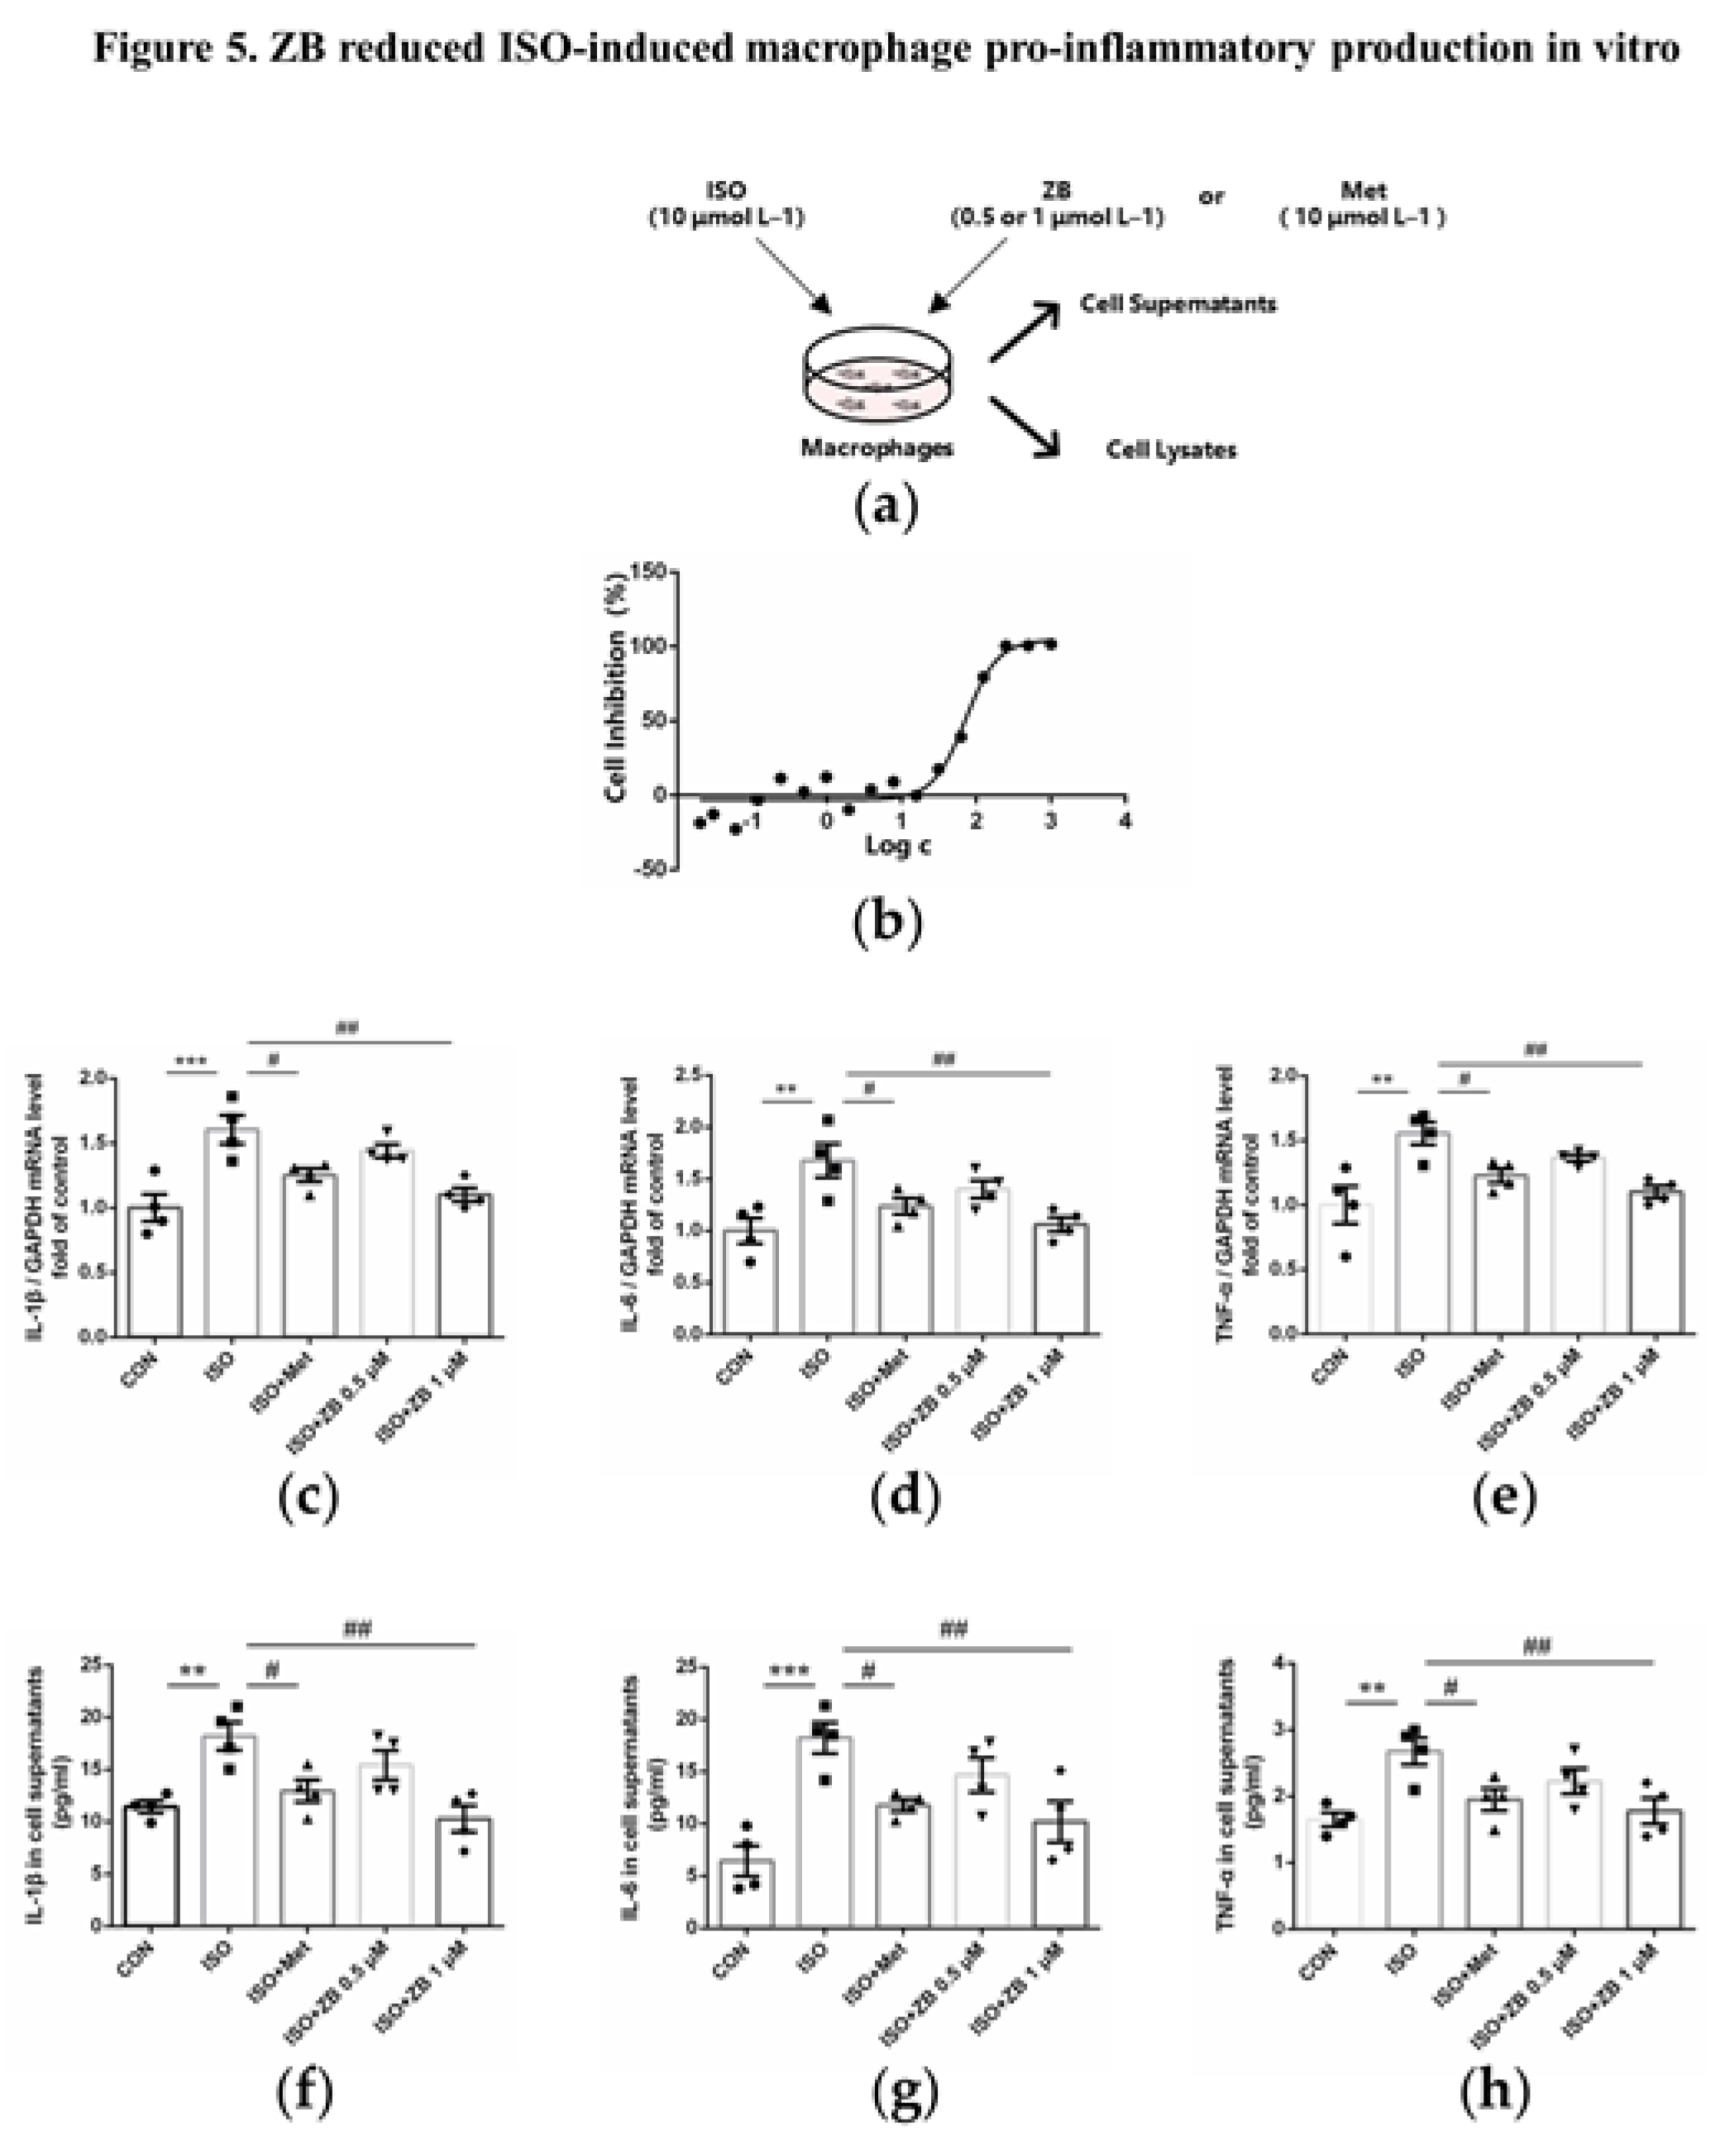
Figure 5.
ZB reduced ISO-induced pro-inflammatory production. (a) Dosing regimen in ISO-induced RAW264.7 cells. RAW264.7 cells were starved for 12 h, incubated with ZB (0.5 μmol L–1 or 1 μmol L–1), Met (10 μmol L–1) or equal DMSO for 1 h and then treated with ISO (10 μmol L–1) for 24 h (n=4). Met was used to be a positive control; (b) Analysis cell toxicity of ZB in RAW264.7 by CCK-8 (n=3); (c) The mRNA levels of IL-1β in RAW264.7 cells (n=4); (d) The mRNA levels of IL-6 in RAW264.7 cells (n=4); (e) The mRNA levels of TNF-α in RAW264.7 cells (n=4). Quantification of IL-1β, IL-6 and TNF-α were normalized to GAPDH; (f) The determination of IL-1β in RAW264.7 cell supernatants (n=4); (g) The determination of IL-6 in RAW264.7 cell supernatants (n=4); (h) The determination of TNF-α in RAW264.7 cell supernatants (n=4). The data are shown as mean±SEM (one-way ANOVA with Tukey’s post-hoc multiple comparison tests). **, P<0.01, ***, P<0.001 vs. CON; #, P<0.05, ##, P<0.01 vs. ISO.
Figure 6.
ZB inhibited ISO-induced cardiac fibroblasts activated by STAT3 and PI3K/Akt signaling pathways. (a) Dosing regimen in ISO-induced NRCFs. NRCFs were starved for 24 h, incubated with ZB (0.5 μmol L–1 or 1 μmol L–1) 、Met (10 μmol L–1) or equal DMSO for 1 h and then treated with ISO (10 μmol L–1) for 5 min or 15 min. Met was used to be a positive control; (b) Western Blot analysis of BTK, STAT3 and PI3K/Akt signal pathways in NRCFs; (c) Quantification of BTK signal pathways in NRCFs (n=4); (d) Quantification of STAT3 signal pathways in NRCFs (n=4); (e) Quantification of PI3K signal pathways in NRCFs (n=4); (f) Quantification of Akt signal pathways in NRCFs (n=4). BTK, STAT3, PI3K and Akt signal pathways were normalized to GAPDH. The ratio of phosphorylated protein to total protein reflects the activation of signaling pathways. The data are shown as mean±SEM (one-way ANOVA with Tukey’s post-hoc multiple comparison tests). *, P<0.05, **, P<0.01, ***, P<0.001, ****, P<0.0001 vs. CON; #, P<0.05, ##, P<0.01, ####, P<0.0001 vs. ISO.
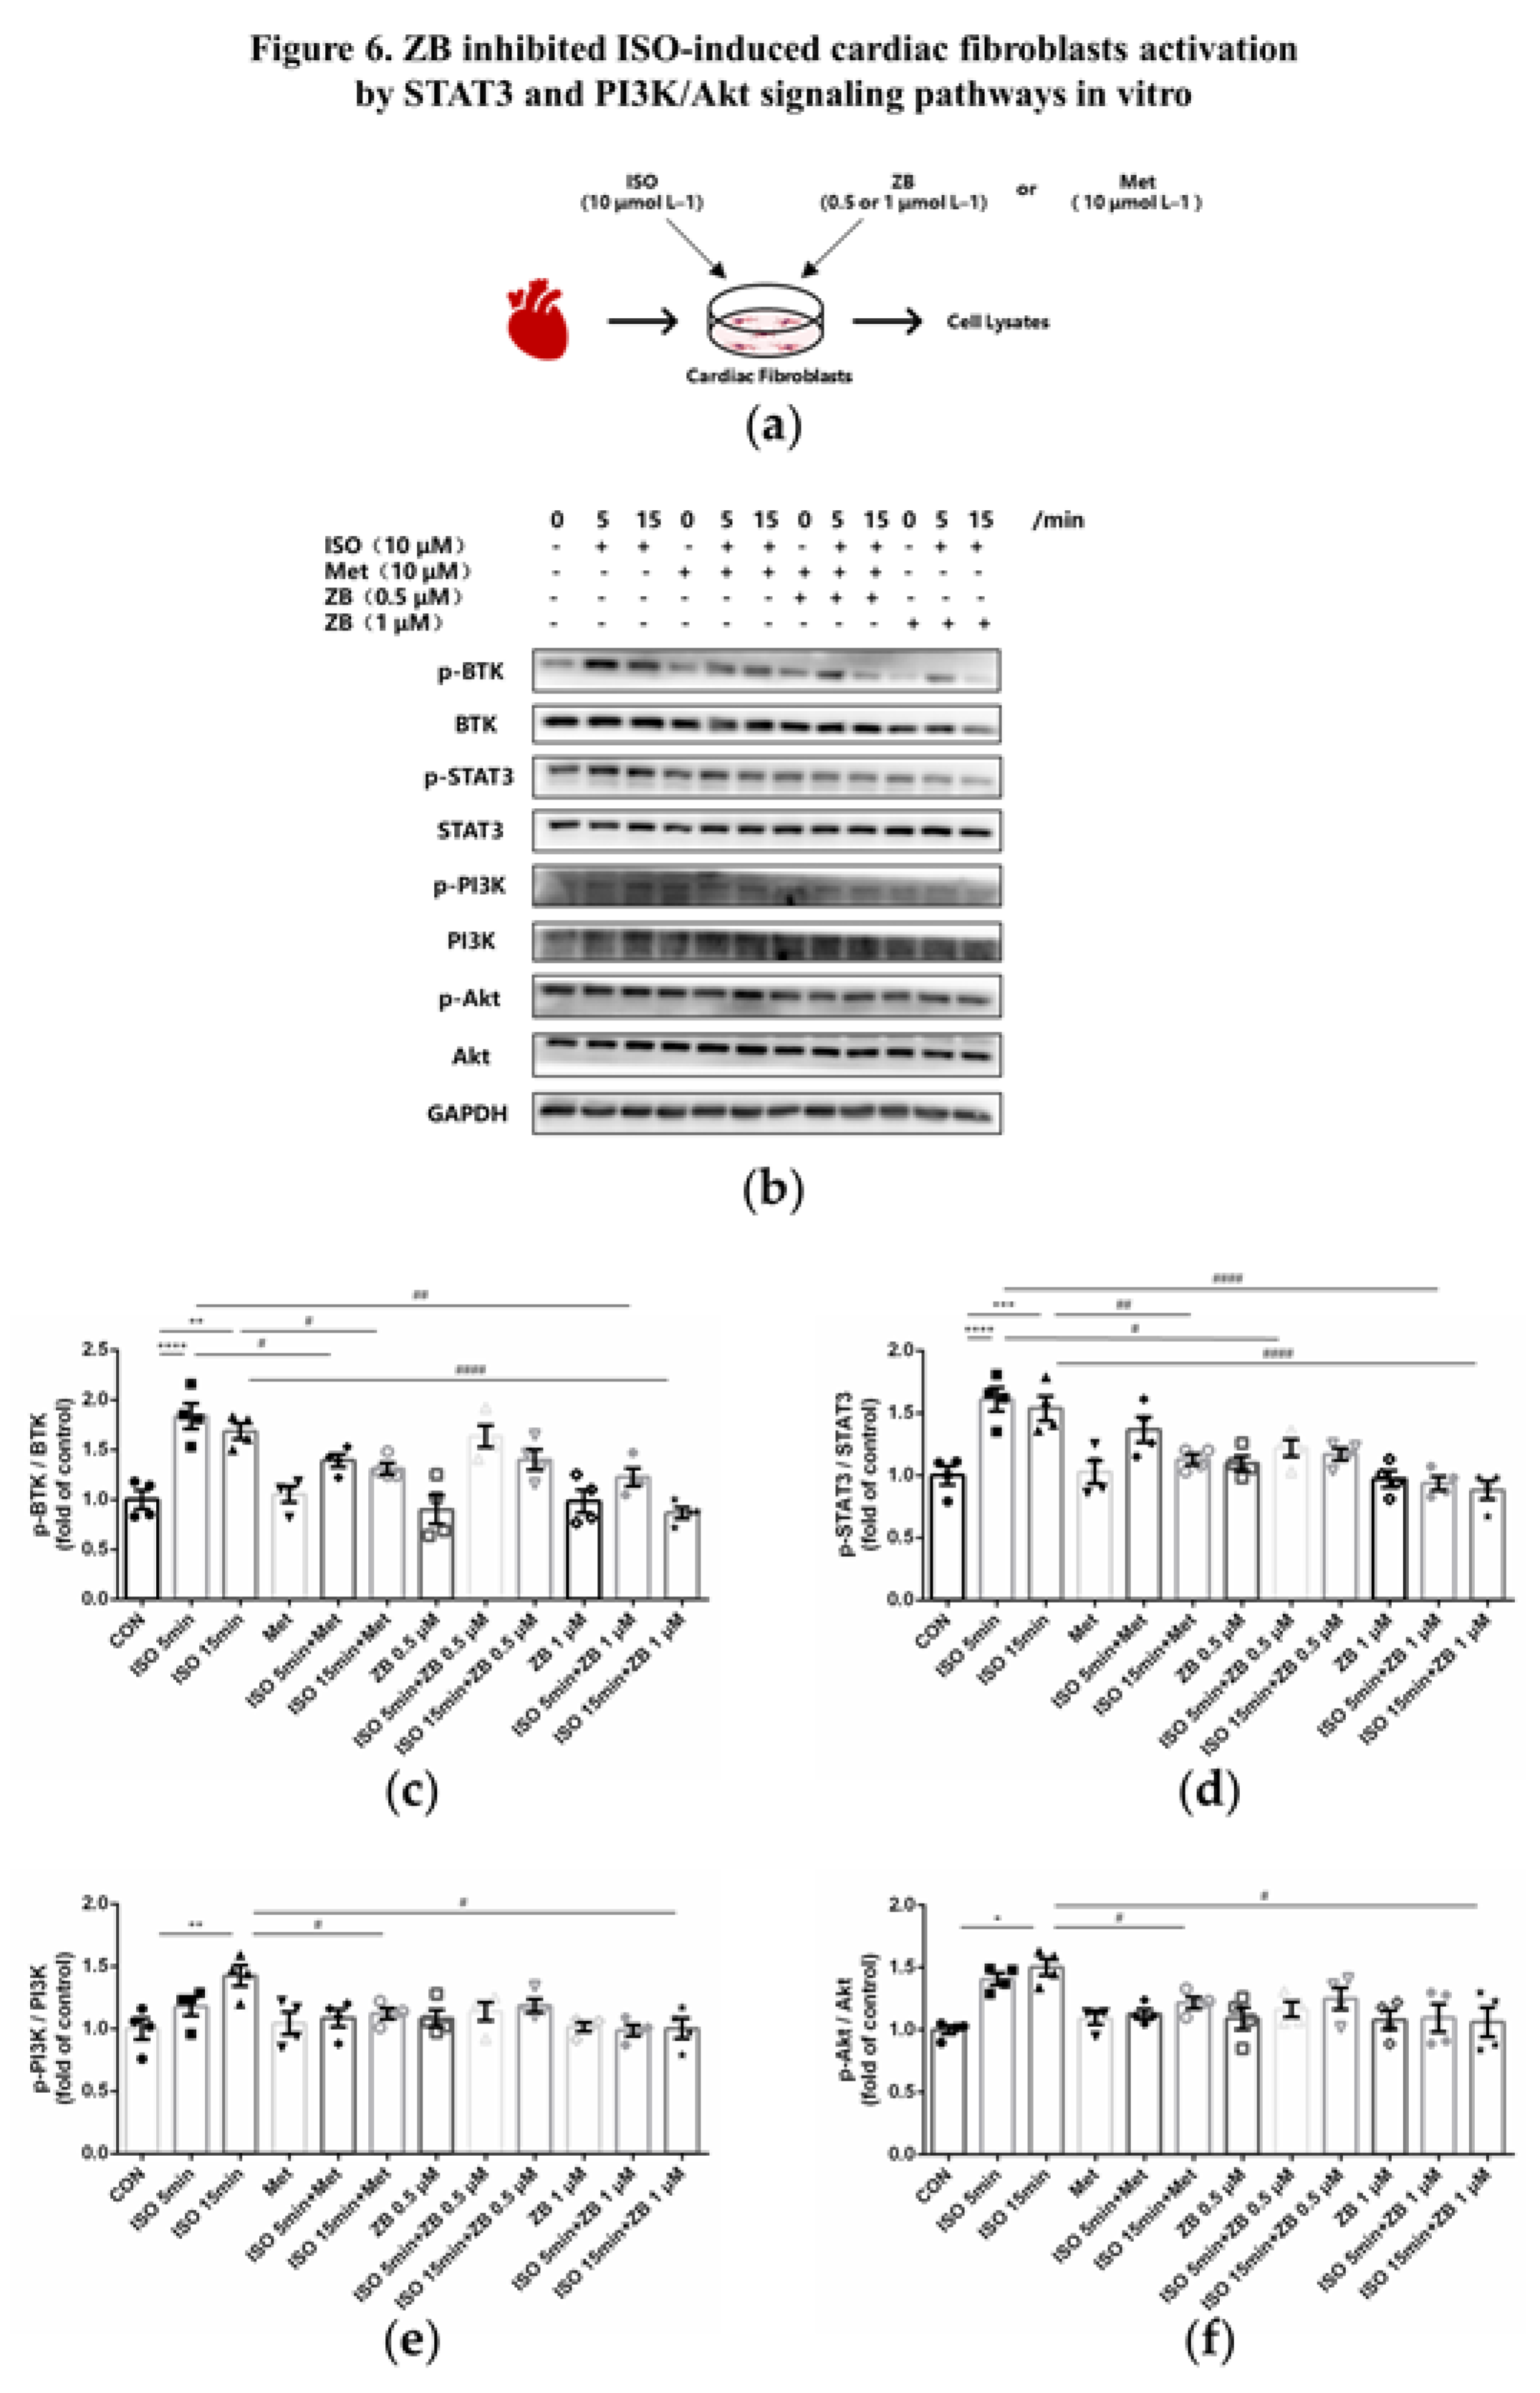
Figure 7.
ZB inhibited ISO-induced macrophage pro-inflammatory production by PI3K/Akt and NF-κB signaling pathways. (a) Dosing regimen in ISO-induced RAW264.7 cells. RAW264.7 cells were starved for 12 h, incubated with ZB (0.5 μmol L–1 or 1 μmol L–1) 、Met (10 μmol L–1) or equal DMSO for 1 h and then treated with ISO (10 μmol L–1) for 24 h (n=4). Met was used to be a positive control; (b) Western Blot analysis of BTK, PI3K/Akt and NF-κB signal pathways in RAW264.7 cells; (c) Quantification of BTK signal pathways in RAW264.7 cells (n=4); (d) Quantification of PI3K signal pathways in RAW264.7 cells (n=4); (e) Quantification of Akt signal pathways in RAW264.7 cells (n=4); (f) Quantification of NF-κB signal pathways in RAW264.7 cells (n=4). BTK, PI3K, Akt and NF-κB signal pathways were normalized to GAPDH. The ratio of phosphorylated protein to total protein reflects the activation of signaling pathways. The data are shown as mean±SEM (one-way ANOVA with Tukey’s post-hoc multiple comparison tests). ***, P<0.001 vs. CON; #, P<0.05, ##, P<0.01 vs. ISO.
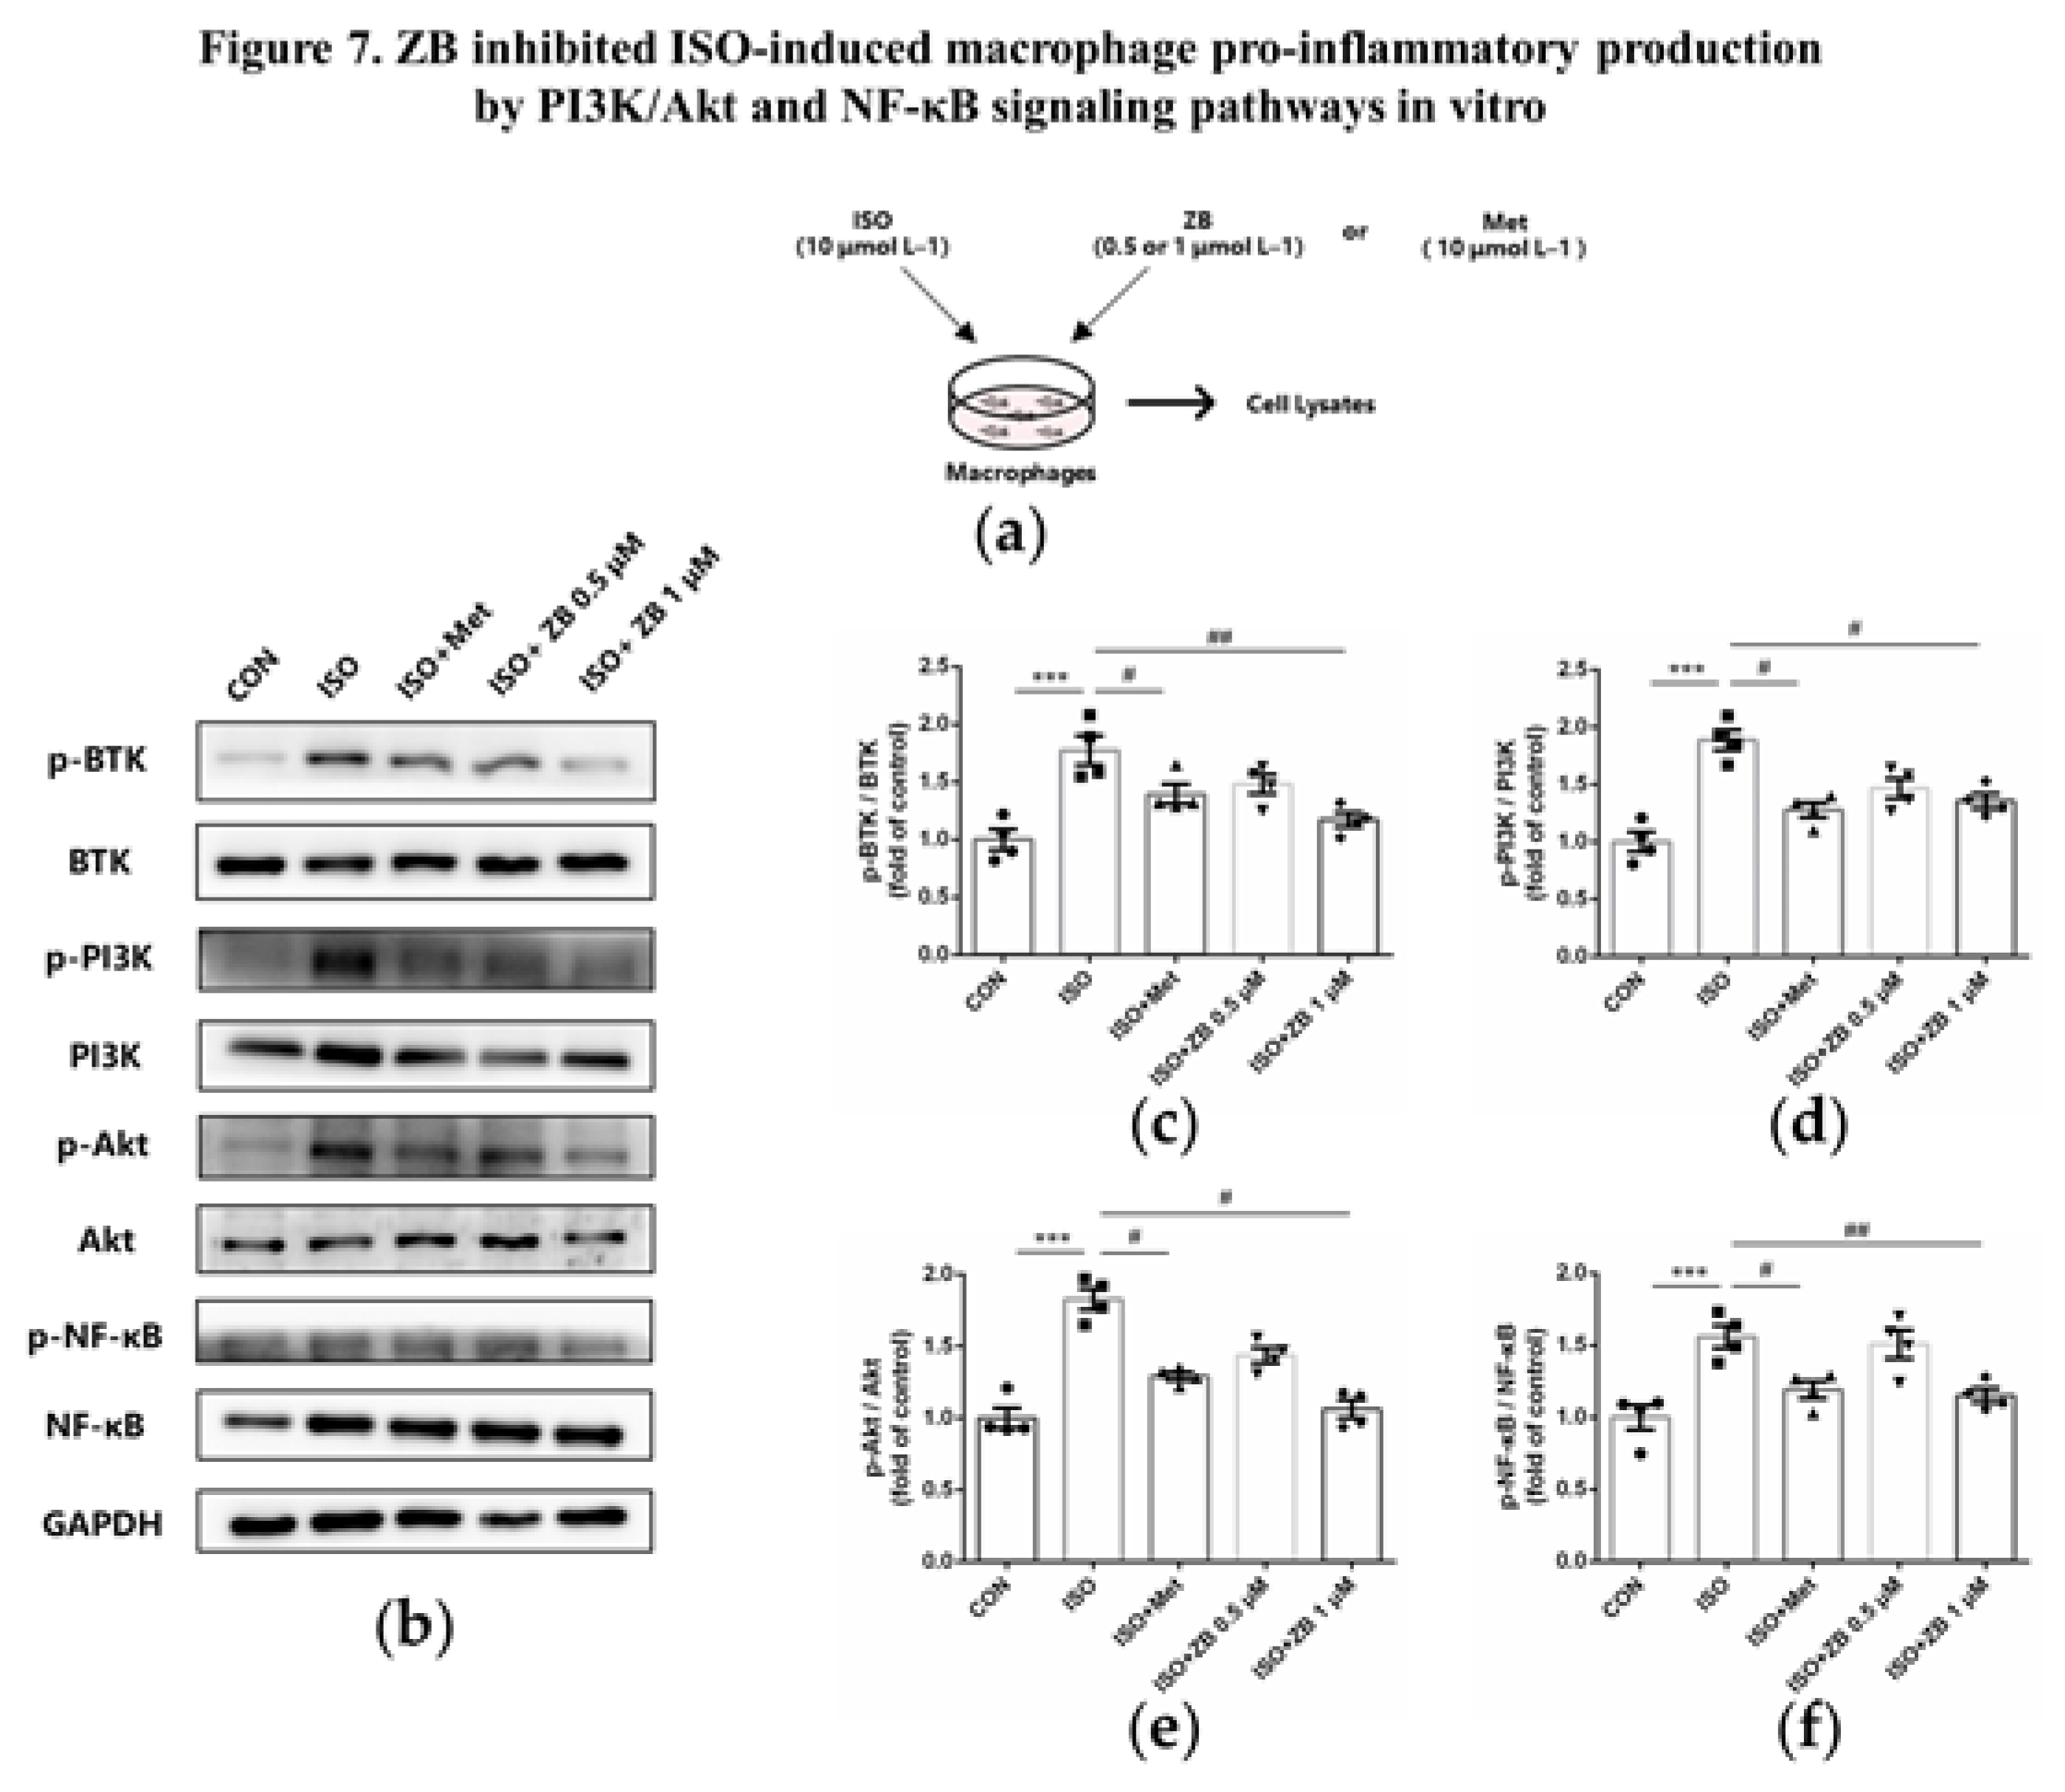
Figure 8.
ZB inhibited ISO-induced cardiac fibrosis and inflammation by STAT3、PI3K/Akt and NF-κB signaling pathways. (a) Dosing regimen in ISO-induced cardiac fibrosis and inflammation model. Mice were treated by daily subcutaneous injection of 10 mg kg–1 d–1 ISO for 7 days. During 7 days, 10 mg kg–1 d–1、20 mg kg–1 d–1 ZB、30 mg kg–1 d–1 Met or equal Saline was gavaged daily as indicated. Met was used to be a positive control; (b) Western Blot analysis of BTK, STAT3, NF-κB and PI3K/Akt signal pathways in mice heart tissues; (c) Quantification of BTK signal pathways in heart tissues (n=6); (d) Quantification of STAT3 signal pathways in heart tissues (n=6); (e) Quantification of NF-κB signal pathways in heart tissues (n=6); (f) Quantification of PI3K signal pathways in heart tissues (n=6); (g) Quantification of Akt signal pathways in heart tissues (n=6). BTK, STAT3, NF-κB, PI3K and Akt signal pathways were normalized to GAPDH. The data are shown as mean±SEM (one-way ANOVA with Tukey’s post-hoc multiple comparison tests). ****, P<0.0001 vs. Saline; #, P<0.05, ##, P<0.01, ###, P<0.001, ####, P<0.0001 vs. ISO.
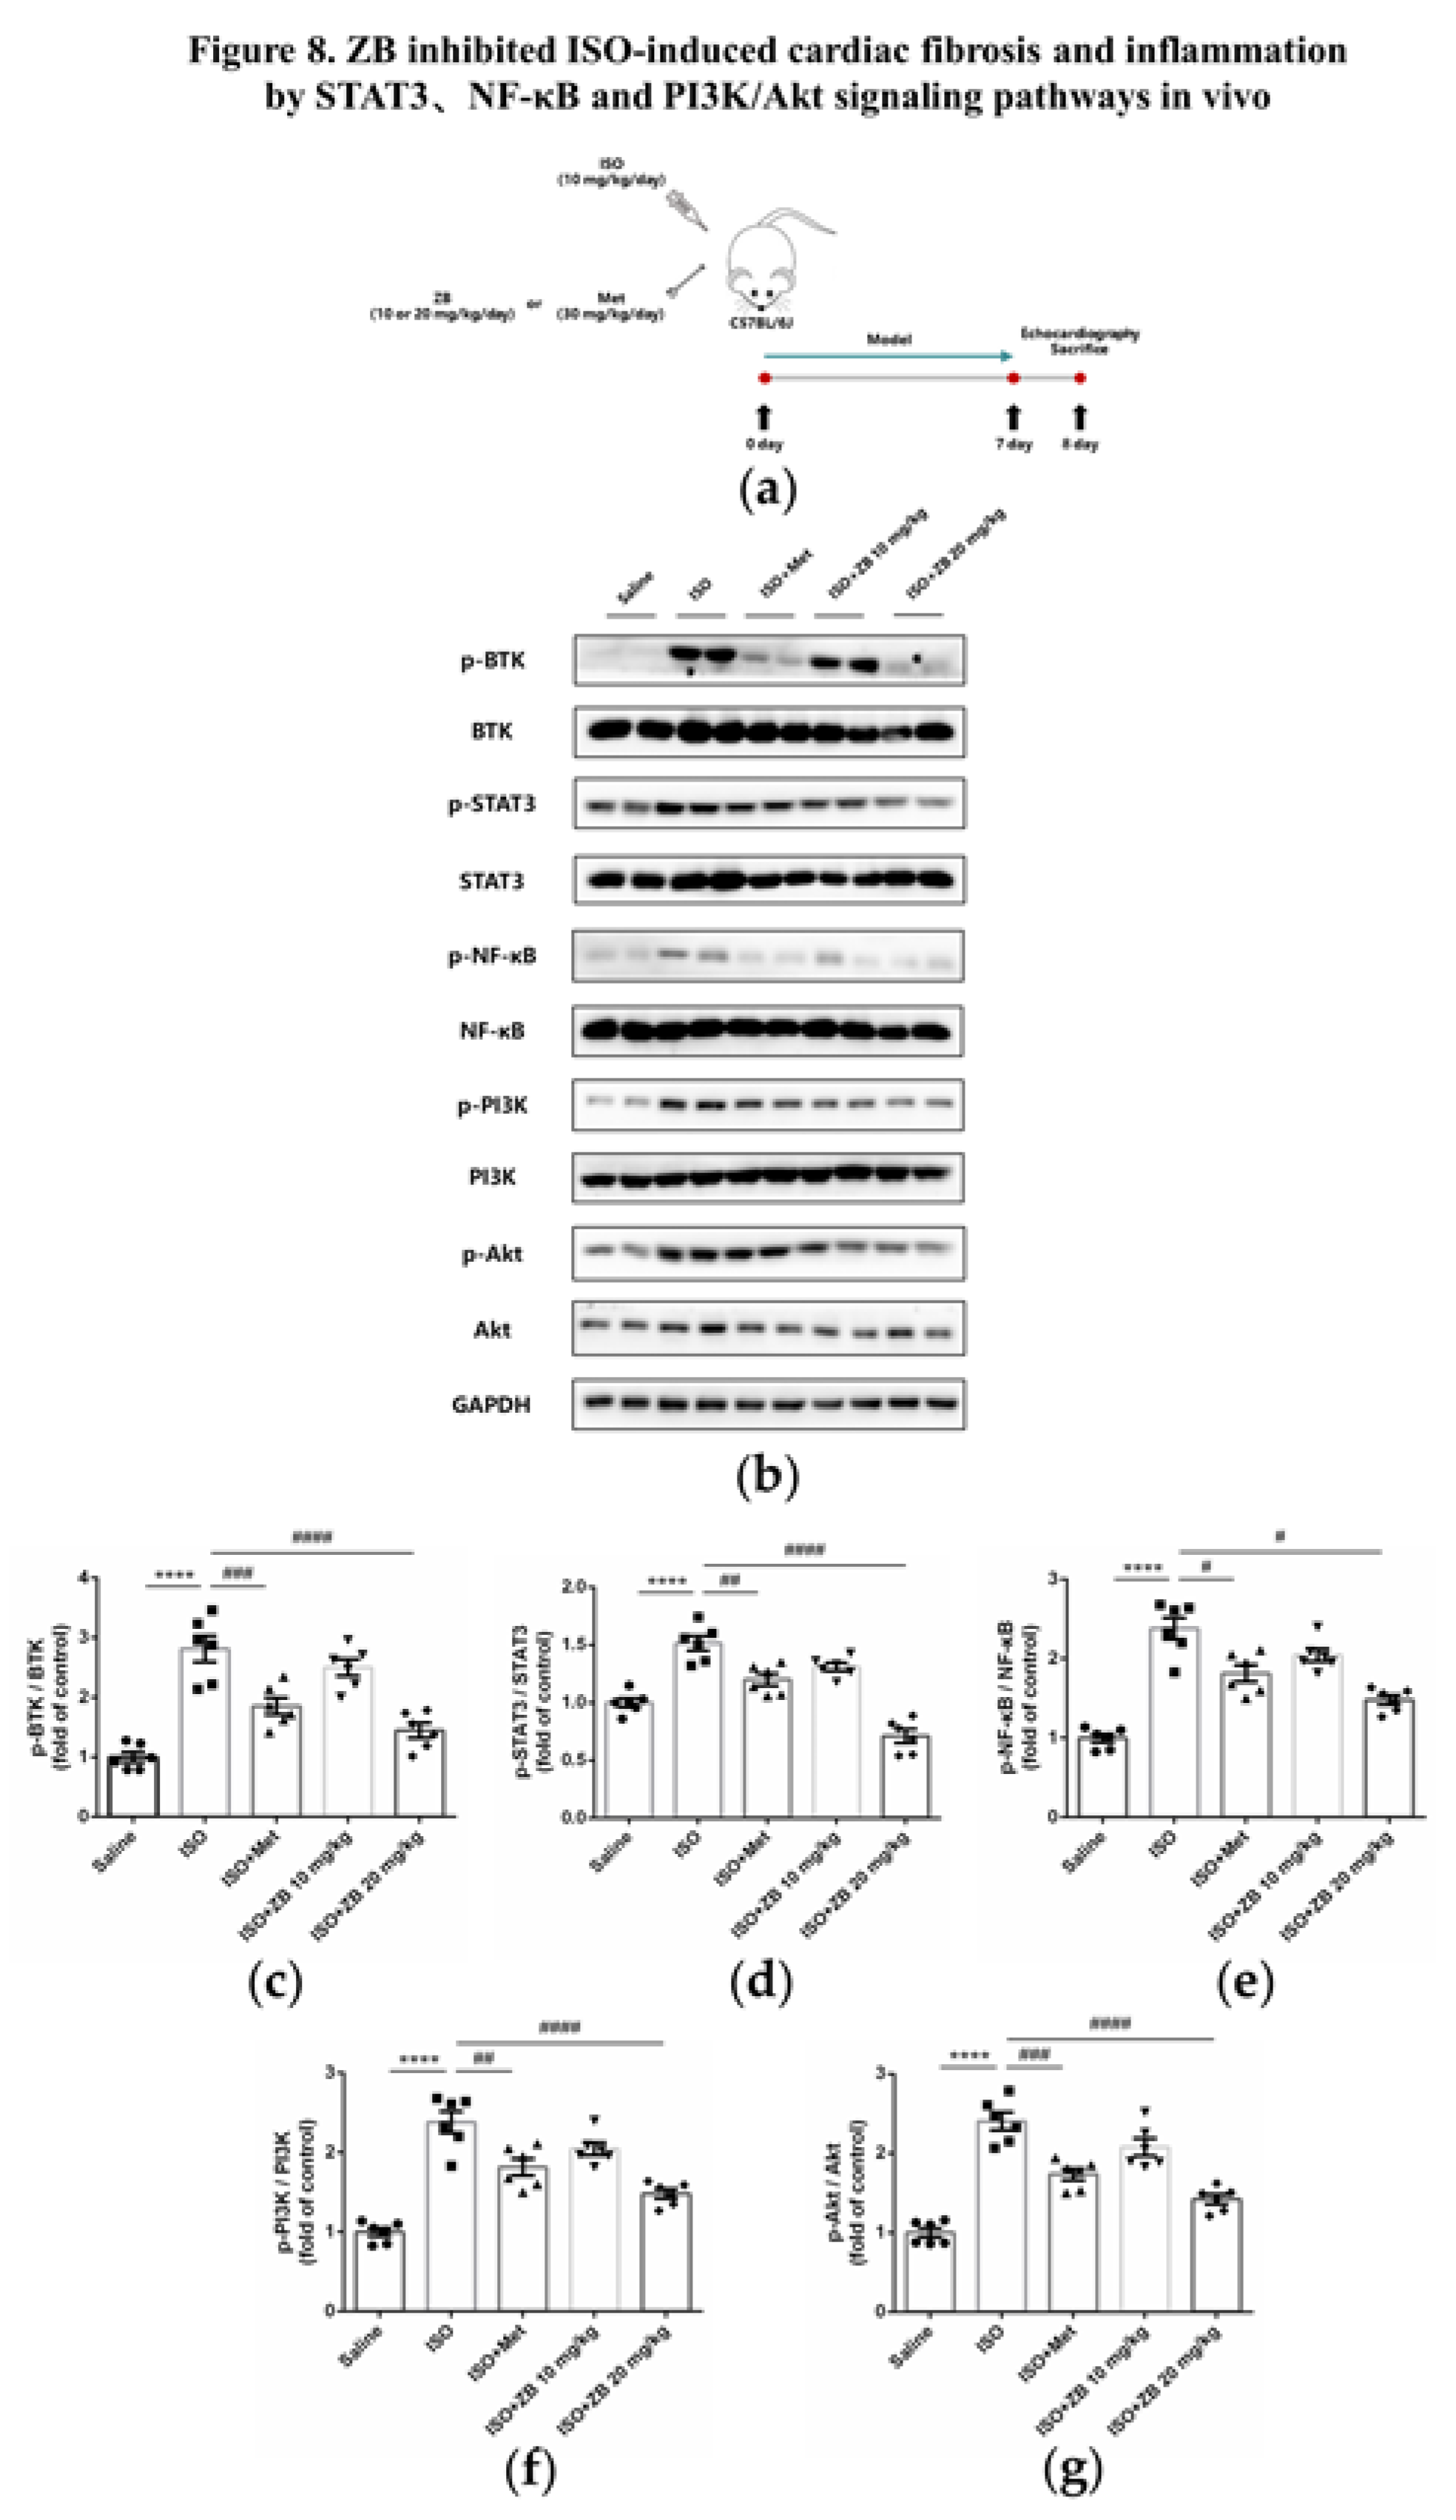
Figure 9.
Working model of the effects of ZB on β-AR stimulation-induced cardiac fibrosis and inflammation.
Figure 9.
Working model of the effects of ZB on β-AR stimulation-induced cardiac fibrosis and inflammation.
Table 1.
The list of gene primers.
Table 1.
The list of gene primers.
| Gene |
Forward Primer Sequence
(5’-3’) |
Reverse Primer Sequence
(3’ -5’) |
| Mouse ANP |
CTTCCAGGCCATATTGGAG |
GGGGGCATGACCTCATCTT |
| Mouse BNP |
ACAAGATAGACCGGATCGGA |
AGCCAGGAGGTCTTCCTACA |
| Mouse CTGF |
CCAACTATGATTAGAGCCAACTG |
AGGCACAGGTCTTGATGAAC |
| Mouse Fibronectin |
TCGGATACTTCAGCGTCAGGA |
TCGGATACTTCAGCGTCAGGA |
| Mouse α-SMA |
GTCCCAGACATCAGGGAGTAA |
GTCCCAGACATCAGGGAGTAA |
| Mouse Collagen Ⅰ |
ATGTGGACCCCTCCTGATAGT |
ATGTGGACCCCTCCTGATAGT |
| Mouse Collagen-III |
TGGTCCTCAGGGTGTAAAGG |
GTCCAGCATCACCTTTTGGT |
| Mouse IL-1β |
GAAATGCCACCTTTTGACAGTG |
TGGATGCTCTCATCAGGACAG |
| Mouse IL-6 |
CTGCAAGAGACTTCCATCCAG |
AGTGGTATAGACAGGTCTGTTGG |
| Mouse TNF-α |
CAGGCGGTGCCTATGTCTC |
CGATCACCCCGAAGTTCAGTAG |
| Mouse GAPDH |
AGGTCGGTGTGAACGGATTTG |
GGGGTCGTTGATGGCAACA |
Table 2.
The list of primary antibodies.
Table 2.
The list of primary antibodies.
| Antibody |
Company |
Item No. |
| p-BTK |
Affinity |
AF0841 |
| BTK |
Affinity |
DF6472 |
| p-NF-κB |
Affinity |
AF2006 |
| NF-κB |
Affinity |
AF0874 |
| p-PI3K |
Affinity |
AF3241 |
| PI3K |
Affinity |
AF6241 |
| p-Akt |
Affinity |
AF0016 |
| Akt |
Affinity |
AF6261 |
| p-STAT3 |
Affinity |
AF0016 |
| STAT3 |
Affinity |
AF6294 |
| Fibronectin |
Proteintech |
15613-1-AP |
| α-SMA |
Affinity |
AF1032 |
| Collagen-Ⅰ |
Cell Signaling Technology |
72026 |
| Mac-3 |
BD Biosciences |
550292 |
| β-Tubulin |
Affinity |
AF7011 |
| GAPDH |
Affinity |
AF7021 |
