
Submitted:
19 June 2023
Posted:
19 June 2023
You are already at the latest version
Abstract
Previous research via cell experiments has shown that ultrafine particles (UFPs, particles less than 100 nm) emitted from Three-Dimensional desktop printers (3D printers) had cytotoxicity. However, a few particles from different filaments and their cytotoxicity combinations have been tested. Here we quantify emissions of UFPs and use Air-Liquid Interface (ALI) from one commercially available filament extrusion desktop 3D printer utilizing three different filaments by controlled experiments. A549 cells were exposed at the ALI to UFPs generated by a working 3D printer for an average of 45 minutes and 90 minutes. Twenty-four hours after exposure, cells were analyzed for percent cytotoxicity grown on the 24-well ALI insert (LDH assay). UFP exposure resulted in decreased cell viability (significantly increased LDH levels). The result shows that Acrylonitrile butadiene styrene (ABS) has the most significant particle emission. ALI exposures enable in vitro testing of mixtures of particles such as UFP from a 3D printer. ABS is the only filament with a significant difference compared with the HEPA control in 90 minutes of exposure (p-value <0.05). ABS and PETG we used during the experiment presented a significant difference compared with the HEPA control in 45 minutes of exposure.A screening analysis of potential exposure to these products in a typical environment suggests caution should be used when operating many printer and filament combinations in poorly ventilated spaces or without the aid of combined gas and particle filtration systems.
Keywords:
Ultrafine Particles (UFPs)
; Air-Liquid Interface (ALI)
; Cytotoxicity
; Exposure assessment.
1. Introduction
The technology of commercial desktop three-dimensional printing (3D printer) has become increasingly popular in recent years for its high accessibility—the open-source 3D printer. Open-source 3D printers allow the user to print suitable material from any supplier. It is a better choice for 3D printer hobbyists because it is easier to use and offers a wide variety of filaments.
Traditionally, the most popular filaments used in the 3D printer are Acrylonitrile Butadiene Styrene (ABS) and Polylactic Acid (PLA). However, there have been more developed filaments for 3D printers out there in recent years, including Polyethylene Terephthalate(PETG), Thermoplastic Polyurethane (TPU), and Polyetheretherketone (PEEK).
One of the most extensively used operating principles of 3D printers is Fused Deposition Modeling (FDM), which shapes the object by melting and cooling the filaments. Specifically, the filaments are melted and fed onto the build platform with the base and the nozzle, both controlled by a computer. The computer translates the object and its dimension into coordinates that allow the nozzle and base to follow. As the nozzle moves across the base, the plastic cools and becomes solid, forming a complex bond with the previous layer. At this point, the printhead goes up for the next layer of plastic to be laid1.
However, with the potential cytotoxicity, Ultrafine particles (UFPs) and hazardous nanoparticles (NPs) would be generated during this process, and health effects have been evidenced by former research. However, most of these experiments focus on PLA and other traditional filaments applied in 3D printers [1,2]. Several in vitro and in vivo studies indicated NPs induced acute lung inflammation [3,4,5,6]. A human case report showed that a 28-year-old worker had work-related asthma ten days after using 10 FDM 3D printers with ABS filaments in 3000 cubic feet working zone [7].
Air Liquid Interface (ALI) systems have been developed recently; many studies point out that cells exposed to ALI were much more sensitive than submerged cultures in vitro exposure to airborne UFPs. Several studies indicated in vitro cellular assays with human tumorigenic lung epithelial cells (A549) and in vivo mice exposure all showed toxic responses when exposed to PLA and ABS-emitted particles from an FDM 3D printer [6,8,9].
Nonetheless, few existing studies address the emission of multiple filaments for this new open-source technology applied to a 3D printer. Fewer filament materials have been characterized for their toxicity (i.e., only ABS and PLA) [1,2,3,4,5,6,7,8,9]. Despite previous studies giving us a view of the potential health effect of 3D printers, essential gaps in our knowledge of emissions from it still need to be discovered. Therefore, we advance these previous studies by quantifying the emission of particles and ALI culture models from one commercially available desktop FFF open-source 3D printer utilizing one traditional (ABS) and two other advanced filaments (PETG and TPU) to print standardized test objects in a test chamber. We use the results to explore differences in particle and cytotoxic based on filament material.
2. Materials and Methods
2.1. Exposure System Description
All the measurements used the same desktop 3-D printer with hood (Creator Pro 3D Printer, Zhejiang Flashforge 3D Technology Co., Ltd., Zhejiang, China) that was run on a test chamber. An overview of the experimental setup is shown in Figure 1. All simulations were conducted at the Health-Related Aerosol Research Center at the University of Cincinnati. In order to evaluate the distribution of UFPs emitted by 3D printers with multiple filaments, three filaments, and blank control were repeated three times in one 3D printer setup, respectively, in laboratory simulations.
The collected particles were described by a scanning mobility particle sizer (SMPS) (Model 3910, TSI Inc., Shoreview, MN) for 0–420nm aerosol and an optical particle Sizer (OPS) (Model 3330, TSI, Shoreview, MN) used for 0.4–10 μm aerosol measurement, indicating the aerosol exposure of pollutants generated by 3D printers under different filaments in the same working environment. Generation and sampling of 3D printer particles were performed based on the former study [10]. The tested 3D printer has a plastic cover provided by the manufacturer that rests on the top of the device but does not form a tight-fitting seal. All the test was connected with a tube from a 3D printer inside to the instruments, shown in Figure 1.
Even though the manufacturer-recommended different extrusion temperatures for the different feedstocks, we normalized temperature as a variable and excluded the effect of temperature on aerosol; the filament extruder was run at a setting of 220°C [11]. The experimental conditions are shown in Table 1. Meanwhile, tubing the working 3D printer connected the In-Vitro Exposure Systems Air Liquid Interface (CH Technologies Inc., Westwood, NJ) to high flow pumps (located outside the system) to Exposure Systems at 0.6 litres per minute (lpm) (via In-vitro Exposure Systems). For all tests but blank tests, we printed a 40 × 40×50 mm traffic cone sample from Creator Pro 3D Printer, as shown in Figure 2.
2.2. Aerosol Assessments
SMPS 3910 was used to record the aerosol data during preheating, extrusion, printing, and five minutes after extrusion, which had been used to observe the decay in aerosol number concentration within the chamber. Each filament performed three runs. The NanoScan SMPS allowed the real-time measurement of nanoparticles in size ranges of 10–420 nanometers (nm). The NanoScan SMPS utilizes isopropyl alcohol within its internal condensation particle counter (CPC) to accurately record low to high aerosolized concentrations (1,000,000 particles/cm3). The sixteen-size channels let researchers measure particle sizes from 0.3 to 10 μm (μm). The SMPS 3910 was sampled at a flow rate of 0.6 lpm. For the extruder heating element previously set at 220 ° C, after average heating for 5 min, the sidewall temperature of the extruder reaches 220 ° C and extrusion begins. The filament extruder operated at 220 ° C for three different raw materials. Data were recorded using SMPS 3910 during extrusion and continued for five minutes after extrusion had been terminated to observe the decay in particle number concentration within the chamber. Three runs of each plastic type were performed.
The particle number concentration data from each run for each plastic type were analyzed. Concentration data measured by the SMPS were averaged for each plastic type, and a standard deviation at each point was calculated.
2.3. Cytotoxicity Assessments
A549 cells grown on the inserts were exposed to particles emitted during the 3D printing by using different printing materials for 1h. After the exposure, ALI culture was incubated at 37C for 24h to allow the LDH release. A549 cells were exposed at the ALI to UFPs generated by a working 3D printer for an average of 45 min and 90 min. Lactate dehydrogenase (LDH) is an enzyme present in the cytoplasm and released outside of the cells upon damage to the cell membrane. UFP exposure resulted in a decreased cell viability (significantly increased LDH levels).Twenty-four hours after exposure, cells were analyzed for percent cytotoxicity grown on the 24-well ALI insert (LDH assay).
Percent cytotoxicity in A549 cells grown in ALI culture was calculated by LDH release in the media in the basal chamber (n=3 for each exposure). The ALI cultures were exposed to particles emitted during 3D printing sessions using different printing materials such as HEPA filters (control), TPU, ABS, PETG. Extracellular LDH release is an indicative of damage to the cell membrane and cytotoxicity. In our exposure system, the fraction of LDH in the basal media is higher when printing session performed by using materials ABS, TPU, and PETG as compared to printing session performed with the HEPA filterThe LDH assay was performed by using CYQUANT LDH Cytotoxicity Assay (Invitrogen, Waltham, MA) by following the manufacturer’s instructions. Percent cytotoxicity was calculated for each treatment from the fraction of LDH activities in the treated wells and untreated wells (n=3).
2.4. Statistical Analysis
Statistical analysis of the data collected from the simulated chemical exposure events will be analyzed using the software Microsoft Excel®. The t tests were used to compare the results of two different groups at a p-value of 0.05. Statistical significance between the cytotoxicities among the different groups were calculated by using one-way analysis of variance (ANOVA) models with Tukey’s posthoc multiple cocomparisonsP≤0.05 was considered as statistically significant.
3. Results
3.1. Aerosol Assessments
The description statistic of all tests is presented in Table 2 and printing times varied for different filaments. The highest peak particle number concentration measured for different filaments was as follows: TPU at 540033.3#/cm3,PLA at 864841.5 #/cm3, PETG at 1884866.7 #/cm3, and ABS at 2572400 #/cm3.
The particle number concentration data from each run of each plastic type were analyzed. Concentration data measured by the SMPS were averaged for each plastic type, and a standard deviation at each point was calculated. Size distribution data were extracted for each run, and a representative set was published in the figures below.
Figure 3 depict the particle size distribution for the ABS, PETG, and TPU filament printing during the preheating and printing tasks compared with blank. The graph shows that during the preheating task, the number of particles with a diameter less than 46.7 nm was higher than that in the printing phase.
Particles larger than 46.7nm in diameter for ABS and TPU during the printing process were significantly higher than those during preheating task, and the gap increased with the diameter of particles. At the point of 46.7nm, PETG was slightly larger than that of ABS and TPU and appeared in diameters larger than 64.9nm. During the preheating process, all particles with a diameter of less than 48.7 nm released by filaments were significantly higher than the background concentration, and the number concentration of particles with a diameter of 48.7 nm–64.9 nm was almost the same as the background concentration. The number concentration of particles produced during filament preheating is lower than the background concentration, and the critical point of the difference increased with the increase in particle diameter, beginning with particles of a diameter of 64.9 nm.
The particle number concentration of the four filaments in the printing process shows different distributions. The number concentrations of ABS, TPU, and PETG were concentrated in the range of 36.5nm-115.5nm in diameter. The number of particles in this range was higher than the background concentration. It was primarily distributed in the scanning with the diameter range of 48.7–64.9 nm and 64.9–86.6 nm. Nonetheless, the number and concentration of PLA were concentrated in the range of 20.5nm-48.7nm diameter and 27.4nm- 36.5nm diameter.
Our methods can monitor the development of the total particle number concentration measured by SMPS over time, i.e., starting from the measurement of the background values to measurements during the heating and printing, up to the cooling of the printer (Figure 4). The operation trend for the three filaments was the same and could be divided into three tasks: preheating, printing, and cooling. At the preheating task, the number concentration of particles dramatically increased and reached its peak. The particle number dropped in the printing task and decreased at the blank level in the cooling task. Instruments indicated that UFP was emitted during each test.
The number size distribution of combustion-generated aerosols for the blank and four filaments is shown in Table 3. Experimental data shows average total number concentration of particles generated from ABS was 155056.46 particle/cm3. The geometric mean (GM) for the distribution was calculated to be 66.01 nm, and the geometric standard deviation (GSD) of 75.99 indicated polydisperse size distribution. Similarly, TPU, PETG, and blank characterizations are shown in Table 2 summarily. Results indicate that, compared with the blank, ABS is the only filament that has a higher GM than blank.
3.2. Cytotoxicity Assessments
A549 cells were exposed at the ALI to UFPs generated by a working 3D printer for 45 min and 90 min, and the percent cytotoxicity LDH assay result is reported in Figure 5. Percent cytotoxicity was calculated from the fraction of LDH release in the basal chamber. From the test result, we found shorter time exposure has higher cytotoxicity than longer’s.
The ANOVA analysis results in Table 4 indicated that the ABS and PETG we used during the experiment presented a significant difference from the HEPA control in 45 min of exposure. ABS shows the highest cytotoxicity compared to any other group, with a statistically significant difference compared to the HEPA filter group. ABS is the only filament with a significant difference compared with the HEPA control in 90 min of exposure (p-value <0.05).
4. Discussion
The results show that the particle emissions for the three filaments are significantly different; This needs to be clarified in previous publications because only one or two filaments (e.g., PLA and ABS) are usually analyzed. We observed a higher emission for ABS compared to other filaments. Some authors describe the larger particles of ABS and the larger particles of PLA. In further studies, no size differences were observed. Byrley et al. reviewed 13 publications and described that the average particle size of PLA was between 14.0 nm and 108.1 nm and that of ABS was between 10.5 nm and 88.5 nm [12]. The difference in particle size may be due to the measurement at different time points. Some measured at the highest concentration, and some reported the size of the entire printing process. So far, the only Research Report on 3-D printers shows that the maximum particle size of PLA can reach 60.4 nm and that of ABS can reach 173.8 nm, which is similar to the research results of this paper[13,14].
ABS has a higher GM than blank from the experiment result. This may be because ABS previously melted at higher temperatures, and ABS fragments remain in the print head and do not melt so that they can block the nozzle. However, in previous experiments, a uniform temperature was used in all material experiments not to make the temperature a variable, which may be the reason for giant GM. It may also be because ABS is an oil-based plastic. Despite its robustness, its oil-based plastic composition can lead to more considerable geometric means and less environmentally friendly emissions.
Responses from all real-time instruments indicated that UFP was emitted during each test. A typical result of all filaments after printing begins was a sharp increase in the emissions of the 3-D printer, which coincided with that observed in former studies [10]. Products with additives are a mixture of thermoplastic and metal or other small particles. The particles might not be evenly distributed and could thereby cause a higher standard deviation. The geometric standard deviations ranged between 1.70 and 1.95, indicating a single modal distribution in the fine and ultrafine particle range, as observed in previous studies of 3-D printers [10,11,12,13,14].
The results in this paper show that we can successfully expose A549 cells in ALI to the complete UFPs produced by the working 3D printer and show the cytotoxic reaction caused by the UFPs produced by different filament exposure. The 45-min exposure has more significant potential toxicity than long-term exposure. This may be because the 3D printer works faster during the 45-min exposure. ABS showed the most remarkable cytotoxicity, followed by PETG, and TPU showed less cytotoxicity than other filaments. ABS has the most significant cytotoxicity, which may be related to the material polymerization characteristics of ABS. Because ABS is a common thermoplastic polymer, the ratio of polymer to monomer is one of the variables affecting cytotoxicity [15]. PETG and TPU, as 3D printing materials that have become popular in recent years, have improved their manufacturing process and formula compared with traditional materials ABS. Previous studies have shown that cytotoxicity is related to average geometric mean and mean diameters [16,17]. In our experiment, the particles produced by ABS have higher average geometric mean and mean diameters, which may cause more significant cytotoxicity.
This study is the first to evaluate the cytotoxicity of particles emitted from different filaments in a commercial desktop 3D printer filament extruder. The results showed that under the conditions used in this study, many particles and ultrafine inhalable particles were released by using these filament extruders.
Author Contributions
Runcheng Fang,Afzaal nadeem Mohamm, Jagjit S. Yadav and Jun Wang; methodology, Runcheng Fang ; software, Runcheng Fang.; formal analysis, Jun Wang.; investigation, Runcheng Fang. All authors have read and agreed to the published version of the manuscript.”
Funding
research received no external funding.
Acknowledgments
I am immensely grateful to the University of Cincinnati’s Industrial Hygiene program for its valuable education and growth opportunities. My advisor, Dr. Jun Wang, persistent guidance and my parents’ unwavering support have been instrumental in my academic journey.
Conflicts of Interest
The authors declare no conflict of interest.
References
- Zhang, Q.; Wong, J.P.S.; Davis, A.Y.; Black, M.S.; Weber, R.J. Characterization of particle emissions from consumer fused deposition modeling 3D printers. Aerosol science and technology 2017, 51(11), 1275–1286. [Google Scholar] [CrossRef]
- Zhang, Q.; Pardo, M.; Rudich, Y.; Kaplan-Ashiri, I.; Wong, J.P.S.; Davis, A.Y.; Black, M.S.; Weber, R.J. Chemical Composition and Toxicity of Particles Emitted from a Consumer-Level 3D Printer Using Various Materials. Environmental science & technology 2019, 53 (20), 12054–12061. [CrossRef]
- Fischer, E.; Dietrich-Gümperlein, G.; Karrasch, S.; Nowak, D.; Jörres, R.A.; Schierl, R. Acute health effects of desktop 3D printing (fused deposition modeling) using acrylonitrile butadiene styrene and polylactic acid materials: An experimental exposure study in human volunteers. Indoor air 2018, 28(4), 611–623. [Google Scholar] [CrossRef]
- Min, K.; Li, Y.; Wang, D.; Chen, B.; Ma, M.; Hu, L.; Liu, Q.; Jiang, G. 3D Printing-Induced Fine Particle and Volatile Organic Compound Emission: An Emerging Health Risk. Environmental science & technology letters 2021, 8 (8), 616–625. [CrossRef]
- Waugh, S.; Mandler, K.; Jackson, M.; Matheson, J.; Thomas, T.; Qian, Y. Inhalation of particulate and emissions from 3 dimensional (3D) printers: Effects on the olfactory bulb (OB) and hypothalamic-pituitary-endocrine axes. The FASEB journal 2021, 35 (S1), n/a-n/a. https://doi.org/10.1096/fasebj.2021.35.S1.00277.10.1111/ina.12458.
- Frank, E.A.; Carreira, V.S.; Birch, M.E.; Yadav, J.S. Carbon Nanotube and Asbestos Exposures Induce Overlapping but Distinct Profiles of Lung Pathology in Non-Swiss Albino CF-1 Mice. Toxicologic pathology 2016, 44(2), 211–225. [Google Scholar] [CrossRef] [PubMed]
- House, R.; Rajaram, N.; Tarlo, S.M. Case report of asthma associated with 3D printing. Occupational medicine (Oxford) 2017, 67(8), 652–654. [Google Scholar] [CrossRef] [PubMed]
- Krajnak, K., Farcas, M., McKinney, W., Waugh, S., Mandler, K., Jackson, M., Matheson,J., Thomas, T., & Qian, Y. (2021). Inhalation of particulate and emissions from 3dimensional (3-D) printers: Effects on the olfactory bulb (OB) and hypothalamicpituitaryüendocrine axes. The FASEB journal, 35(S1), n/a-n/a. [CrossRef]
- Oberdorster, G., Oberdorster, E., & Oberdorster, J. (2005). Nanotoxicology: AnEmerging Discipline Evolving from Studies of Ultrafine Particles. Environmental health perspectives, 113(7), 823–839. [CrossRef]
- Azimi, P.; Zhao, D.; Pouzet, C.; Crain, N.E.; Stephens, B. Emissions of Ultrafine Particles and Volatile Organic Compounds from Commercially Available Desktop Three-Dimensional Printers with Multiple Filaments. Environmental science & technology 2016, 50 (3), 1260–1268. [CrossRef]
- Petroff M, Appel J, Rostem K, Bennett CL, Eimer J, Marriage T, Ramirez J, Wollack EJ. A 3D-printed broadband millimeter wave absorber. Rev Sci Instrum. 2019 Feb;90(2):024701. [CrossRef]
- Byrley, P., Geer Wallace, M.A., Boyes, W.K., & Rogers, K. (2020). Particle andvolatile organic compound emissions from a 3-D printer filament extruder. The Scienceof the Total Environment, 736, 139604–139604. [CrossRef]
- Stephens, B., Azimi, P., El Orch, Z., & Ramos, T. (2013). Ultrafine particle emissions from desktop 3-D printers. Atmospheric Environment (1994), 79, 334–339. [CrossRef]
- Poikkimaki, M., Koljonen, V., Leskinen, N., Narhi, M., Kangasniemi, O., Kausiala, O., &Dal Maso, M. (2019). Nanocluster aerosol emissions of a 3-D printer. Environmental Science & Technology, 53(23), 13618–13628. [CrossRef]
- Jorge, J.H., Giampaolo, E.T., Machado, A.L., & Vergani, C.E. (2003). Cytotoxicity of denture base acrylic resins: A literature review. The Journal of prosthetic dentistry, 90(2), 190–193. [CrossRef]
- Jia, Wang, H., Yan, L., Wang, X., Pei, R., Yan, T., Zhao, Y., & Guo, X. (2005). Cytotoxicity of Carbon Nanomaterials: Single-Wall Nanotube, Multi-Wall Nanotube, and Fullerene. Environmental Science & Technology, 39(5), 1378–1383. [CrossRef]
- Hidalgo, Einecke, G., Allanach, K., Mengel, M., Sis, B., Mueller, T.F., & Halloran, P.F. (2008). The Transcriptome of Human Cytotoxic T Cells: Measuring the Burden of CTL-Associated Transcripts in Human Kidney Transplants. American Journal of Transplantation, 8(3), 637–646. [CrossRef]
Figure 1.
Overview of the exposure system setting.
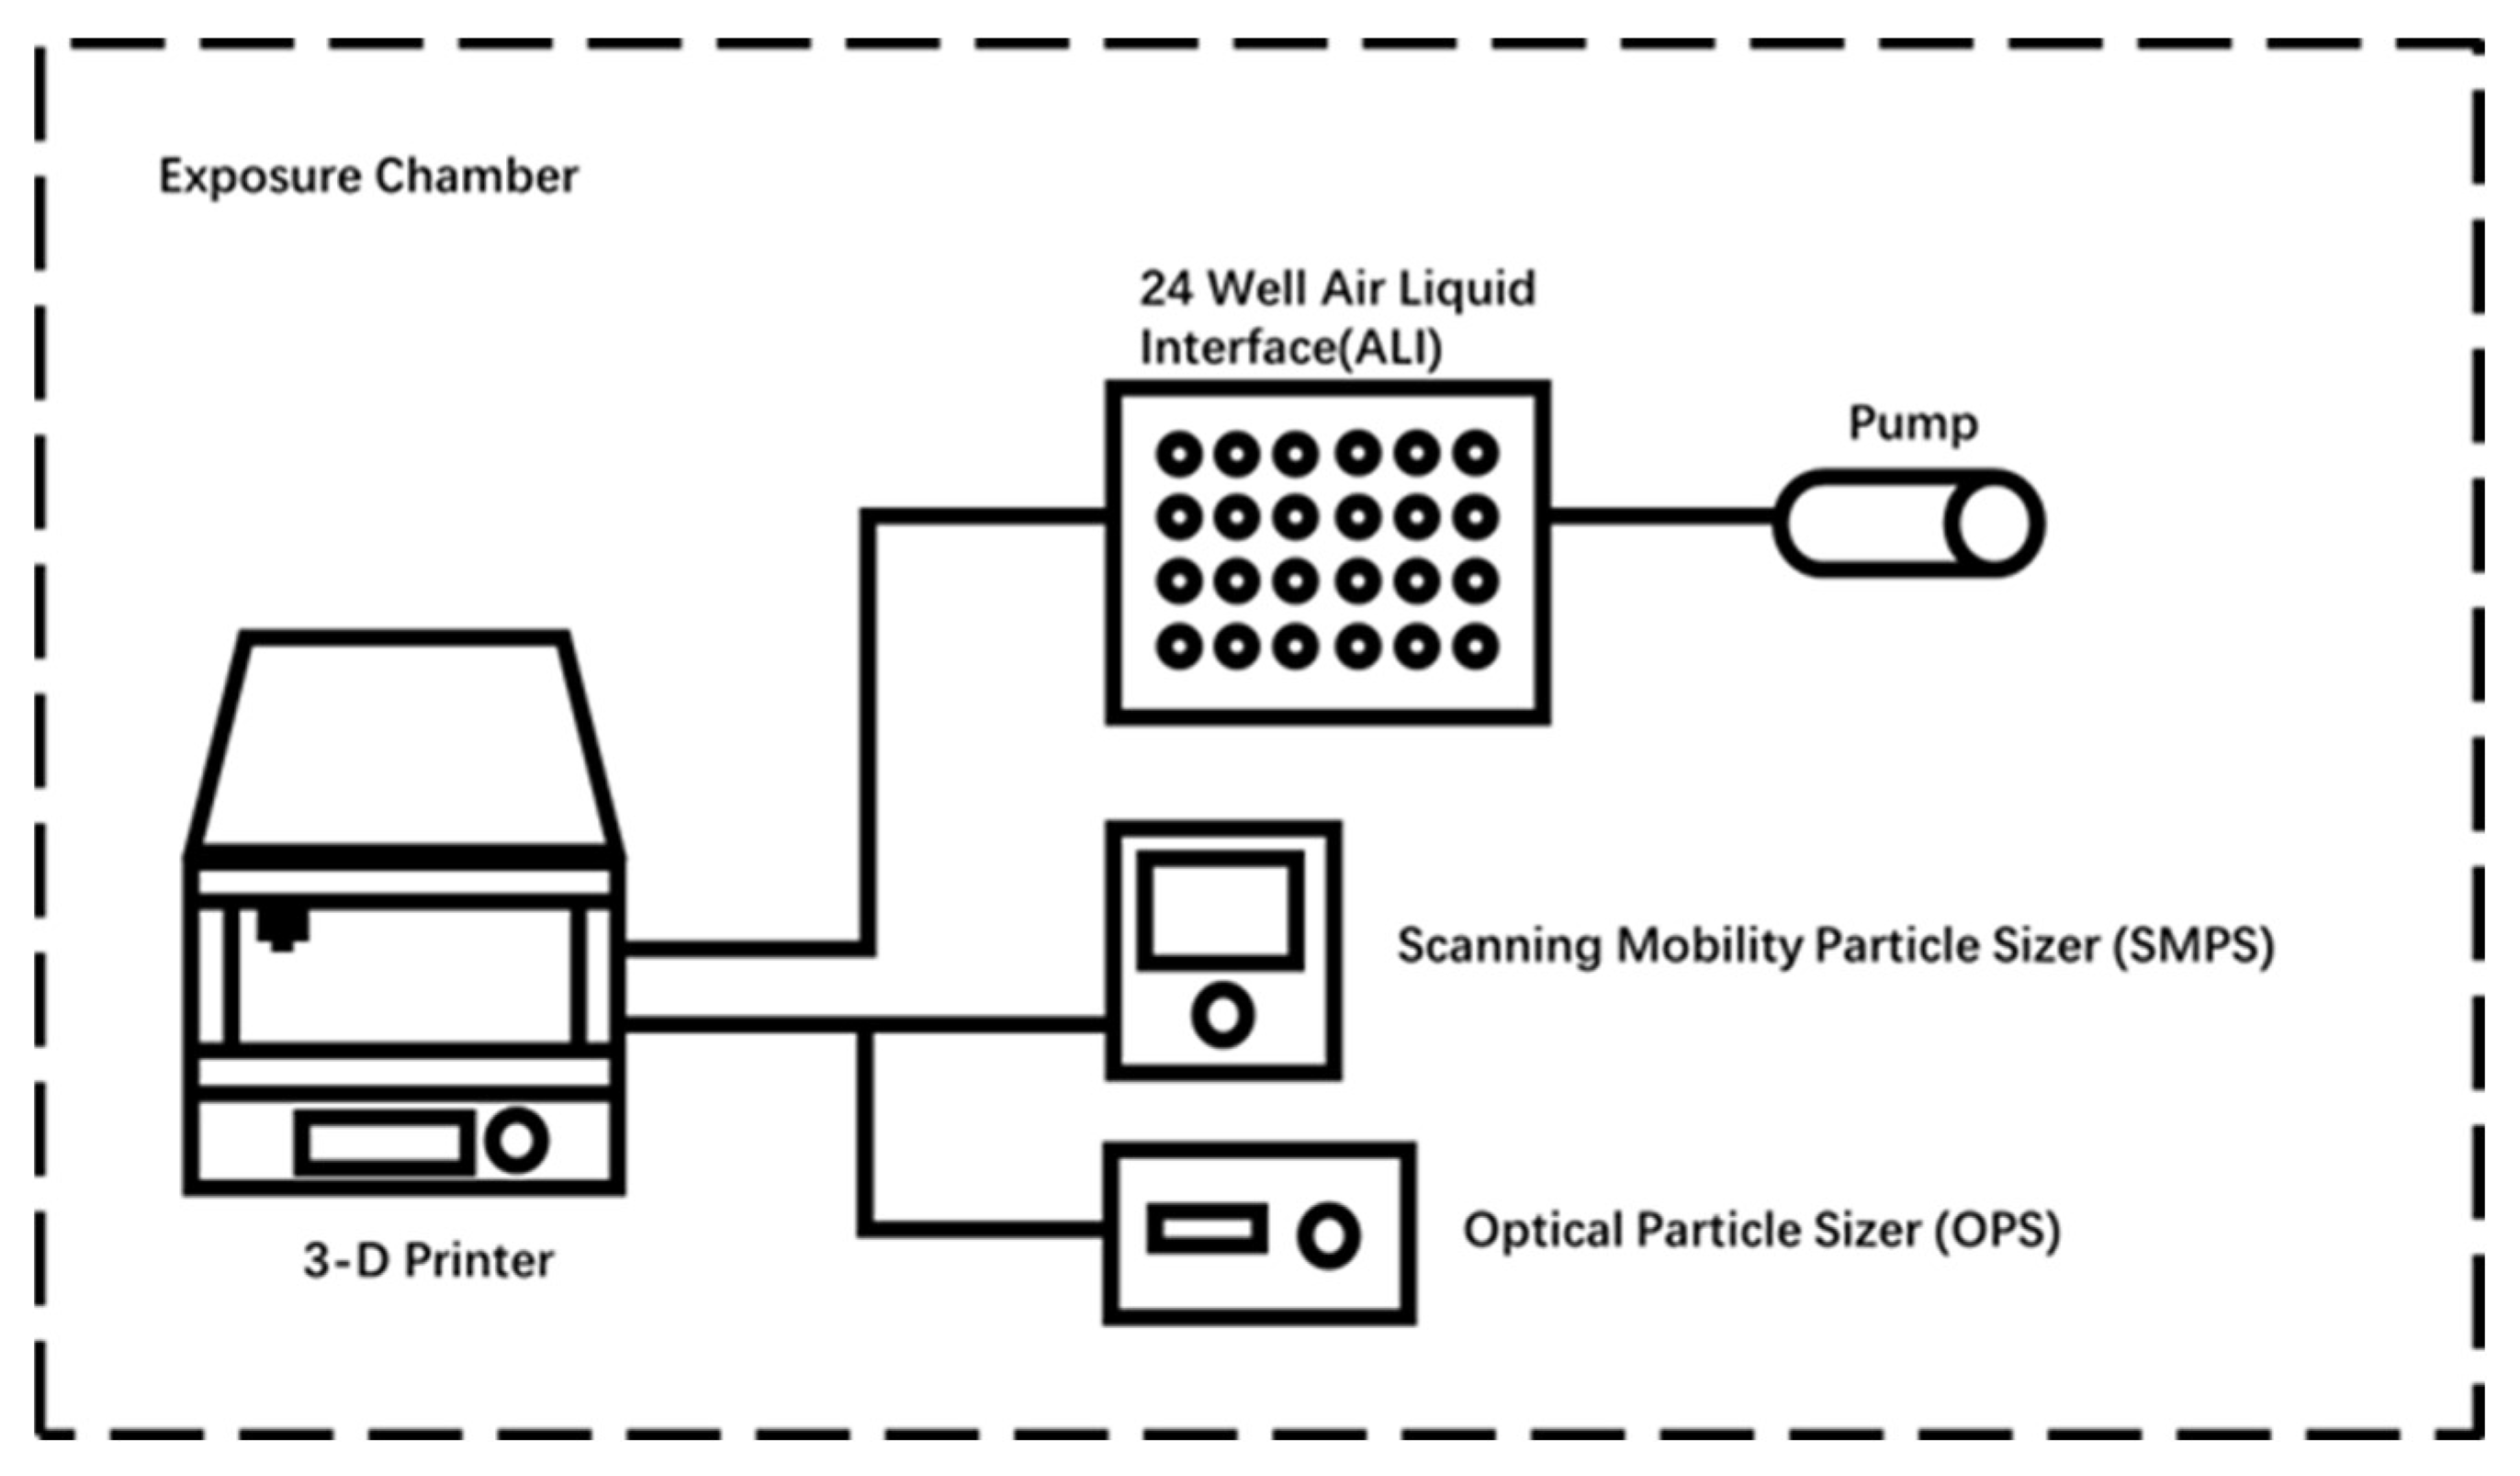
Figure 2.
Printed traffic cone.
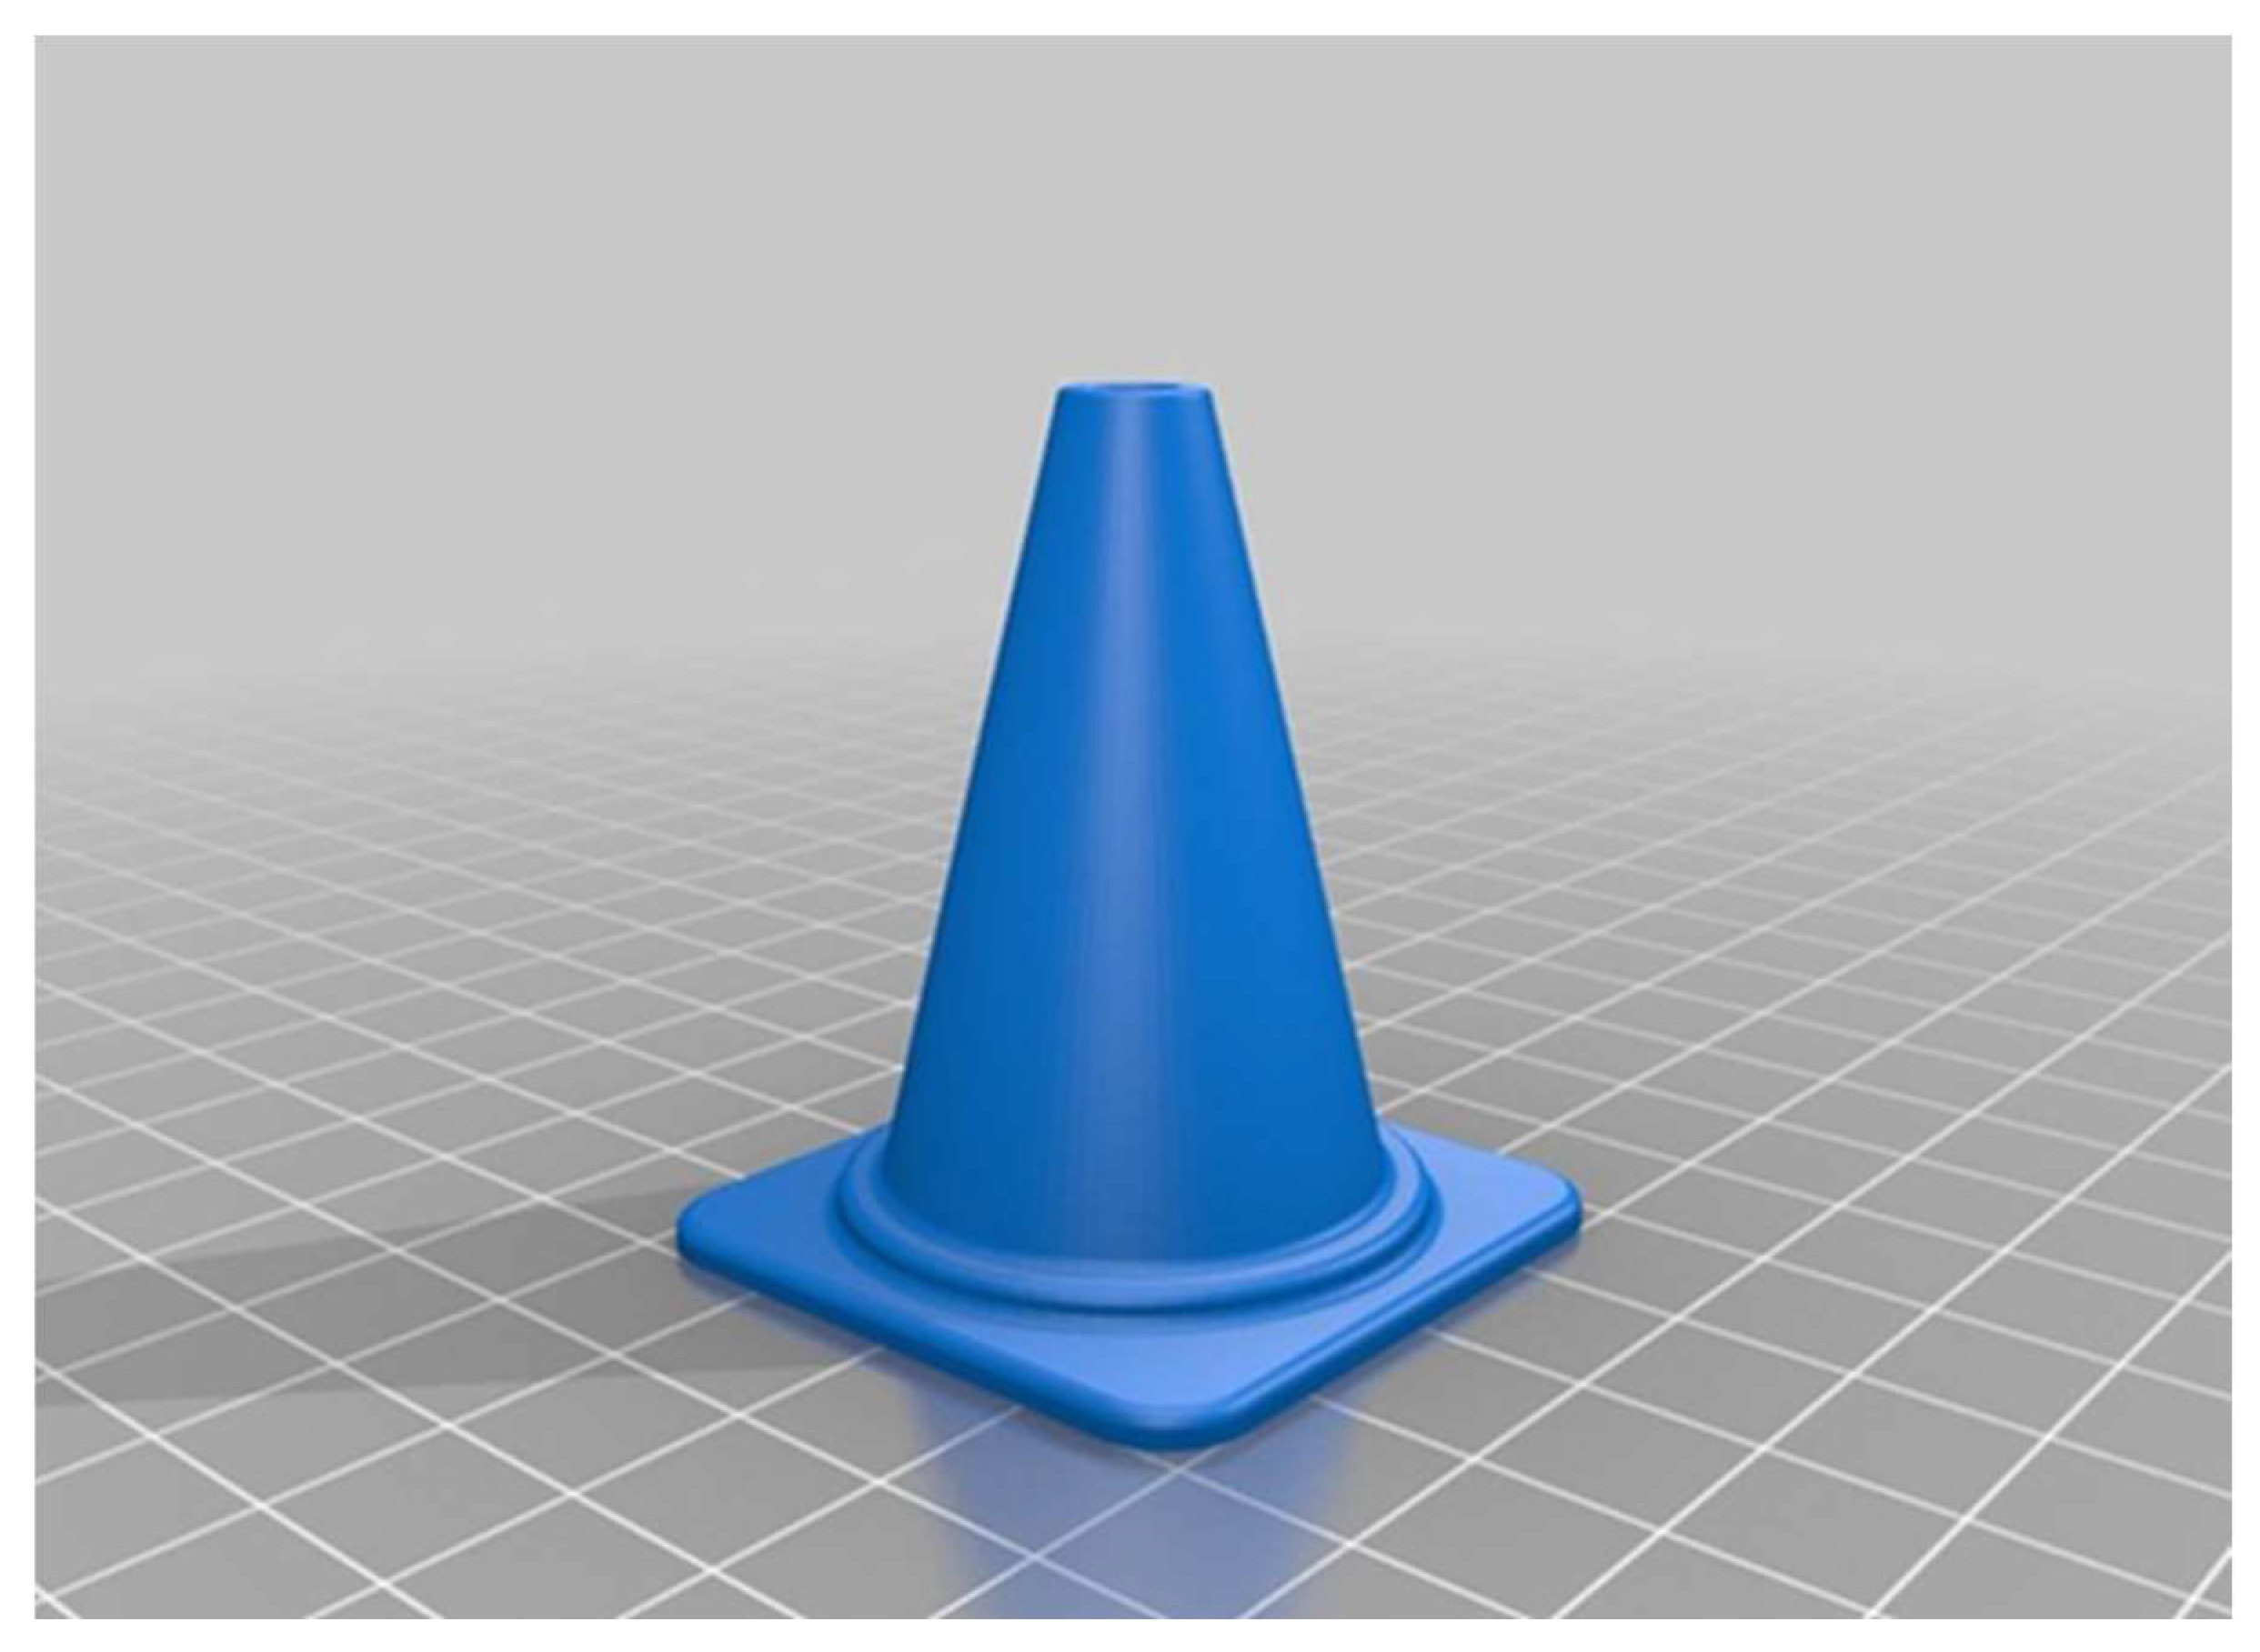
Figure 3.
Particle size distribution in different print phases: Above: number concentration size distribution during printing; Below: number concentration size distribution during preheating.
Figure 3.
Particle size distribution in different print phases: Above: number concentration size distribution during printing; Below: number concentration size distribution during preheating.
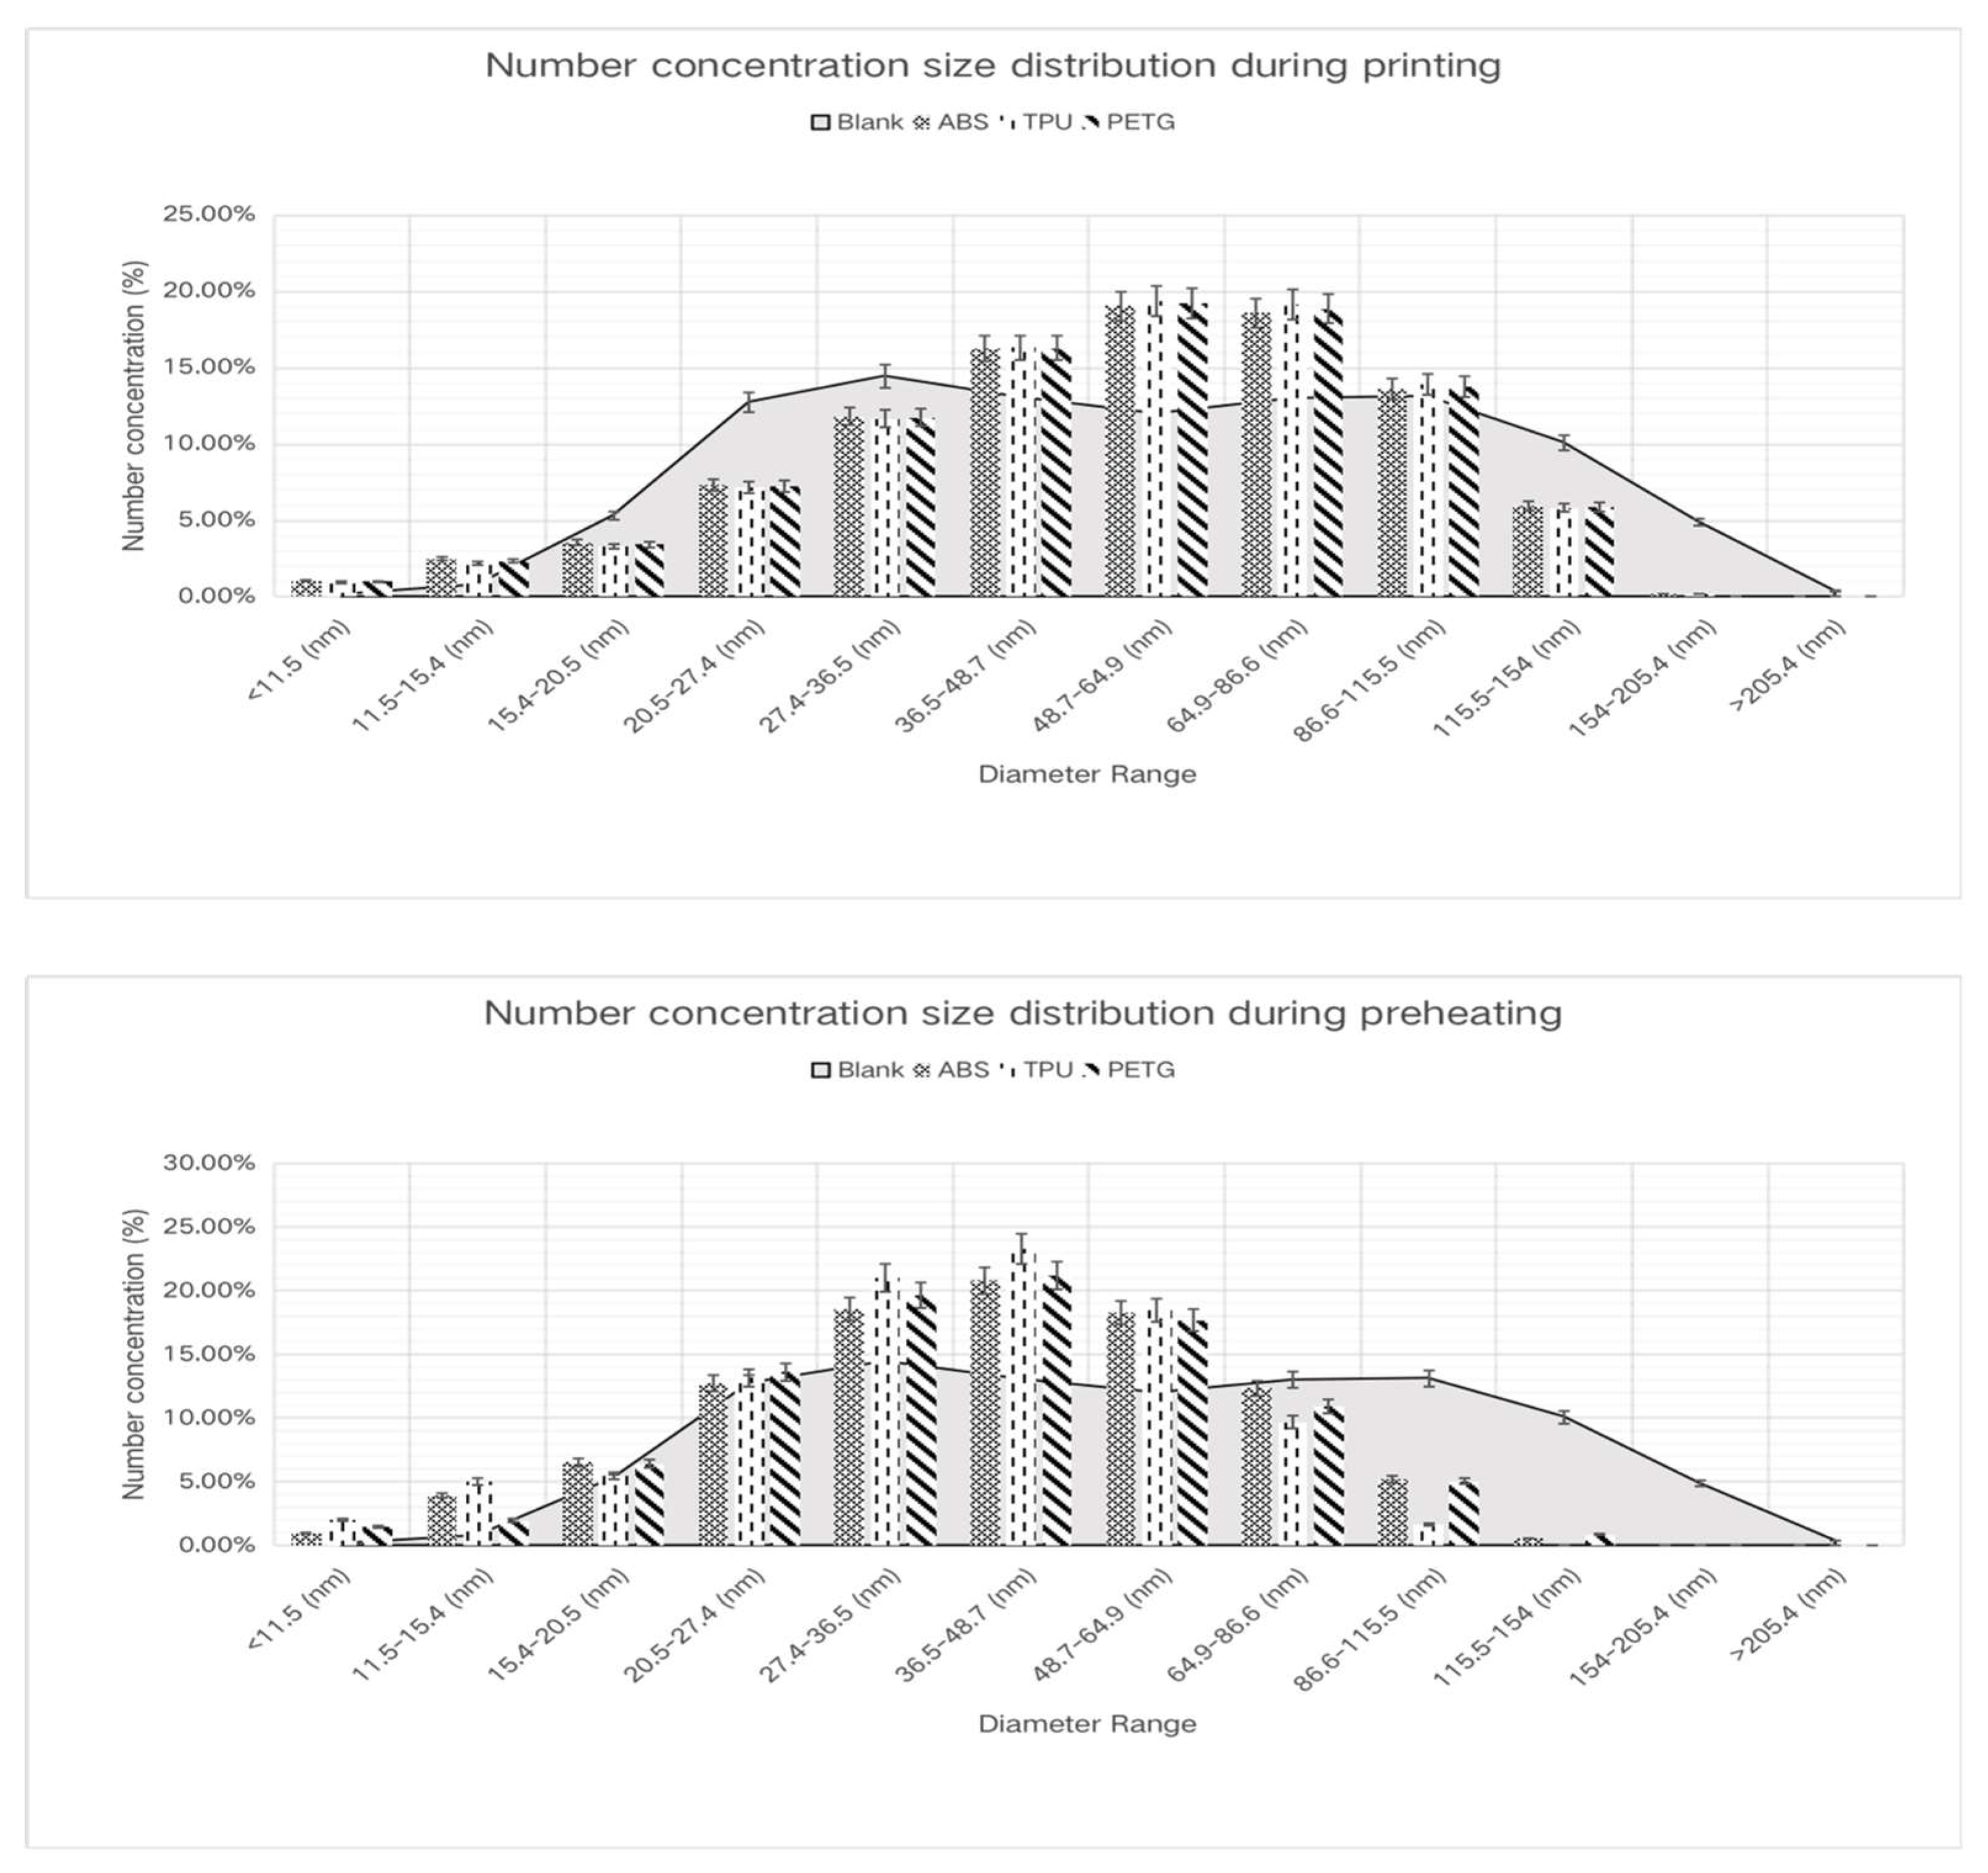
Figure 4.
Total particle number concentration of three filaments measured by SMPS over time.
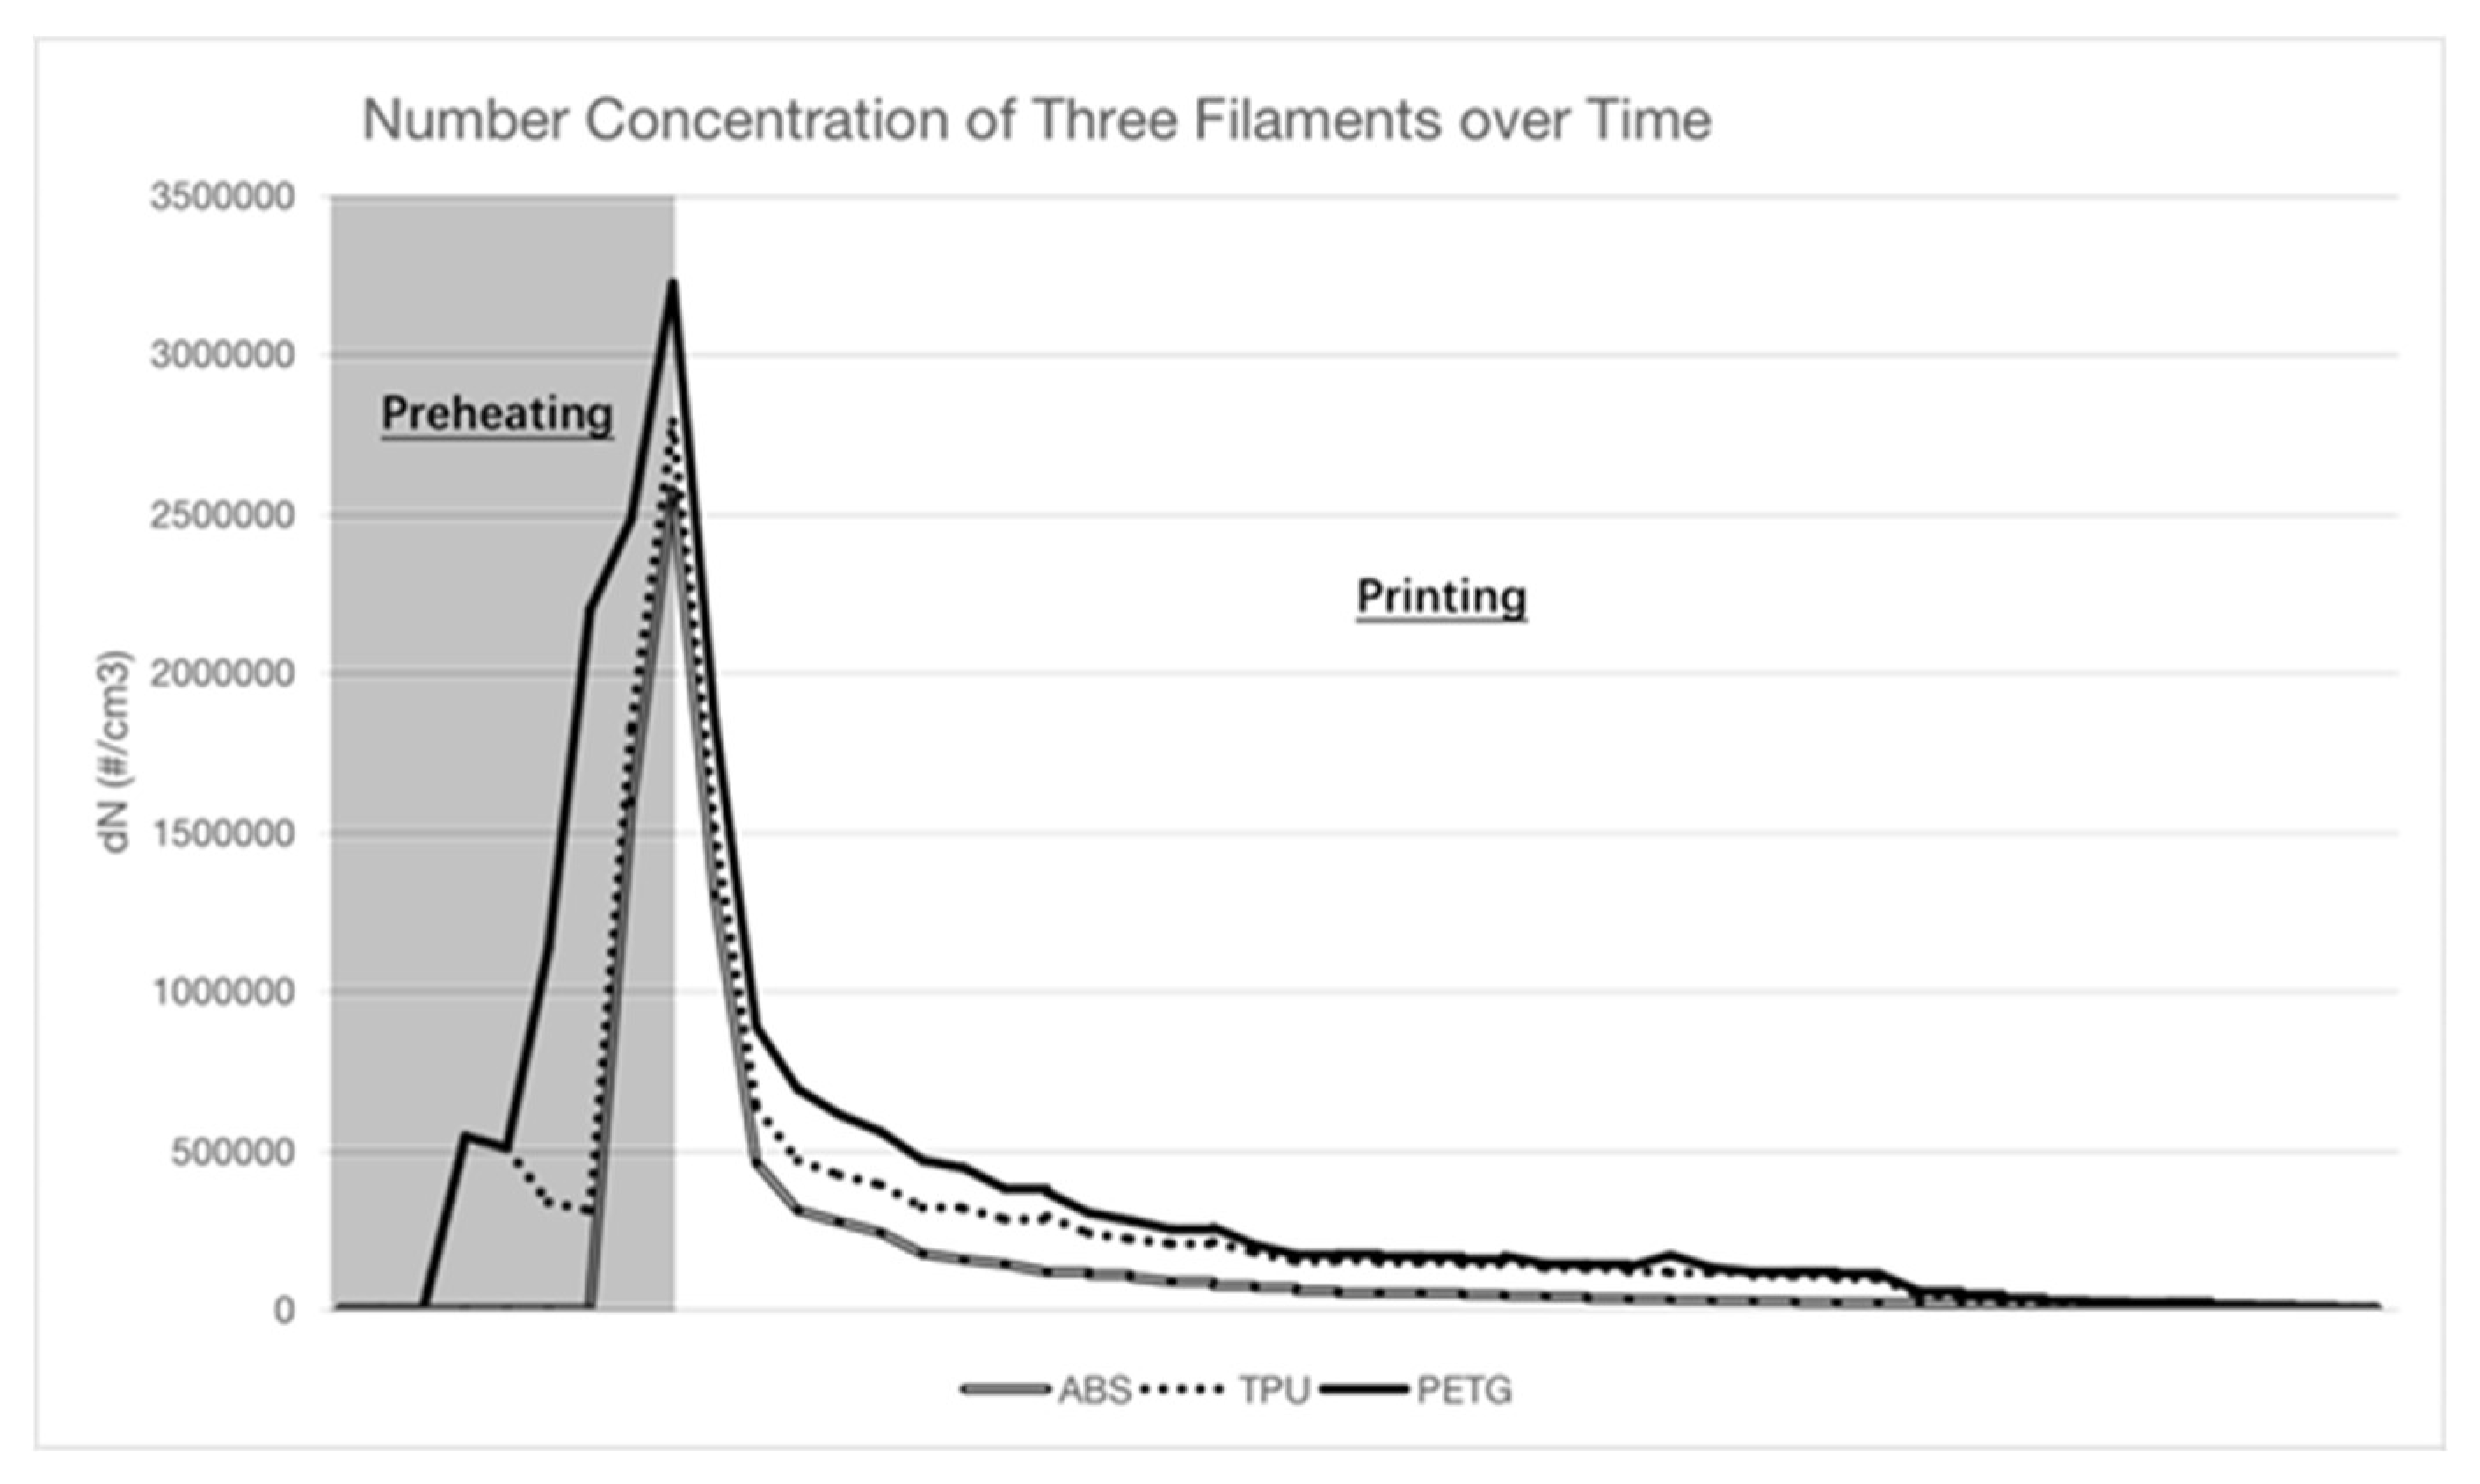
Figure 5.
Percent cytotoxicity in A549 cells grown on Air-Liquid Interface (ALI) exposed to particles emitted from working 3D printer.
Figure 5.
Percent cytotoxicity in A549 cells grown on Air-Liquid Interface (ALI) exposed to particles emitted from working 3D printer.
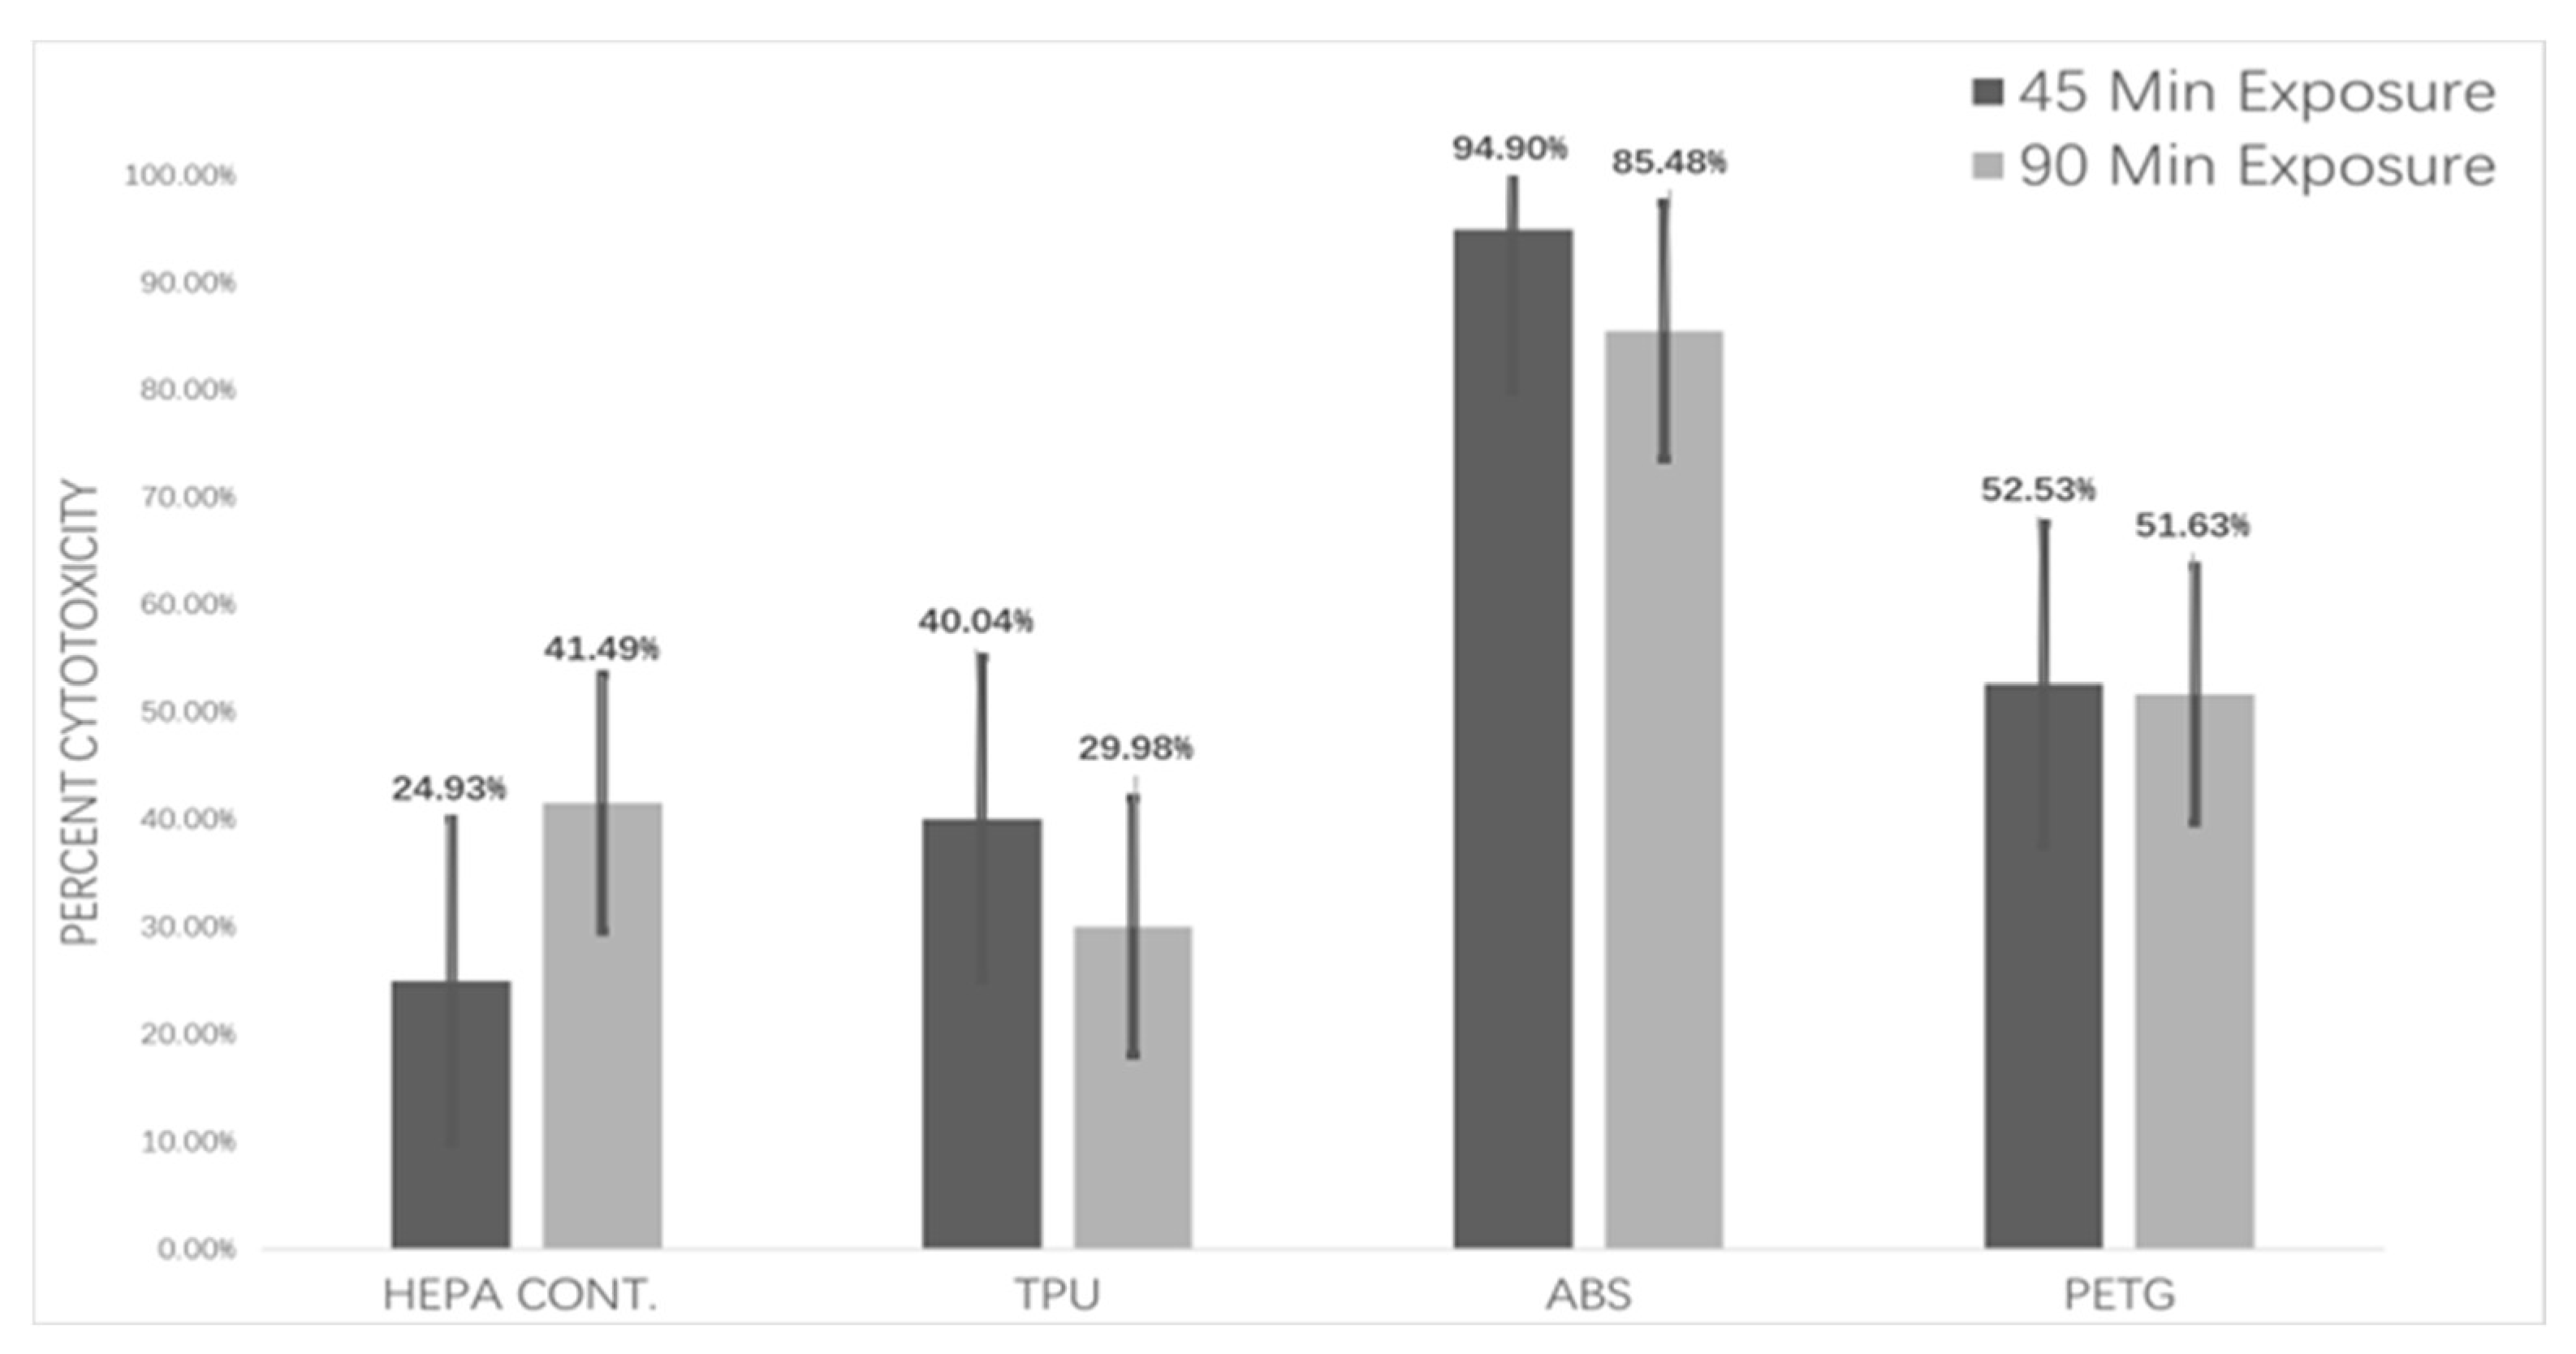

Table 1.
Experimental conditions of different filaments.
| Filaments | Extruder Temperature(°C) | Bed Temperature(°C) |
|---|---|---|
| Blank | 24 | 24 |
| ABS | 220 | 85 |
| TPU | 220 | 50 |
| PETG | 220 | 24 |
Table 2.
Descriptive Statistics of particle number concentration in different filaments.
| Filaments | Median | Mean | Min, Max | Std. Deviation | P-value |
|---|---|---|---|---|---|
| Blank | 1002.2 | 1002.2 | 1002.2,1002.2 | 0 | N/A |
| ABS | 25898.3 | 155056.5 | 1754.5, 2.572e+6 | 433084.5 | < .001 |
| TPU | 15879.2 | 117212.3 | 956.1, 540033.3 | 116981.3 | < .001 |
| PETG | 95525.8 | 124563.0 | 950.7, 1.885e+6 | 306704.8 | < .001 |
Table 3.
Average geometric mean (GM), Geometric Standard Deviation (GSD) and mean diameters (Mean) (nm) of emitted particles.
Table 3.
Average geometric mean (GM), Geometric Standard Deviation (GSD) and mean diameters (Mean) (nm) of emitted particles.
| Filaments | GM | GSD | Mean |
|---|---|---|---|
| Blank | 62.90 | 1.94 | 77.6 |
| ABS | 66.01 | 1.75 | 75.99 |
| TPU | 15879.2 | 117212.3 | 956.1, 540033.3 |
| PETG | 95525.8 | 124563.0 | 950.7, 1.885e+6 |
Table 4.
ANOVA result: Single Factor of HEPA control.
| Filaments | F | P-value | df | |
|---|---|---|---|---|
| ABS | 289.90 | 2.62E-06* | 7 | |
| 45 min | TPU | 2.60 | 0.18 | 5 |
| PETG | 7.37 | 0.042* | 6 | |
| Filaments | F | P-value | df | |
| ABS | 30.70 | 0.005* | 5 | |
| 90 min | TPU | 2.10 | 0.22 | 5 |
| PETG | 0.32 | 0.60 | 5 |
Disclaimer/Publisher’s Note: The statements, opinions and data contained in all publications are solely those of the individual author(s) and contributor(s) and not of MDPI and/or the editor(s). MDPI and/or the editor(s) disclaim responsibility for any injury to people or property resulting from any ideas, methods, instructions or products referred to in the content. |
© 2023 by the authors. Licensee MDPI, Basel, Switzerland. This article is an open access article distributed under the terms and conditions of the Creative Commons Attribution (CC BY) license (http://creativecommons.org/licenses/by/4.0/).
Copyright: This open access article is published under a Creative Commons CC BY 4.0 license, which permit the free download, distribution, and reuse, provided that the author and preprint are cited in any reuse.


