Preprint
Article

NOTCH, SUMOylation and ESR-Mediated Signalling Are the Main Molecular Pathways Showing Significantly Different Epimutation Score Between Expressing or not Estrogen Receptor Breast Cancer in Three Public EWAS Datasets

Altmetrics

Downloads

118

Views

41

Comments

0

A peer-reviewed article of this preprint also exists.

This version is not peer-reviewed

Submitted:

15 June 2023

Posted:

19 June 2023

You are already at the latest version

Alerts
Abstract
Oestrogen receptor expression in breast cancer (BC) cells is a marker of high cellular differentiation and allows the identification of two BC groups (ER-positive and ER-negative) that, although not completely homogeneous, differ in biological characteristics, clinical behaviour and therapeutic options. The study, based on three publicly available EWAS datasets, focuses on the comparison between these two groups of breast cancer using an epimutation score. The score is calculated not only based on the presence of the epimutation but also on the deviation amplitude of the methylation outlier value. For each dataset, we performed a functional analysis based first on the functional gene region of each annotated gene (we aggregated the data per gene region TSS1500, TSS200, first-exon, body-gene identified by the information from the Illumina Data Sheet) and then we performed a pathway enrichment analysis through the REACTOME database based on the genes with the highest epimutation score. Thus, we blended our results and found common pathways for all three data sets. We found that a higher and significant epimutation score due to hypermethylation in ER-positive BC is present in the promoter region of the genes belonging to the SUMOylation pathway, the NOTCH pathway, the IFN-$\gamma$ signalling pathway and the deubiquitination protease pathway; while a higher and significant level of epimutation due to hypomethylation in ER-positive BC is present in the promoter region of the genes belonging to the ESR-mediated pathway. The presence of this state of promoter hypomethylation in the ESR-mediated signalling genes is consistent and coherent with an active signalling pathway mediated by oestrogen function in the group of ER-positive BC. SUMOylation and NOTCH pathways are associated with BC pathogenesis and have been found to play distinct roles in the two BC subgroups. We speculated that the altered methylation profile may play a role in regulating signalling pathways with specific functions in the two subgroups of ER-BC.
Keywords: 
Subject: Biology and Life Sciences  -   Biology and Biotechnology

1. Introduction

Breast cancer (BC) is the most common tumour in women around the world [77]. Several classification methods have been used to capture the wide heterogeneity of BC: immunohistochemical techniques, molecular features, histological phenotypes and gene expressions. Immunohistochemically (IHC), BC can be classified based on the expression of the oestrogen receptor (ER), the progesterone receptor (PR) and the receptor tyrosine-protein kinase erbB-2 (HER2) [1]. The immunohistochemical guidelines recommend that BC is considered ER-positive if at least one per cent of the nuclei of BC cells are stained, and otherwise ER-negative [2]. ER expression is considered a marker of high cellular differentiation, plays an important role in prognosis and is a predictive marker of response to endocrine therapy. Although the two BC groups identified in this way (ER positive/ ER negative) are not completely homogeneous, they differ in their biological characteristics, clinical behaviour and therapeutic options [3].
Although BC is known to arise from an accumulation of genetic and epigenetic alterations, the molecular pathogenesis of this tumour is still not fully understood. DNA methylation is one of the best characterised epigenetic alterations involved in carcinogenesis [4]. There are a growing number of reports demonstrating the importance of epigenetic processes in BC pathogenesis and treatment resistance. Several studies have investigated the DNA methylation pattern in BC using genome-wide arrays and DNA alteration profiling. DNA methylation changes are considered early events in breast cancer progression and are widely accepted as early molecular markers for diagnosis, prognosis and prediction of invasive recurrence [5,6,7,8].
In the literature different kind of cancer epigenetic analysis can be found. In most reports, the mean methylation level (differential methylation), calculated for each CpG site in human BC, is compared with that in adjacent non-cancerous breast tissue or in normal breast tissue from cancer-free women [9,10]. Other reports have investigated the presence of epigenetic mutations - also defined as “epimutations” or stochastic epigenetic mutations (SEMs) - in breast tissue or in white blood cells from patients with breast cancer [11,12]. However, different definitions of epimutation have been reported in the literature based on the variability or interquartile range of distributions of methylation beta values [13,14], and their biological significance is not yet clear. In any case, both types of epigenetic studies (based on differential methylation or epimutations) usually involve a gene-centred analysis, capturing genes that have altered mean differential methylation or different epimutation burden. However, detecting the recurrence of rare alterations often requires a large number of samples and presents an even greater challenge in distinguishing between functionally relevant or "driving" alterations and non-oncogenic ‘‘passenger" events that may have no functional impact, particularly in tumour types with a high background of genetic or epigenetic alterations [15]. Pathway-focused analysis, as opposed to gene-focused one, allows the identification of recurrent altered signals or functions in cancer, based on changes found in different genes belonging to the same pathway but not altered at the same frequency [15].
This study evaluates the presence of epimutations in the two main groups of BCs (ER-positive/ER-negative) identified by the presence of oestrogen receptors as used in clinical practise and defined by current IHC guidelines. We retrieved data from three publicly available datasets and examined the presence of epimutations for each dataset, weighted by their difference from the interquartile range of the distribution of methylation levels in the samples of the entire dataset. We then calculated an epimutation score aggregating the data per gene region (TSS1500, TSS200, first exon, gene body) for each gene in each BC sample. Then, we performed a pathway enrichment analysis through the REACTOME database, based on the genes with a significantly higher epimutation score. Finally, we intersected the pathways found in the three datasets. These molecular pathways were characterised by a significantly higher epimutation score in the promoter regions in ER-positive BC samples due to hypomethylation or hypermethylation. The SUMOylation, the Notch, the interferon- γ and the deubiquitination proteases pathways, are those identified by a significant higher epimutation score due to hypermethylation. The ESR-mediated-signalling pathway, on the other hand, is the pathway with a higher epimutation score due to hypomethylation. Interestingly, for all these pathways, there are many studies demonstrating their role in the development of BC, especially for the SUMOylation and Notch pathways, which are directly or indirectly (by affecting many other pathways) involved in the development, progression, relapse and treatment resistance of BC. Therefore, we speculate that our findings may highlight the importance of the epimutation process in the pathogenesis of different types of breast cancer and that a deeper knowledge of these pathways could likely lead to new therapeutic options to differentially and specifically treat different BC entities. In addition, it cannot be excluded that different mechanisms of molecular alterations (for example, epigenetic versus gene mutation) could involve different genes and signalling pathways. In fact, we obeserved that the Notch and the SUMOylation pathways are overloaded with epimutations and do not have a high number of genetic mutations, as confirmed by other gene expression studies [17,18]. Finally, since epimutations affected a few specific signalling pathways, it cannot be excluded that an apparently stochastic process such as the epigenetic one could be at least partially under deterministic control, as already suggested by other authors [30].

2. Materials and Methods

2.1. Selection, downloading and preprocessing of the data sets

For our study, we selected publicly available datasets with methylation profiles of breast cancer tissue in patients of Caucasian ethnicity. The presence of immunohistochemical assessment of oestrogen receptor status on breast cancer cells was a preferred indicator for dataset selection. Other clinical characteristics included patient age and tumour stage, which are generally considered associated to cancer cell methylation status [13,16]. We identified three datasets: the TCGA-BRCA and the TGCA 27k from the TCGA data portal [80], with raw idat files, and the GSE69914 dataset [81], from the GEO data portal, with a matrix of beta values already subjected to preliminary quality control.
TCGA-BRCA and GSE69914 datasets were created using Illumina Methylation technology with 450k probes, while the dataset TCGA-BRCA -27k was created using Illumina methylation technology with 27k probes. All three datasets contain information on immunohistochemically identified oestrogen receptor status according to the latest clinical guidelines, while age and staging are only available for the two TCGA datasets.
The characteristics of the three data sets are summarized in Table 1.
Datasets were downloaded using the R GenomicDataCommons [52] package for the TCGA platform and the R GEOquery [53] package for the GEO Accession Omnibus [54] platform. All data processing was performed using the R 4.2.2 ecosystem on a server with 32 cores, 128 Gb RAM and 4 Tb hard disk. Data from the TCGA-BRCA and TCGA-BRCA -27K datasets were imported using the ChAMP package [50], removing probes with missed values or a detection P-value greater than 1% or with a beads count of less than three in 5% or more of samples. A sample was removed if more than 10% of the probes were lost due to quality issues. Probes related to SNPs and multi-hit probes were removed. The datasets were also normalised using the SWAN method. Probes on sexual chromosomes remain intact. The GSE69914 dataset was a matrix of beta values that had already undergone pre-processing quality control as indicated in the poster information on the GEO website. Table 1 shows the characteristics and the number of probes of each dataset after quality preprocessing.
After the preprocessing steps, the resulting matrix expresses the Beta- values coefficients of methylation. The Beta-value method has a direct biological interpretation - it roughly corresponds to the percentage of a site that is methylated. However, from an analytical and statistical perspective, the Beta-value method has strong heteroskedasticity outside the mean methylation range, which is a major problem in the application of many statistical models. In comparison, the M-value method, which is roughly equivalent to a logarithmic transformation of the beta value, is statistically more valid in differential and other statistical analyses because it is approximately homoscedastic and the difference of the M-value can be interpreted as the fold-change [55]. Therefore, we applied a transformation of the Beta- value to M-value to our data and performed our next analysis with M-values. The M-values were obtained directly via the ChAMP package after a pre-processing check for the TCGA data portal datasets, while we transformed the beta-values of the GEO dataset into M-values via the beta2m function of the lumi R package [56].

2.2. DNA methylation analysis

Since DNA methylation is a process known to correlate with age, the biological age for the GEO dataset GEO69914 was derived using the GP-age package, even though this process is only validated for blood and not for all tissue types. We then calculated the epithelial component for each sample using EpiDISH [51], an R package for deriving the proportions of a priori known cell types in a sample representing a mixture of such cell types. This package can be used for DNAm data from whole blood, general epithelial tissue and breast tissue. Finally, PCA analysis of the methylation data assessed the correlation of methylation M values with age, epithelial components of breast tissue and tumour stage.

2.3. Epimutation detection

To identify an epimutation, the method described by Gentilini et al. [16] was used. At the beginning, each data set was considered as an independent experiment. For each dataset, the distribution of the M-value of each CpG probe in the dataset population was calculated. Then, we obtained the inter-range quantile (IRQ) of the distribution of the M-values of each CpG probe and defined the probe in the sample as epimutated if its methylation level was outside the interval defined by the limits defined in the following equations for the lower limit
L m i n = Q 1 ( 3 x I Q R )
and the following equation for the upper limit
L m a x = Q 3 + ( 3 x I Q R )
Using the package semseeker [79] with the semseeker function, we calculated the absolute value of the difference (delta, δ ) between the Mvalue of each probe minus the corresponding limit of the interval used to define an epimutation for all probes: | " M V a l u e " L m a x | if it was a hypermethylated probe, or | L m i n " M V a l u e " | if it was a hypomethylated probe. The probes with an M-Value within the defined range between L m a x and L m i n were set to zero. In turn, we calculated the distribution of deltas for both hypermethylated probes and hypomethylated probes. We then applied the quartile ranking of absolute delta values to the whole genome and assigned a score from 1 to 4 to each quartile. In this way, we not only determined the presence of a single epimutation but also ranked the epimutation weight of the whole genome; the higher was the deviant value, the higher was the rank of the epimutation. The quantile ranking was applied to eliminate technical bias in methylation measurement. To quantify the total epimutation weight of each gene region (TSS1500, TSS200, 1st-Exon, Body- gene), all probes were annotated using the official Illumina manifest file [78], using the hg19 genome version as reference.
Finally, the scores of the probes belonging to the same gene region (TSS1500, TSS200, first exon, body gene) are summed for each annotated gene. At the end, two synthetic values for the score of each gene region are obtained for each sample: one for the hypermethylated probes and one for the hypomethylated probes. These results are called weighted stochastic epimutation scores (WSEMS).
Finally, for each gene region, a quantile regression model (at the median) was applied between the WSEMS obtained for both the hypomethylated and hypermethylated gene regions and oestrogen receptor status using age, epithelial proportion, and clinical stage (available for both TCGA datasets) as covariates.
E R s t a t u s E p i m u t a t i o n B u r d e n + A g e + S t a g e + E p i t h e l i a l c o m p o n e n t
The quantile regression model was calculated using the R package lqmm [49]. All results were corrected for multiple testing using [48] Benjamini and Hochberg method.

2.4. Identification of genes and pathways

Quantile regression results were filtered to identify gene regions with statistically significant epimutation burden (hypo- or hypermethylated), and pathway analysis was performed using the pathfindR R package [57]. As a result, pathfindR generates a table with the ID and the name of the pathway resulting from the enriched analysis with the significant gene regions, the lowest adjusted p-value of the given term over all iterations ( l o w e s t p ), the highest adjusted p-value of the given term over all iterations ( h i g h e s t p ), the number of occurrences of this gene in the pathway over all iterations. Finally, the pathways identified in each dataset were intersected to find the common pathways among all datasets.

3. Results

3.1. Clinical and biological characteristics of BC patients and tumour samples

We began by downloading three publicly available data sets. Table 2 summarises the clinical and biological characteristics of the patients in the three datasets.
Anamnestic personal age is not available in the GSE69914 dataset; therefore, biological age was derived from the same methylation data using an algorithm based on blood methylation data, although only cancer tissue data were available. The mean age was 57.65 ± 12.74 years in the TCGA-BRCA dataset, 49.93 ± 5.62 years in the GSE69914 dataset, and 59.19 ± 13.11 years in the TCGA-BRCA -27k dataset. The clinical stage was not included in the GSE 69914 dataset. The distribution of the clinical stage of BC in the other two datasets for which it is available is similar and consistent with reports in the literature, with the most part of the cases occurring in the first two stages of BC [77]. As reported in the literature, the ratio of ER-positive to ER-negative BC is also about 80-20 per cent [19].

3.2. Analysis of methylation profiles of BC tissues

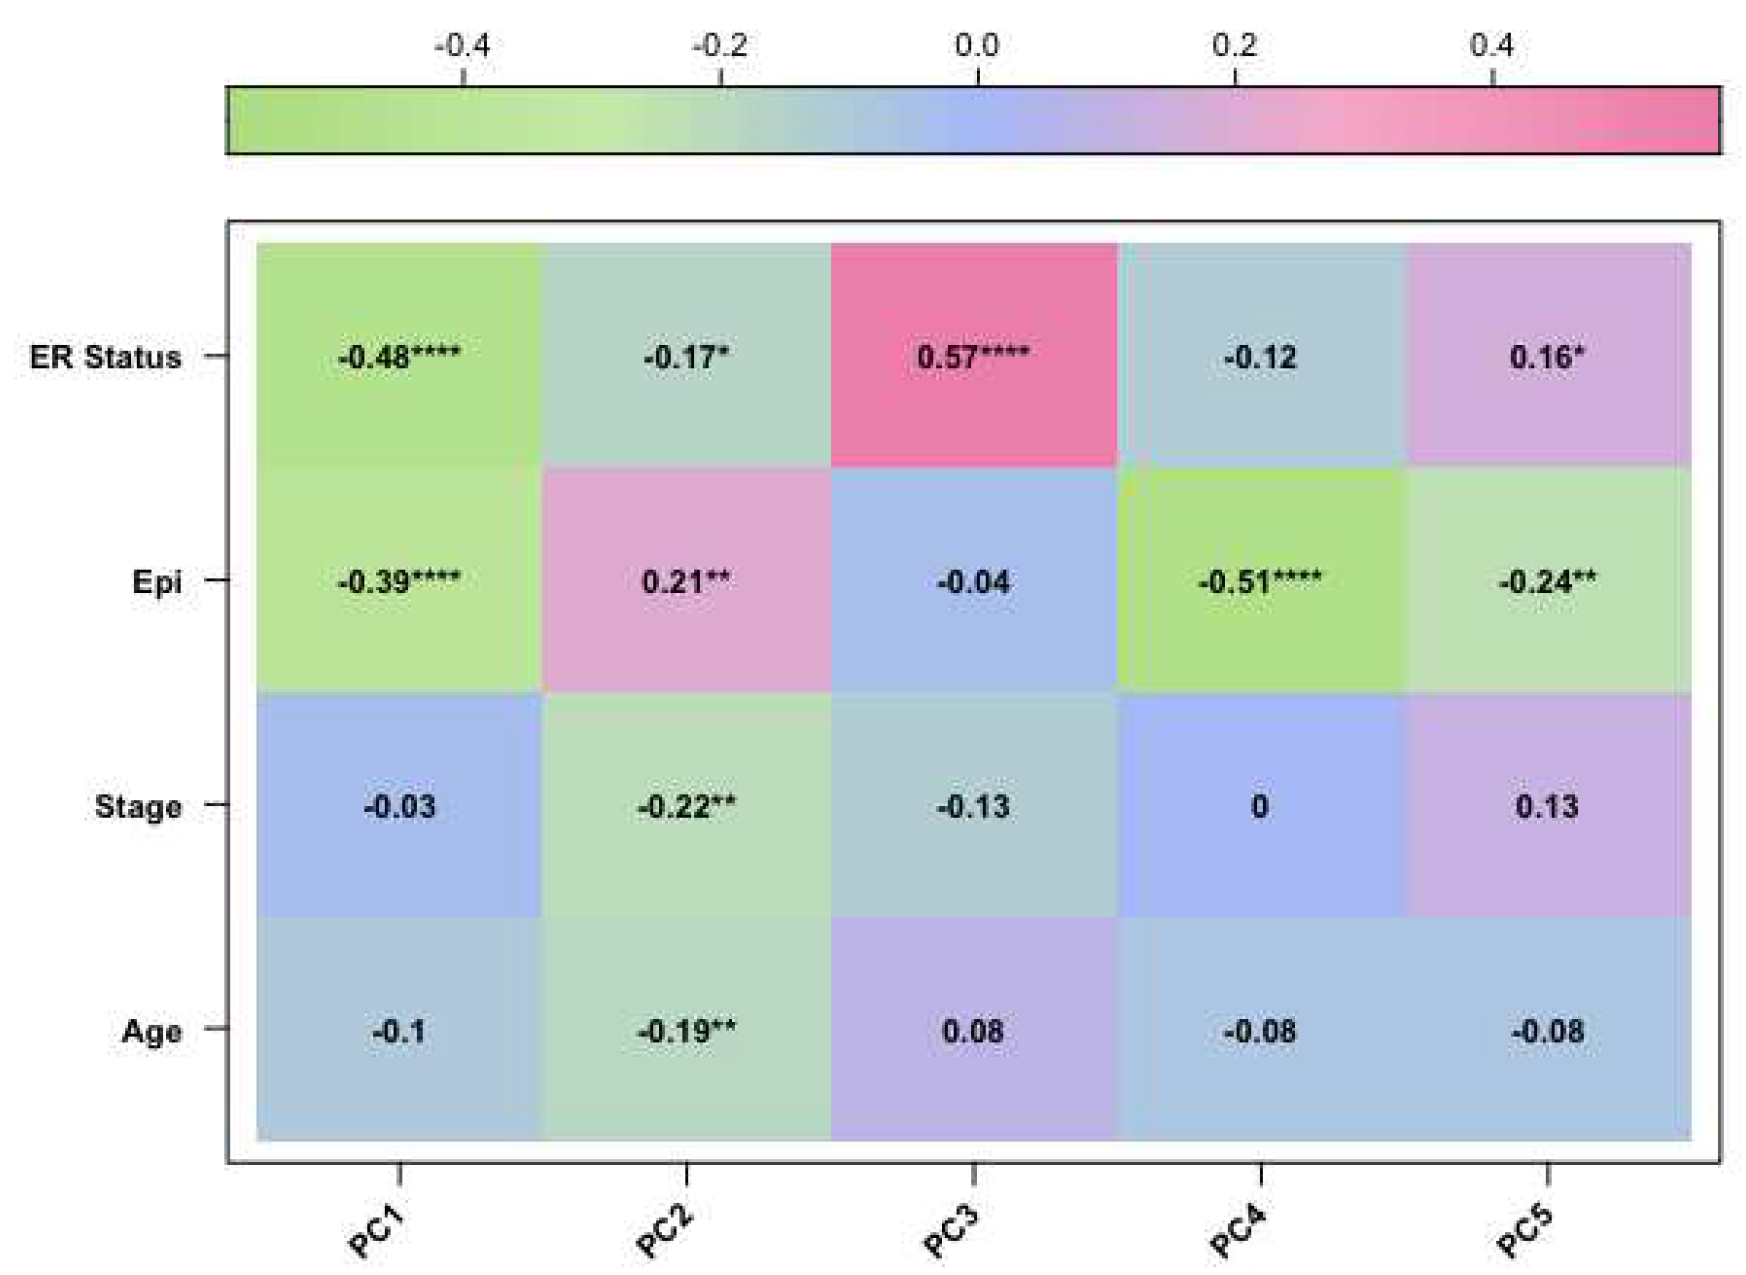
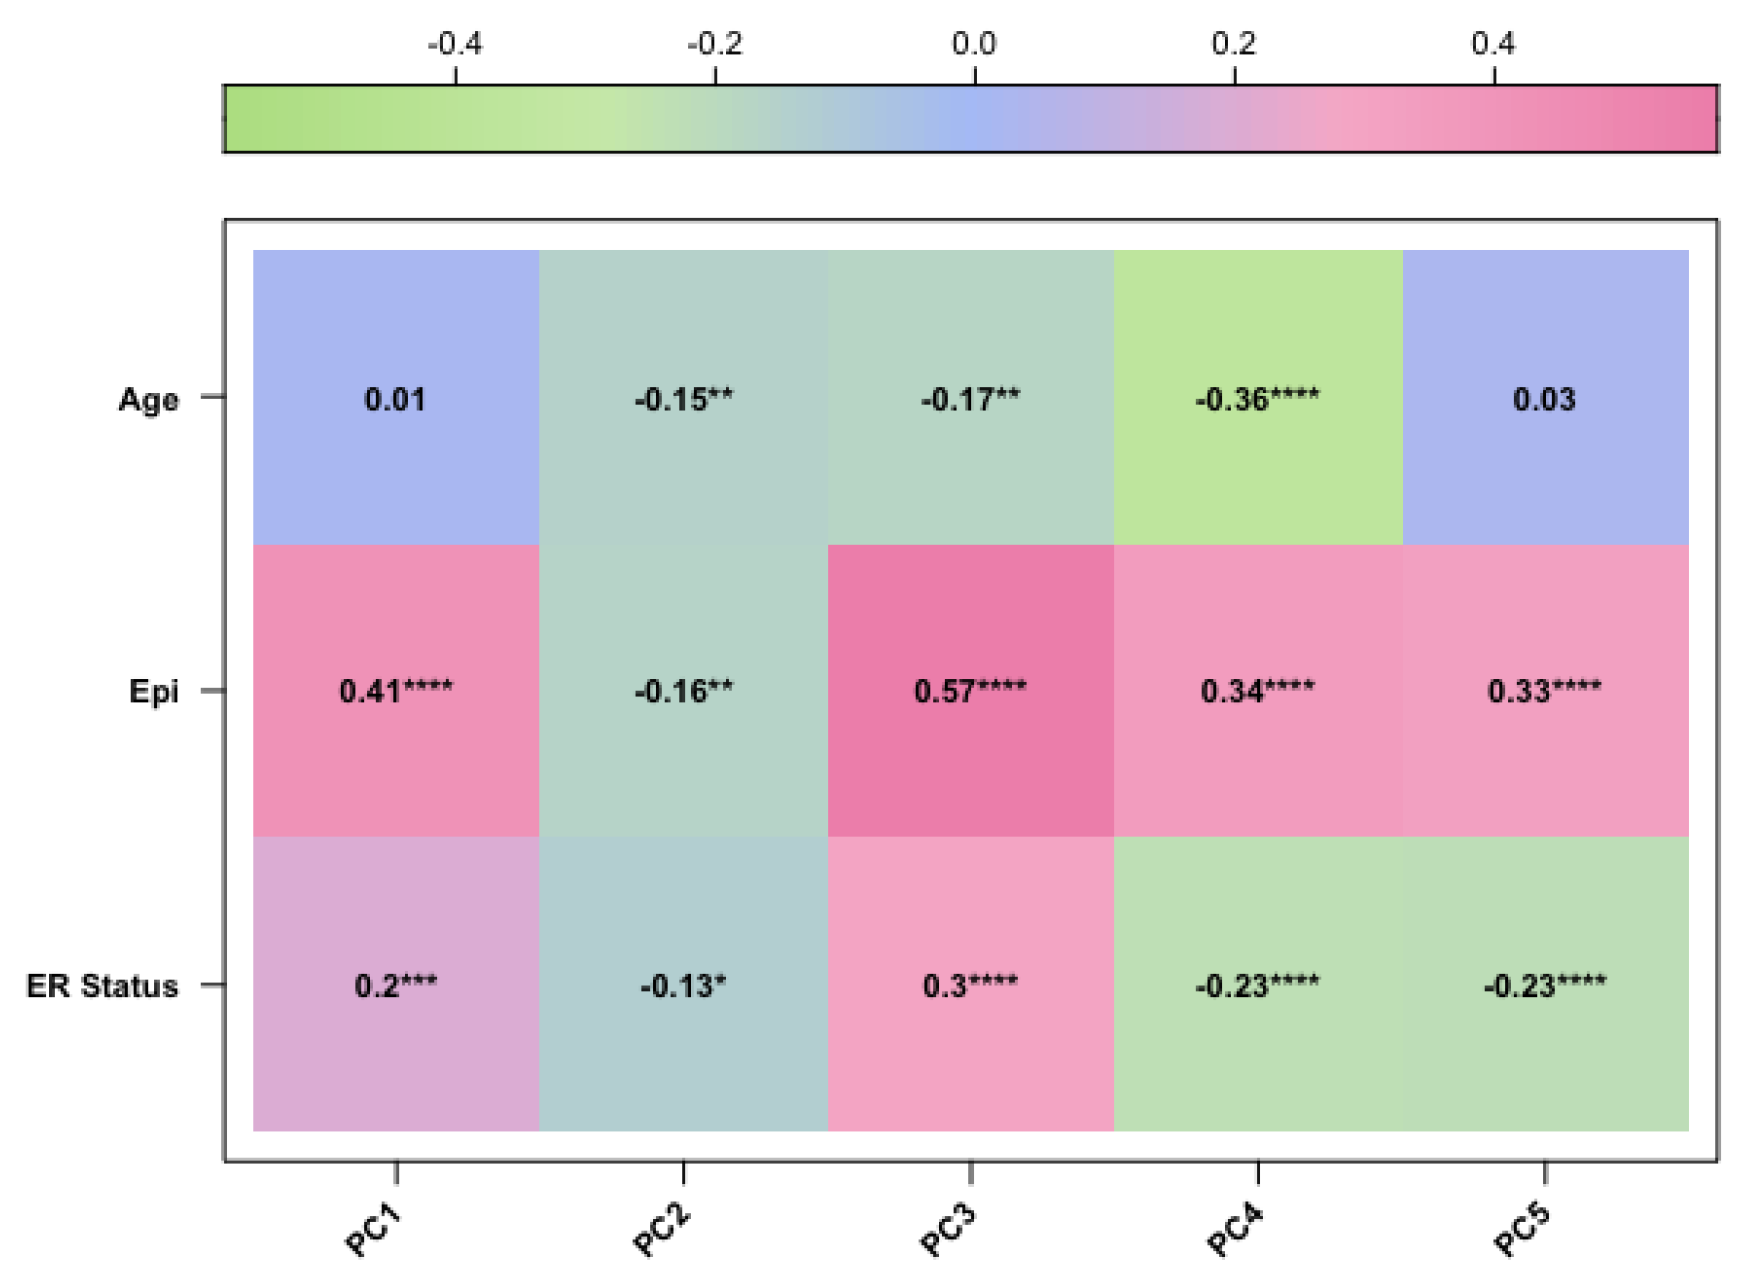
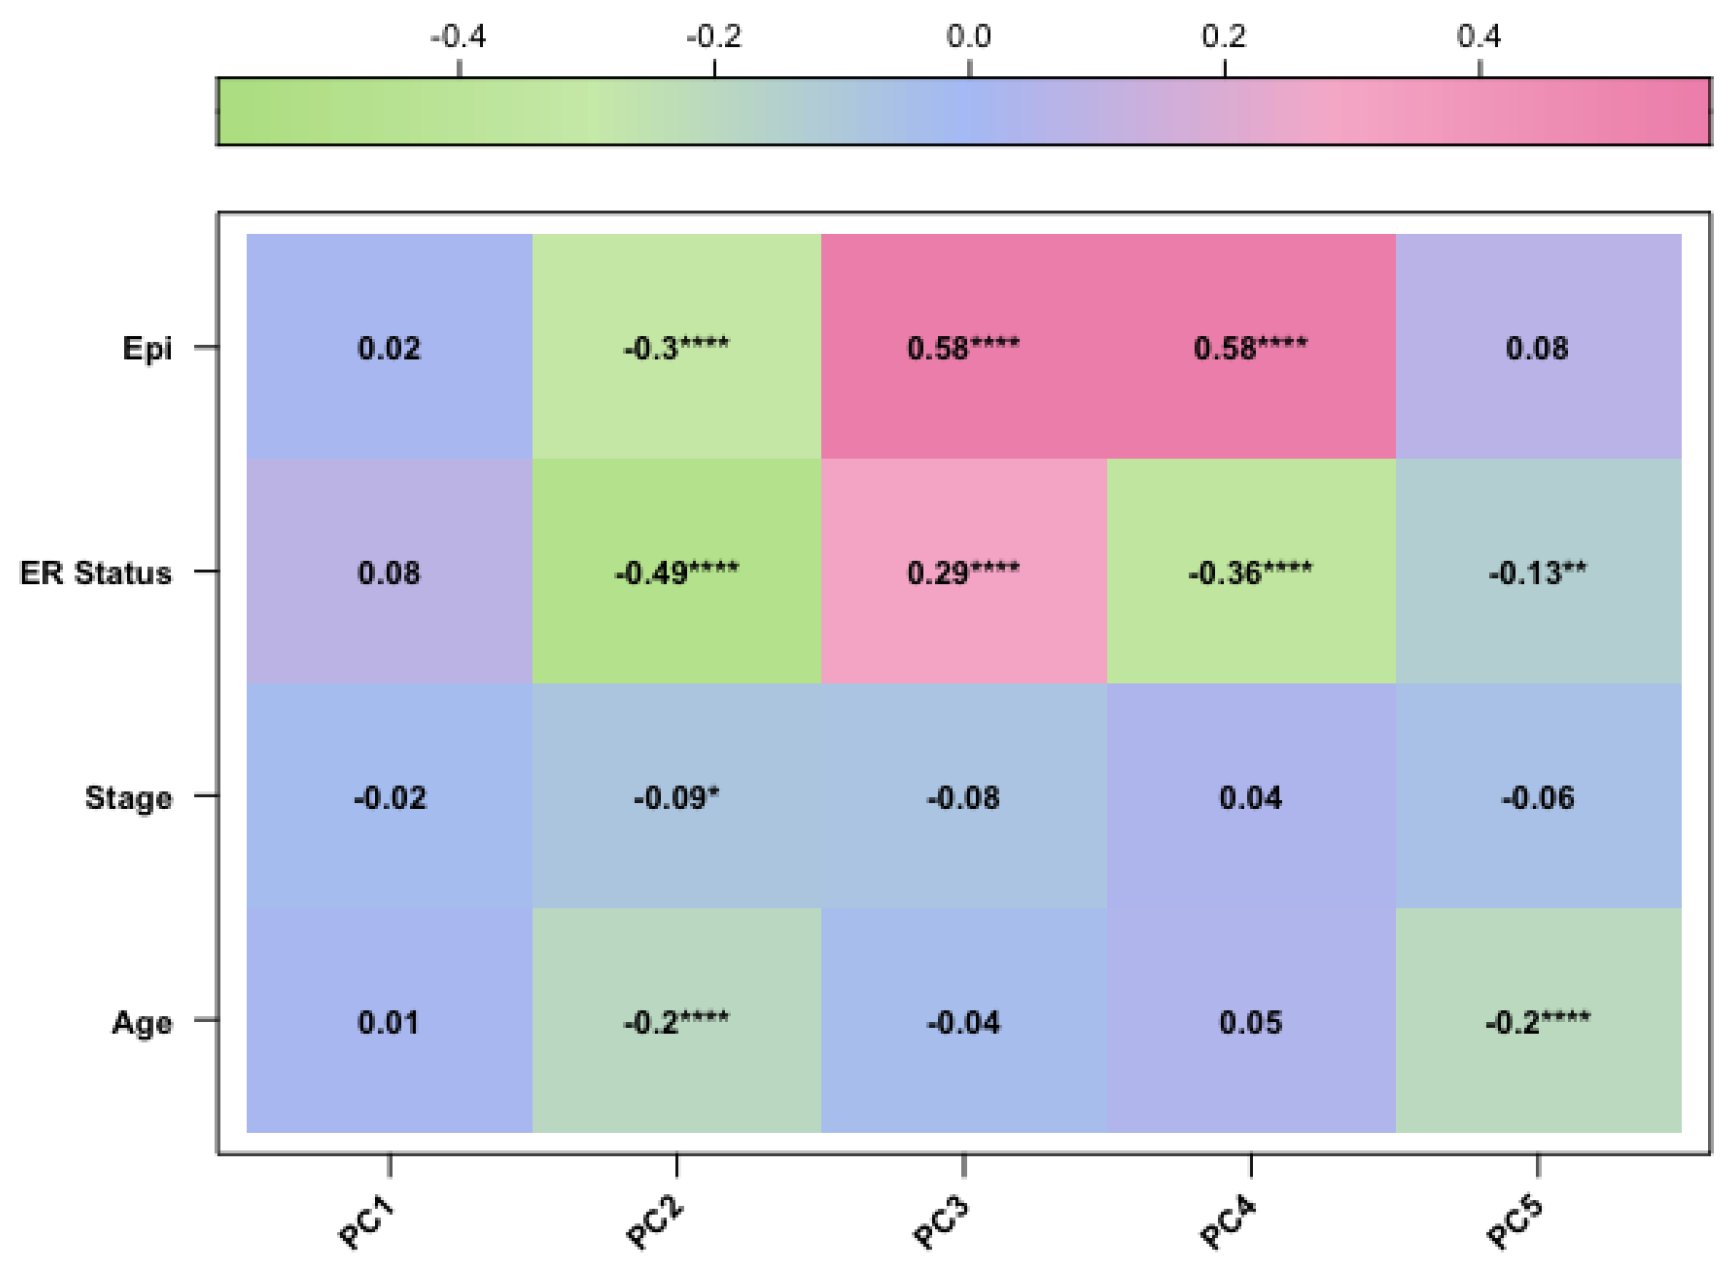
After preprocessing analysis, a correlation was evaluated between the methylation profile of BC samples and the following three factors: patient age, clinical stage, and epithelial components of BC samples, which are known variables affecting the methylation profile of BC tissues [4,5]. Therefore, we performed PCA analysis and confirmed that these variables were correlated with the methylation data. Finally, we included the epithelial component, patient age, and clinical stage as covariates in our final regression model (as described in Materials and Methods).
Figure 1. The corplot diagram of the correlation test between each principal component and phenotypic trait for the GSE69914 study
Preprints 76801 g001
Figure 2. The corplot diagram of the correlation test between each principal component and phenotypic trait for the TCGA-BRCA study
Preprints 76801 g002
Figure 3. The corplot diagram of the correlation test between each principal component and phenotypic trait for the TCGA-BRCA-27k study
Preprints 76801 g003

3.3. Epigenetic mutation analysis and definition of “epimutation score”

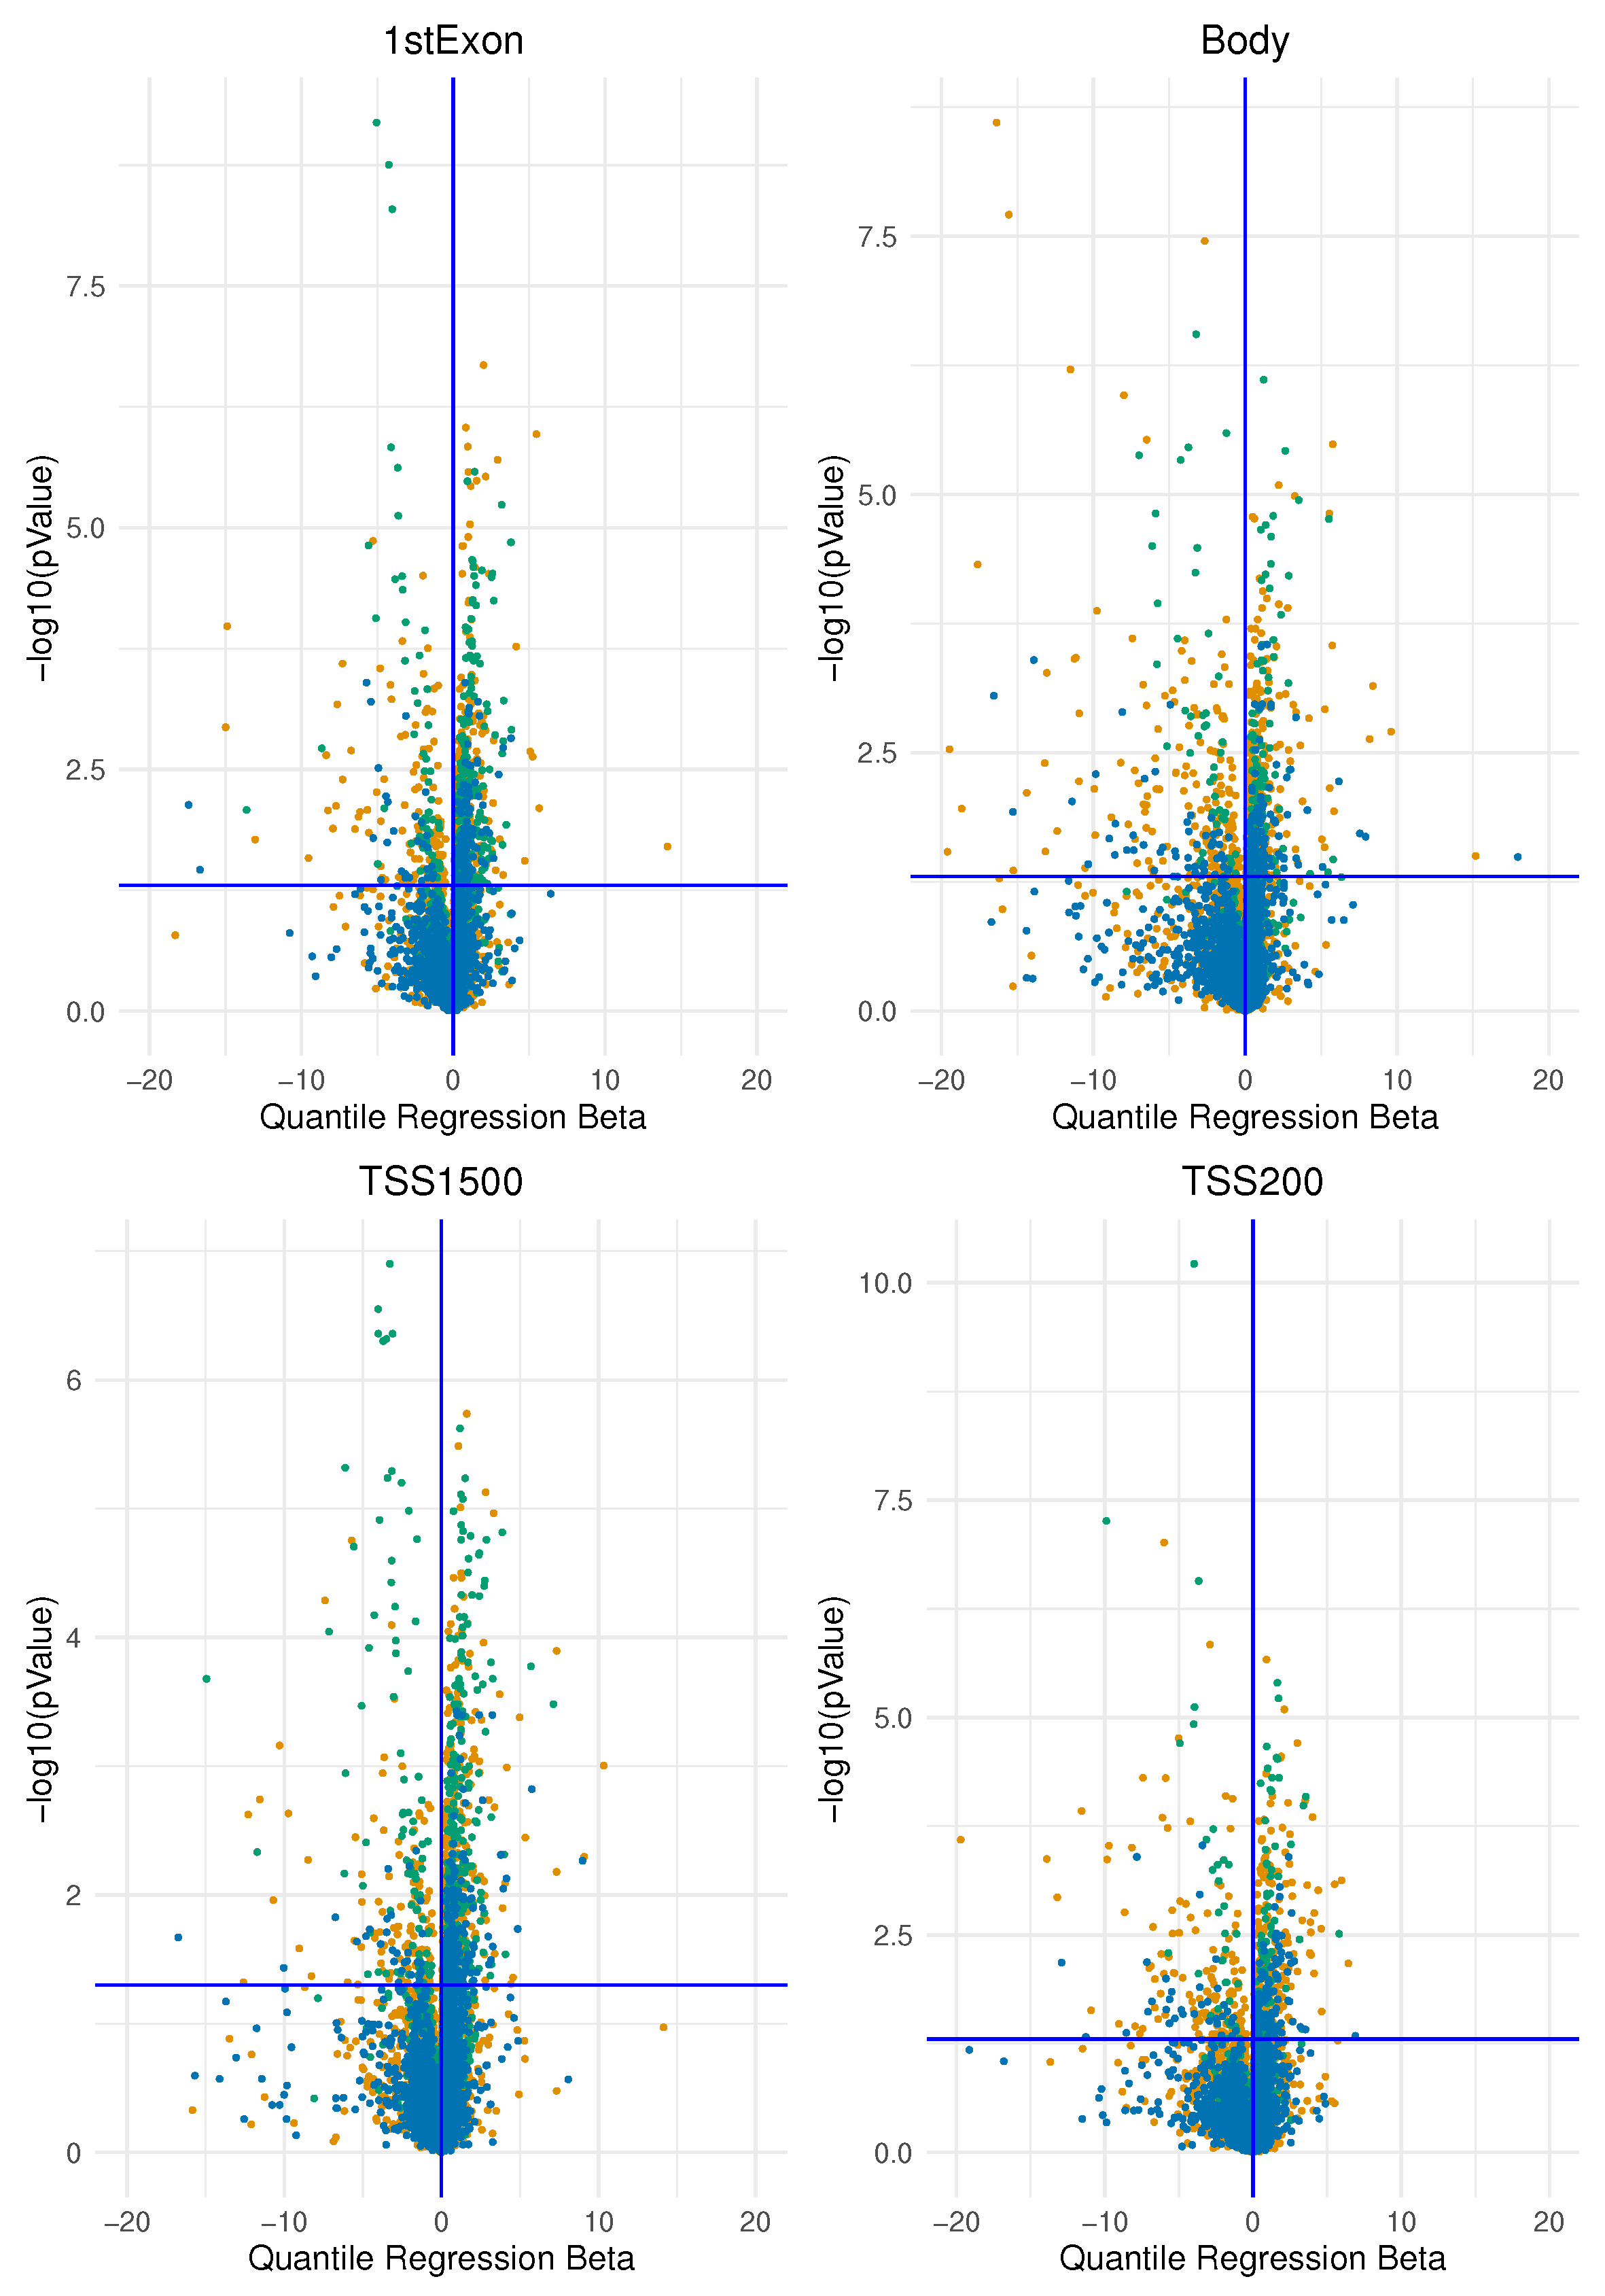
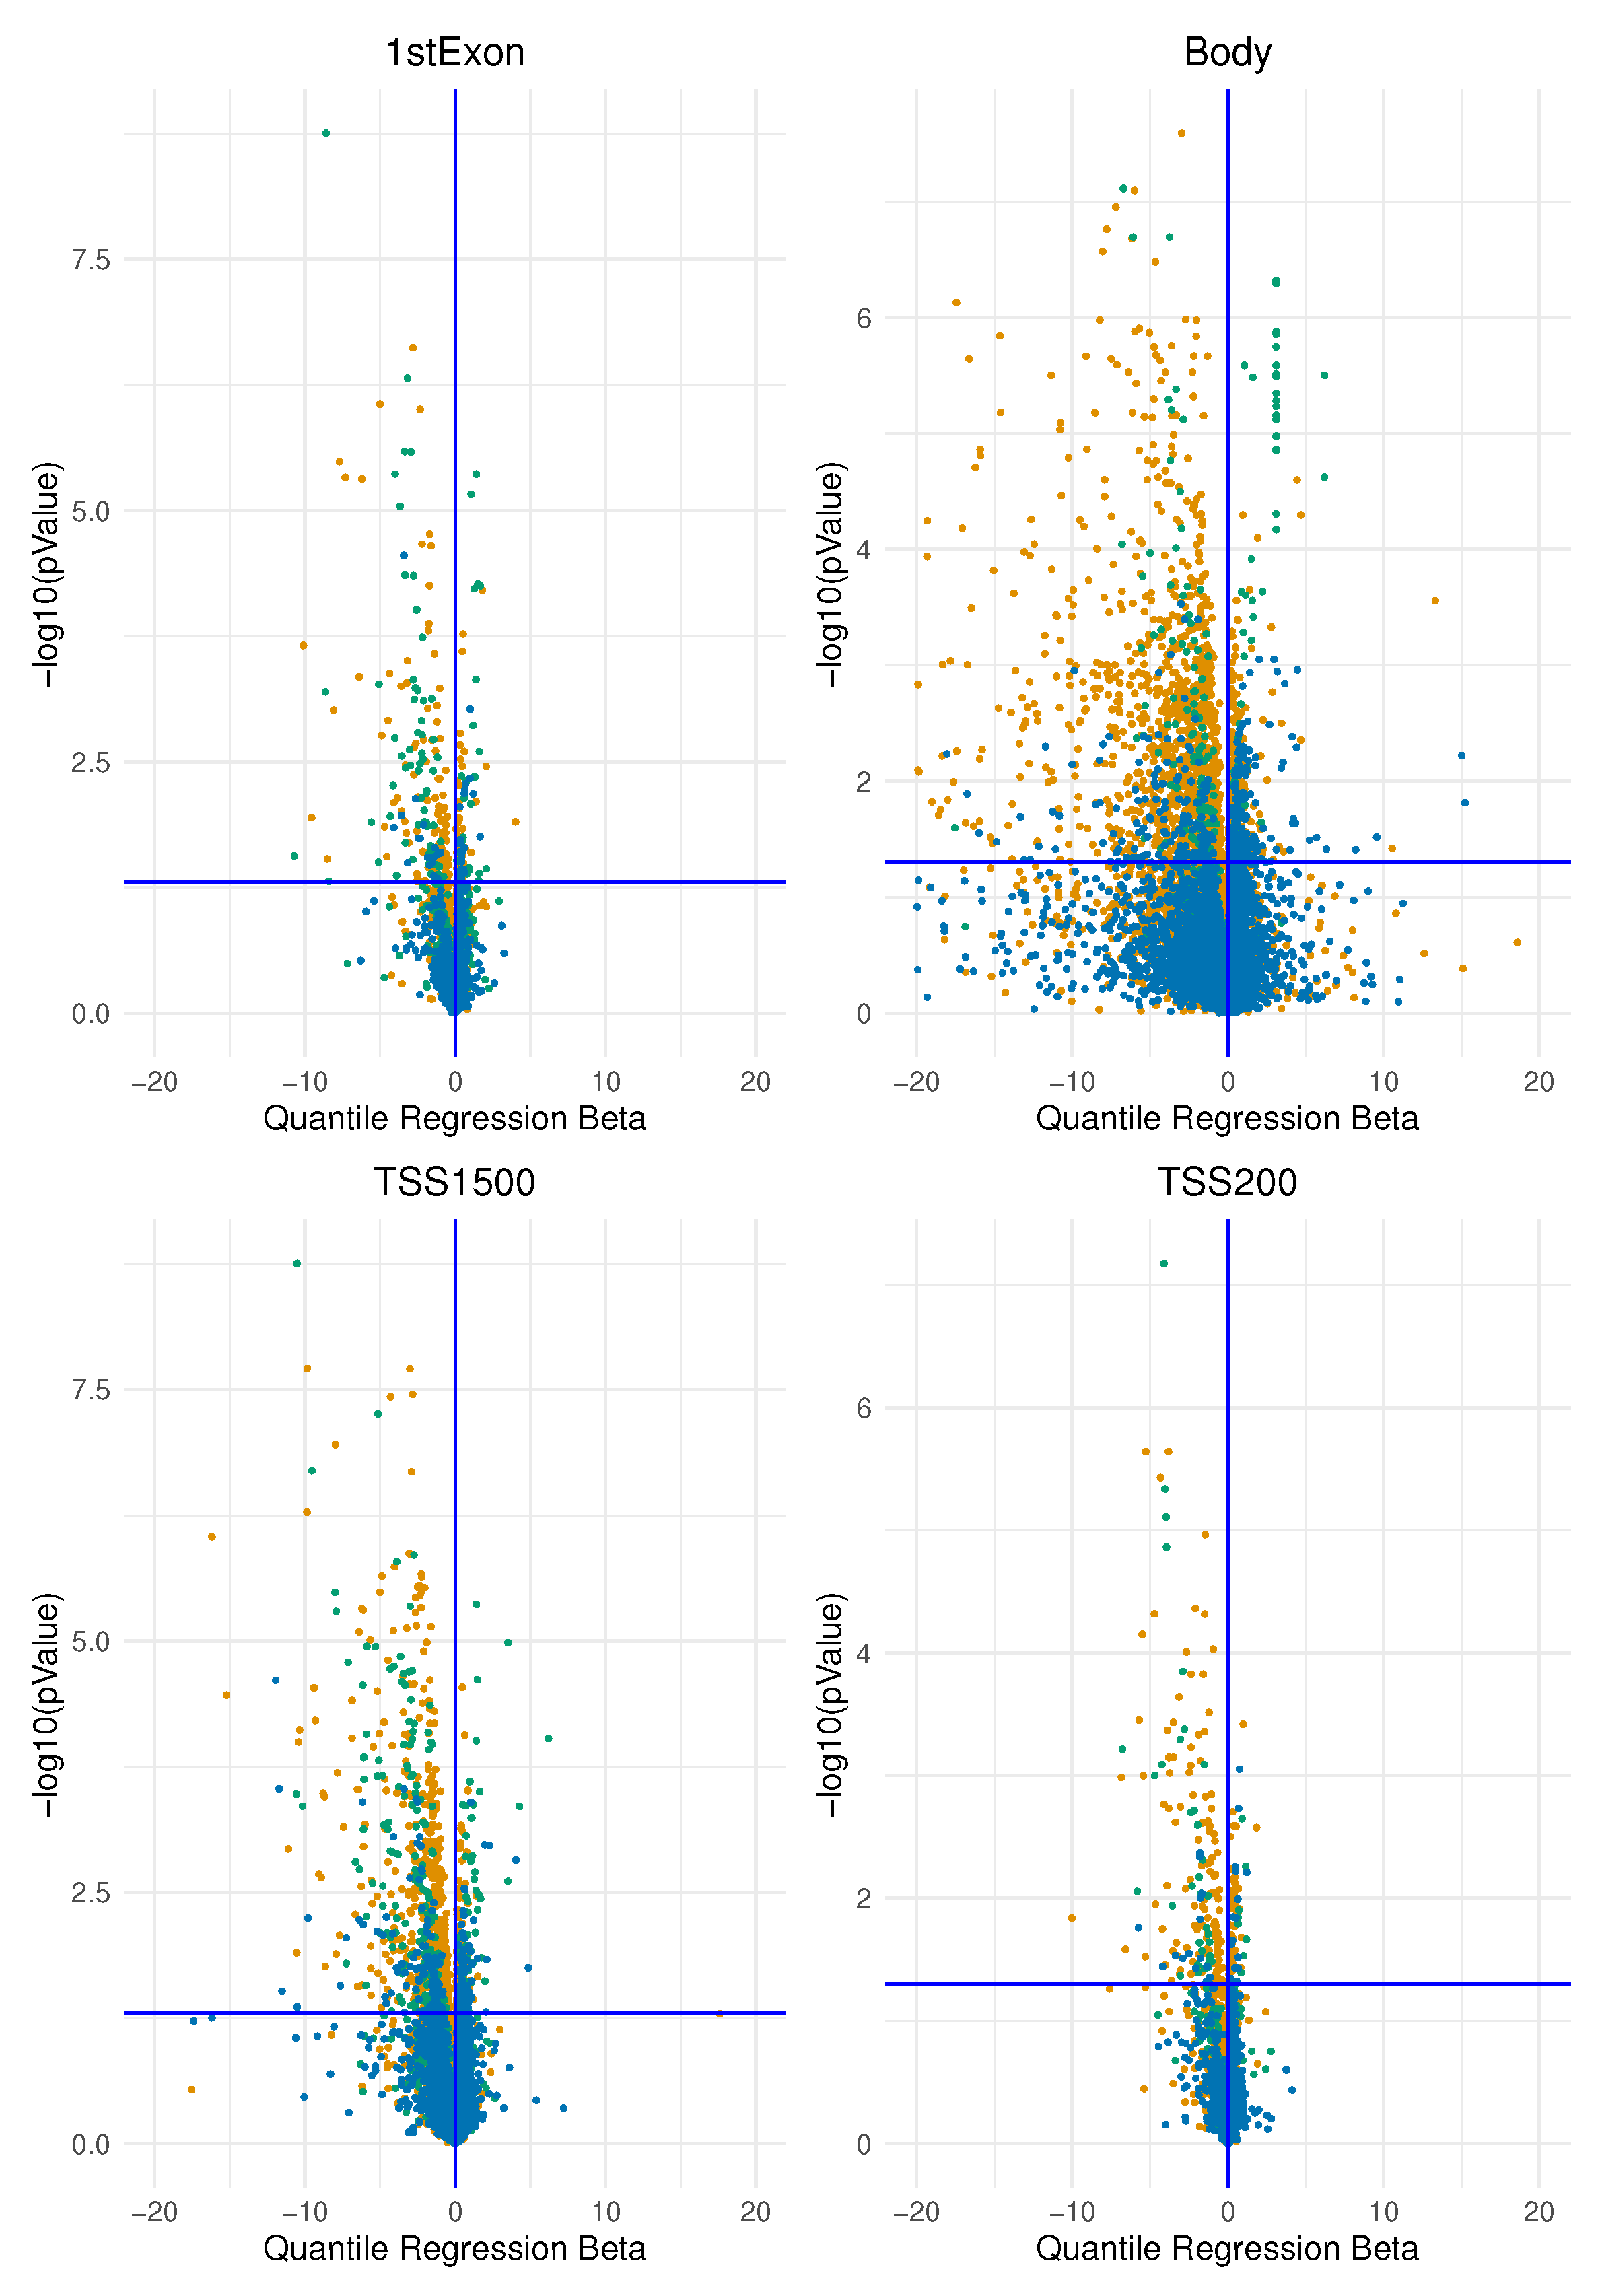
In this study, we investigated the association of epimutation score in two main groups of breast cancer identified immunohistochemically by oestrogen receptor expression according to the latest clinical guidelines. We began by analysing methylation data from one data set at a time. We determined an “epimutation score” for each gene region as explained in the Method section. We then applied a quantile regression model to the median for each gene region for each type of epimutation that occurred (by hypermethylation and hypomethylation). In this way, we obtained the beta regression coefficients explaining how much the epimutation burden differs between the two groups. We plotted the beta regression coefficients for the expression of ER and their corresponding p-values in the volcano plots in Figure 4 and Figure 5
Figure 4. The figure represents the volcano plot for each genomics area: each dot represents, for each gene, the quantile regression beta coefficient and the corresponfing l o g 10 ( p v a l u e ) . All the four plots represent the genes affected by an epimutation score due to hypermethilation.
Preprints 76801 g004
Figure 5. The figure represents the volcano plot for each genomics area: each dot represents, for each gene, the quantile regression beta coefficient and the corresponfing l o g 10 ( p v a l u e ) . All the four plots represent the genes affected by an epimutation score due to hypomethilation.
Preprints 76801 g005
We interpreted the positive beta coefficients (on the right of the vertical axis) as a measure of the higher total epimutation burden in the gene region for ER-positive BC compared with ER-negative BC and the negative beta coefficients (on the left of the vertical axis) as a measure of the higher burden of epimutated probes in the gene region present in ER-negative BC compared with ER-positive BC; this was applied both to hypermethylated and to hypomethylated analyses.

3.4. Identification of the most epimutated genes

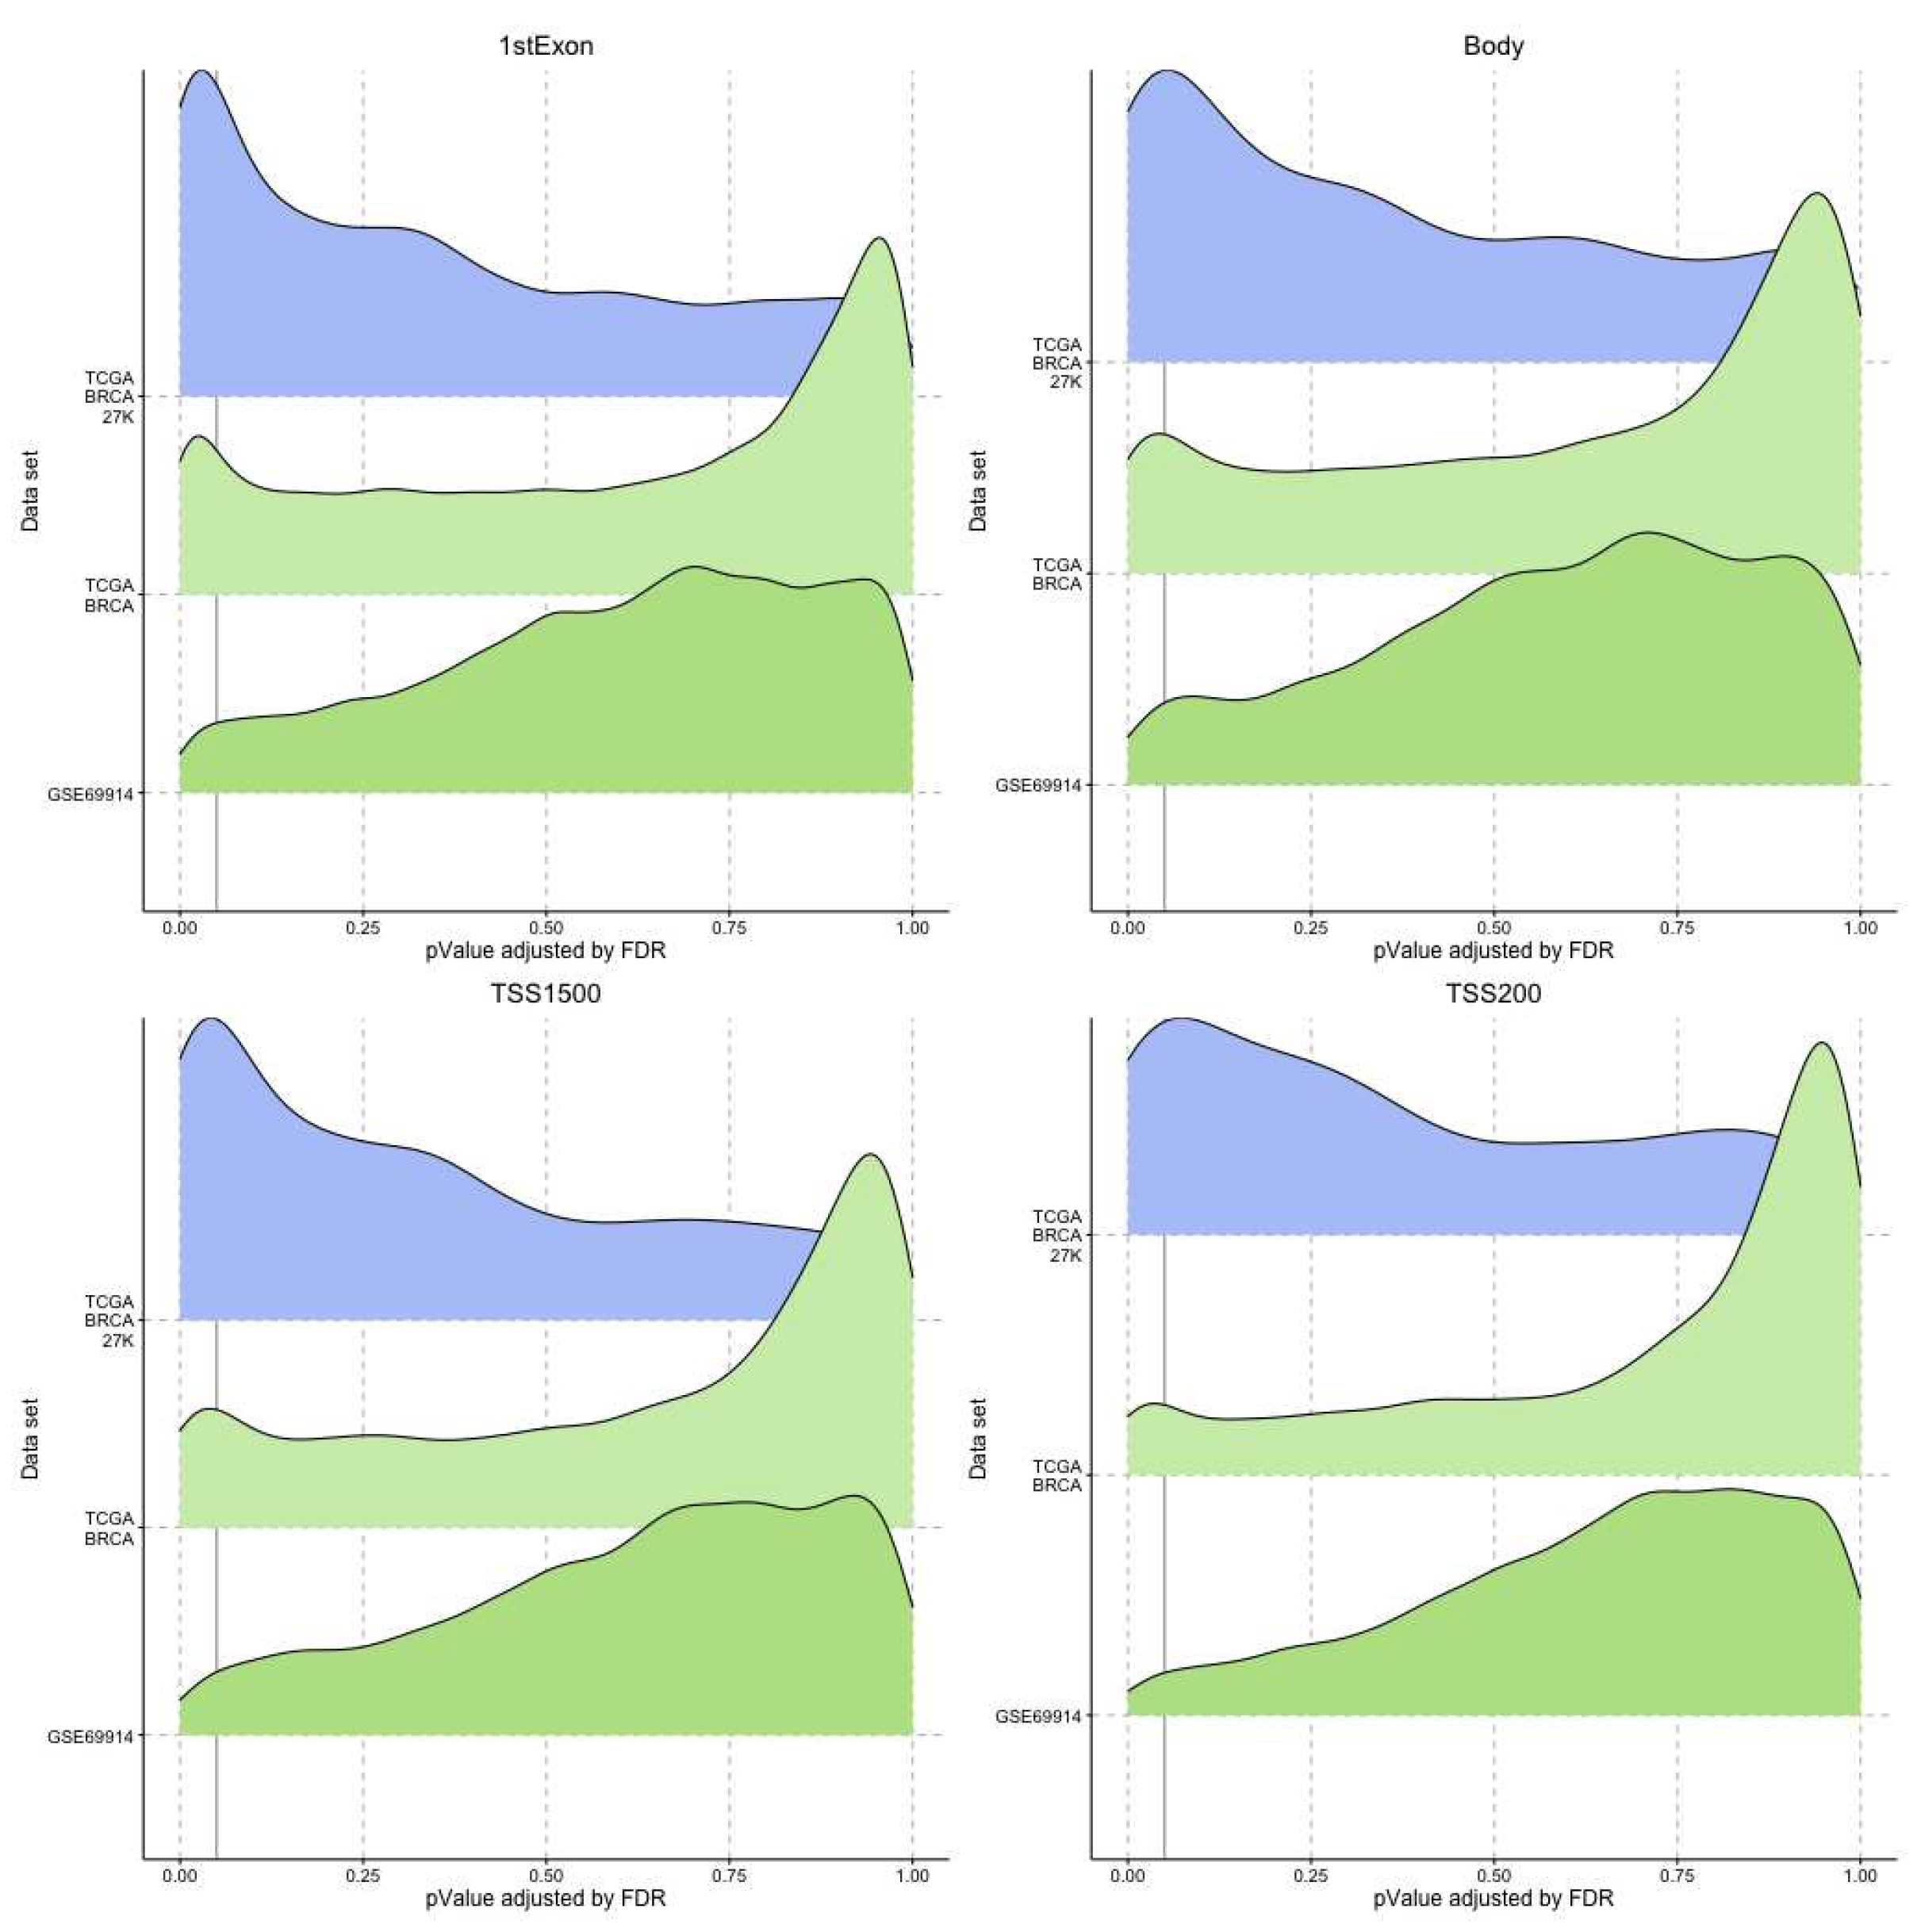
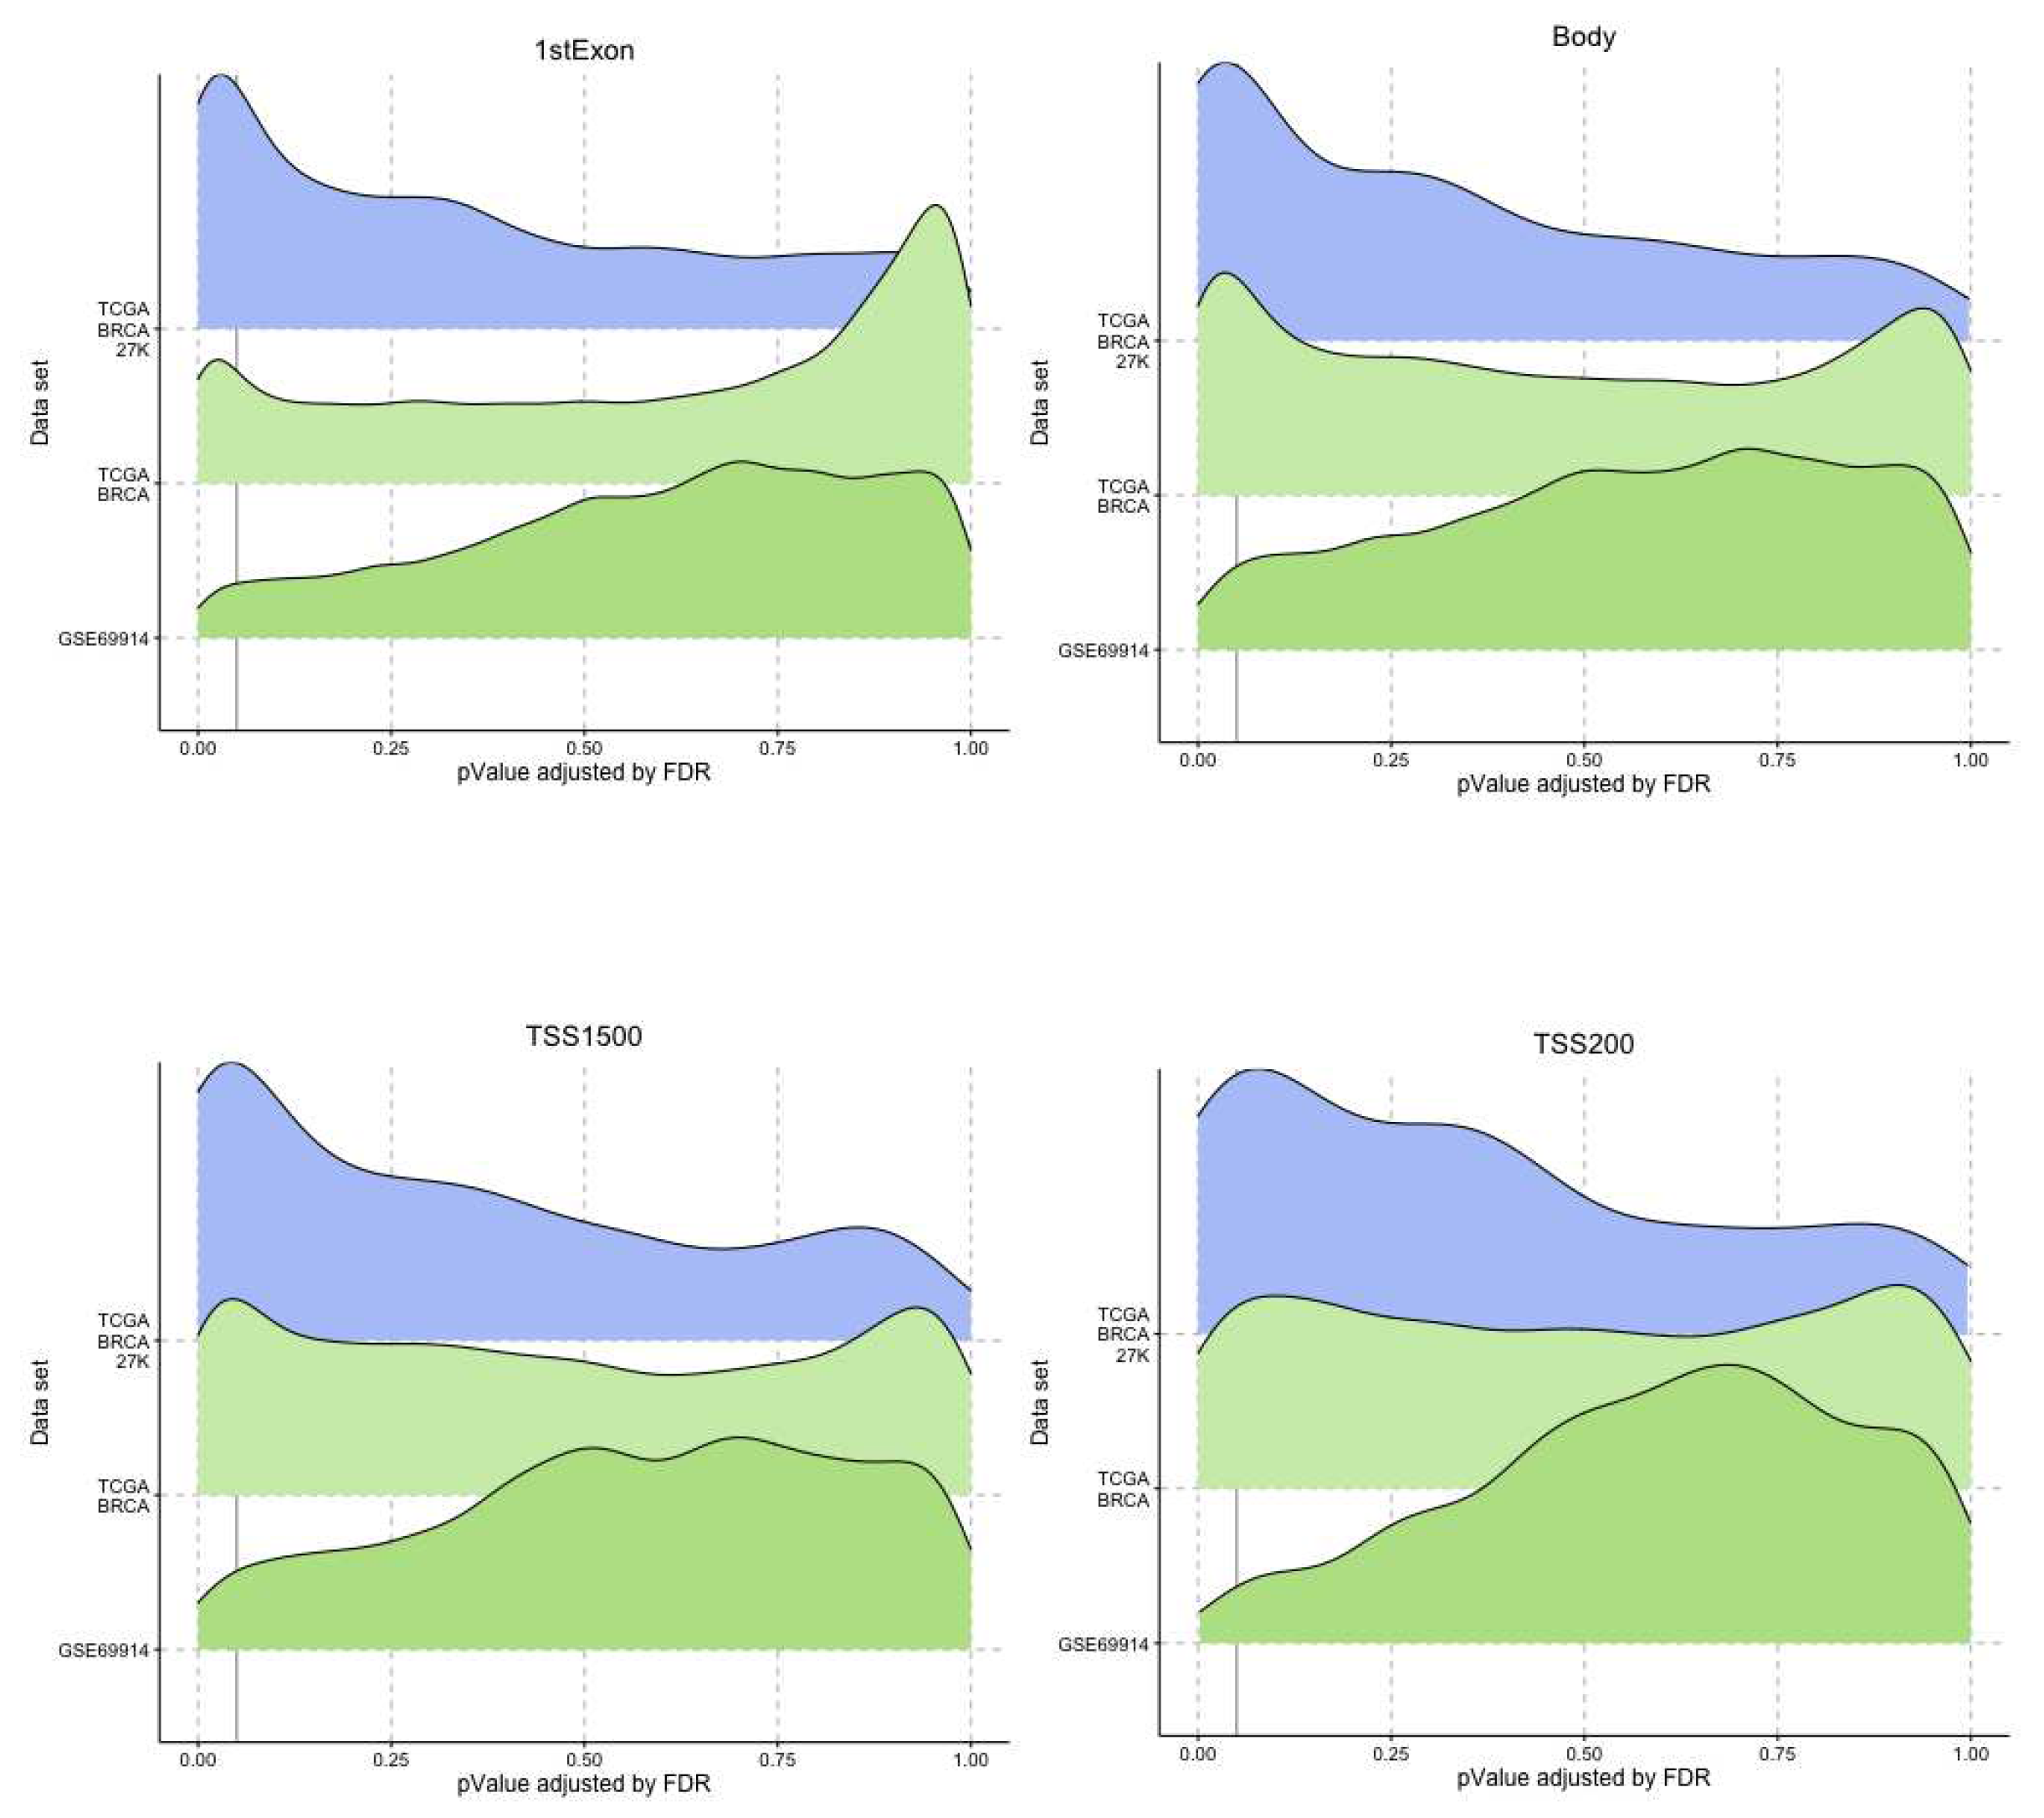
Consequently, we filtered out the genes with statistically significant regression beta coefficients in the gene regions studied. The ridge plots in Figure 6 and Figure 7 give an idea of a large number of genes with a statistically significant presence of epimutations, both hypomethylated and hypermethylated.
Figure 6. Ridge plots. Each plot represents for each dataset the distribution of the p-value associated to the genes that presented an epimutation burden due to hypermethylation
Preprints 76801 g006
Figure 7. Ridge plots. Each plot represents for each dataset the distribution of the p-value associated to the genes that presented an epimutation burden due to hypomethylation
Preprints 76801 g007
In this way, we obtained for each dataset a list of genes with different epimutation load in the two BC groups (one list due to hypomethilation and one due to hypermethylation). Using these lists, we performed pathway enrichment analysis in the Reactome database, the results of which are shown in Table 6, Table 7 and Table 8.
Table 3. Pathways HYPO shared for dataset TCGA-BRCA 27k on TSS1500 gene area.
Description Regression Beta Genes with increased burden Genes with decreased burden
Integrin signaling 5.06 BCAR1
Table 4. Pathways HYPO shared for dataset TCGA-BRCA 27k on TSS1500 gene area.
Description Regression Beta Genes with increased burden Genes with decreased burden
Integrin signaling 7.12 FGB SRC
Table 5. Pathways HYPO shared for dataset TCGA-BRCA on TSS1500 gene area.
Description Regression Beta Genes with increased burden Genes with decreased burden
Integrin signaling 3.47 AKT1 RAP1A, SRC
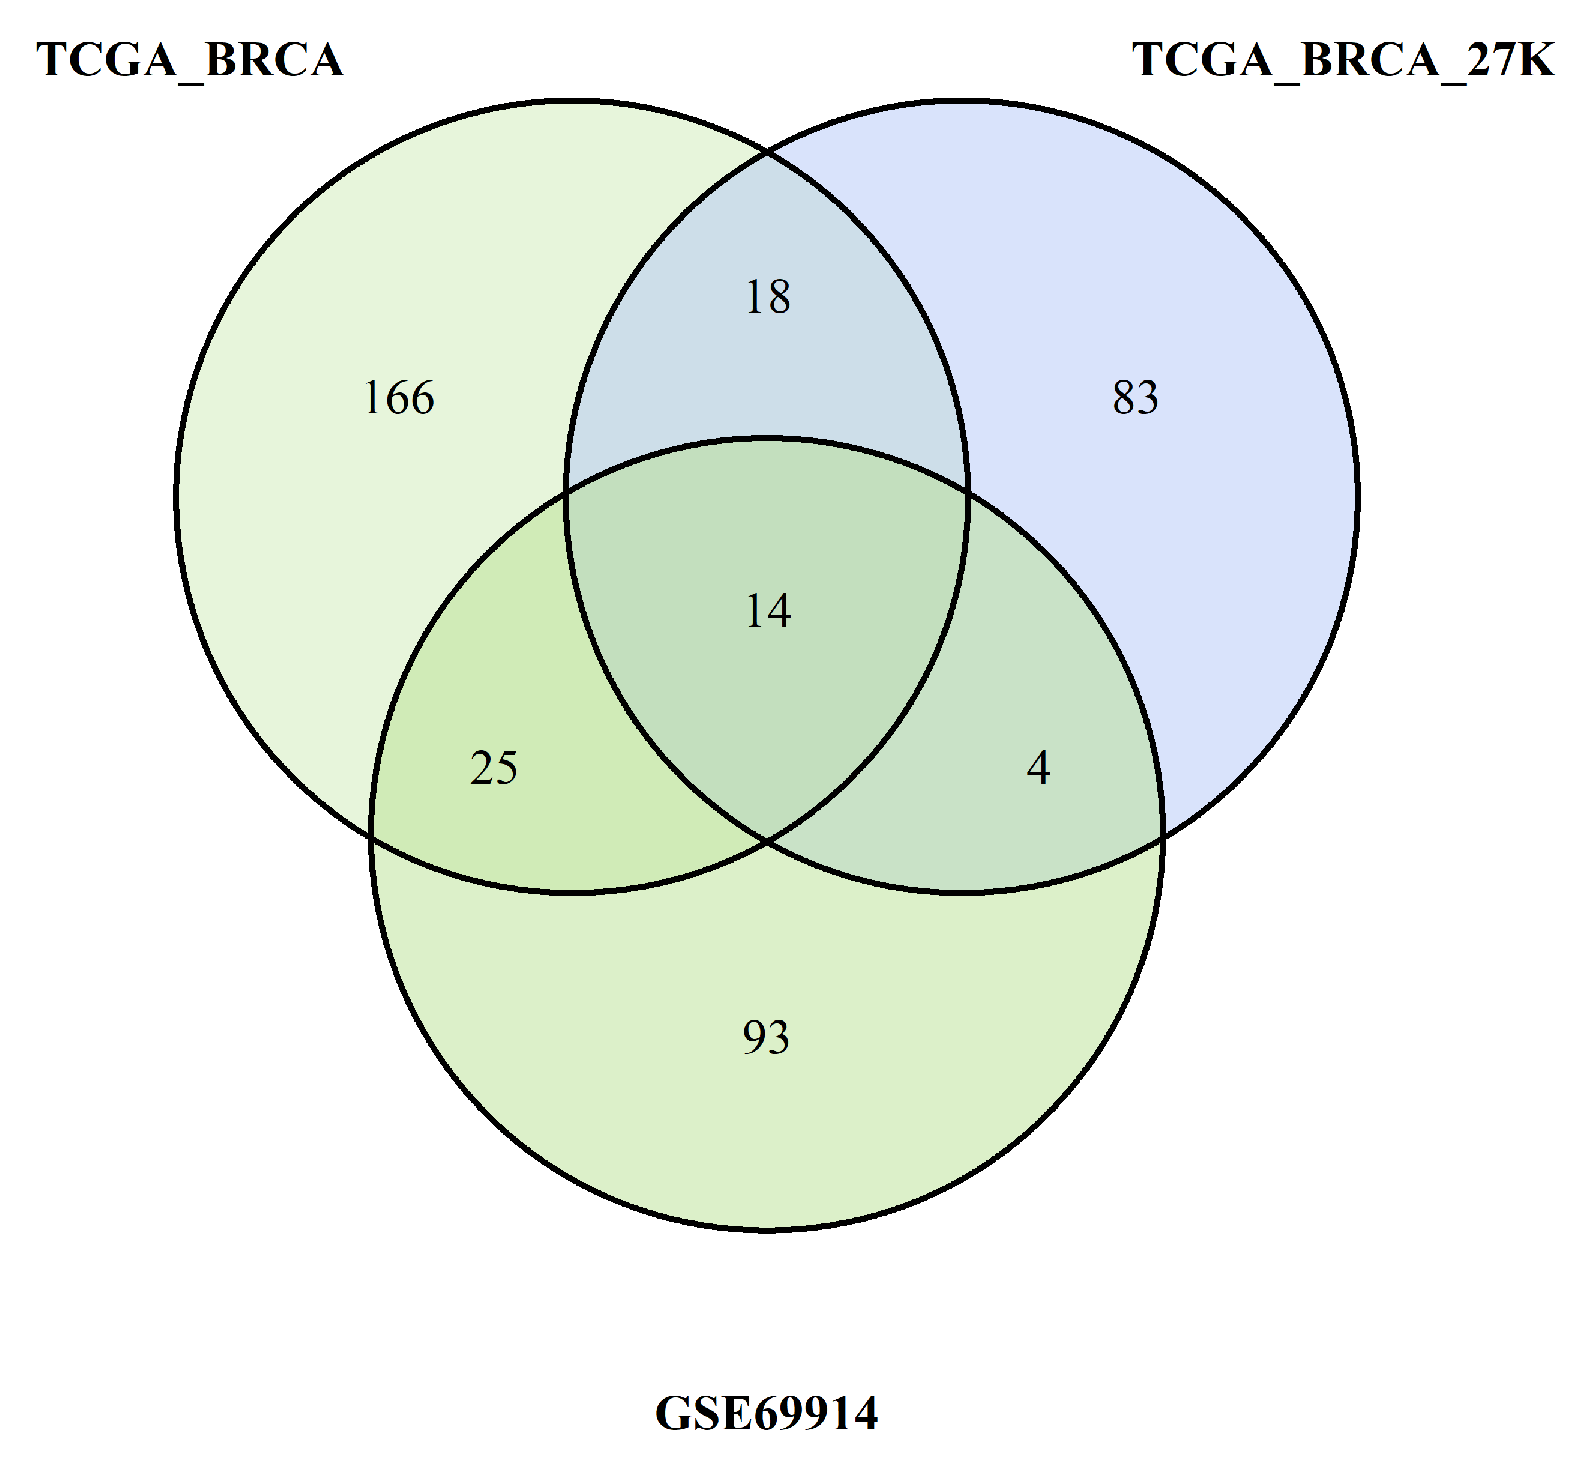
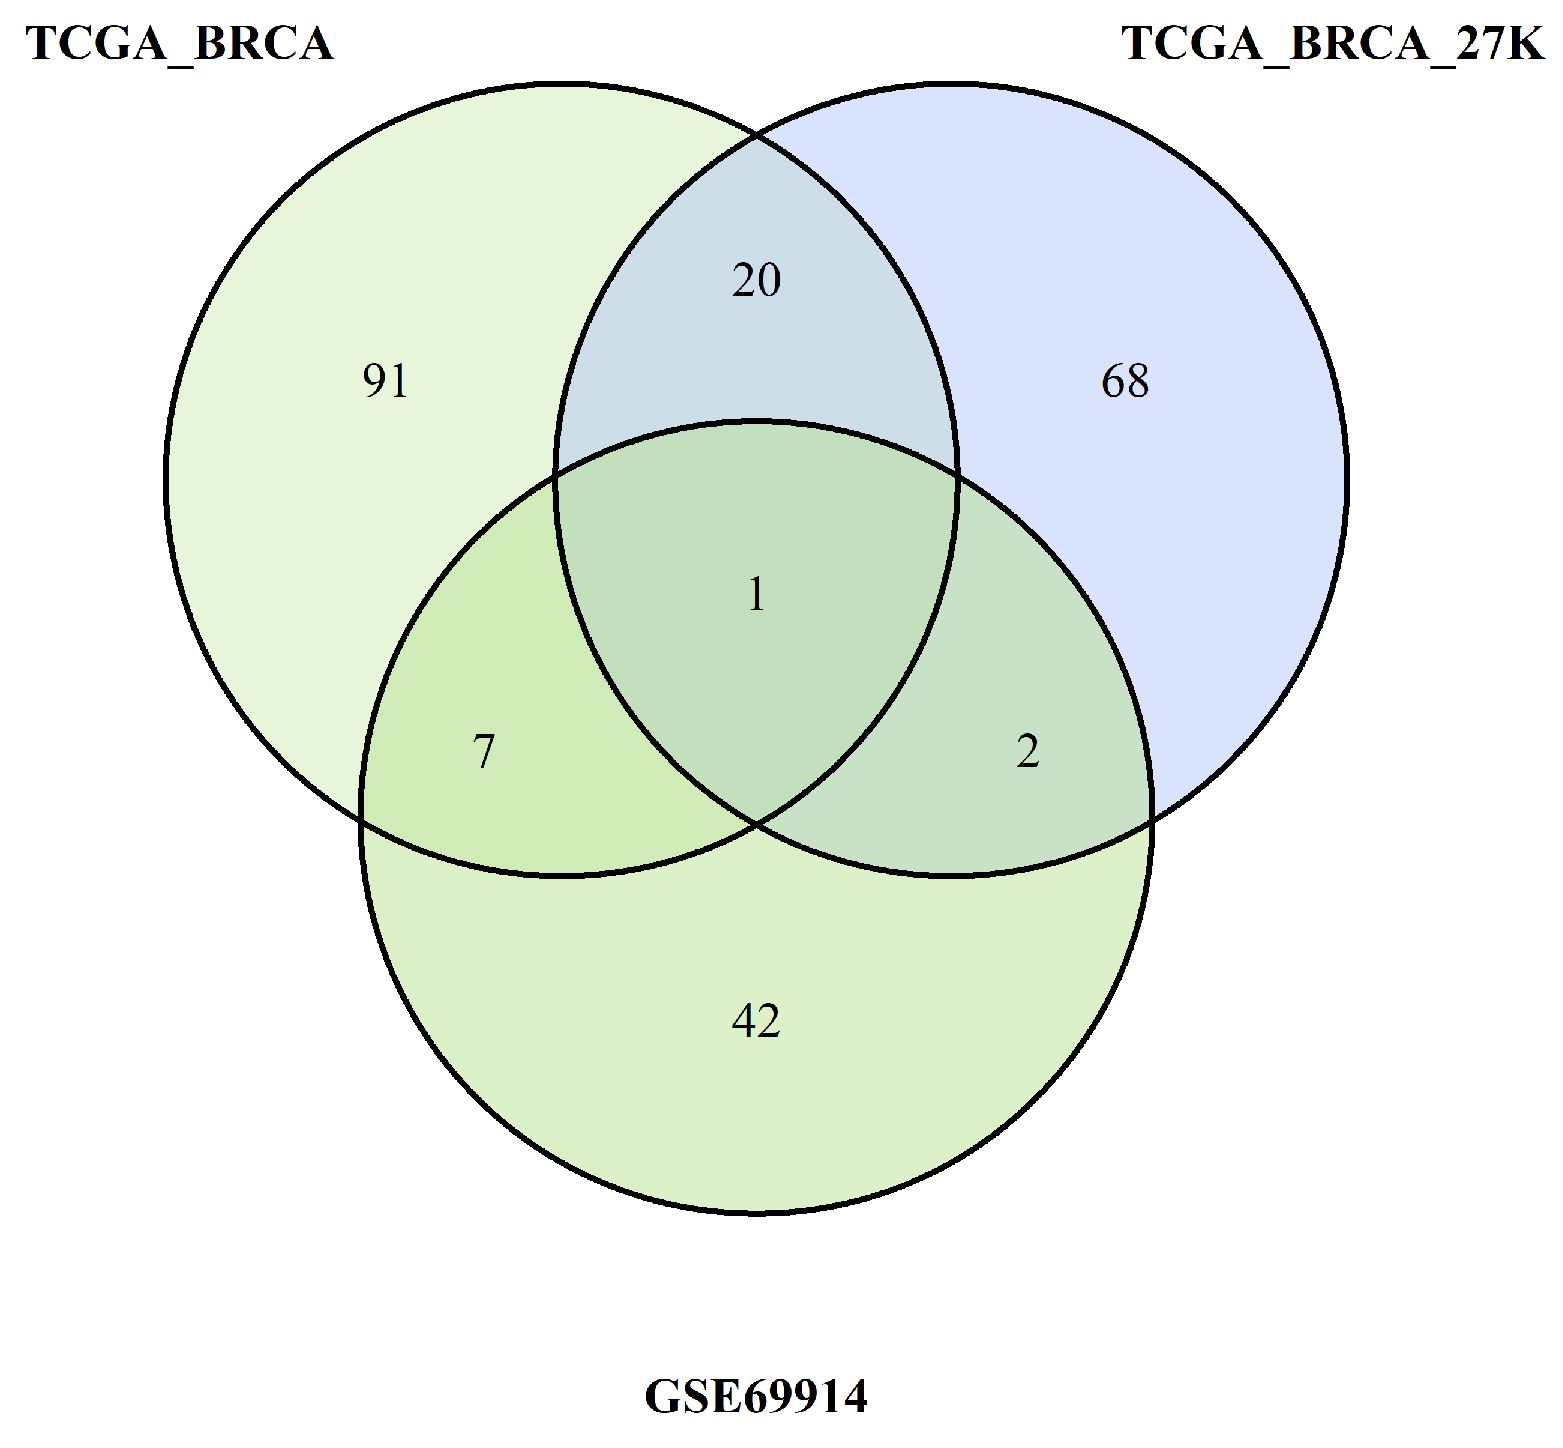
All these steps are summarised in Figure 8 and Figure 9, which are Venn diagrams of the multiple crossing steps.
Figure 8. Pathways overlapping among the three studies due burden of probes with hypermethylation
Preprints 76801 g008
Figure 9. Pathways overlapping among the three studies due burden of probes with hypomethylation
Preprints 76801 g009

3.5. Identification of common pathways

The pathways identified by the enrichment analysis of each dataset were crossed as summarised in the Venn diagrams Figure 8 and Figure 9. We found common pathways for the three datasets characterised by a higher burden of epimutations in the TSS1500 gene region than for hypomethylation and hypermethylation probes. The following tables show the pathways shared by all three datasets analysed.
In the first Table 9 are the pathways corresponding to the pathway retrieved from the TSS1500 gene region with epimutated probes that showed significantly higher epimutation levels in ER -positive BC versus ER -negative due to hypermethylation. We can note that most of them belong to two main pathways, the Notch pathway and the SUMOylation pathway, which are associated with breast cancer, as explained in the next section. Two other pathways are the UCH proteinases pathway and the Ub-specific processing proteases pathway, both of which are related to the regulation of the ubiquitination process, which is another post-translational protein process like SUMOylation. The last pathway is the regulation of signal transduction processes, which have been found to affect BC development in different ways depending on the expression of ER. We discuss the role of these signalling pathways in the development of Lyme disease in more detail. We filtered the pathways to obtain only those present 90% of the iterations performed by pathfindR.
The second Table 10 lists the pathways corresponding to those retrieved from the TSS1500 gene region with epimuted probes that showed significantly higher epimutation levels in ER -positive BC versus ER -negative BC due to hypomethylation. In this case, the common pathway is ESR-mediated signalling, a known pathway associated with the effects [20,21].

4. Discussion

Breast cancer (BC) is the most common tumour in women. It is a multifactorial disease with a high grade of heterogeneity often contributing to making breast cancer difficult to treat. Different methods of classification, such as immunohistochemical technique, molecular characteristic and gene expression have been used to frame this high heterogeneity in order to foresee the prognosis and to choose the best treatment options [22,23]. Immunohistochemically, BC can be classified by the expression of oestrogen receptors (ERs), progesterone receptors (PRs) and receptor tyrosine-protein kinase erbB-2 (HER2) [1,2,3]. The clinical guidelines for immunohistochemical (IHC) quantitation of steroid receptors in BC recommend that ER and PR assays be considered positive if at least one per cent of nuclei are stained [2]. Although the two groups of BC identified in this way (ER-positive/ER-negative) are not completely homogeneous, the two BC groups can be differentiated by biological characteristics and clinical behaviour [24]. It is noteworthy that the tumour ER expression is considered an element of high cellular differentiation and has a very important role in prognosis and therapy [3]. In fact, breast cancer prognosis progressively worsens in ER-negative subtypes due to their high aggressiveness, hormonal therapies insensitivity and chemoresistance and a subset of patients will progress to relapse after CT remission, which subsequently leads to metastasis. Furthermore, in patients with ER-positive BC, the relapses have molecular characteristics similar to those of ER-negative BC [24,25]. The underlying mechanisms of BC heterogeneity features and mechanisms that drive to therapy resistance (both hormonal and chemotherapeutic) are conundrums that have still to be completely solved and efforts have to be made in order to better understand the biology of BC and stratify patients to effective treatments [24].
In our study, we tried to characterise these two groups of breast cancers (ER-positive and negative) by applying an epigenetic score based on the identification of different epigenetic outliers (defined as epimutations). An epimutation, at a given CpG site, could be defined as an extreme outlier of DNA methylation value distribution across individuals [14]. Previous studies evaluated the presence of epigenetic outliers in BC but they compared BC tumour samples vs normal breast tissue or blood samples from BC patients vs control women without BC [14,15,27]. Teschendorff AE et al., [15] demonstrated that DNA methylation outliers in pre-neoplastic lesions define epigenetic field defects, marking cells which become enriched in invasive breast cancer and cervix cancer and which may therefore contribute casually to cancer progression. In another study, the same group highlights that the identification of outlier methylation profiles allows more reliable identification of risk-associated CpGs than statistics based on differences in mean methylation levels [27].

4.1. Cancer cells, epigenetic mechanisms and DNA methylation

Cancer cells acquire the ability to divide and grow uncontrollably [17]. Though it is well established that this could be due to both genomic and epigenetic alterations, the process through which cells acquire this characteristic is not completely understood [26]. Several studies have demonstrated the importance of epigenetic alterations in multiple aspects of cancer biology (tumour pathogenesis and immuno-modulation), cancer diagnosis and prognosis and, finally, treatment response and therapy resistance [26,28]. DNA methylation is one the most commonly occurring epigenetic events, in which there is the addition of a methyl group to the carbon 5-position of cytosine within a cytosine guanine (CpG) dinucleotide by enzyme DNA methyltransferase. DNA methylation can be stable and heritable through cell divisions but in the meanwhile, it is reversible and modifiable by specific enzymes [26]. Many studies report how breast cancer cells show disrupted methylation patterns in their DNA [24,29]. Moreover, DNA methylation pattern can be very specific not only for different types of tumours (inter-tumour heterogeneity) but also for different tumour subgroups (intra-tumour heterogeneity) and therefore has been used also to identify different cancer types and to trace the primary origin of metastatic tumours [26,29].
In general, global DNA hypomethylation has been associated with cancer. DNA hypomethylation can determine chromosomal instabilities and gene activation, thus leading to the upregulation or overexpression of proto-oncogenes, increased recombination and mutation rates [29]. Hypomethylation contributes to oncogenesis also by activation of latent retrotransposons or mobile DNA, such as long interspersed nuclear elements, that can determine disruption of expression of the adjacent gene, for example, homeobox [26].
DNA hypermethylation in cancer, instead, is associated with a direct gene repression effect (of tumour-suppressor genes, for example), but also with compaction of chromatin that in turn modifies its accessibility and, finally, determines instability and alteration of gene expression (silencing of DNA repair genes, for example) [29]. However, the inhibition or activation of transcription by methylation is dependent on the analyzed DNA gene’s segment (promoter, TSS or gene body).
DNA hypermethylation of promoters transcription start sites (TSS) or enhancers contributes to reducing gene expression or silencing by interfering with the binding of specific transcription factors to their recognition sites or by binding of transcriptional repressors specific for the methylated sequence [28]. Estecio and Issa [30] underlined that CpG island promoters are the most straightforward compartment to evaluate when searching for aberrant DNA methylation in cancer, above all considering that these CpG islands usually are unmethylated in normal cells (except for imprinted and X-chromosome inactivated genes). Therefore, they speculate that these abnormally methylated gene promoters (along with other regions with regulatory function) will likely reveal important players in tumour biology. They reported examples of promoter hypermethylation of the CDKN2A and MLH1 genes.
On the contrary, hypermethylation at gene bodies is associated with active transcription and gene expression, as a result of mRNA expression studies (as the case of homeobox) [26]. It has been suggested that the sliding of RNA polymerase over the gene body attracts DNA methyltransferase enzymes and therefore that DNA methylation in a gene body is a consequence of transcription, rather than an active agent promoting it. Others suggested that methylation marks embedded in coding sequences are associated with the timing of transcription initiation events [31]. Moreover, differences in CpG methylation between exon and intron regions raise the possibility that gene body methylation participates in splicing regulation [30]. Finally, the biological meaning of gene body methylation remains still unclear and more studies are needed to address this issue.
Methylate marks in intergenic regions are thought to have little impact on genome activity [31]. In this study, according to previous studies, we found the most important differences of epimutation score between the two groups of ER-positive and ER-negative breast cancer precisely in the promoters of specific genes belonging to few pathways.

4.2. Main pathways identified by our analysis

Pathway-centric analysis, as opposed to gene-centric one, allows to identify of recurrent altered signalling or function in cancer, based on alterations found in different genes belonging to the same pathway but not altered at equal frequencies [17]. Moreover, evaluating the burden of epimutations per gene region (TSS200, TSS1500, promoter, gene body and first exon) and then using these data for gene enrichment pathway analysis, permits to capture the biological process involved by these variations avoiding to treat individual occurrences of epigenetic marks like nucleotide polymorphisms (i.e., as epialleles), since it was observed that the methylation state of any particular nucleotide in the promoter, for example, is usually irrelevant and could represent statistically significant alterations but functionally uninformative differences [31].
The ESR-mediated signalling was identified as the pathway whose genes are overcharged by higher epimutation score due to hypomethylation of TSS1500 gene region (corresponding at least in part to promoter region) in ER-positive BC vs ER-negative BC. In light of the fact that a hypomethylated promoter could permit gene expression (even if it is not the unique condition), we interpreted this result as coherent with a higher activation of this pathway in the BC group that expresses ER. In this sense, previous studies centred on the role of epigenetic control of ER function, confirm our results. This is indirectly suggested by many studies that report higher hypermethylation status of ER-promoter in the group of ER-negative BC and that ER gene hypermethylation is associated with lacking ER gene expression [32,33,34,35]. Moreover, other studies confirm, for example, that inhibition of the DNA methyltransferase (DNMT) in ER-negative BC cells induces re-expression of oestrogen receptor-alpha [36,37].
The pathways identified by a higher epimutation score due to hypermethylation of the TSS1500 gene region in ER-positive BC vs. ER-negative BC belong to the following main groups: the Notch pathway, the SUMOylation pathway, the signalling and the ubiquitination protease signalling. Other studies confirm that, generally, the hypermethylated loci in ER-negative tumours were clustered closer to the transcriptional start site compared to ER-positive tumours[38] and that the cumulative effect of a very large number of epigenetic perturbations to be correlated specifically and in cis with hundreds of additional transcriptional changes [39].
Interestingly, the SUMOylation pathway and ubiquitination protease signalling belong to the same kind of protein post-translational modifications.
The data about the role of signalling in BC are few and contrasting. Todorović-Raković found that raised serum IFN- γ levels associate independently with favourable disease outcomes in hormonally dependent breast cancer [40]. On the other side, Yu and colleagues found that IFN- γ induces tumour resistance to anti-PD-1 immunotherapy in BC [41] and experiments on BC cells demonstrated that IFN- γ could up-regulate the expression of PD-L1, promote cell migration and transmission and facilitate the epithelial-mesenchymal transformation of breast cancer cells [42].
The SUMOylation and the Notch signalling are the other two pathways whose genes emerged as characterised by a higher epimutation score due to hypermethylation in the TSS1500 gene region in the ER-positive vs ER-negative BCs. Since we performed a direct comparison of the two BC groups, we hypothesized that the presence of a higher hypermethylation of the gene region that overlaps to the gene promoters, correspond to a general reduced gene expression (as discussed before) and, consequently, to a reduced activity of these two pathways in the ER-positive BCs. Moreover, based on the direct comparison between the two groups of BC, we speculated that the relative hypomethylation in the ER-negative BC and could justify the hypothesis of a presence of a state of hyper-activation of these two pathways in ER-negative BC. The presence of a significant activity of these two pathways in the ER-negative BC group does not lack as discussed thereafter [43].

4.3. About the role of SUMOylation and NOTCH pathways in ER-negative BC and their correlation with epithelial-mesenchymal transition (EMT) and breast cancer stem cells (BCSC)

Many studies suggest the existence of complex and intricate relations among the biological process of Epithelial to mesenchymal transition (EMT) and cancer stem cells (CSC) phenotype. The EMT is characterized by the acquisition of phenotypic plasticity and stem cell-like properties of the tumour cells, including cytoskeleton adjustment, loss of cell polarity and loss of cell adhesion. During EMT, cells lose their epithelial features and markers - like cobblestone shape and E-cadherin expression - to acquire a mesenchymal phenotype - assuming spindle shape and mesenchymal markers, like vimentin and fibronectin [23,44]. These mesenchymal attributes permit cancer cells to develop new capabilities, such as migratory and invasiveness, pro-survival ability, stemness, immunosuppression and chemoresistance [45]. These characteristics can lead to the formation of CSCs, maintenance of aggressiveness, initiation of metastasis, and tumour relapse [46].
CSCs have been identified for the first time in 2003 in human breast tumours (BCSCs) and since then a growing number of evidence has supported their role in breast cancer initiation, intratumoral heterogeneity, progression, disease recurrence, metastasis and resistance to therapy [47]. Actually, it is not clear the origin of CSC. In particular, the two main hypotheses are that they are cells already present in the tumour since its origin but in a state of quiescence or, in alternative, that they originate in a second moment through a process of de-differentiation (for example, through a process of partial/total EMT). Finding a set of markers to identify and target these partial/total EMT cells could lead to understanding the origin of CSCs and their deregulated pathways and could be a strategy for therapeutics development blocking cancer invasion and dissemination [45].
The EMT and the CSC have been correlated to alterations of NOTCH and SUMOylation pathway in ER-negative BC in many studies [23,47,58,59,60,61].
Numerous studies found that the Notch signalling activation and protein SUMOylation may promote breast cancer tumorigenesis and progression by accelerating cell cycle transition and proliferation and facilitating tumor cell EMT in breast epithelial cells in vivo and in vitro [23,47,58,59,60,61,70].
Notch1 knockdown in breast cancer cells suppressed the EMT process, tumour growth, migration, and invasion using in vitro and in vivo models. Jagged1-mediated Notch signalling activation was able to activate the EMT process and increase migration and invasion in breast cancer mainly through upregulation of N1ICD. Notch1 signalling is able to reverse the epithelial cobblestone morphology cells to the spindle mesenchymal one, to induce switching of epithelial markers like E-cadherin by the up-regulation of SNAIL, SIP1/ZEB2 and SLUG (which are E-cadherin direct transcriptional repressors) and the acquisition of mesenchymal markers such as vimentin, N-cadherin and fibronectin to reduce invasion and migration [47,59,60,61]. On the contrary, activation of Notch signalling can be suppressed by EMT-inhibiting microRNAs such as miR-34 and miR-200 [60] The role of Notch signalling in EMT corresponds to its promotion of invasive and metastatic phenotypes. Activation of Notch signalling in non-invasive breast cancer cells promotes cell invasion and migration, while inhibition of Notch in invasive cells reduces their invasive and migratory capacity [47,59,60,61]and Notch signalling is correlated with metastasis in vivo [62].
On the same way, SUMOylation participates directly in modifications of many transcription factors (TFs) and in activation of various signalling involved in the control of EMT [23,44]. Several transcriptional factors activity - including ZEB1, SNAIL and TWIST - that regulate mesenchymal cell marker expression, such as CDH1 (the E-cadherin gene) and promote EMT - is directly or indirectly influenced by SUMOylation pathway. ZEB1, one of the main TFs involved in EMT, has been reported to be regulated by SUMOylation through different mechanisms. SUMOylation of ZEB1, as well as its homologue ZEB2, inhibits E-cadherin expression and induces EMT. Moreover, silencing of SENP1 (which has also the function of peptidase that causes hydrolysis of SUMO bonds) decreases ZEB1 protein level, suggesting that deSUMOylation of ZEB has a role in activating the TF [44]. By regulating numerous oncoproteins, ZEB1 plays an important role in metastasis. In the ER-negative basal-like breast cancer (BLBC), a breast cancer subtype enriched with expression of mesenchymal genes and reduced expression of epithelial ones including E-cadherin [73], downregulation of CDH1 is mediated by ZEB1, which recruits DNMT1 (a DNA metil-transferase enzyme) to the CDH1 promoter to maintain the methylation status in the promoter. These results suggest that ZEB1 could act as a transcriptional repressor and an epigenetic modulator to induce EMT in breast cancer [72]. A recent study demonstrates that also ZNF451, a SUMO2/3-specific E3 ligase, is a positive regulator of EMT through the SUMOylation of TWIST2 at the K129 residue. SUMOylation stabilizes TWIST2 by inhibiting its ubiquitination and degradation, and, consequently, promotes EMT [44]. Two prominent mesenchymal transcription factors, Slug and Twist1, are up-regulated in cells that present mesenchymal characteristics. Expression levels of Slug and Twist1 are highest in ER-negative claudin-low tumors and both genes identify letrozole-resistant disease. Slug accumulation in basal-like tumours is also associated with BRCA1 mutations [63]
Moreover, a direct correlation between aberrant Notch and SUMOylation pathway and the triple negative phenotype BC has been found in many studies.
Notch signalling has been seen hyperactivated in TNBC and in ER-positive BC with poor prognosis or with a higher risk of relapse (which have many features in common with ER-negative BC). It was suggested that this hyperactivation could have an important role in EMT induction and BCSCs proliferation in TNBC [24], while in ER-positive BC could induce hormone-therapy resistance [64]. Clinical analyses showed that JAG1 as well as NOTCH1, NOTCH3, and NOTCH4 are overexpressed at high levels in TNBC and correlated with the aggressive, metastatic and therapy resistance phenotype characteristic of TNBC and are associated with poor clinical prognosis. Moreover, expression of the Notch target, HES4, was correlated with poor prognosis outcomes in TNBC patients [59]. Reedijk and colleague [64] observed that patients with tumours expressing high levels of JAG1 or NOTCH1 had a significantly poorer overall survival compared with patients expressing low levels of these genes and moreover, a synergistic effect of high-level JAG1 and high-level NOTCH1 coexpression on overall survival was observed. Therefore, they suggest a mechanism whereby Notch is activated in aggressive and poor prognosis breast tumours (since JAG1 is a ligand of Notch-receptor-1) and that the basal breast cancer subgroup (belonging to ER-negative BC) shows poor overall survival as a result of JAG1-induced Notch activation in some of these tumours [65] performed exome sequencing analysis to identify Notch mutations in various solid tumours, revealing that constitutive receptor activation induced by NOTCH1 and NOTCH2 mutations is limited to TNBC. A TNBC cell line with NOTCH1 rearrangement also exhibited high-level N1ICD (notch-1 intracellular domain) accumulation with subsequent upregulated target gene expression. In addition, NOTCH1 or NOTCH2 mutations can synergistically act with EZH2 to inhibit the tumour suppressor PTEN transcription at the promoter in TNBC [66].
In a gene expression study, Orzechowska M. and colleagues evaluate [67] the effect of differential expression of Notch members on DF) in luminal type A (lumA) and triple-negative (TN) BC. This study highlights significant differences in the biology of the two tumours and indicates differences in the signals activating the Notch pathway and particularly suggests a role of Notch signalling in BRCA progression through triggering EMT. From their analysis emerges that aberrant expression and regulation of Notch receptors have the most significant influence on the course of the disease. Notably, their results indicate that while there are subgroups of patients who will probably never experience disease relapse, other subgroups exist within the ER-positive lumA subtype which have a higher risk of recurrence due to potential transition into mesenchymal cell type. Moreover, their findings indicate that the expression profiles of Notch pathway members can be used to differentiate the DFS in lumA and TNBC subtypes, and so may serve as novel prognostic biomarkers. Finally, they highlight that MMP11, TAGLN and THB2, three genes involved in acquiring mesenchymal phenotype and which are regulated by the Notch pathway, can be used as potential therapeutic targets.
On the other hand, also the SUMOylation pathway seems to be involved in the maintenance of the characteristic of TNBC and basal BC subtype (belonging to the ER-negative BC group). Bogacheck and colleagues demonstrated that inhibition of the SUMOylation pathway reduced cell invasiveness and induced functional loss of CSCs in basal BC [75]. Moreover, the same group in another study [58] established that SUMOylation inhibitors induce a basal-to-luminal transition in BC cells and inhibit tumour outgrowth of basal cancer xenografts. Wang Q and colleagues reached similar conclusions about the relation of SUMOylation and ER-negative BC, evaluating the role of SUMO1-activating enzyme subunti1 (SAE1), an E1-ligase-activating enzyme, indispensable for protein SUMOylation in TNBC. They found that mRNA and protein SAE1 expression is increased in TNBC tissues compared to adjacent normal tissue and their expression levels are significantly associated with overall survival (OS) and disease-free survival (DFS) [74]. In the review by Zhu et al., the multiple ways through which the SUMOylation pathway can influence stem cell functions in cancer are recapitulated [76].
Finally, we discuss the role of epigenetic control on Notch and SUMOylation pathways. Interestingly, DNA methylation has been confirmed to have an important role in the regulation of Notch and SUMOylation pathways. Yousefi and colleagues, using the TCGA HumanMethylation450 Array data, determined that the epigenetic regulation of the Notch regulators contributes to their expression and suggested that Notch receptors and ligands expression is generally associated with the tumour subtype, grade, and stage [68]. Aithal et al., focus on the methylation status of genes in the Notch signalling pathway from various cancers and highlight how this epigenetic alteration can be used as a biomarker for cancer diagnosis and subsequent treatment [69]. Accordingly, to the important role of epigenetic reprogramming and DNA methylation, Hanif and colleagues highlight how these processes could be determinant specifically in TNBC in which we have seen that the Notch pathway could play fundamental regulatory functions [24]. Finally, Kagara et al demonstrated that methylation is a significant mechanism regulating CD44, CD133, and Musashi-1 which are specific BCSC-related genes and that the hypomethylation of these genes correlates with a significant inverse correlation of mRNA expression in TNBC subtype [71].
We want also discuss the limits of our study. First and foremost, for one dataset (GSE69914) the patients’ age and tumour stadiation were not available; therefore, age was inferred through methylation data, while tumour stadiation was omitted in the analysis of that dataset. Second, we introduce an epimutation score based on quantile ranking of the difference in the methylation levels; this is a new method of analysis that need to be validated with other studies. Finally, in the discussion we interpreted the results of hypomehtilatyion of the genes of ESR-mediated signaling in ER-positive BC as corresponding to an higher expression of the genes in this group of BC. Yet, we know that this condition of hypomethylation is not sufficient to draw this conclusion. An analogous consideration could be drawn when we considered hypermethylation promoter of genes belonging to Notch and SUMOyaltion pathways in the ER-positive BC. In this case, we concluded that the hypermethylation in the ER-positive BC corresponded to a reduced mehtylation in ER-negative BC (since we perfomed a direct comparison of methylation data between these two groups of BCs); we considered this condition potentially correlated to a higher expression of these genes in this group of ER-negative BC. We know that these are only indirect hypotheses that need to be confirmed.
Funding

“This research received no external funding”

Data Availability Statement

The used data set are available through: [80,81]

Acknowledgments

In this section you can acknowledge any support given which is not covered by the author contribution or funding sections. This may include administrative and technical support, or donations in kind (e.g., materials used for experiments).

Conflicts of Interest

“The authors declare no conflict of interest.”

Sample Availability

Data are available from the respective web site GSE69914 [81], TGCA-BRCA and TCGA-BRCA-27k [80]

Abbreviations

The following abbreviations are used in this manuscript:
BC Breast Cancer
ER Oestrogen Receptor
DFS Disease Free Survival
OS Overall Survival
TNBC Triple Negative Breast Cancer
CSC Cancer Stem Cell

Appendix A

Table A1. This is a table caption.
File Name Description
PATHWAYS.csv List of all pathways found with pathfindR

References

  1. Eswaran, J. , et al. (2012). "Transcriptomic landscape of breast cancers through mRNA sequencing." Scientific Reports 2(1). [CrossRef]
  2. Hammond ME, Hayes DF, Dowsett M, Allred DC, Hagerty KL, Badve S, Fitzgibbons PL, Francis G, Goldstein NS, Hayes M, et al. American Society of Clinical Oncology/College of American Pathologists guideline recommendations for immunohistochemical testing of estrogen and progesterone receptors in breast cancer (unabridged version). Arch Pathol Lab Med. 2010 Jul;134(7):e48-72. [CrossRef] [PubMed]
  3. Zhang MH, Man HT, Zhao XD, Dong N, Ma SL. Estrogen receptor-positive breast cancer molecular signatures and therapeutic potentials (Review). Biomed Rep. 2014 Jan;2(1):41-52. [CrossRef] [PubMed]
  4. Gentilini, D. , et al. (2017). "Epigenome-wide association study in hepatocellular carcinoma: Identification of stochastic epigenetic mutations through an innovative statistical approach." Oncotarget 8(26): 41890-41902. [CrossRef]
  5. De Ruijter, T. C. , et al. (2020). "Prognostic DNA methylation markers for hormone receptor breast cancer: a systematic review." Breast Cancer Research 22(1). [CrossRef]
  6. Ruscito, I. , et al. (2021). "The Clinical and Pathological Profile of BRCA1 Gene Methylated Breast Cancer Women: A Meta-Analysis." Cancers 13(6): 1391. [CrossRef]
  7. Ennour-Idrissi, K. , Dragic, D., Durocher, F. et al. Epigenome-wide DNA methylation and risk of breast cancer: a systematic review. BMC Cancer 20, 1048 (2020). doi.org/10. 1186. [Google Scholar] [CrossRef]
  8. Vietri MT, D’Elia G, Benincasa G, Ferraro G, Caliendo G, Nicoletti GF, Napoli C. DNA methylation and breast cancer: A way forward (Review). Int J Oncol. 2021 Nov;59(5):98. [CrossRef] [PubMed]
  9. Johnson KC, Houseman EA, King JE, Christensen BC. Normal breast tissue DNA methylation differences at regulatory elements are associated with the cancer risk factor age. Breast Cancer Res. 2017 Jul 10;19(1):81. [CrossRef] [PubMed]
  10. Johnson KC, Koestler DC, Fleischer T, Chen P, Jenson EG, Marotti JD, Onega T, Kristensen VN, Christensen BC. DNA methylation in ductal carcinoma in situ related with future development of invasive breast cancer. Clin Epigenetics. 2015 Jul 25;7(1):75. [CrossRef] [PubMed]
  11. Gao, Y. , Widschwendter, M., Teschendorff, A.E., 2018. DNA Methylation Patterns in Normal Tissue Correlate more Strongly with Breast Cancer Status than Copy-Number Variants. eBioMedicine 31, 243–252.. doi.org/10.1016/j.ebiom.2018.04. [CrossRef]
  12. Panjarian S, Madzo J, Keith K, Slater CM, Sapienza C, Jelinek J, Issa JJ. Accelerated aging in normal breast tissue of women with breast cancer. Breast Cancer Res. 2021 ;23(1):58. [CrossRef] [PubMed]
  13. Teschendorff, A. E. , et al. (2016). "DNA methylation outliers in normal breast tissue identify field defects that are enriched in cancer." Nat Commun 7: 10478. [CrossRef]
  14. Gagliardi A, Dugué PA, Nøst TH, Southey MC, Buchanan DD, Schmidt DF, Makalic E, Hodge AM, English DR, Doo NW, et al. Stochastic Epigenetic Mutations Are Associated with Risk of Breast Cancer, Lung Cancer, and Mature B-cell Neoplasms. Cancer Epidemiol Biomarkers Prev. 2020 Oct;29(10):2026-2037. [CrossRef] [PubMed]
  15. Teschendorff, A. E. , et al. (2016). "Stochastic epigenetic outliers can define field defects in cancer." BMC Bioinformatics 17: 178. [CrossRef]
  16. Gentilini, D. , et al. (2017). "Epigenome-wide association study in hepatocellular carcinoma: Identification of stochastic epigenetic mutations through an innovative statistical approach." Oncotarget 8(26): 41890-41902. [CrossRef]
  17. Sanchez-Vega, F. , et al. (2018). "Oncogenic signalling Pathways in The Cancer Genome Atlas." Cell 173(2): 321-337.e310. [CrossRef]
  18. Eroles, P. , et al. (2012). "Molecular biology in breast cancer: intrinsic subtypes and signalling pathways." Cancer Treat Rev 38(6): 698-707. [CrossRef]
  19. van Barele M, Heemskerk-Gerritsen BAM, Louwers YV, Vastbinder MB, Martens JWM, Hooning MJ, Jager A. Estrogens and Progestogens in Triple Negative Breast Cancer: Do They Harm? Cancers (Basel). 2021 ;13(11):2506. [CrossRef] [PubMed]
  20. Hah N, Kraus WL. Hormone-regulated transcriptomes: lessons learned from estrogen signalling pathways in breast cancer cells. Mol Cell Endocrinol. 2014 Jan 25;382(1):652-664. [CrossRef] [PubMed]
  21. Arnal JF, Lenfant F, Metivier R, Flouriot G, Henrion D, Adlanmerini M, Fontaine C, Gourdy P, Chambon P, Katzenellenbogen B, Katzenellenbogen J. Membrane and Nuclear Estrogen Receptor Alpha Actions: From Tissue Specificity to Medical Implications. Physiol Rev. 2017 Jul 1;97(3):1045-1087. [CrossRef] [PubMed]
  22. Orzechowska, M. , et al. (2016). "Common profiles of Notch signalling differentiate disease-free survival in luminal type A and triple negative breast cancer." Oncotarget 8(4): 6013-6032. [CrossRef]
  23. Rabellino A, Khanna KK. The implication of the SUMOylation pathway in breast cancer pathogenesis and treatment. Crit Rev Biochem Mol Biol. 2020 Feb;55(1):54-70. [CrossRef] [PubMed]
  24. Mohamad Hanif EA, Shah SA. Overview on Epigenetic Re-programming: A Potential Therapeutic Intervention in Triple Negative Breast Cancers. Asian Pac J Cancer Prev. 2018 Dec 25;19(12):3341-3351. [CrossRef] [PubMed]
  25. Sleightholm R, Neilsen BK, Elkhatib S, Flores L, Dukkipati S, Zhao R, Choudhury S, Gardner B, Carmichael J, Smith L, Bennion N, Wahl A, Baine M. Percentage of Hormone Receptor Positivity in Breast Cancer Provides Prognostic Value: A Single-Institute Study. J Clin Med Res. 2021 Jan;13(1):9-19. [CrossRef] [PubMed]
  26. Russo, G. , et al. (2021). "Epigenome Chaos: Stochastic and Deterministic DNA Methylation Events Drive Cancer Evolution." Cancers (Basel) 13(8). [CrossRef]
  27. Teschendorff, A.E. , Jones, A., Fiegl, H. et al. Epigenetic variability in cells of normal cytology is associated with the risk of future morphological transformation. Genome Med 4, 24 (2012). [CrossRef]
  28. Melanie Ehrlich (2019) DNA hypermethylation in disease: mechanisms and clinical relevance, Epigenetics, 14:12, 1141-1163. [CrossRef]
  29. Jovanovic, J. , et al. (2010). "The epigenetics of breast cancer." Molecular Oncology 4(3): 242-254. [CrossRef]
  30. Estécio MR, Issa JP. Dissecting DNA hypermethylation in cancer. FEBS Lett. 2011 Jul 7;585(13):2078-86. [CrossRef] [PubMed]
  31. Adrian-Kalchhauser I, Sultan SE, Shama LNS, Spence-Jones H, Tiso S, Keller Valsecchi CI, Weissing FJ. Understanding ’Non-genetic’ Inheritance: Insights from Molecular-Evolutionary Crosstalk. Trends Ecol Evol. 2020 Dec;35(12):1078-1089. [CrossRef] [PubMed]
  32. Giacinti L, Claudio PP, Lopez M, Giordano A. Epigenetic information and estrogen receptor alpha expression in breast cancer. Oncologist. 2006 Jan;11(1):1-8. [CrossRef] [PubMed]
  33. Ferguson AT, Lapidus RG, Baylin SB, Davidson NE. Demethylation of the estrogen receptor gene in estrogen receptor-negative breast cancer cells can reactivate estrogen receptor gene expression. Cancer Res. 1995 Jun 1;55(11):2279-83. [PubMed]
  34. Lapidus RG, Ferguson AT, Ottaviano YL, Parl FF, Smith HS, Weitzman SA, Baylin SB, Issa JP, Davidson NE. Methylation of estrogen and progesterone receptor gene 5’ CpG islands correlates with lack of estrogen and progesterone receptor gene expression in breast tumours. Clin Cancer Res. 1996 May;2(5):805-10. [PubMed]
  35. Mirza S, Sharma G, Prasad CP, Parshad R, Srivastava A, Gupta SD, Ralhan R. Promoter hypermethylation of TMS1, BRCA1, ERalpha and PRB in serum and tumour DNA of invasive ductal breast carcinoma patients. Life Sci. 2007 Jul 4;81(4):280-7. [CrossRef] [PubMed]
  36. Yan L, Nass SJ, Smith D, Nelson WG, Herman JG, Davidson NE. Specific inhibition of DNMT1 by antisense oligonucleotides induces re-expression of estrogen receptor-alpha (ER) in ER-negative human breast cancer cell lines. Cancer Biol Ther. 2003 Sep-Oct;2(5):552-6. [CrossRef] [PubMed]
  37. Yang X, Phillips DL, Ferguson AT, Nelson WG, Herman JG, Davidson NE. Synergistic activation of functional estrogen receptor (ER)-alpha by DNA methyltransferase and histone deacetylase inhibition in human ER-alpha-negative breast cancer cells. Cancer Res. 2001 Oct 1;61(19):7025-9. [PubMed]
  38. Fackler, M.J. , Umbricht, C.B., Williams, D., Argani, P., Cruz, L.-A., Merino, V.F., Teo, W.W., Zhang, Z., Huang, P., Visvananthan, K., Marks, J., Ethier, S., Gray, J.W., Wolff, A.C., Cope, L.M., Sukumar, S., 2011. Genome-wide Methylation Analysis Identifies Genes Specific to Breast Cancer Hormone Receptor Status and Risk of Recurrence. Cancer Research 71, 6195–6207. 1630. [Google Scholar] [CrossRef]
  39. Batra, R.N. , Lifshitz, A., Vidakovic, A.T., Chin, S.-F., Sati-Batra, A., Sammut, S.-J., Provenzano, E., Ali, H.R., Dariush, A., Bruna, A., Murphy, L., Purushotham, A., Ellis, I., Green, A., Garrett-Bakelman, F.E., Mason, C., Melnick, A., Aparicio, S.A.J.R., Rueda, O.M., Tanay, A., Caldas, C., 2021. DNA methylation landscapes of 1538 breast cancers reveal a replication-linked clock, epigenomic instability and cis-regulation. Nature Communications 12. [CrossRef]
  40. Todorović-Raković N, Milovanović J, Greenman J, Radulovic M. The prognostic significance of serum interferon-γ (IFN-γ) in hormonally dependent breast cancer. Cytokine. 2022 Apr;152:155836. [CrossRef] [PubMed]
  41. Yu M, Peng Z, Qin M, Liu Y, Wang J, Zhang C, Lin J, Dong T, Wang L, Li S, Yang Y, Xu S, Guo W, Zhang X, Shi M, Peng H, Luo X, Zhang H, Zhang L, Li Y, Yang XP, Sun S. Interferon-γ induces tumour resistance to anti-PD-1 immunotherapy by promoting YAP phase separation. Mol Cell. 2021 Mar 18;81(6):1216-1230.e9. [CrossRef] [PubMed]
  42. Yan Y, Zhao C, Yang R, Zhou T, Xu N. [IFN-γ induces overexpression of PD-L1 and epithelialmesenchymal transformation of breast cancer cells through activating ERK/Jak2-STAT signalling pathways]. Sheng Wu Gong Cheng Xue Bao. 2018 Dec 25;34(12):2007-2015. Chinese. [CrossRef] [PubMed]
  43. Miao, K. , Lei, J.H., Valecha, M.V. et al. NOTCH1 activation compensates BRCA1 deficiency and promotes triple-negative breast cancer formation. Nat Commun 11, 3256 (2020). [CrossRef]
  44. Gomarasca, M. , et al. (2022). "SUMOylation and NEDDylation in Primary and Metastatic Cancers to Bone." Front Cell Dev Biol 10: 889002. [CrossRef]
  45. Laia Caja, E-Jean Tan, Epithelium to Mesenchyme Transition, Editor(s): Paolo Boffetta, Pierre Hainaut, Encyclopedia of Cancer (Third Edition), Academic Press, 2019, Pages 14-23, ISBN 9780128124857. [CrossRef]
  46. Pourmahdi, M. , et al. (2021). "Key Epigenetic Events Involved in the Maintenance of Breast Cancer Stem Cells." Curr Stem Cell Res Ther 16(7): 877-887. [CrossRef]
  47. Zhang, X. , et al. (2015). "Notch1 induces epithelial-mesenchymal transition and the cancer stem cell phenotype in breast cancer cells and STAT3 plays a key role." International Journal of Oncology 46(3): 1141-1148. [CrossRef]
  48. Benjamini, Y. and Hochberg, Y. (1995), Controlling the False Discovery Rate: A Practical and Powerful Approach to Multiple Testing. Journal of the Royal Statistical Society: Series B (Methodological), 57: 289-300. [CrossRef]
  49. Geraci, M. (2014). Linear Quantile Mixed Models: The lqmm Package for Laplace Quantile Regression. Journal of Statistical Software, 57(13), 1–29. [CrossRef]
  50. Tian Y, Morris TJ, Webster AP, Yang Z, Beck S, Andrew F, Teschendorff AE (2017). “ChAMP: updated methylation analysis pipeline for Illumina BeadChips.” Bioinformatics, btx513. [CrossRef]
  51. Zheng SC, Breeze CE, Beck S, Teschendorff AE (2018). “Identification of differentially methylated cell-types in Epigenome-Wide Association Studies.” Nature Methods, 15(12), 1059. [CrossRef]
  52. Morgan M, Davis S (2023). GenomicDataCommons: NIH / NCI Genomic Data Commons Access.
  53. Davis S, Meltzer P (2007). “GEOquery: a bridge between the Gene Expression Omnibus (GEO) and BioConductor.” Bioinformatics, 14, 1846–1847. [CrossRef]
  54. Barrett T, Wilhite SE, Ledoux P, Evangelista C, Kim IF, Tomashevsky M, Marshall KA, Phillippy KH, Sherman PM, Holko M, Yefanov A, Lee H, Zhang N, Robertson CL, Serova N, Davis S, Soboleva A. NCBI GEO: archive for functional genomics data sets–update. Nucleic Acids Res. 2013 Jan;41(Database issue):D991-5. [CrossRef]
  55. Du, P. , Zhang, X., Huang, CC. et al. Comparison of Beta-value and M-value methods for quantifying methylation levels by microarray analysis. BMC Bioinformatics 11, 587 (2010). 1186. [Google Scholar] [CrossRef]
  56. Du, P. , Kibbe, W.A., Lin, S.M. (2008). “lumi: a pipeline for processing Illumina microarray.” Bioinformatics. [CrossRef]
  57. Ulgen E, Ozisik O, Sezerman OU (2019). “pathfindR: An R Package for Comprehensive Identification of Enriched Pathways in Omics Data Through Active Subnetworks.” Frontiers in Genetics, 10, 858. [CrossRef]
  58. Bogachek MV, Chen Y, Kulak MV, Woodfield GW, Cyr AR, Park JM, Spanheimer PM, Li Y, Li T, Weigel RJ. Sumoylation pathway is required to maintain the basal breast cancer subtype. Cancer Cell. 2014 Jun 16;25(6):748-61. [CrossRef] [PubMed]
  59. Giuli MV, Giuliani E, Screpanti I, Bellavia D, Checquolo S. Notch Signaling Activation as a Hallmark for Triple-Negative Breast Cancer Subtype. J Oncol. 2019 Jul 11;2019:8707053. [CrossRef] [PubMed]
  60. Bocci F, Onuchic JN, Jolly MK. Understanding the Principles of Pattern Formation Driven by Notch Signaling by Integrating Experiments and Theoretical Models. Front Physiol. 2020 Jul 31;11:929. [CrossRef] [PubMed]
  61. Shao S, Zhao X, Zhang X, Luo M, Zuo X, Huang S, Wang Y, Gu S, Zhao X. Notch1 signaling regulates the epithelial-mesenchymal transition and invasion of breast cancer in a Slug-dependent manner. Mol Cancer. 2015 Feb 3;14(1):28. [CrossRef] [PubMed]
  62. Kontomanolis EN, Kalagasidou S, Pouliliou S, Anthoulaki X, Georgiou N, Papamanolis V, Fasoulakis ZN. The Notch Pathway in Breast Cancer Progression. ScientificWorldJournal. 2018 Jul 8;2018:2415489. [CrossRef] [PubMed]
  63. Haughian JM, Pinto MP, Harrell JC, Bliesner BS, Joensuu KM, Dye WW, Sartorius CA, Tan AC, Heikkilä P, Perou CM, Horwitz KB. Maintenance of hormone responsiveness in luminal breast cancers by suppression of Notch. Proc Natl Acad Sci U S A. 2012 Feb 21;109(8):2742-7. [CrossRef] [PubMed]
  64. Reedijk M, Odorcic S, Chang L, Zhang H, Miller N, McCready DR, Lockwood G, Egan SE. High-level coexpression of JAG1 and NOTCH1 is observed in human breast cancer and is associated with poor overall survival. Cancer Res. 2005 Sep 15;65(18):8530-7. [CrossRef] [PubMed]
  65. Stoeck A, Lejnine S, Truong A, Pan L, Wang H, Zang C, Yuan J, Ware C, MacLean J, Garrett-Engele PW, et al. Discovery of biomarkers predictive of GSI response in triple-negative breast cancer and adenoid cystic carcinoma. Cancer Discov. 2014 Oct;4(10):1154-67. [CrossRef] [PubMed]
  66. Pappas K, Martin TC, Wolfe AL, Nguyen CB, Su T, Jin J, Hibshoosh H, Parsons R. NOTCH and EZH2 collaborate to repress PTEN expression in breast cancer. Commun Biol. 2021 Mar 9;4(1):312. [CrossRef] [PubMed]
  67. Orzechowska M, Jędroszka D, Bednarek AK. Common profiles of Notch signaling differentiate disease-free survival in luminal type A and triple negative breast cancer. Oncotarget. 2017 Jan 24;8(4):6013-6032. [CrossRef] [PubMed]
  68. Yousefi H, Bahramy A, Zafari N, Delavar MR, Nguyen K, Haghi A, Kandelouei T, Vittori C, Jazireian P, Maleki S, Imani D, Moshksar A, Bitaraf A, Babashah S. Notch signaling pathway: a comprehensive prognostic and gene expression profile analysis in breast cancer. BMC Cancer. 2022 Dec 7;22(1):1282. [CrossRef] [PubMed]
  69. Aithal MG, Rajeswari N. Role of Notch signalling pathway in cancer and its association with DNA methylation. J Genet. 2013 Dec;92(3):667-75. [CrossRef] [PubMed]
  70. Liu, J. , et al. (2022). "Unconventional protein post-translational modifications: the helmsmen in breast cancer." Cell Biosci 12(1): 22. [CrossRef]
  71. Kagara N, Huynh KT, Kuo C, Okano H, Sim MS, Elashoff D, Chong K, Giuliano AE, Hoon DS. Epigenetic regulation of cancer stem cell genes in triple-negative breast cancer. Am J Pathol. 2012 Jul;181(1):257-67. [CrossRef] [PubMed]
  72. Serrano-Gomez, S. J. , et al. (2016). "Regulation of epithelial-mesenchymal transition through epigenetic and post-translational modifications." Mol Cancer 15: 18. [CrossRef]
  73. Sarrio, D. , et al. (2008). "Epithelial-mesenchymal transition in breast cancer relates to the basal-like phenotype." Cancer Res 68(4): 989-997. [CrossRef]
  74. Wang Q, Zhong W, Deng L, Lin Q, Lin Y, Liu H, Xu L, Lu L, Chen Y, Huang J, Jiang M, Xiao H, Zhang J, Li H, Lin Y, Song C, Lin Y. The Expression and Prognostic Value of SUMO1-Activating Enzyme Subunit 1 and Its Potential Mechanism in Triple-Negative Breast Cancer. Front Cell Dev Biol. 2021 Sep 21;9:729211. [CrossRef] [PubMed]
  75. Bogachek MV, Park JM, De Andrade JP, Lorenzen AW, Kulak MV, White JR, Gu VW, Wu VT, Weigel RJ. Inhibiting the SUMO Pathway Represses the Cancer Stem Cell Population in Breast and Colorectal Carcinomas. Stem Cell Reports. 2016 Dec 13;7(6):1140-1151. [CrossRef] [PubMed]
  76. Zhu Q, Liang P, Chu C, Zhang A, Zhou W. Protein sumoylation in normal and cancer stem cells. Front Mol Biosci. 2022 Dec 19;9:1095142. [CrossRef] [PubMed]
  77. Available online: www.cancer.net (accessed on 14 April 2023).
  78. Available online: https://emea.support.illumina.com/downloads/infinium_humanmethylation450_product_files.html.
  79. Available online: https://www.github.com/drake69/semseeker.
  80. Available online: https://portal.gdc.cancer.gov/projects/TCGA-BRCA.
  81. Available online: https://www.ncbi.nlm.nih.gov/geo/query/acc.cgi?acc=GSE69914.
Table 1. Characteristics of the three datasets used for our analysis.
Dataset name Number of samples Age available Technology Format Number of probes (% of total)
TCGA-BRCA [80] 521 Yes Human Methylation 450 RAW (idat files) 385578 (79,41%)
TCGA-BRCA-27K [80] 180 Yes Human Methylation 27 RAW (idat files) 25522 (92,54%)
GSE69914 [81] 302 No Human Methylation 450 TXT (beta-values matrix) 290250 (59,78%)
Table 2. The clinical characteristics of the patients and the tumour samlples of the three data sets used for our analysis.
Dataset Age (std) Stage I Stage II Stage III Stage IV ER+ ER- n (patients)
TCGA-BRCA 57.65 (12.74) 91 (17%) 281 (54%) 145 (28%) 4 (0.77%) 426 (82%) 95 (18%) 521 (52%)
GSE69914 49.93 (5.62) - - - - 254 (84%) 48 (16%) 302 (30%)
TCGA-BRCA-27k 59.19 (13.11) 46 (26%) 107 (59%) 20 (11%) 7 (3.89%) 140 (78%) 40 (22%) 180 (18%)
Table 6. Pathways HYPER shared for dataset GSE69914 on TSS1500 gene area.
Description Regression Beta Genes with increased burden Genes with decreased burden
SUMOylation of transcription factors 6.33 PIAS1
RHOJ GTPase cycle 4.60 CAV1, DEPDC1B
Constitutive Signaling by NOTCH1 HD+PEST Domain Mutants 4.36 HEY2, PSEN1
Constitutive Signaling by NOTCH1 PEST Domain Mutants 4.36 HEY2, PSEN1
Signaling by NOTCH1 HD+PEST Domain Mutants in Cancer 4.36 HEY2, PSEN1
Signaling by NOTCH1 PEST Domain Mutants in Cancer 4.36 HEY2, PSEN1
Signaling by NOTCH1 in Cancer 4.36 HEY2, PSEN1
RHOQ GTPase cycle 4.29 CAV1, DEPDC1B
RHOG GTPase cycle 3.52 CAV1, DEPDC1B
Signaling by NOTCH1 3.42 HEY2, PSEN1
RAC2 GTPase cycle 2.94 CAV1, DEPDC1B
RAC3 GTPase cycle 2.75 CAV1, DEPDC1B
SUMO E3 ligases SUMOylate target proteins 2.32 DDX17, PIAS1 RARA
SUMOylation 2.23 DDX17, PIAS1 RARA
Table 7. Pathways HYPER shared for dataset TCGA-BRCA 27k on TSS1500 gene area.
Description Regression Beta Genes with increased burden Genes with decreased burden
SUMOylation of transcription factors 5.93 TFAP2C TFAP2B
RHOQ GTPase cycle 5.02 CDC42BPA, CDC42EP3, OBSCN, SYDE1 PREX1
Constitutive Signaling by NOTCH1 HD+PEST Domain Mutants 4.09 HDAC1, HDAC3, HDAC9, JAG2
Constitutive Signaling by NOTCH1 PEST Domain Mutants 4.09 HDAC1, HDAC3, HDAC9, JAG2
Signaling by NOTCH1 HD+PEST Domain Mutants in Cancer 4.09 HDAC1, HDAC3, HDAC9, JAG2
Signaling by NOTCH1 PEST Domain Mutants in Cancer 4.09 HDAC1, HDAC3, HDAC9, JAG2
Signaling by NOTCH1 in Cancer 4.09 HDAC1, HDAC3, HDAC9, JAG2
RHOG GTPase cycle 3.29 ARHGDIG, DOCK3, EPHA2 PREX1
RHOJ GTPase cycle 3.23 CDC42BPA, SYDE1 PREX1
Signaling by NOTCH1 3.20 HDAC1, HDAC3, HDAC9, JAG2
RAC2 GTPase cycle 2.76 DOCK3, EPHA2, SYDE1 PREX1
RAC3 GTPase cycle 2.58 EPHA2, NOX1, SYDE1 PREX1
SUMO E3 ligases SUMOylate target proteins 2.17 CTBP1, HDAC1, L3MBTL2, TFAP2C DNMT3B, TFAP2B
SUMOylation 2.09 CTBP1, HDAC1, L3MBTL2, TFAP2C DNMT3B, TFAP2B
Table 8. Pathways HYPER shared for dataset TCGA-BRCA on TSS1500 gene area.
Description Regression Beta Genes with increased burden Genes with decreased burden
SUMOylation of transcription factors 3.43 CDKN2A, PIAS1
RHOJ GTPase cycle 3.11 FMNL3, PAK1, PAK2, RHOJ CDC42BPB
RHOQ GTPase cycle 2.90 ARHGAP17, ARHGAP33, PAK1, PAK2 CDC42BPB
RAC2 GTPase cycle 2.79 ARHGAP17, BAIAP2L1, DOCK3, LBR, PAK1, PAK2, VRK2
Constitutive Signaling by NOTCH1 HD+PEST Domain Mutants 2.36 DLL1, HDAC1, HDAC4, PSEN1
Constitutive Signaling by NOTCH1 PEST Domain Mutants 2.36 DLL1, HDAC1, HDAC4, PSEN1
Signaling by NOTCH1 HD+PEST Domain Mutants in Cancer 2.36 DLL1, HDAC1, HDAC4, PSEN1
Signaling by NOTCH1 PEST Domain Mutants in Cancer 2.36 DLL1, HDAC1, HDAC4, PSEN1
Signaling by NOTCH1 in Cancer 2.36 DLL1, HDAC1, HDAC4, PSEN1
RAC3 GTPase cycle 2.23 ARHGAP17, BAIAP2L1, LBR, PAK1, PAK2, VRK2
RHOG GTPase cycle 1.90 DOCK3, LBR, PAK2, VRK2
Signaling by NOTCH1 1.85 DLL1, HDAC1, HDAC4, PSEN1
SUMO E3 ligases SUMOylate target proteins 1.67 CBX2, CDKN2A, DDX17, HDAC1, HDAC4, NR3C1, PIAS1 RARA
SUMOylation 1.61 CBX2, CDKN2A, DDX17, HDAC1, HDAC4, NR3C1, PIAS1 RARA
Table 9. Pathways shared for datasetTSS1500 gene area due hypermethylation.
Reactome-ID Description
R-HSA-2894862 Constitutive Signaling by NOTCH1 HD+PEST Domain Mutants
R-HSA-2644606 Constitutive Signaling by NOTCH1 PEST Domain Mutants
R-HSA-2894858 Signaling by NOTCH1 HD+PEST Domain Mutants in Cancer
R-HSA-2644602 Signaling by NOTCH1 PEST Domain Mutants in Cancer
R-HSA-2644603 Signaling by NOTCH1 in Cancer
R-HSA-1980143 Signaling by NOTCH1
R-HSA-157118 Signaling by NOTCH
R-HSA-3232118 SUMOylation of transcription factors
R-HSA-4551638 SUMOylation of chromatin organization proteins
R-HSA-3108232 SUMO E3 ligases SUMOylate target proteins
R-HSA-2990846 SUMOylation
R-HSA-877312 Regulation of IFNG signaling
R-HSA-5689603 UCH proteinases
R-HSA-5689880 Ub-specific processing proteases
Table 10. Pathways shared for datasetTSS1500 gene area due hypomethylation.
Reactome-ID Description
R-HSA-8939211 ESR-mediated signaling
Disclaimer/Publisher’s Note: The statements, opinions and data contained in all publications are solely those of the individual author(s) and contributor(s) and not of MDPI and/or the editor(s). MDPI and/or the editor(s) disclaim responsibility for any injury to people or property resulting from any ideas, methods, instructions or products referred to in the content.
Copyright: This open access article is published under a Creative Commons CC BY 4.0 license, which permit the free download, distribution, and reuse, provided that the author and preprint are cited in any reuse.
Prerpints.org logo

Preprints.org is a free preprint server supported by MDPI in Basel, Switzerland.

Subscribe

© 2024 MDPI (Basel, Switzerland) unless otherwise stated