Submitted:
19 June 2023
Posted:
20 June 2023
You are already at the latest version
Abstract
Keywords:
1. Introduction
2. Experimental details
2.1. Preparation of reduced graphene oxide (rGO)
2.2. Preparation of Cu@PtRu/rGO catalysts
2.3. Physical characterization
2.4. Electrochemical analyses
3. Results and discussion
3.1. Characterization
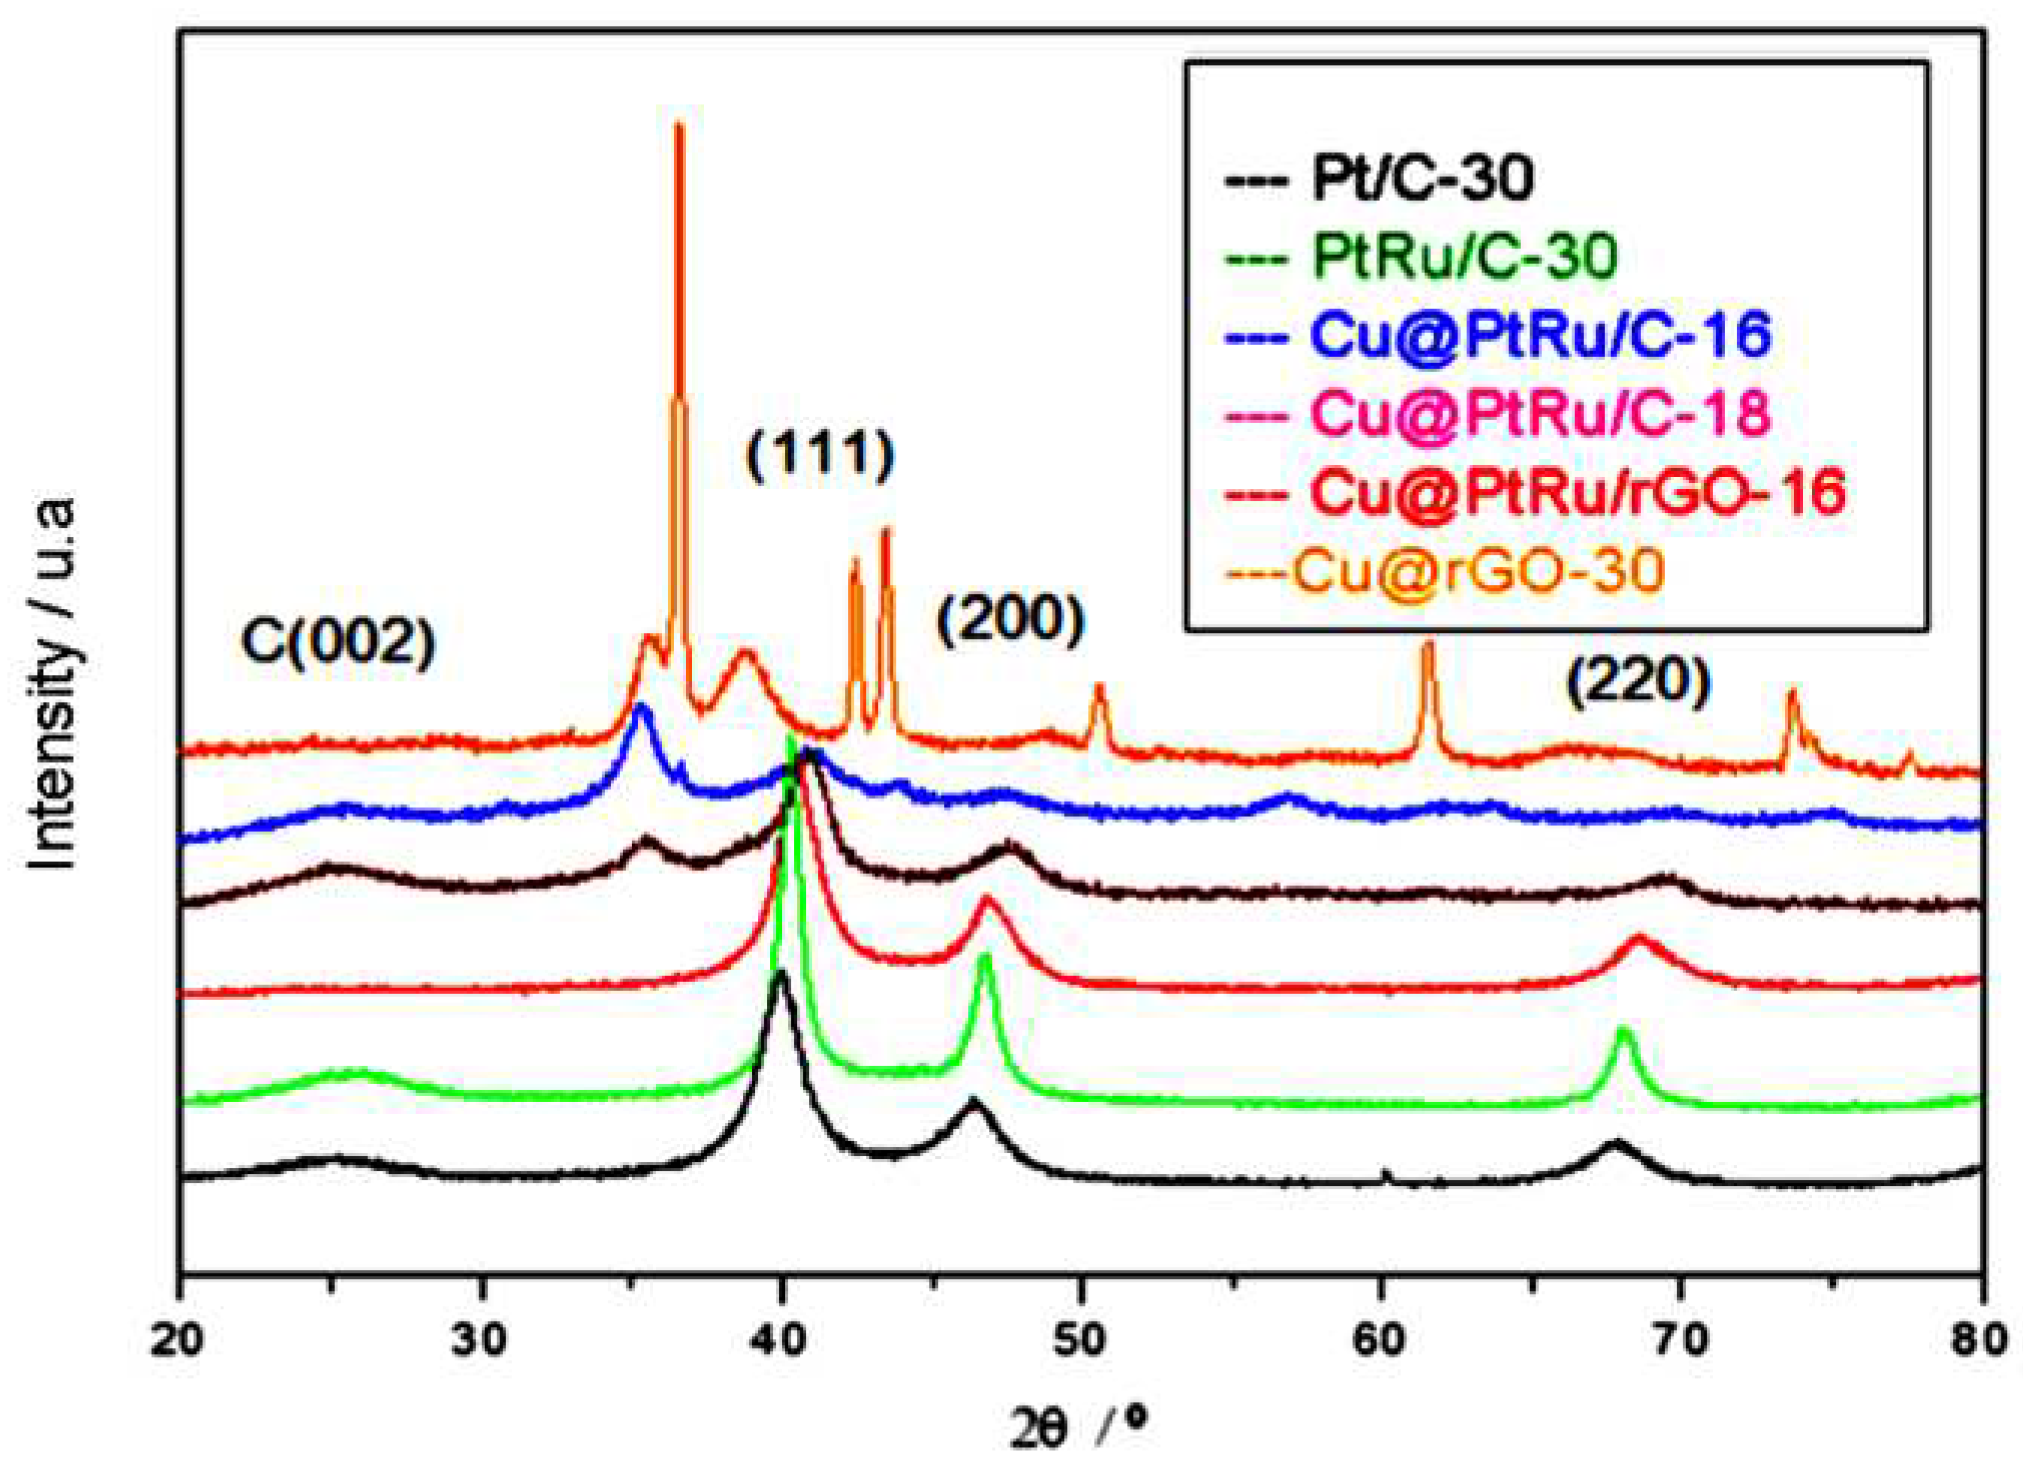
3.1.1. X-ray analyses
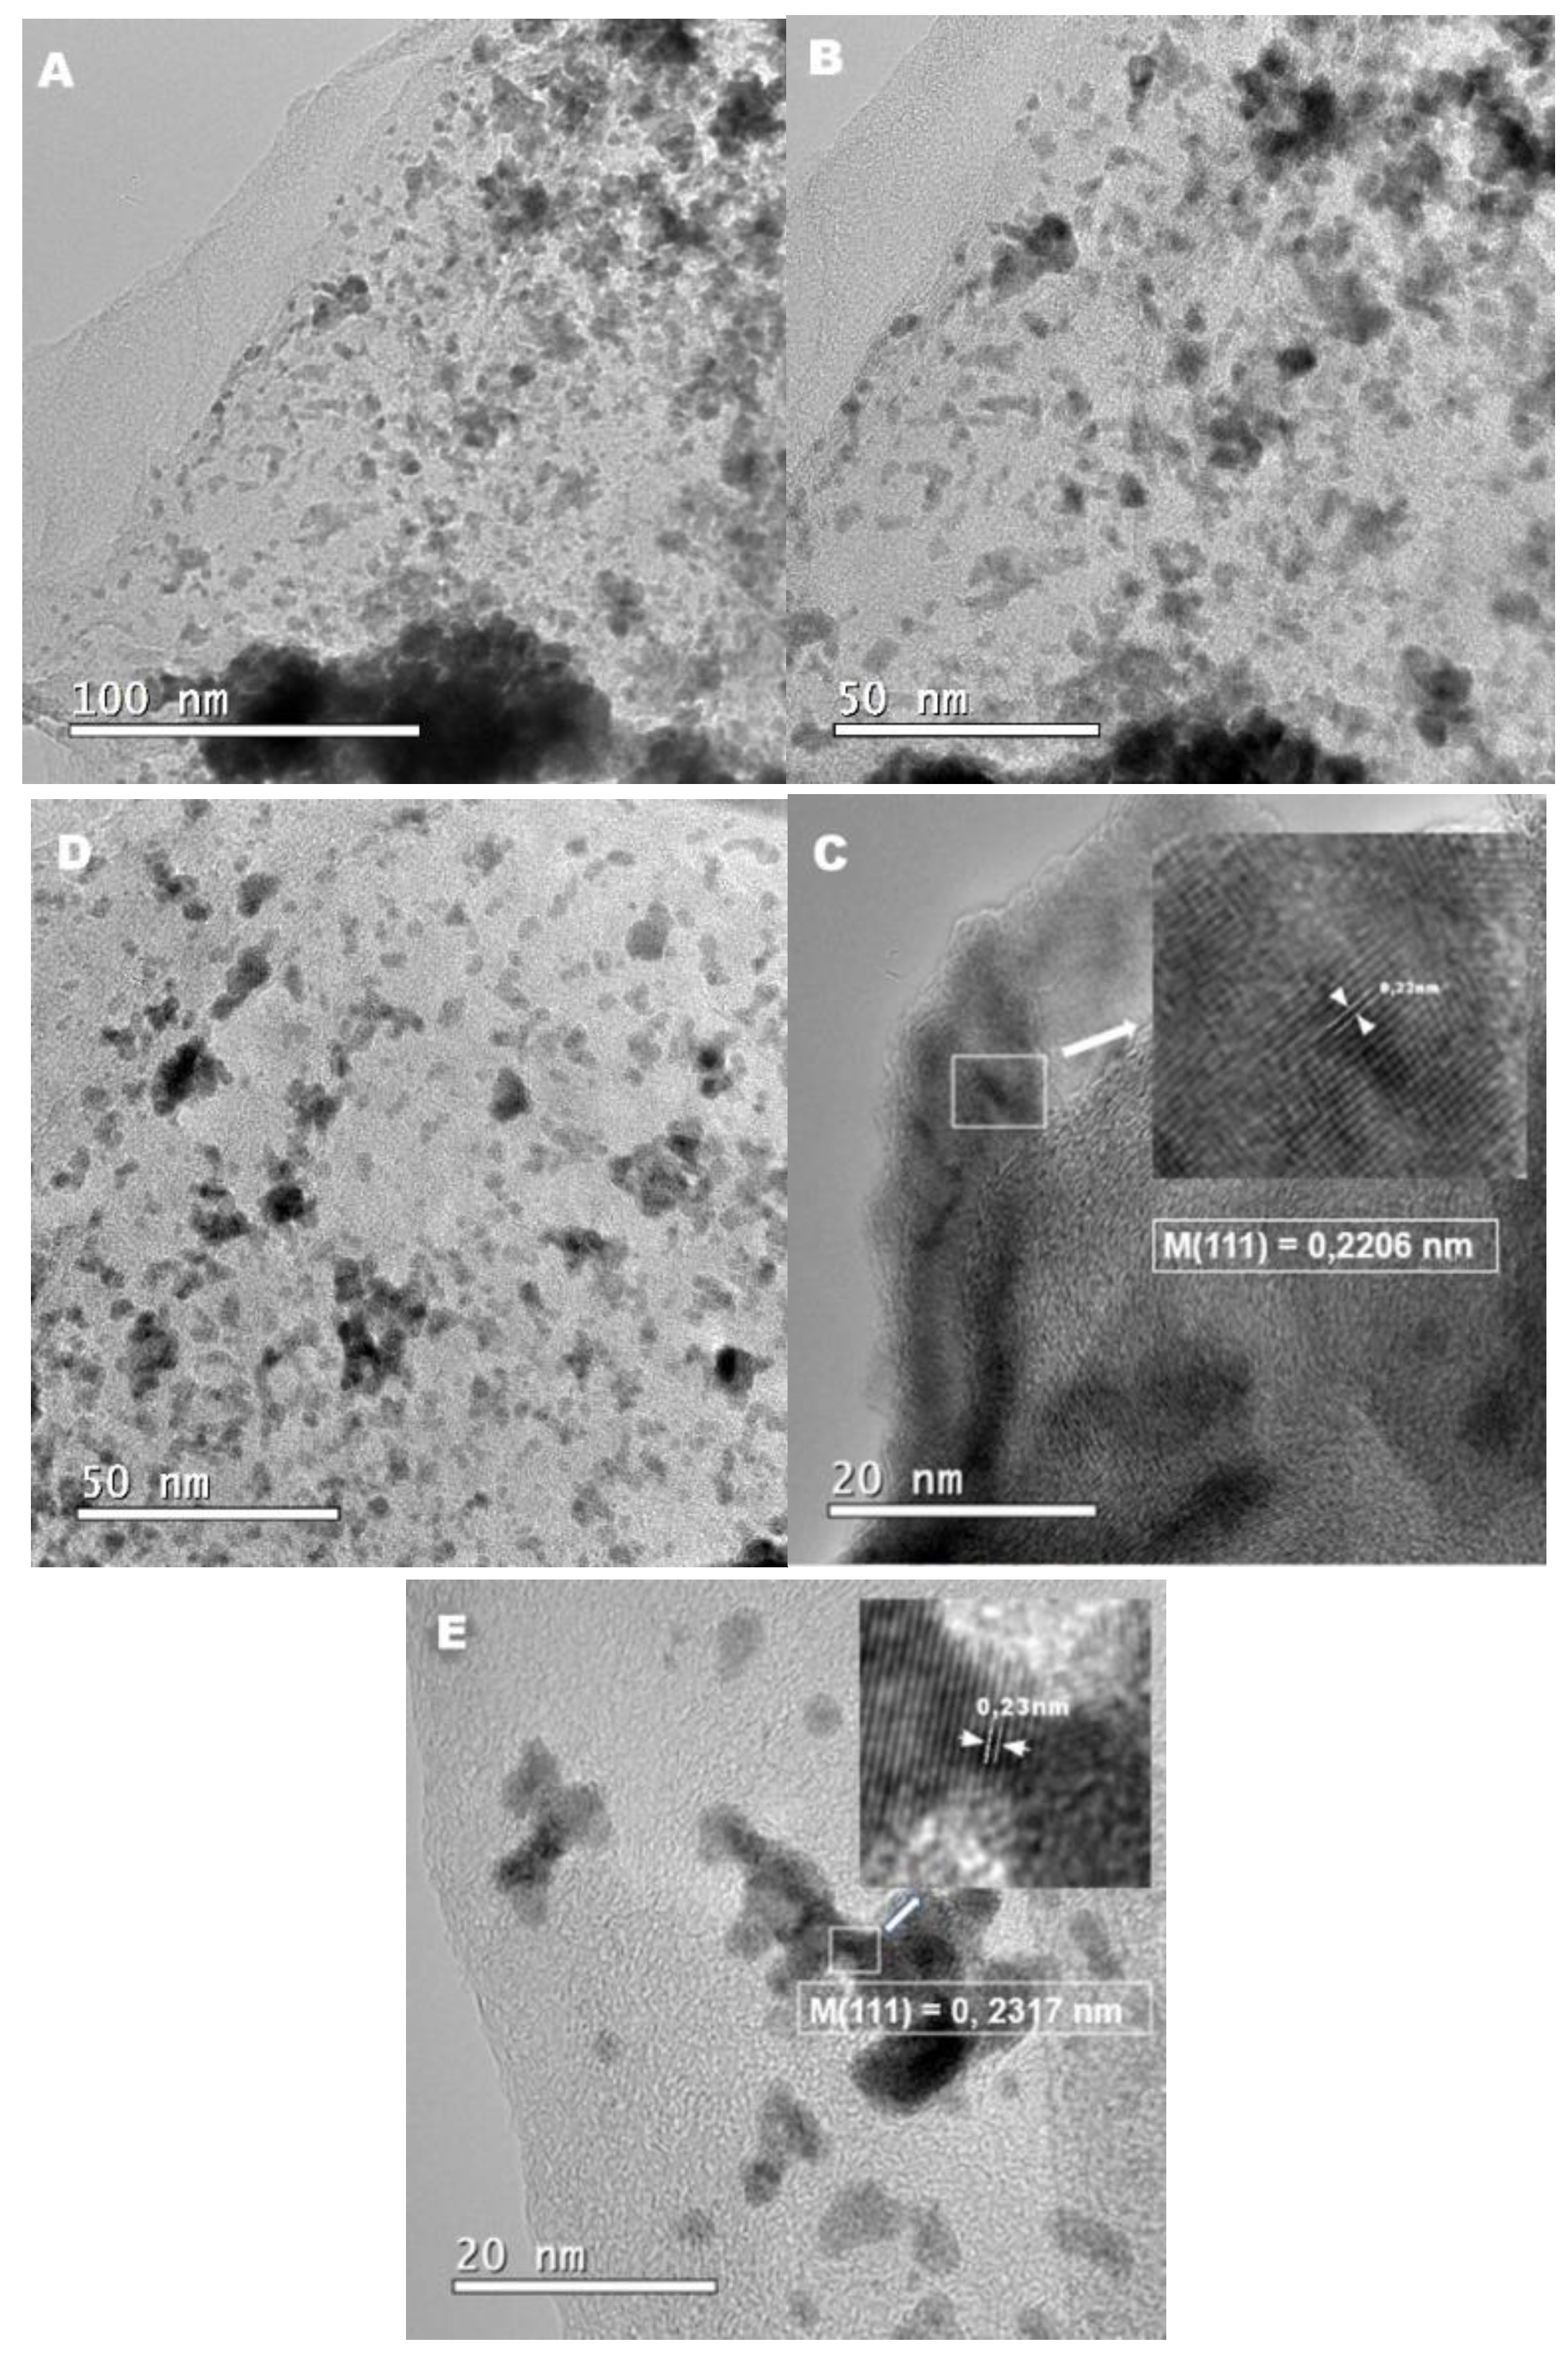
3.1.2. HRTEM Results
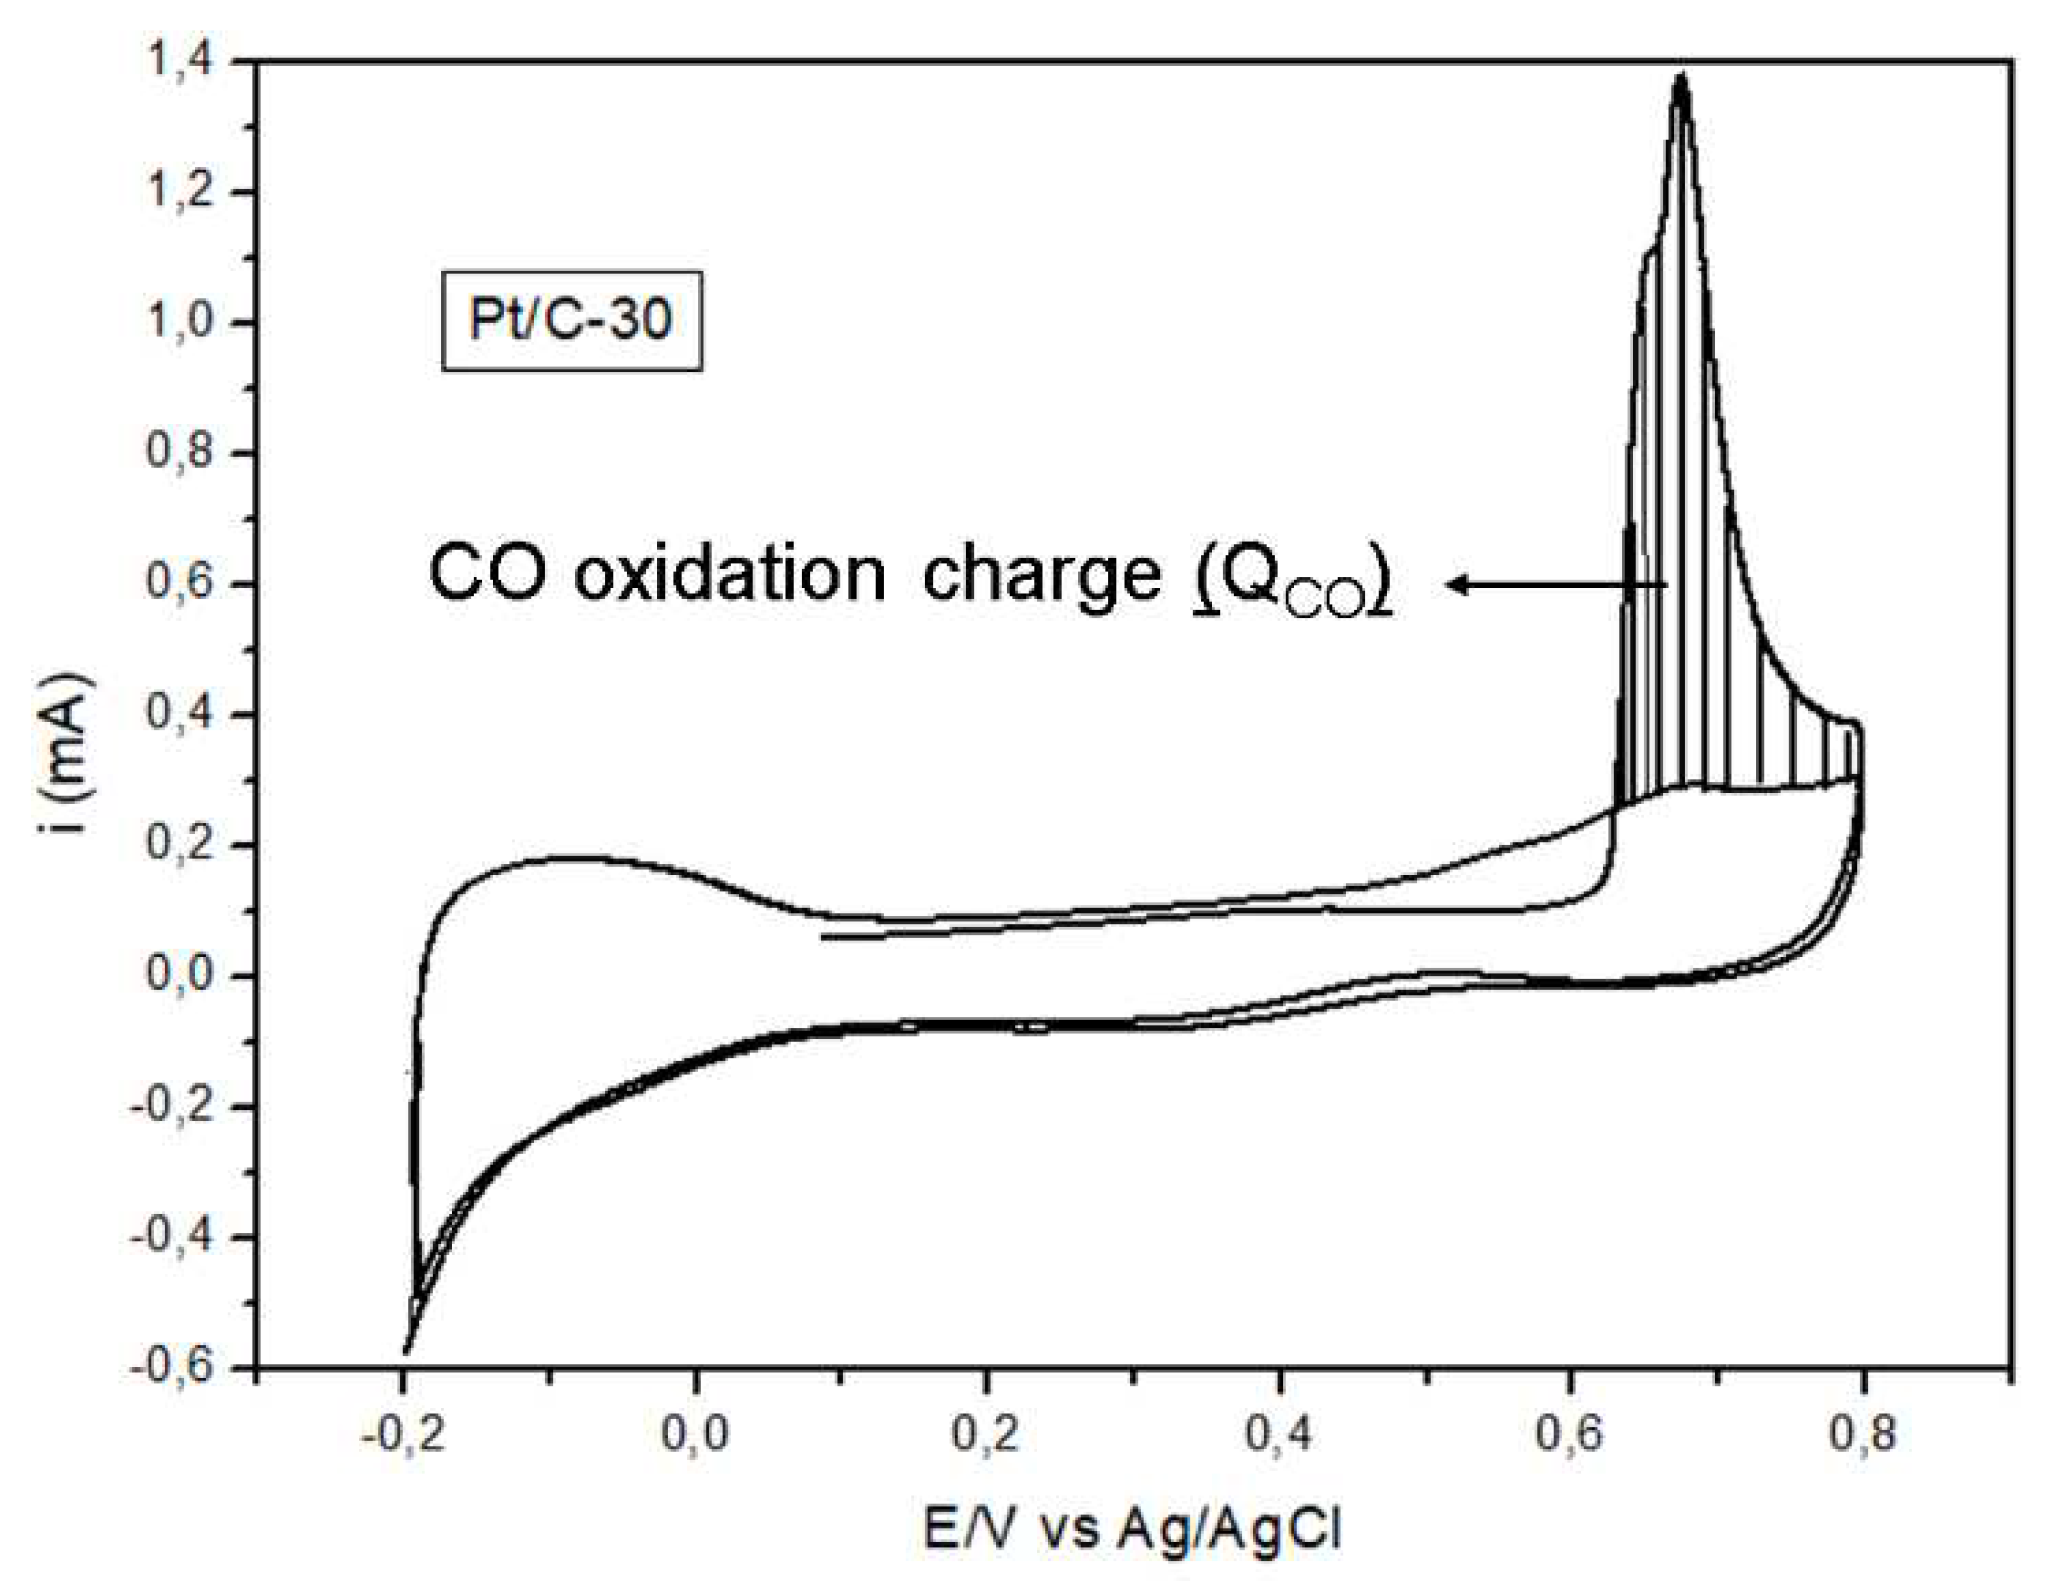
3.1.3. Cyclic voltammetry
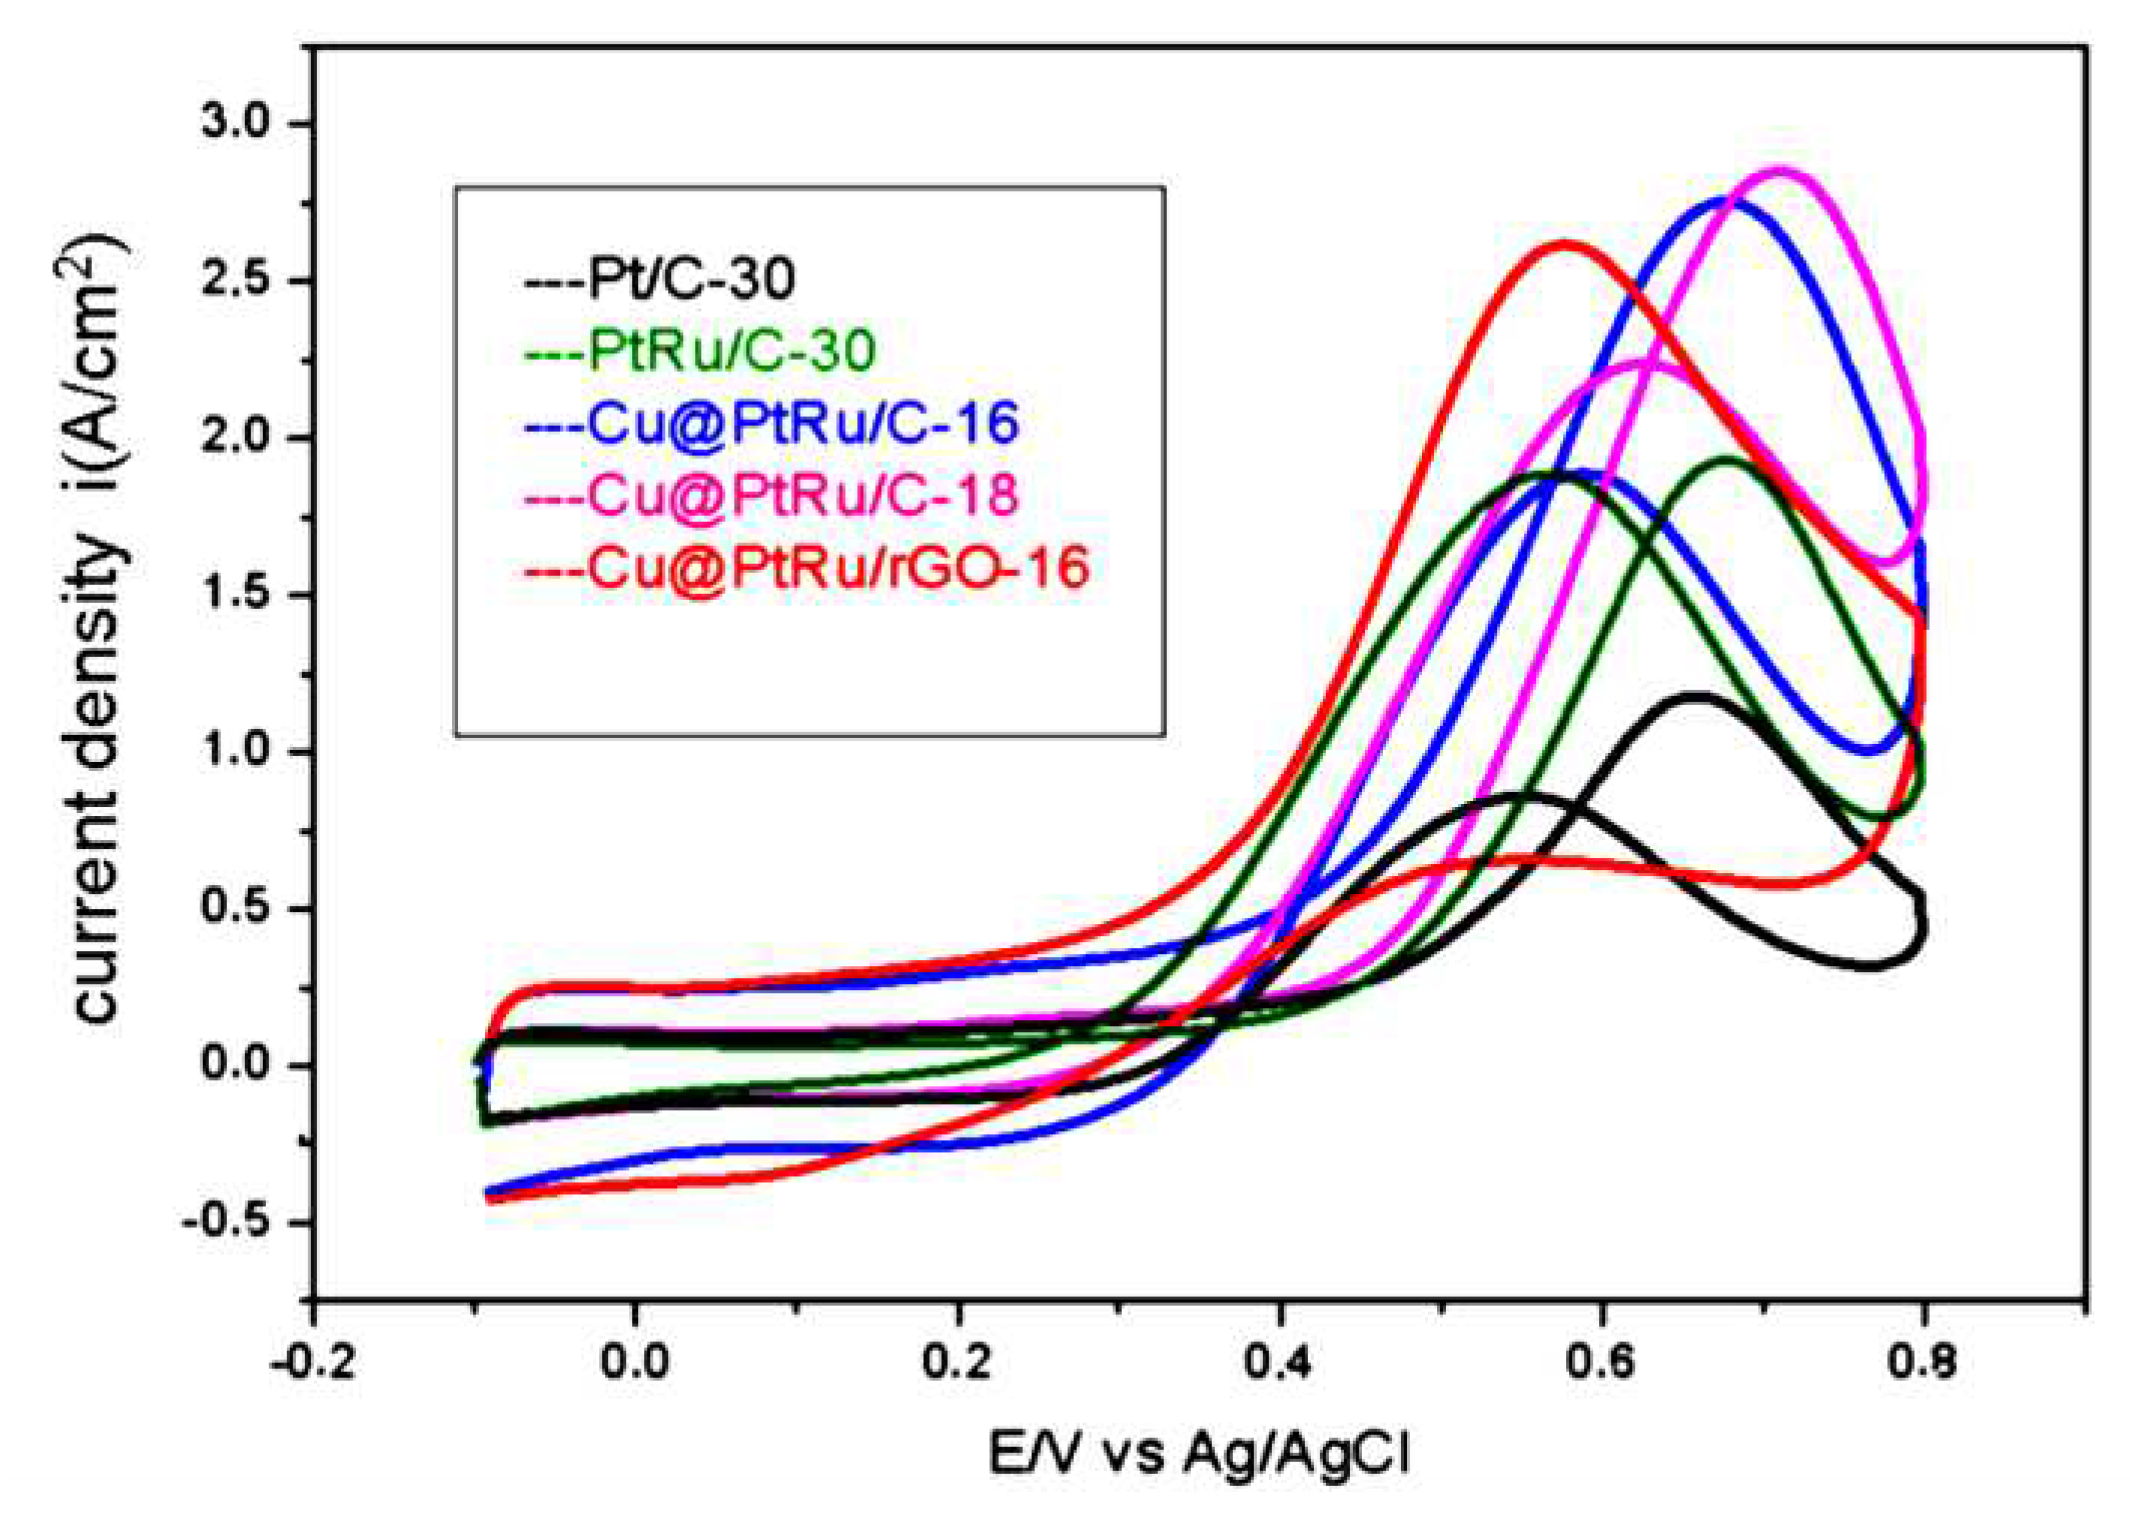
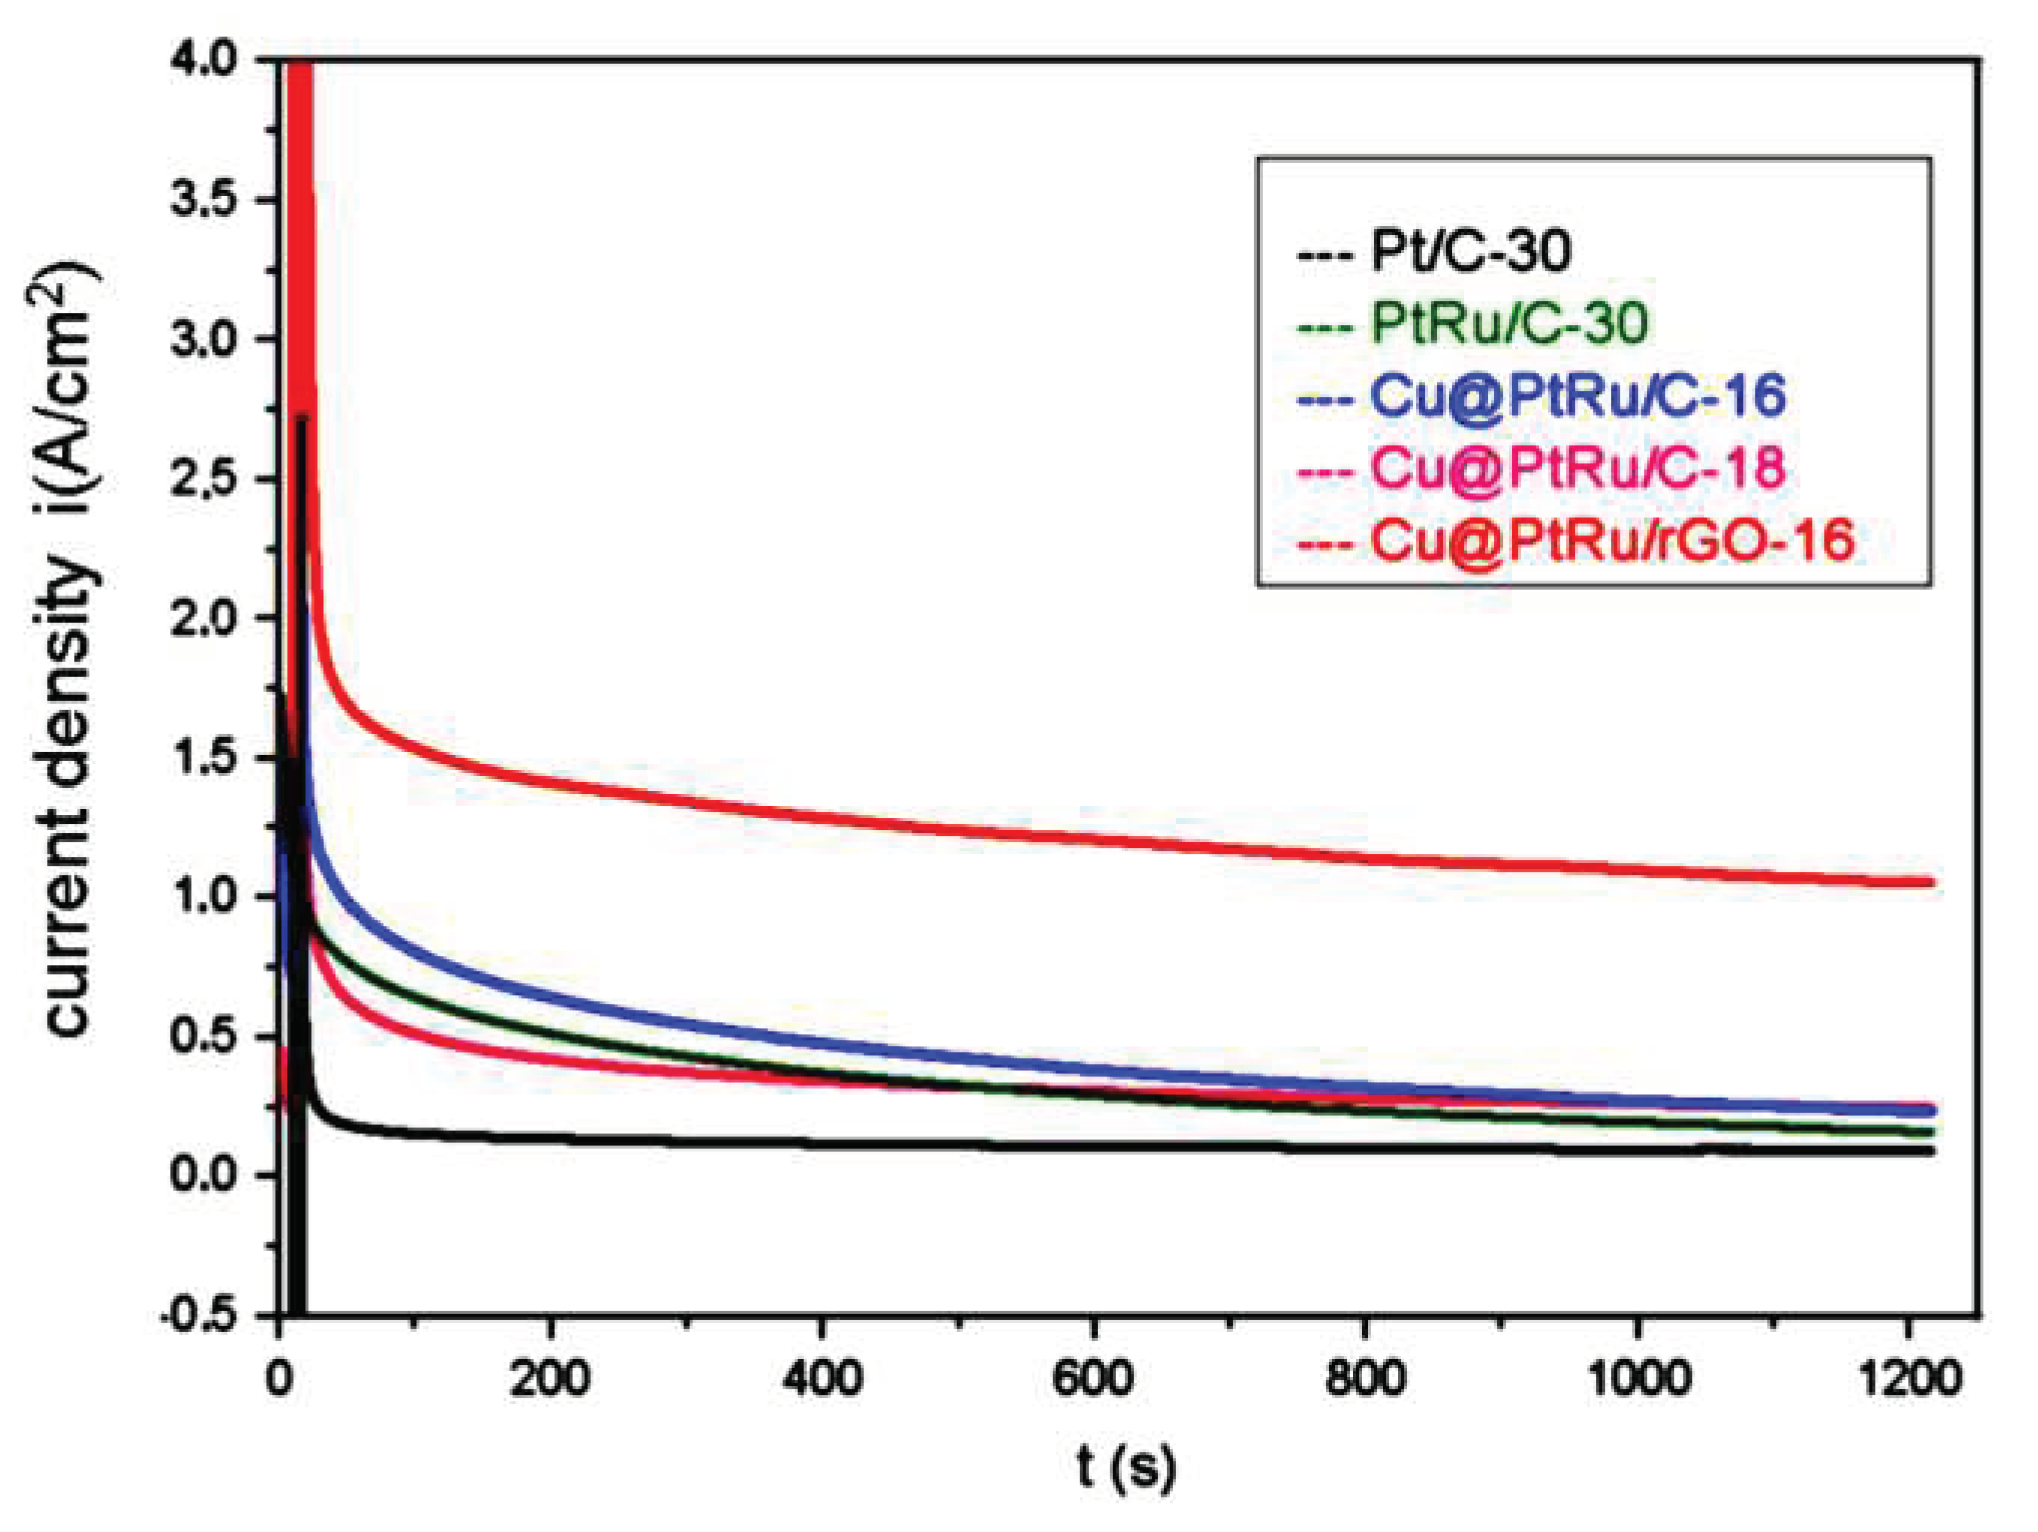
3.1.4. Chronoamperometry measuments for methanol electrooxidation
4. Conclusions
Acknowledgments
References
- Cheng, Y.; Zhang, J.; Lu, S.; Jiang, S.P. Significantly enhanced performance of direct methanol fuel cells at elevated temperatures. Journal of Power Sources 2020, 450, 1–7. [Google Scholar] [CrossRef]
- Sun, X.; Yang, C.; Xia, Z.; Qi, F.; Sun, H.; Sun, G. Molecular sieve as an effective barrier for methanol crossover in direct methanol fuel cells. International Journal of Hydrogen Energy 2020, xx, 1–10. [Google Scholar] [CrossRef]
- Guo, J.; Zhang, M.; Xu, J.; Fang, J.; Luo, S.; Yang, C. ; Core–shell Pd–P@Pt–Ni nanoparticles with enhanced activity and durability as anode electrocatalyst for methanol oxidation reaction. RSC advances 2022, 12, 2246–2252. [Google Scholar] [CrossRef] [PubMed]
- Pereira, P. A.; Andrade, J. B. Fontes, reatividade e quantificação de metanol e etanol na atmosfera. Química Nova 1998, 21, 744–754. [Google Scholar] [CrossRef]
- Liu, M.; Zhao, Z.; Duan, X.; Huang, Y. Nanoscale Structure Design for High-Performance Pt-Based ORR Catalysts. Advanced Materials 2018, 31, 1–8. [Google Scholar] [CrossRef] [PubMed]
- Abdelkareem, M. A.; Sayed, E. T.; Nakagawa, N. Significance of diffusion layers on the performance of liquid and vapor feed passive direct methanol fuel cells. Energy 2020, 209, 1–11. [Google Scholar] [CrossRef]
- Sekar, A.; Metzger, N.; Rajendran, S.; Elangovan, A.; Cao, Y.; Peng, F.; Li, X.; Li, J. PtRu Catalysts on Nitrogen-Doped Carbon Nanotubes with Conformal Hydrogenated TiO2 Shells for Methanol Oxidation. ACS Applied Nano Materials 2022, 5, 3275–3288. [Google Scholar] [CrossRef]
- Xu, H.; Shang, H.; Wang, C.; Du, Y. Recent Progress of Ultrathin 2D Pd-Based Nanomaterials for Fuel Cell Electrocatalysis. Small 2021, 17, 1–25. [Google Scholar] [CrossRef]
- Mohanapriya, S.; Gopi, D. Microwave assisted synthesis of core-shell Ni-Co/graphene nanosheets and their catalytic activity for methanol electro-oxidation. Materials Today 2022, 51, 1797–1881. [Google Scholar] [CrossRef]
- Wang, X.; Li, H.; Feng, H.; Wang, H.; Lei, Z. Preparation of carbon-supported core@shell PdCu@PtRu nanoparticles for methanol oxidation. Journal Power Sources 2010, 195, 1099–1102. [Google Scholar] [CrossRef]
- Lee, D.; Gok, S.; Kim, Y.; Sung, Y. E.; Lee, E.; Jang, J. H.; Lim, T. Methanol Tolerant Pt–C Core–Shell Cathode Catalyst for Direct Methanol Fuel Cells. ACS Applied Materials & Interfaces 2020, xx, 4-10. [CrossRef]
- Salgado, J. R. C.; Alcaide, F.; Álvarez, G.; Calvillo, L.; Lázaro, M. J.; Pastor, E. Pt-Ru electrocatalysts supported on ordered mesoporous carbon for direct methanol fuel cell. Journal power Sources 2010, 195, 4022–4029. [Google Scholar] [CrossRef]
- Christoffersen, E.; Liu, P.; Ruban, A.; Skriver, H.; Norskov, J. Anode Materials for Low-Temperature Fuel Cells: A Density Functional Theory Study. Journal of Catalysis 2000, 199, 123–131. [Google Scholar] [CrossRef]
- Sang, Y.; Zhang, R.; Xu, B.; Yang, J.; Zhao, C.; Xu, H. Ultrafine and Highly Dispersed PtRu Alloy on Polyacrylic Acid-Grafted Carbon Nanotube@Tin Oxide Core/Shell Composites for Direct Methanol Fuel Cells. ACS Applied Energy Materials 2022, xx, 1–9. [Google Scholar] [CrossRef]
- Yola, M. L.; Eren, T.; Atar, N.; Saral, H.; Ermiş, İ. Direct-methanol Fuel Cell Based on Functionalized Graphene Oxide with Mono-metallic and Bi-metallic Nanoparticles: Electrochemical 2015, xx, 1-9. [CrossRef]
- Li, Y.; Gao, W.; Ci, L.; Wang, C.; Ajayan, P. M. Catalytic performance of Pt nanoparticles on reduced graphene oxide for methanol electro-oxidation. Carbon 2010, 48, 1124–1130. [Google Scholar] [CrossRef]
- Lee, S. H.; Kakati, N.; Jee, S. H.; Maiti, J.; Yoon, Y. S. Hydrothermal synthesis of PtRu nanoparticles supported on graphene sheets for methanol oxidation in direct methanol fuel cell. Materials Letters 2011, 65, 3281–3284. [Google Scholar] [CrossRef]
- Zhang, Y.; Guo, Z.; Zhu, H.; Xing, W.; Tao, P.; Shang, W.; Fu, B.; Song, C.; Hong, Y.; Dickei, M. D. Synthesis of Liquid Gallium@Reduced Graphene Oxide Core–Shell Nanoparticles with Enhanced Photoacoustic and Photothermal Performance. Journal of the American Chemical Society 2022, 144, 6779–6790. [Google Scholar] [CrossRef] [PubMed]
- Pan, J.; Li, S.; Zhang, L.; Yu, T.; Li, F.; Zhang, W.; Wang, J.; Zhang, D.; Yu, Y.; Li, X. Reduced Graphene Oxide/Ni Foam Supported ZIF-67 Derived CuCo2S4@CoS2 Core-Shell Heterostructure for Boosted Electrochemical Energy Storage. Journal of Energy Storage 2022, 47, 103–112. [Google Scholar] [CrossRef]
- Roh, G.; Lee, H.; Jeong, Y.; Kim, J. H. Preparation of Carbon-Supported PtRu Core-Shell Nanoparticles Using Carbonized Polydopamine and Ozone for a CO Tolerant Electrocatalyst. International Journal of Hydrogen Energy 2019, 44, 21588–21596. [Google Scholar] [CrossRef]
- Wu, Y. N.; Liao, S. J.; Liang, Z. X.; Yang, L. J.; Wang, R. F. High-Performance Core-Shell PdPt@Pt/C Catalysts via Decorating PdPt Alloy Cores with Pt. Journal of Power Sources 2009, 194, 805–810. [Google Scholar] [CrossRef]
- Patra, S.; Munichandraiah, N. Electrooxidation of Methanol on Pt-Modified Conductive Polymer PEDOT. Langmuir 2009, 25, 1732–1738. [Google Scholar] [CrossRef] [PubMed]
- Mcbreen, J.; Mukerjee, S. In situ X-ray Absorption Studies of a Pt-Ru Electrocatalyst. Journal of the Electrochemical Society, 1995, 142, 3399-3404. [CrossRef]
- Mukerjee, S. In situ X-ray Absorption Studies of Carbon-Supported Pt and Alloy Nanoparticles. Journal of Electroanalytical Chemistry 2003, 151, 151,501–509. [Google Scholar] [CrossRef]
- Rigsby, M. A.; Zhou, W. P.; Lewera, A.; Duong, H. T.; Bagus, O. S.; Jaegermann, W.; Hunger, R.; Wieckowski, A. Experiment and Theory of Fuel Cell Catalysis: Methanol and Formic Acid Decomposition on Nanoparticle Pt/Ru. Journal of Physical Chemistry 2008, 112, 15595–15601. [Google Scholar] [CrossRef]
- Neto, A. O.; Linardi, M.; Gonzales, E. R. Oxidação eletroquímica do metanol sobre partículas de PtRu e PtMo suportadas em carbono de alta área superficial. Eclética Química 2003, 28, 55-62. [CrossRef]
- Minghang, J.; Xiao, L.; Wenjun, H.; Mengyu, G.; Liangqing, H.; Hongmei, H.; Huanhuan, Z.; Fei, X.; Li, M. Fe2O3@FeP core-shell nanocubes/C composites supported irregular PtP nanocrystals for enhanced catalytic methanol oxidation. Electrochimica Acta 2019, 323, 1–11. [Google Scholar] [CrossRef]
- Mekazni, S. D.; Arán-Ais, R. M.; Ferre-Vilaplana, A.; Herrero, E. Why Methanol Electro-oxidation on Platinum in Water Takes Place Only in the Presence of Adsorbed OH. ACS Catalysis 2022, 12, 1965–1970. [Google Scholar] [CrossRef]
- Liu, H.; Sun, F.; Chen, M.; Wang, H. Reconciling the experimental and computational methanol electro-oxidation activity via potential-dependent kinetic mechanism analysis. Journal of Materials Chemistry A 2022, 10, 23551–23561. [Google Scholar] [CrossRef]
- Antolini, E.; Cardellini, F. Formation of carbon supported alloy: an XRD analysis. Journal of Alloy and Compounds 2001, 315, 118–127. [Google Scholar] [CrossRef]
- Perrozzi, F. ; Prezioso, S. ; Ottaviano, L. Graphene oxide: from fundamentals to applications to cite this article: Journal of Physics Condensed Matter 2015, 27, 1-21. [CrossRef]
- Hsin, Y. L.; Hwang, K. C.; Yeh, C. T. Poly(vinylpyrrolidone)-Modified Graphite Carbon Nanofibers as Promising Supports for PtRu Catalysts in Direct Methanol Fuel Cells. Journal of the American Chemical Society 2007, 129, 9999–10010. [Google Scholar] [CrossRef]
- Abdolhosseinzadeh, S.; Asgharzadeh, H.; Seop Kim, H. Fast and fully-scalable synthesis of reduced graphene oxide. Scientific Reports 2015, 5, 1–7. [Google Scholar] [CrossRef]
- Hummers, W. S.; Offeman, R. E. Preparation of Graphitic Oxide. Journal of the American Chemical Society 1958, 80, 1339. [Google Scholar] [CrossRef]
- Mohanaprya, S.; Gopi, D. Microwave assisted synthesis of core-shell Ni-Co/graphene nanosheets and their catalytic activity for methanol electro-oxidation. Materials today 2022, 51, 1797–1881. [Google Scholar] [CrossRef]
- Wu, Q.; Huang, X.; Wang, T.; Xiang, D.; Li, X.; Wang, K.; Yuan, X.; Li, P.; Zhu, M. Enhancing Electrocatalytic Methanol Oxidation on PtCuNi Core–Shell Alloy Structures in Acid Electrolytes. Inorganic Chemistry 2022, 61, 2612–2618. [Google Scholar] [CrossRef] [PubMed]
- Ferrarelli, G.; Giordano, G.; Migliori, M. ZSM-5@Sil-1 core shell: Effect of synthesis method over textural and catalytic properties. Catalysis Today 2022, 390, 176–184. [Google Scholar] [CrossRef]
- Zhu, H.; Li, X.; Wang, F. Synthesis and characterization of Cu@Pt/C core-shell structured catalysts for Exchange membrane fuel cell. Journal of Hydrogen Energy 2011, 36, 9151–9154. [Google Scholar] [CrossRef]
- Frelink, T.; Visscher, W.; Cox, A. P.; Van Veen, J. A. R. Ellipsometry and dems study of the electrooxidation of methanol at Pt and Ru- and Sn- promoted Pt. Electrochimica Acta 1995, 40, 1537–1543. [Google Scholar] [CrossRef]
- Szabo, T.; Berkesi, O.; Forgo, P.; Josepovits, K.; Sanakis, Y.; Petridis, X. D.; De’ka’ny, I. Evolution of Surface Functional Groups in a Series of Progressively Oxidized Graphite Oxides. Chemical Materials 2006, 18, 2740–2749. [Google Scholar] [CrossRef]
- Dohyeon, L.; Sujin, G.; Younkwang, K.; Yung, E.; Eunjik, L.; Ji-Hoon, J.; Jee Youn, H.; Oh Jooh, K.; Taeho, L. Methanol Tolerant Pt-C Core-Shell Cathode Catalyst for Direct Methanol Fuel Cells. ACS Applied Materials & Interfaces 2020, 15, 1-10. [CrossRef]
- Wang, Z.; Hu, S.; Ali, A.; Chen, H.; Shen, P. K. Facile One-Pot Synthesis of a PtRh Alloy Decorated on Ag Nanocubes as a Trimetallic Core−Shell Catalyst for Boosting Methanol Oxidation Reaction. ACS Applied Energy Materials 2021, 4, 1085–1092. [Google Scholar] [CrossRef]
- Hamnett, A.; Mechanism and electrocatalysis in the direct methanol fuel cell; Catalysis Today 1997; 38, 445-457. [CrossRef]
- Yang, S.; Yang, X.; Tong, X.; Yang, N. A. Highly Active Rh@Pd Nanocube Catalyst for Methanol Electrooxidation. Advanced Energy and Sustainability Research 2021, 20, 1–9. [Google Scholar] [CrossRef]
- Li, Z.; Gao, F.; Zou, B.; Wu, Z.; Zhang, Y.; Du, Y. Core@shell PtAuAg@PtAg Hollow Nanodendrites as Effective Electrocatalysts for Methanol and Ethylene Glycol Oxidation. Inorganic Chemistry 2021, 60, 9977–9986. [Google Scholar] [CrossRef]
- Souza, J. P. I.; Queiroz, S. L.; Nart, F. C. Uso de espectrometria de massas em medidas eletroquímicas - A técnica de DEMS. Química Nova 2000, 23, 384-391. [CrossRef]
- Iwasita, T.; Nart, F. C.; Vielstich, W. An FTIR Study of the Catalytic Activity of a 85:15 Pt:Ru Alloy for Methanol Oxidation. Berichte Der Bunsengesellschaft Für Physikalische Chemie 1990, 94, 1030-1034. [CrossRef]
- Babu, P. K.; Kim, H. S.; Oldfield, E.; Wieckowski, A. Electronic Alterations Caused by Ruthenium in Pt-Ru Alloy Nanoparticles as Revealed by Electrochemical NMR; Electro-oxidation of small organic molecules. Plenum 1992, 22, 97–104. [Google Scholar] [CrossRef]
- Hoster, H.; Iwasita, T.; Baumgartner, H.; Vielstich, W. ; Pt-Ru model catalysts for anodic methanol oxidation: Influence of structure and composition on the reactivity. Physical Chemistry 2001, 3, 337–346. [Google Scholar] [CrossRef]
- Mukerjee, S.; Urian, R. C. Bifunctionality in Pt alloy nanocluster electrocatalysts for enhanced methanol oxidation and CO tolerance in PEM fuel cell: electrochemical and in situ synchrotron spectroscopy. Electrochimica Acta 2002, 47, 3219–3231. [Google Scholar] [CrossRef]
- Rhee, C. K.; Kim, B. J.; Ham, C.; Kim, Y. J.; Song, K.; Kwon, K. Size Effect of Pt Nanoparticle on Catalytic Activity in Oxidation of Methanol and Formic Acid: Comparison to Pt(111), Pt(100), and Polycrystalline Pt Electrodes; Langmuir 2009, 25, 7140-7147. [CrossRef]
- Marković, N. M.; Gasteiger, H. A.; Ross, P. N.; Jiang, X.; Villegas, I.; Weaver, M. J. ; Electro-oxidation mechanisms of methanol and formic acid on Pt-Ru alloy surfaces. Electrochimica Acta 1995, 40, 91–98. [Google Scholar] [CrossRef]
- Smith, A.S.; Lachance, A.M.; Zeng, S.; Liu, B.; Sun, L. ; Synthesis, properties, and applications of graphene oxide/reduced graphene oxide and their nanocomposites. Nano Materials Science 2019, 1, 31–37. [Google Scholar] [CrossRef]
- Zhou, X.; Liu, Z. ; A scalable, solution-phase processing route to graphene oxide and graphene ultralarge sheets. Chemical Communications 2010, 46, 2611–2611. [Google Scholar] [CrossRef]
- Wang, H. ; Wang, R. ; Li, H. ; Wang, Q. ; Kang, J. ; Lei, Z.; Facile synthesis of carbon-supported pseudo-core@shell PdCu@Pt nanoparticles for direct methanol fuel cells; International Journal of Hydrogen Energy 2011, 36, 839-848. [CrossRef]
- Muthuswamy, N.; La Fuente, J.L.G.; Dung, T.; Walmsley, J.; Tsypkin, M.; Raaen, S.; Sunde, S.; Ronning, M.; Chen, D.; Ru@Pt core-shell nanoparticles for methanol fuel cell catalyst: Control and effects of shell composition. International Journal of Hydrogen Energy 2013; 38, 16631-16641. [CrossRef]
- Muthuswamy, N.; La Fuente, J. L. G.; Dung, T.; Walmsley, J.; Tsypkin, M.; Raaen, S.; Sunde, S.; Ronning, M.; Chen, D. Ru@Pt core-shell nanoparticles for methanol fuel cell catalyst: Control and effects of shell composition. International Journal of Hydrogen Energy 2013, 38, 16631–16641. [Google Scholar] [CrossRef]
- Baomin, L.; Qiang, Z.; Yezhen, Z.; Lijuan, W.; Fenfen, L.; Haiquan, X. Core-shell Ag nanowires@Pt nanorods catalyst: Synthesis and application in direct methanol fuel cells. Materials Letters 2018, 233, 138–141. [Google Scholar] [CrossRef]
- Watanabe, M.; Motoo, S. Electrocatalysis by ad-atoms – part II: Enhancement of the oxidation of carbon monoxide on platinum by ruthenium ad-atoms. Journal of Electroanalytical Chemistry and Interfacial Electrochemistry 1975, 60, 267–273. [Google Scholar] [CrossRef]
- Watanabe, M.; Motoo, S. Electrocatalysis by ad-atoms – part III: Enhancement of the oxidation of carbon monoxide on platinum by ruthenium adatoms. Journal of Electroanalytical Chemistry and Interfacial Electrochemistry 1975, 60, 275–283. [Google Scholar] [CrossRef]

| Electrocatalyst SOP IF IR (V) (A/cm2) (A/cm2) |
IF/IR | |||
| Pt/C-30 | 0.437 | 1.80 | 1.92 | 0.93 |
| PtRu/C-30 | 0.425 | 1.96 | 1.78 | 1.10 |
| Cu@PtRu/C-16 | 0.300 | 2.79 | 2.02 | 1.38 |
| Cu@PtRu/C-18 | 0.391 | 2.89 | 2.17 | 1.33 |
| Cu@PtRu/rGO-16 | 0.250 | 2.68 | 1.85 | 1.45 |
Disclaimer/Publisher’s Note: The statements, opinions and data contained in all publications are solely those of the individual author(s) and contributor(s) and not of MDPI and/or the editor(s). MDPI and/or the editor(s) disclaim responsibility for any injury to people or property resulting from any ideas, methods, instructions or products referred to in the content. |
© 2023 by the authors. Licensee MDPI, Basel, Switzerland. This article is an open access article distributed under the terms and conditions of the Creative Commons Attribution (CC BY) license (http://creativecommons.org/licenses/by/4.0/).


