1. Introduction
As a leading technology of clean and renewable energy, PEMFC has the advantages of high energy conversion efficiency and less environmental pollution. At present, PEMFC has been developing rapidly in the fields of distributed power generation, power networks, fixed power generation, and automotive energy, which is the key direction of future new energy development and has a good market prospect. Despite this, PEMFC still has the problems of short service life and high production cost, which seriously affect the commercial application and popularization of PEMFC. In addition to the breakthrough innovation in electrochemical materials, RUL prediction research is also one of the feasible methods to improve the life of PEMFC, because it can predict the life state of the reactor in advance and thus improve the service life. Carrying out RUL prediction based on PEMFC has gradually become a hot topic for researchers.
At present, according to the research of relevant literature, the model-driven method, data-driven method, and hybrid model method are the main methods for RUL prediction of PEMFC. The model-driven method is to use the empirical model or the mechanism model for the RUL of PEMFC. Koltsova [
1] proposed a mechanism model of electrochemical reaction area decay, which is only suitable for laboratory studies. Robin [
2] improved on this basis and established the Pt catalyst’s dissolution mechanism model and the voltage attenuation’s semi-mechanism model. The fusion of the two mechanism models effectively improved the RUL prediction accuracy of PEMFC.
The data-driven method is to realize the RUL prediction of PEMFC by monitoring the status of the reactor system. Silva [
3] proposed a PEMFC degradation prediction method based on the Adaptive Neuro-Fuzzy Inference System (ANFIS) and evaluated the method by predicting the output voltage variation of PEMFC under constant operating conditions. Wu [
4] proposed a PEMFC performance degradation prediction method based on adaptive RVM and used an adaptive kernel width determination algorithm to predict the RUL of PEMFC.
The hybrid model method combines the advantages of various models to improve the prediction accuracy of the RUL of the reactor to a greater extent. Cheng [
5] proposed a prediction method based on the Least Square Support Vector Machine (LSSVM) and Regularized Particle Filter (RPF), which improved the RUL prediction accuracy of PEMFC. Hao Liu [
6] proposed a short-term prediction method for PEMFC based on the Group Method of Data Handling (GMDH) and Wavelet Analysis (WA). Two sets of PEMFC aging experimental data were used to verify the effectiveness of the method under different current load conditions, and more accurate prediction accuracy was obtained.
Although the method based on the mechanism model has high prediction accuracy, it is often difficult to obtain an accurate mechanism model. The data-driven method overcomes the difficulty of obtaining the mechanism model, but it requires a large number of standard data sets for training, and the quality of the data sets has a great impact on the accuracy of the prediction. The method based on the hybrid model combines the mechanism model and the data drive, takes the long and avoids the short, solves the life prediction problem of both effectively, and improves the accuracy of prediction. Therefore, aiming at the life performance characteristics of PEMFC, this paper proposes an RUL prediction method based on the hybrid model and uses the data set provided by FCLAB to verify the accuracy and effectiveness of this method.
2. Data set analysis and preprocessing
2.1. PEMFC experimental data set
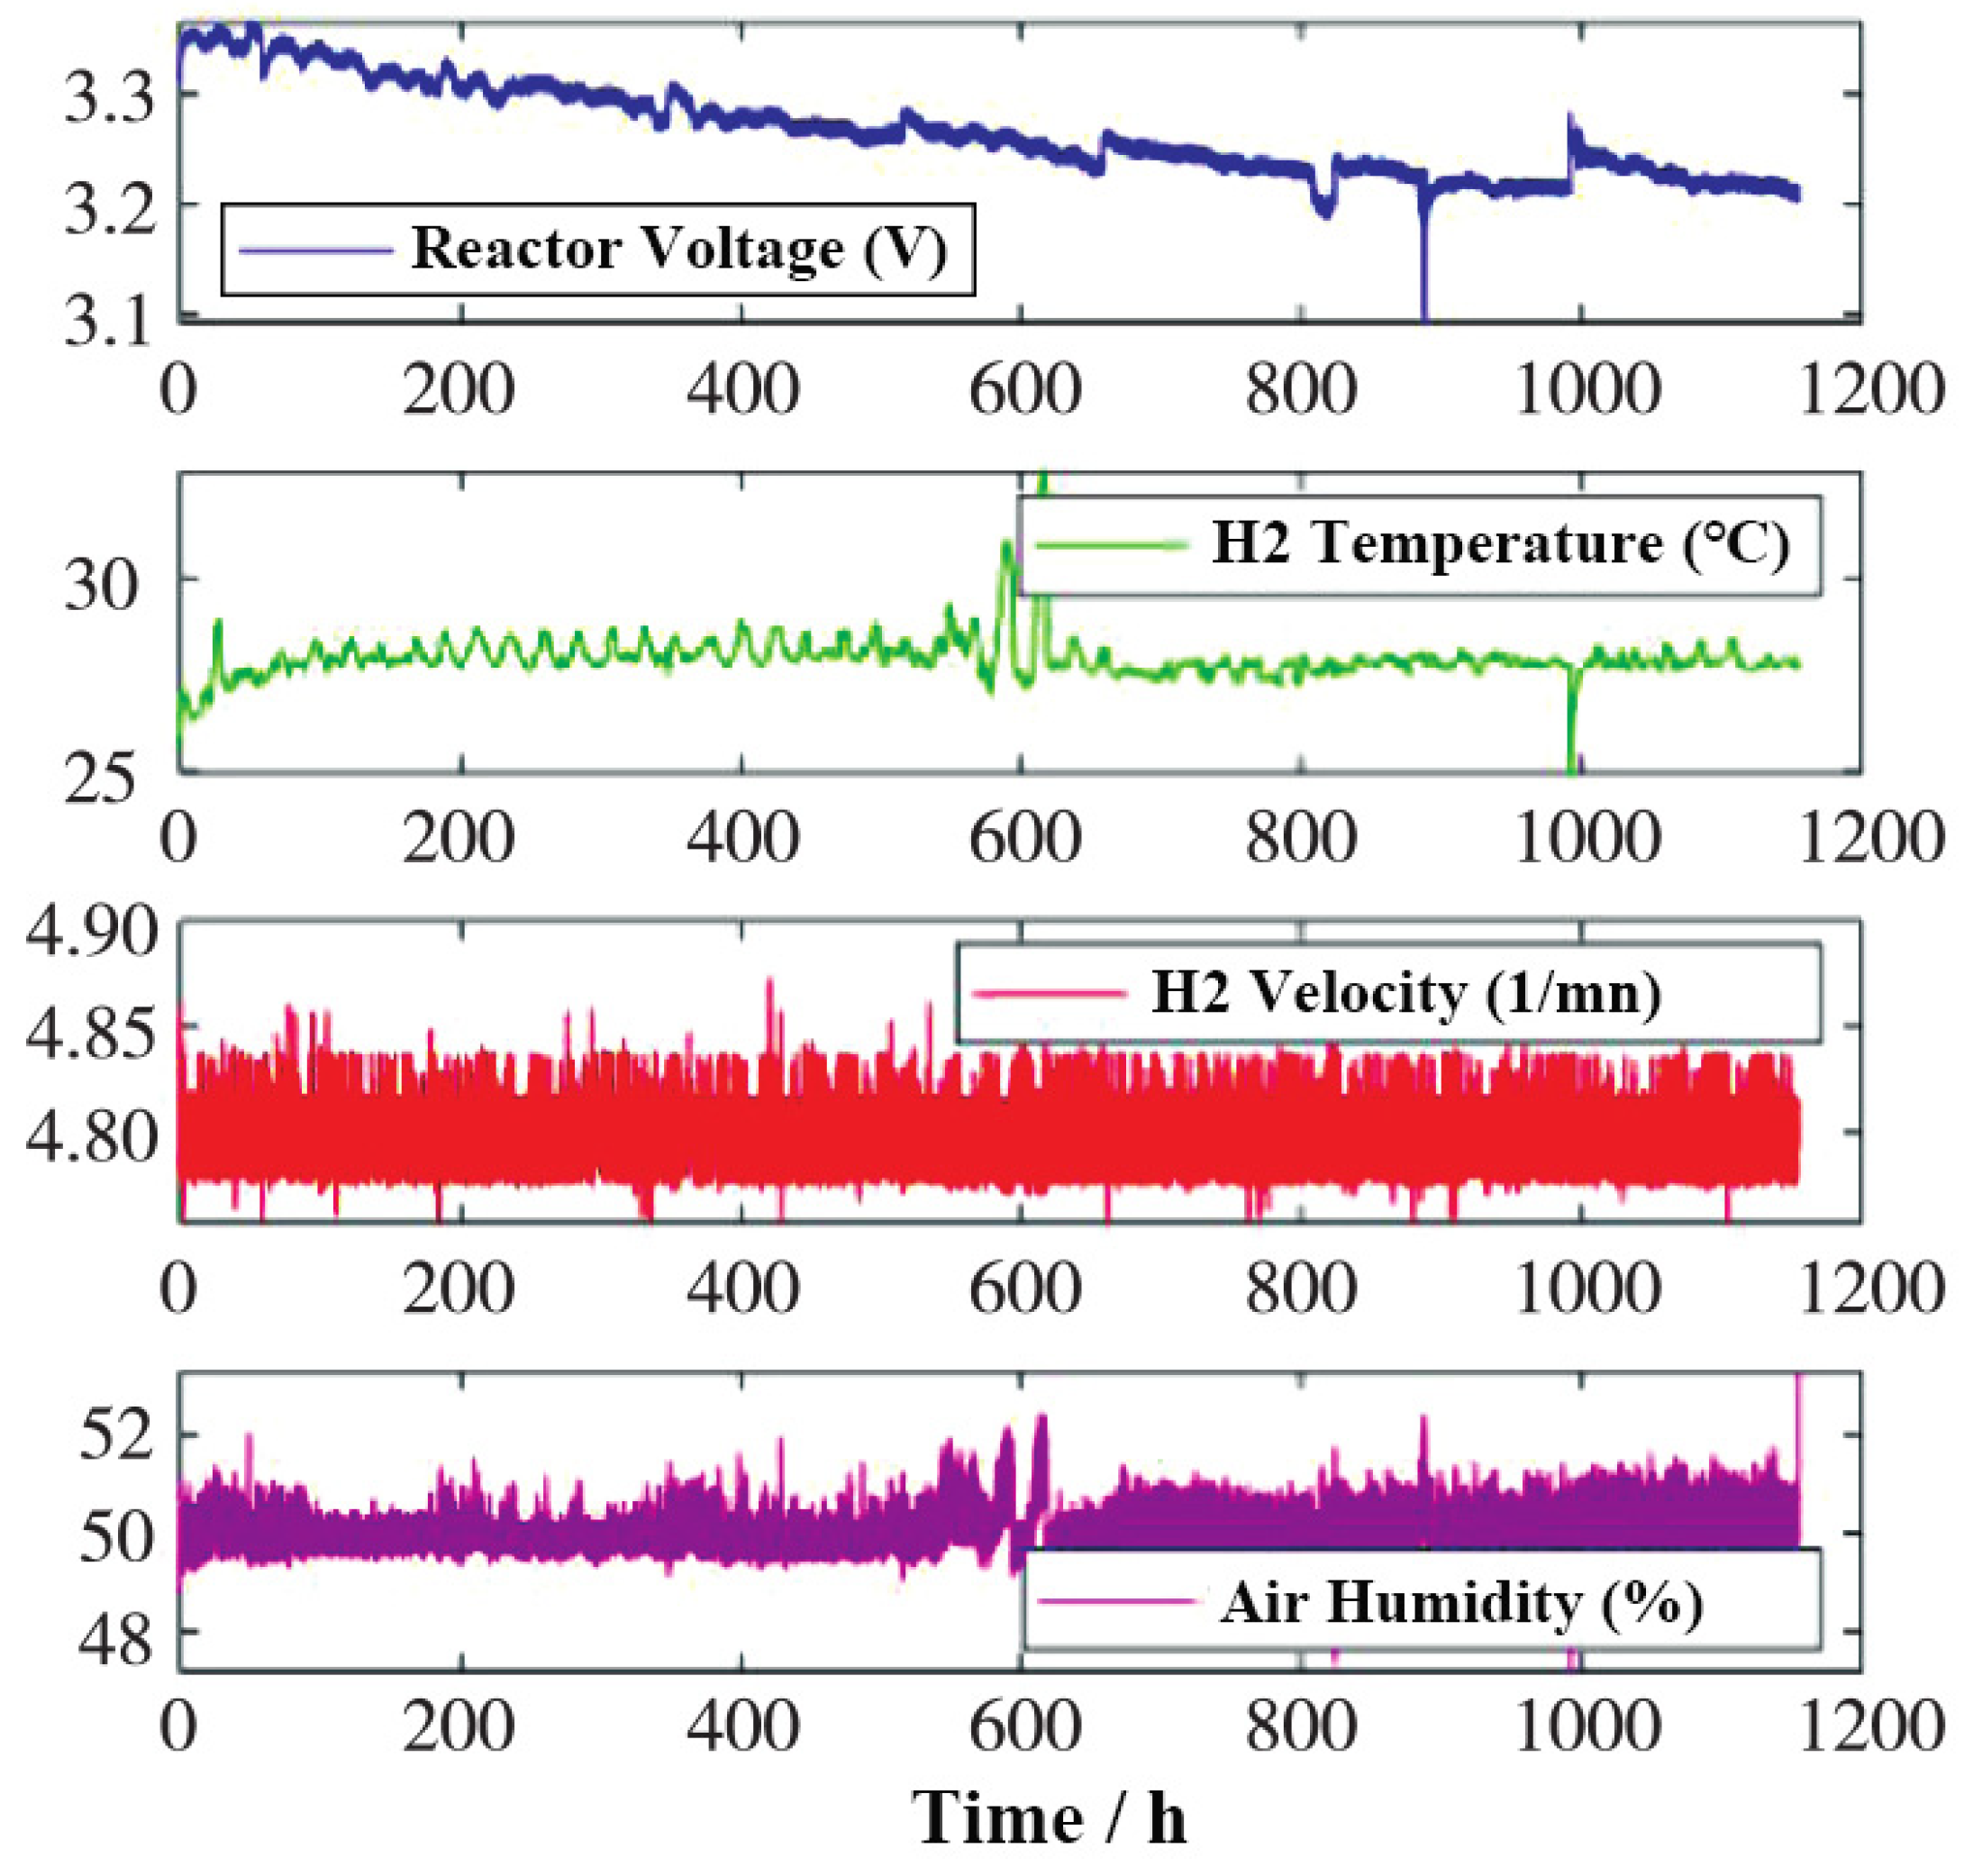
In this paper, the data set FC1 of the PEMFC reactor experiment published by FCLAB Laboratory in the IEEE PHM 2014 Data Challenge is selected. Operating conditions of PEMFC: temperature is controlled at about 60℃, the load current is controlled at 70A, and relative humidity is controlled at about 50%. The data set includes multi-dimensional data such as reactor voltage, output current, hydrogen flow rate, and hydrogen inlet and outlet temperature. Part of the data set is shown in
Figure 1.
2.2. PEMFC performance degradation index
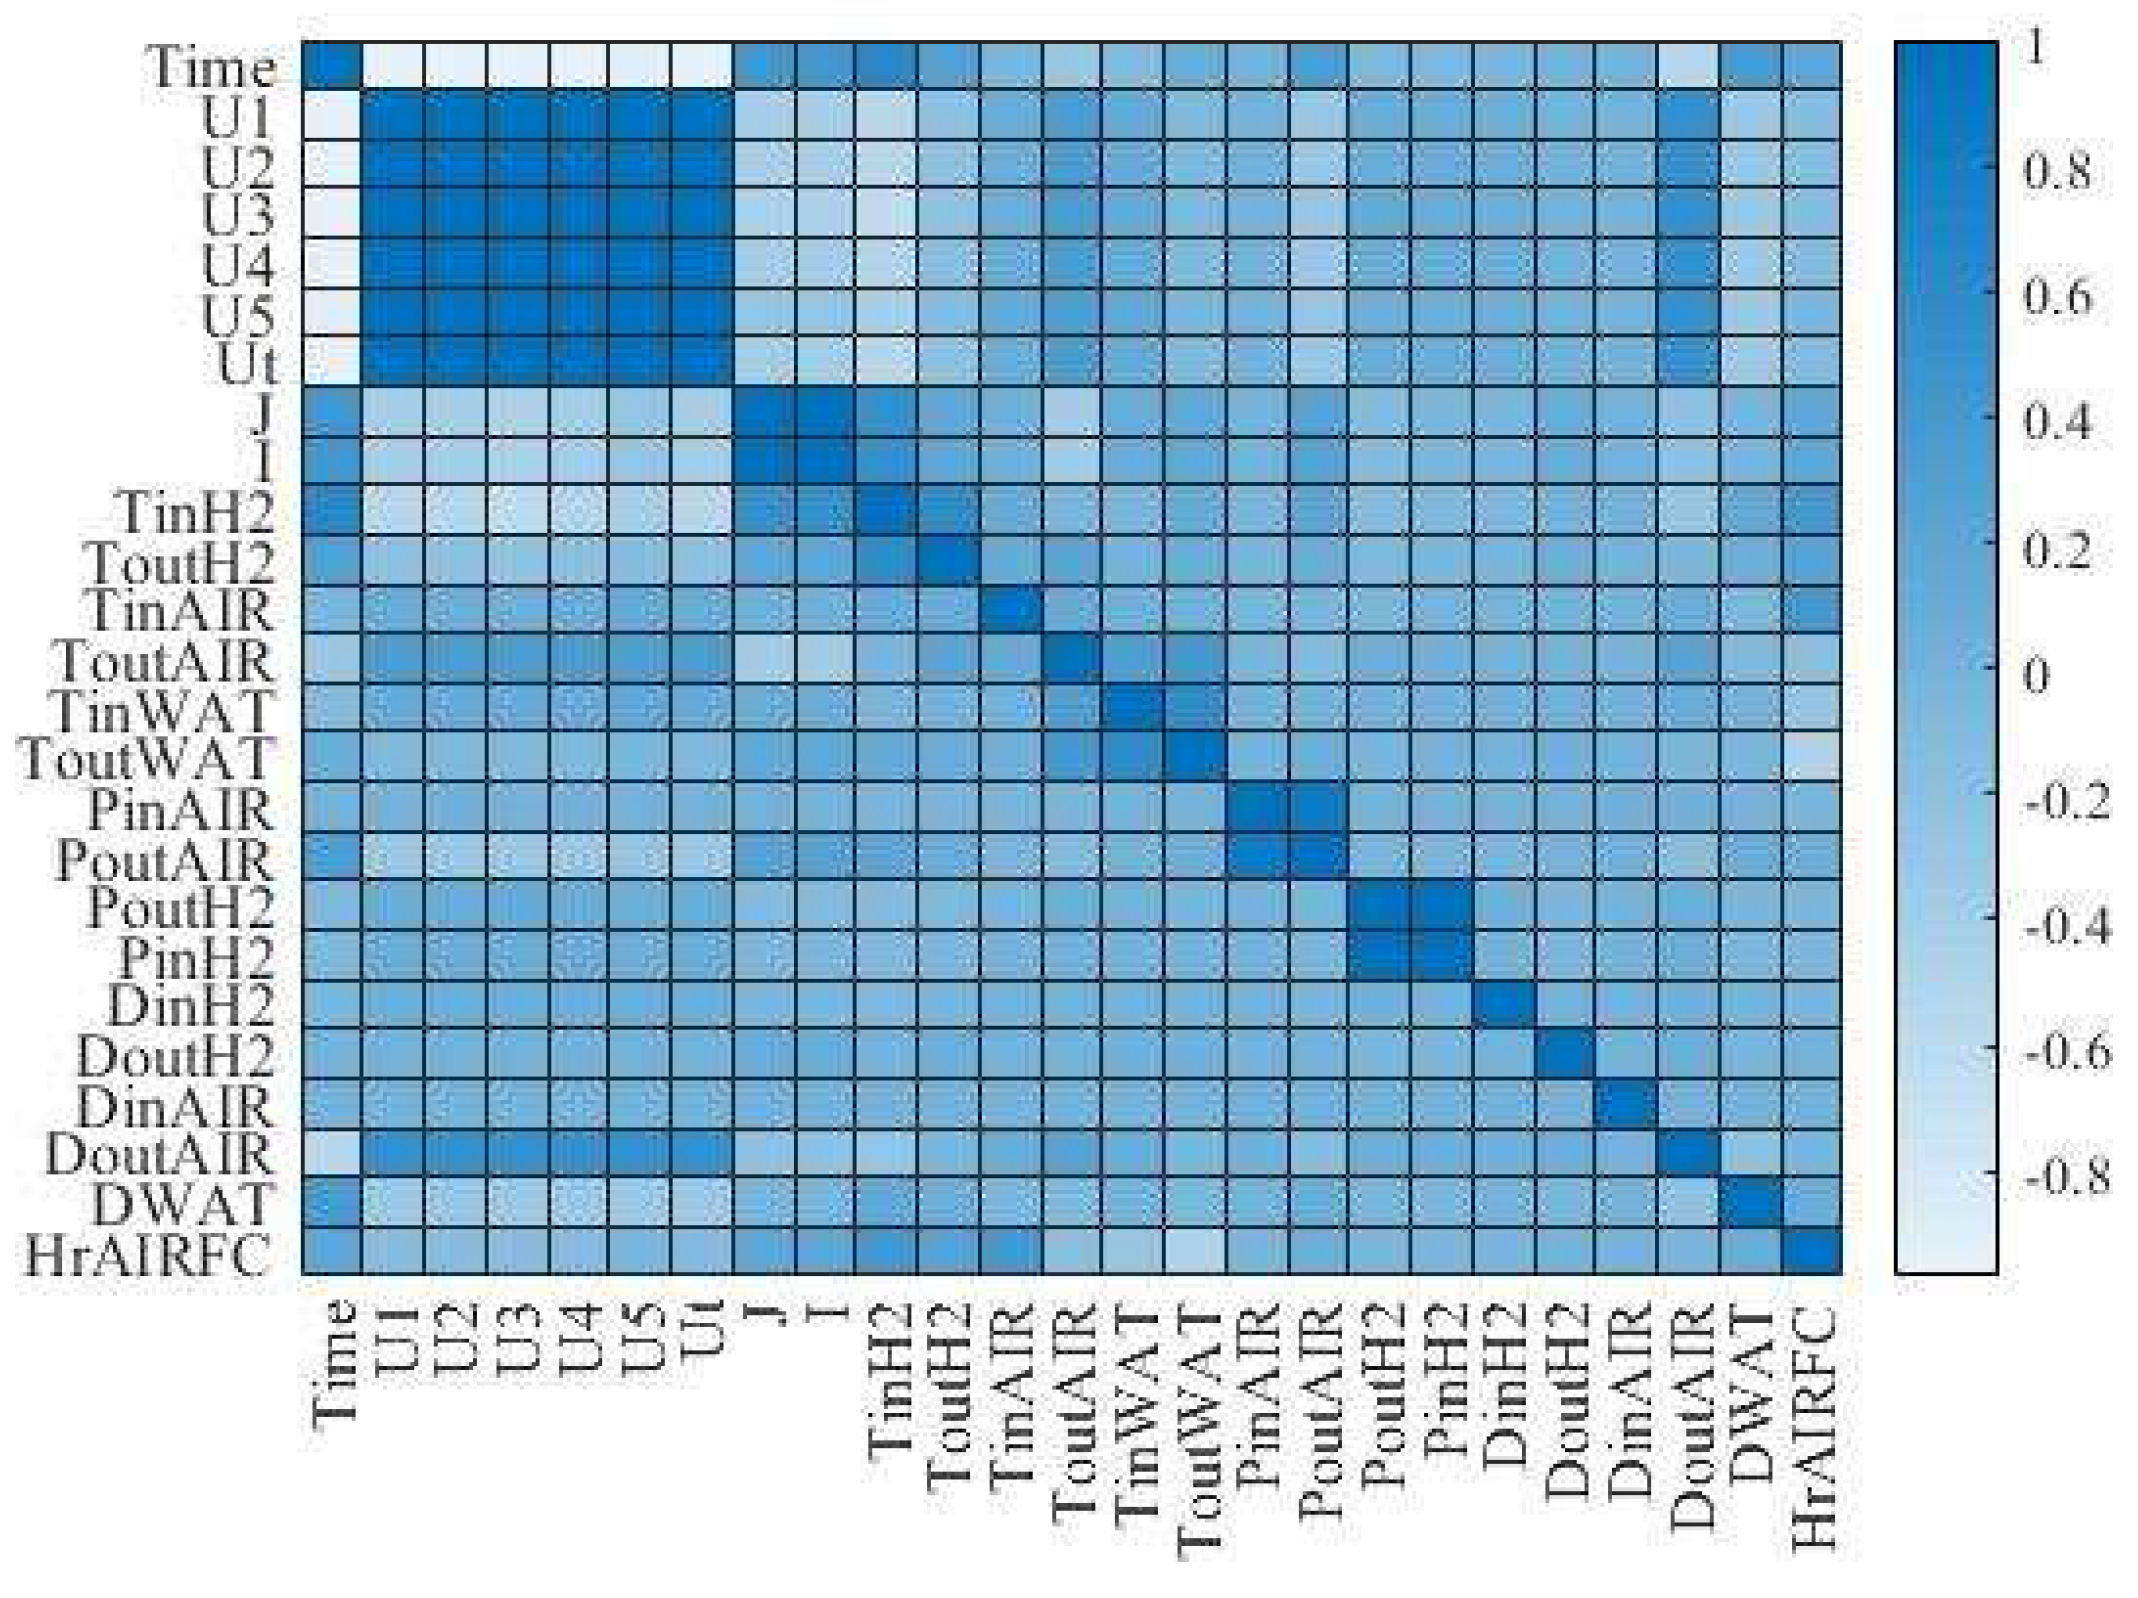
PEMFC itself has the characteristics of nonlinear and time-varying, while the system has multiple inputs and multiple outputs, which is a typical complex nonlinear control object. The variables that can be monitored include gas flow, pressure, temperature, output voltage, output current, and output power. The PEMFC data set used in this paper has as many as 24 dimensions. To clarify the relationship between data variables of each dimension and fuel cell performance degradation, and determine the index that can best represent the performance degradation of the reactor, Person correlation analysis was carried out on the data of each dimension in the data set, and the correlation matrix between variables was shown in
Figure 2.
By observing the correlation matrix diagram among the variables, it can be found that the output voltage of the reactor has an obvious negative correlation with the time. In the RUL prediction research of PEMFC, because the output voltage of the reactor is the most easily obtained data, most research methods measure the degradation of the reactor performance through the attenuation of the output voltage of the reactor and take the output voltage of the reactor as the indicator of the performance degradation of PEMFC. Therefore, the output voltage of PEMFC is also taken as the performance degradation index of the reactor.
2.3. EMD denoising
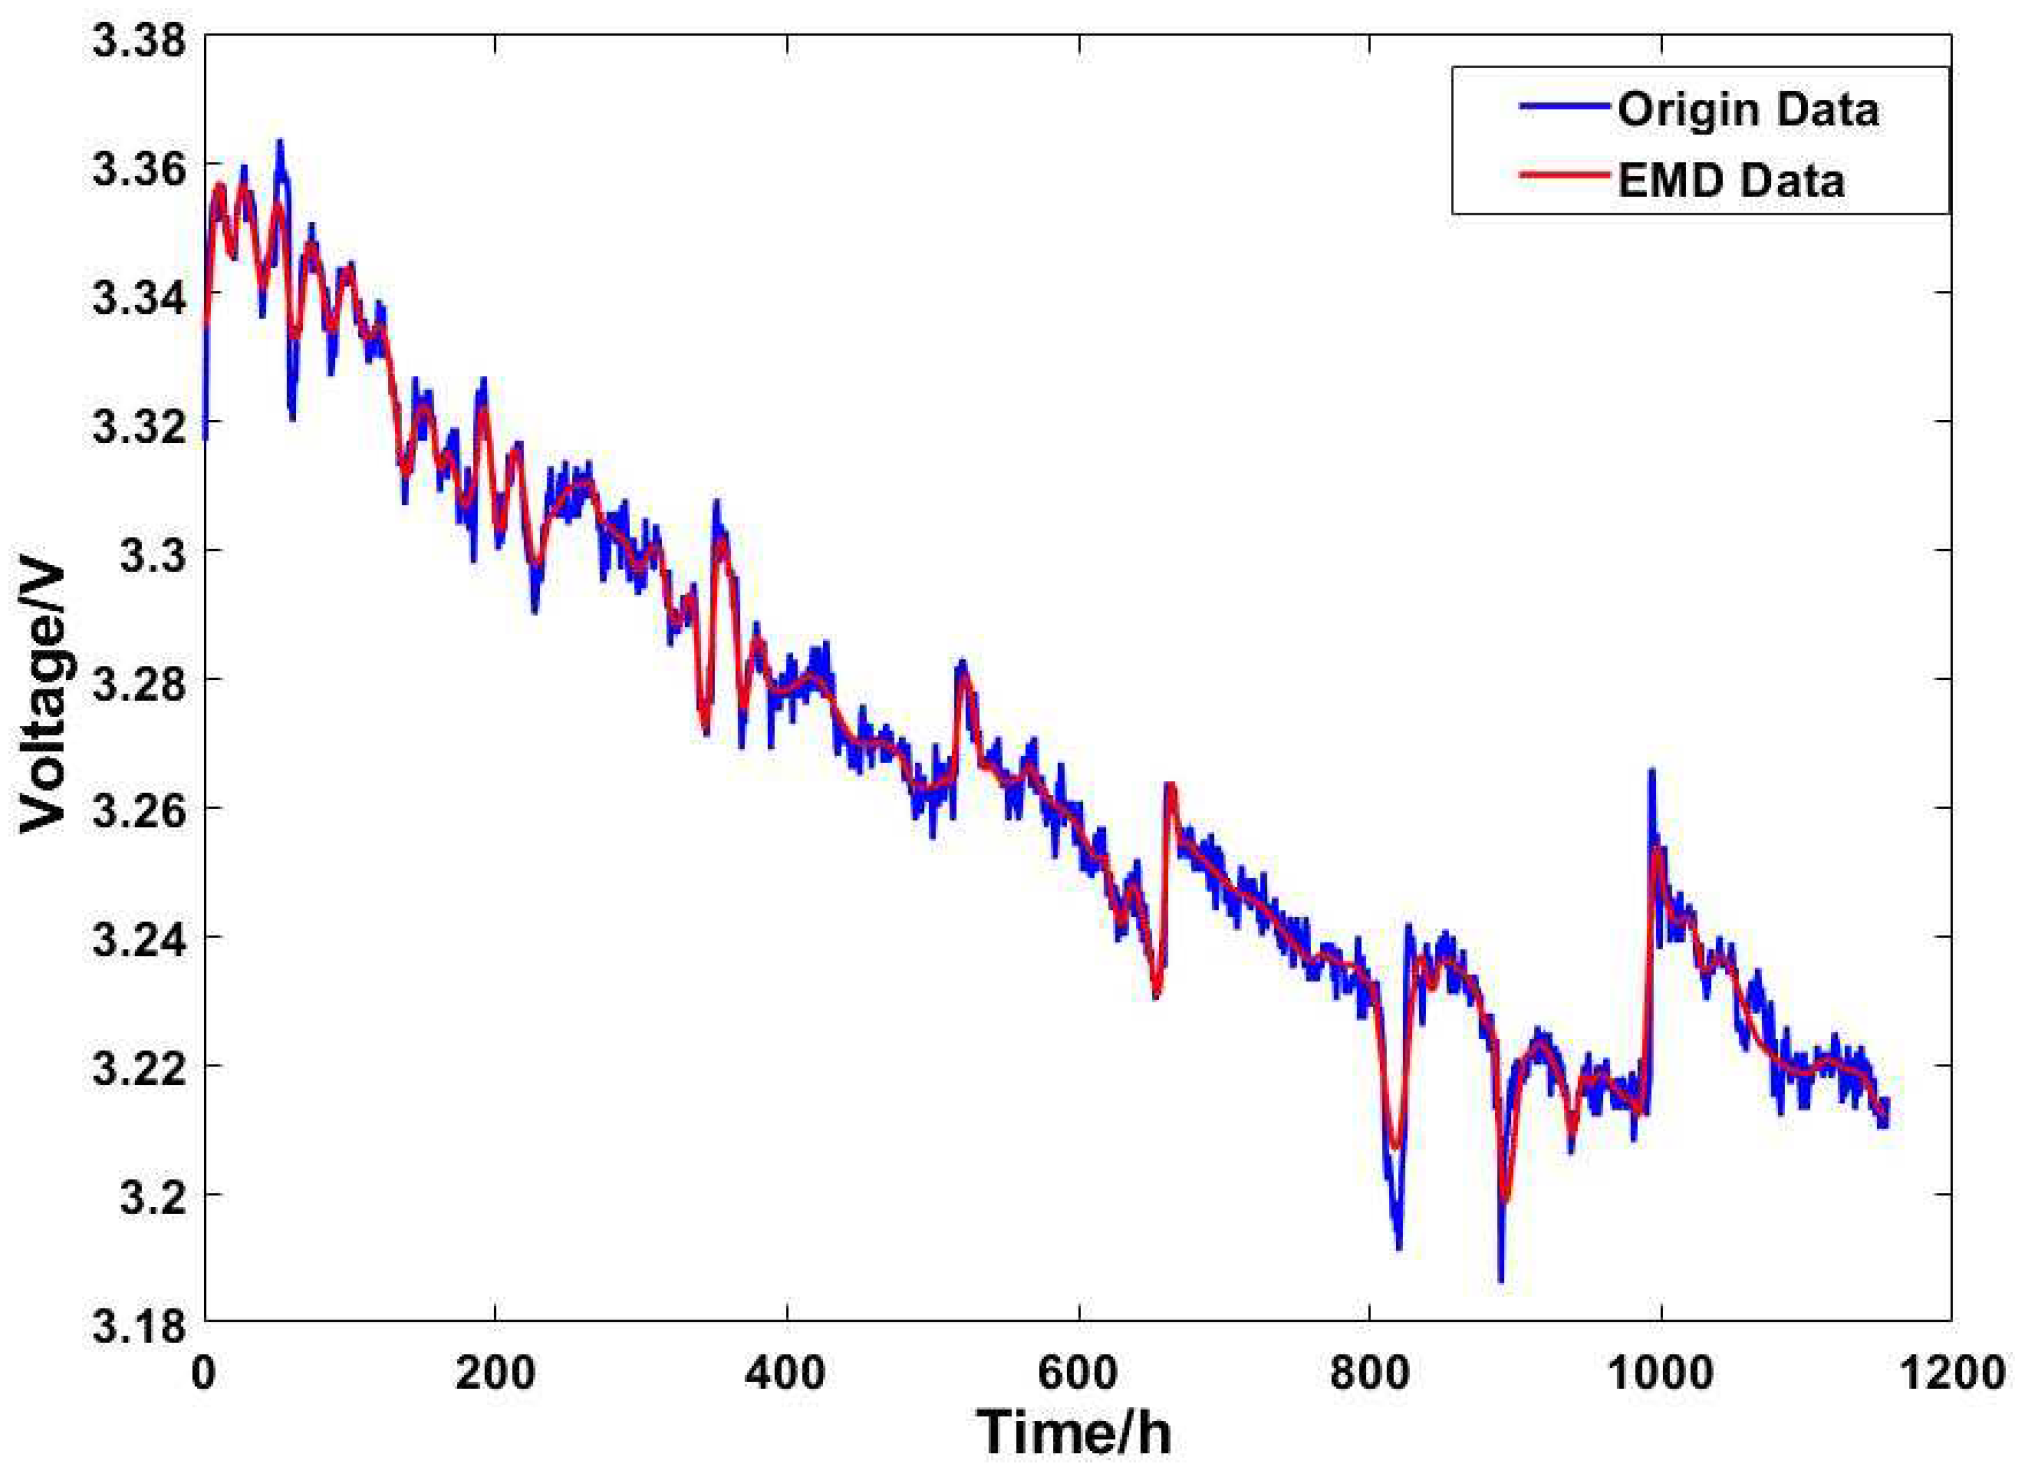
Through correlation analysis, the output voltage is determined as the performance degradation index, but there are 143862 original output voltage data, the fluctuation between adjacent output voltage data is too small, and the calculation time required for model training is too long, so it is necessary to sample the original data at equal time intervals. Considering the stable operation of the reactor for 1154h and the reduction of the calculation burden, 1h is selected as the sampling interval. Because the original voltage data contains a lot of noise and voltage spikes, if these abnormal deviations are not dealt with, it will produce a large calculation error in the training and prediction of the model.
EMD performs signal decomposition according to the time scale characteristics of the data itself, without pre-setting any basis function, and overcomes the problem that the basic function has no adaptability. EMD is a processing method to stabilize non-stationary signals. It decomposes the fluctuations and trends of different scales in the signal step by step to produce a series of data series with different characteristic scales. Each series is called an intrinsic mode function IMF. In EMD, it is assumed that any signal can be decomposed into several linear or nonlinear IMF components, the local number of zeros is the same as the number of extreme values, and the upper and lower envelope is locally symmetric about the time axis.
EMD needs to first find all the extreme points of the signal, connect the local maximum points into the upper envelope through the cubic spline curve, and connect the local minimum points into the lower envelope, the upper and lower envelope contains all the data points, and find the average value
of the upper and lower envelope.
Among them, is the upper envelope and is the lower envelope.
The original signal
is sieved, and the original signal subtracts the mean envelope to get the intermediate signal
.
Determine whether the middle signal
meets the two conditions of IMF: the number of extreme points and the number of zero points in the entire time course is equal or at most 1 difference; At any time, the average value of the upper envelope formed by local maximum points and the lower envelope formed by local minimum points is zero, that is, the upper and lower envelope are locally symmetric concerning the time axis. If so, the signal is an IMF weight; If not, the above steps are repeated until the decomposed signal meets the IMF condition after K times to obtain the first IMF component
of the original signal.
Among them, represents the IMF component of the highest frequency in the original signal , and the remaining component is obtained by subtracting from the original signal .
The second IMF component
can be obtained by screening
, and the remaining component
can be obtained by subtracting
from
. And so on, until the last remaining component
can no longer be decomposed.
After n iterations, becomes a monotone function, the remaining component becomes a residual component, and the sum of all IMF components and residual components is the original signal .
EMD has obvious advantages in processing non-stationary and nonlinear data and is suitable for analyzing nonlinear and non-stationary signal sequences with high signal-to-noise ratios. Therefore, this paper uses the EMD method to de-noise the sampled output voltage data and the output voltage data after EMD de-noising is shown in
Figure 3.
3. Global prediction framework
3.1. MK-RVM model
Multi-kernel learning based on RVM combines kernel functions with different characteristics, to obtain the advantages of multiple kernel functions, and can combine the characteristics of global and local kernel functions when dealing with complex data, to improve the learning and generalization ability of RVM.
The multi-kernel function
is the linear combination of the linear kernel function
, Gaussian kernel function
, polynomial kernel function
, and Sigmoid kernel function
, which is used to describe the global and local trend of battery capacity degradation. Its mathematical expression is shown in equation 6:
Among them,
,
,
and
are the weight, and is also the key of MK-RVM. Since there is no reasonable and universal criterion for setting the weight coefficient of the kernel function, it is often determined based on empirical selection, experimental comparison, large-scale search, or cross-verification method. Therefore, this paper introduces a Bayesian optimization algorithm, which takes the minimum Root Mean Square Error (RMSE) as the optimization objective, and realizes the parameter self-optimization of the weight coefficient of the kernel function.
Among them, represents the actual voltage of the reactor, represents the predicted voltage of the reactor.
3.2. Bayesian optimization algorithm
The Bayesian optimization algorithm belongs to the black box optimization algorithm, which updates the posterior probability distribution based on the known observation points and the prior probability distribution of the objective function to ensure the optimal weight coefficient of the kernel function. Bayesian optimization goals are defined as:
Among them, is the final result of parameter optimization, and is the objective function to be optimized.
Set the parameter to be optimized as
X = {
x1,
x2, …,
xn}, After Bayesian optimization iteration, the data set is
. Suppose that the observation points of the Gauss process obey the Gaussian distribution as follows:
Among them, B is the covariance matrix:
According to Bayes’ theorem:
Continuous iterative updates make , ultimately ensuring optimal parameters. The algorithm flow is as follows:
Input: objective function , collection function ;
Output: parameter vector ;
1. Initialize parameter vector x1;
2. ;
3. Maximize the collection function to get the next evaluation point: ;
4. Evaluate the objective function value ;
5. Integrate data: , and update the probabilistic proxy model;
6. .
3.3. Voltage recovery model
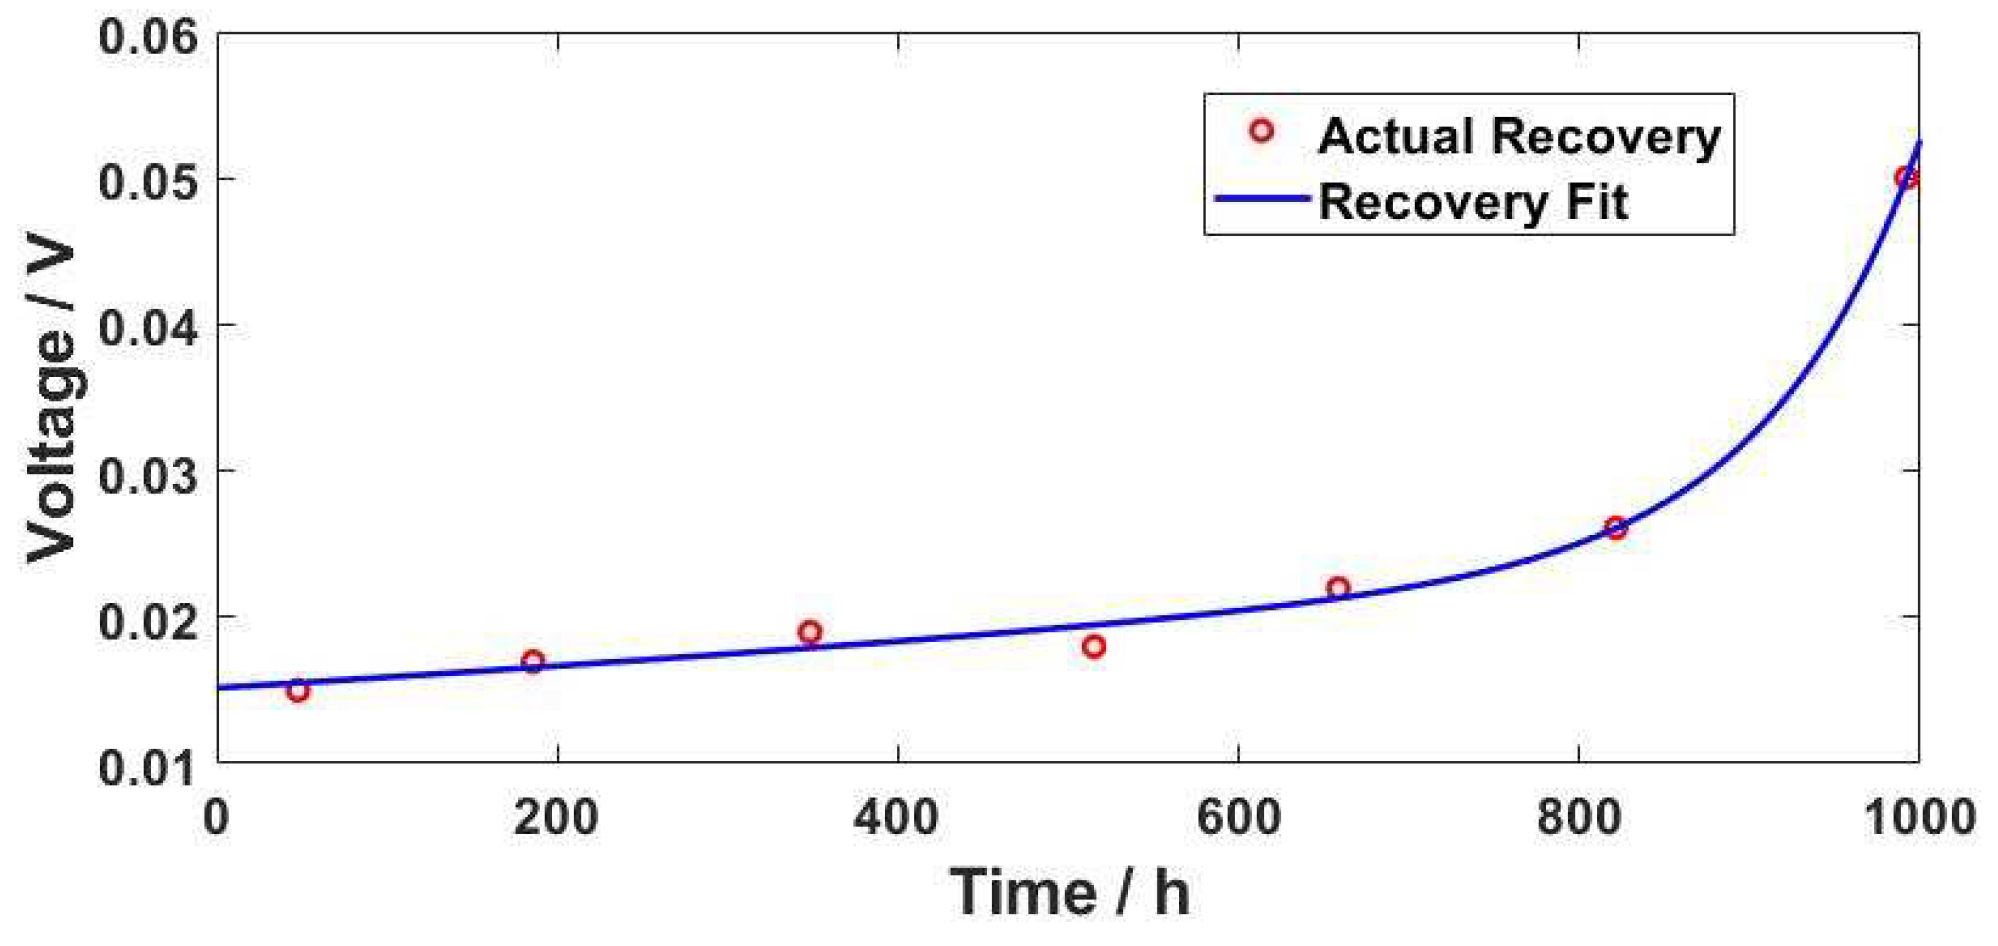
When conducting fuel cell experiments, FCLAB not only needs to monitor the output voltage and working condition of the reactor in real time but also needs to measure the polarization curve and electrochemical impedance spectrum. Therefore, a reactor start-stop operation is performed at an interval of about 160h during the experiment. The start-stop operation time of the reactor is shown in
Table 1.
Since the time interval of the FCLAB start-stop reactor is relatively fixed, the corresponding voltage recovery model can be established according to the voltage recovery degree of the start-stop time point in the training data, and the voltage recovery prediction of the predicted data start-stop point can be realized. According to the start-stop voltage recovery data of FCLAB, this paper chooses the double-exponential empirical model as the start-stop voltage recovery model of the reactor, as shown in Formula 12. The comparison between the recovery amplitude of the model at the start-stop time point and the actual result is shown in
Figure 4.
Among them, is the start-stop operation time, is the model parameter.
3.4. Prediction framework
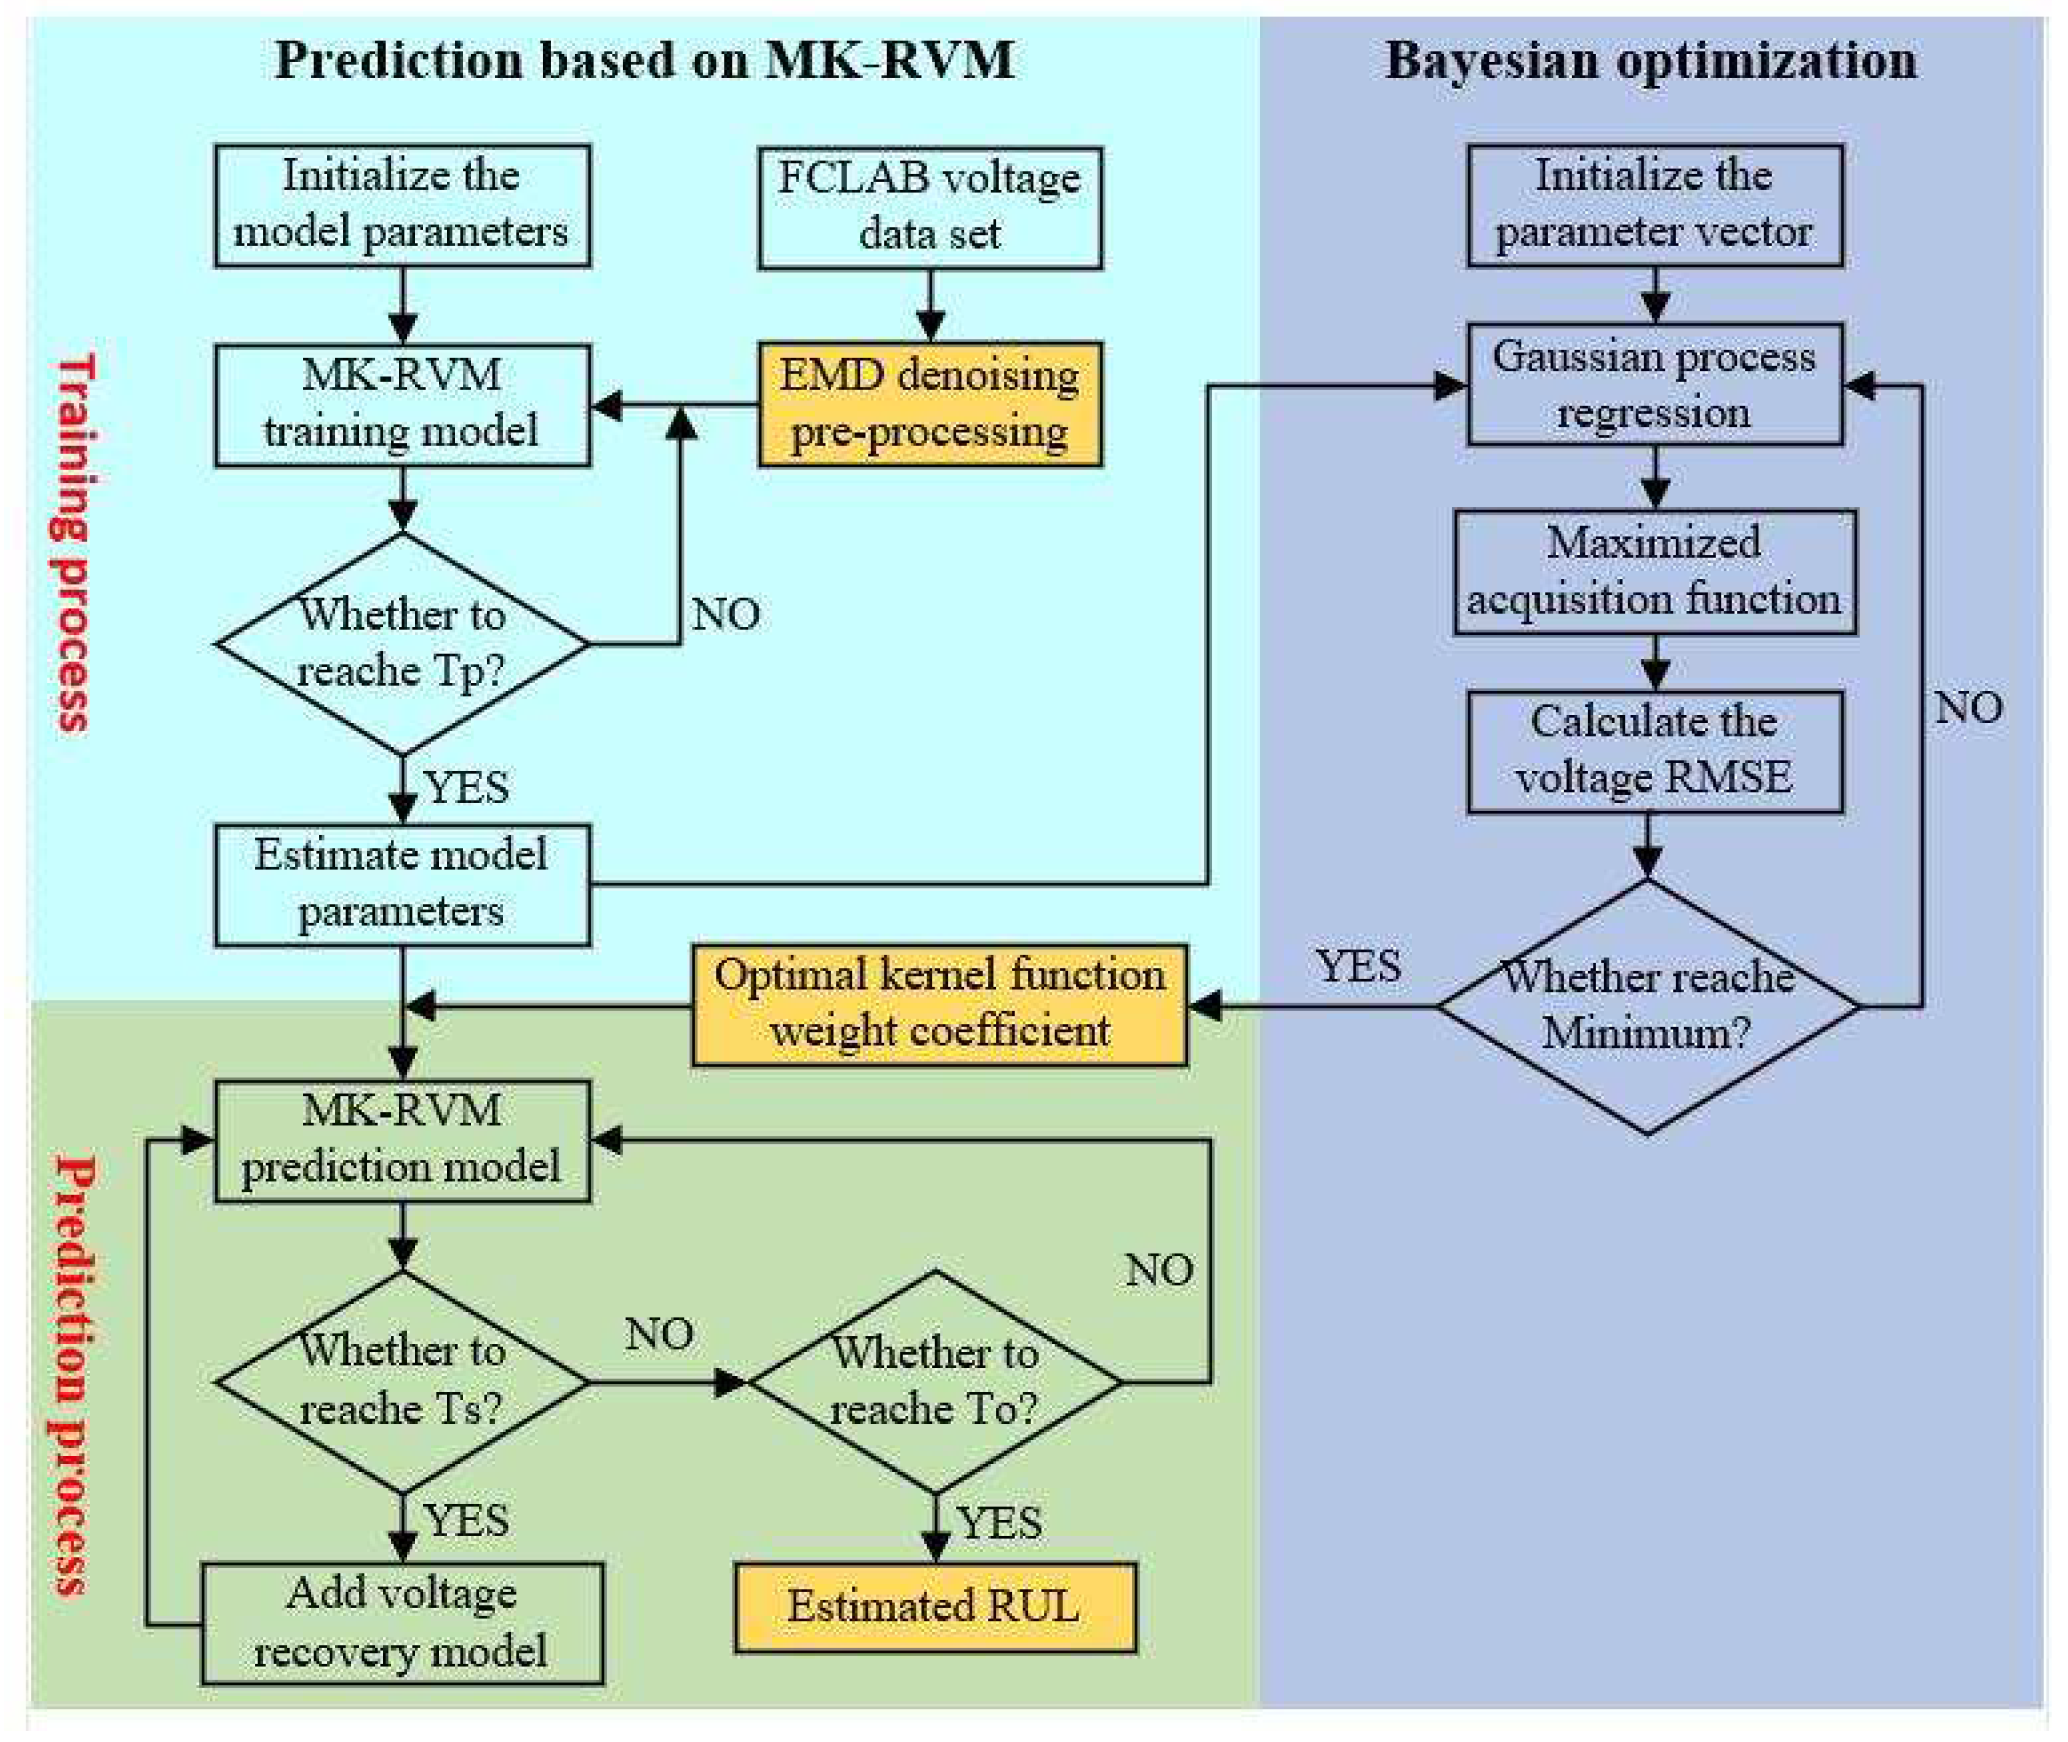
As the main force of clean energy, fuel cells have higher requirements for the detection and management of their health status. To further improve the prediction accuracy of fuel cells, this paper takes voltage as a health indicator and proposes a method for predicting the RUL of PEMFC based on the voltage recovery model and Bayesian optimization MK-RVM. The overall framework of the prediction method is shown in
Figure 5 below.
The overall prediction process is as follows:
Step 1: By correlation analysis, the output voltage of the PEMFC is selected as the performance degradation index of the reactor.
Step 2: The original voltage data is denoised by EMD. The denoised data is bounded by the prediction starting point and divided into training data sets and test data sets.
Step 3: Put the training data after data preprocessing into the training model of MK-RVM to train, and judge whether the RUL prediction starting point is reached. If the prediction starting point is reached, the model parameters of MK-RVM are estimated; otherwise, the model training is continued.
Step 4: The model parameters of MK-RVM are optimized by Bayesian, and the model parameters are updated by Gaussian process regression and maximized acquisition function.
Step 5: The RMSE of the reactor predicted voltage is taken as the objective function of Bayesian optimization. If RMSE reaches the minimum, the optimal kernel function weight coefficient is obtained; Otherwise, return to Step 4 to continue updating model parameters.
Step 6: Using the weight coefficient of the optimal kernel function obtained by Bayesian optimization, the MK-RVM prediction model is updated.
Step 7: Determine whether the start-stop time point of the reactor is reached. If the start-stop time point is reached, add the voltage recovery model to the MK-RVM prediction model; Otherwise, the RUL of the PEMFC is predicted directly.
Step 8: Determine whether the predicted voltage value of MK-RVM reaches the threshold of RUL. If it reaches the voltage value of the RUL of PEMFC, output the predicted RUL of the reactor; Otherwise, continue to predict the voltage value of the PEMFC.
Step 9: The uncertainty expression of RUL is realized through repeated testing to reduce the contingency of prediction and improve the generalization ability of the model.
4. Experiment and discussion
4.1. RUL
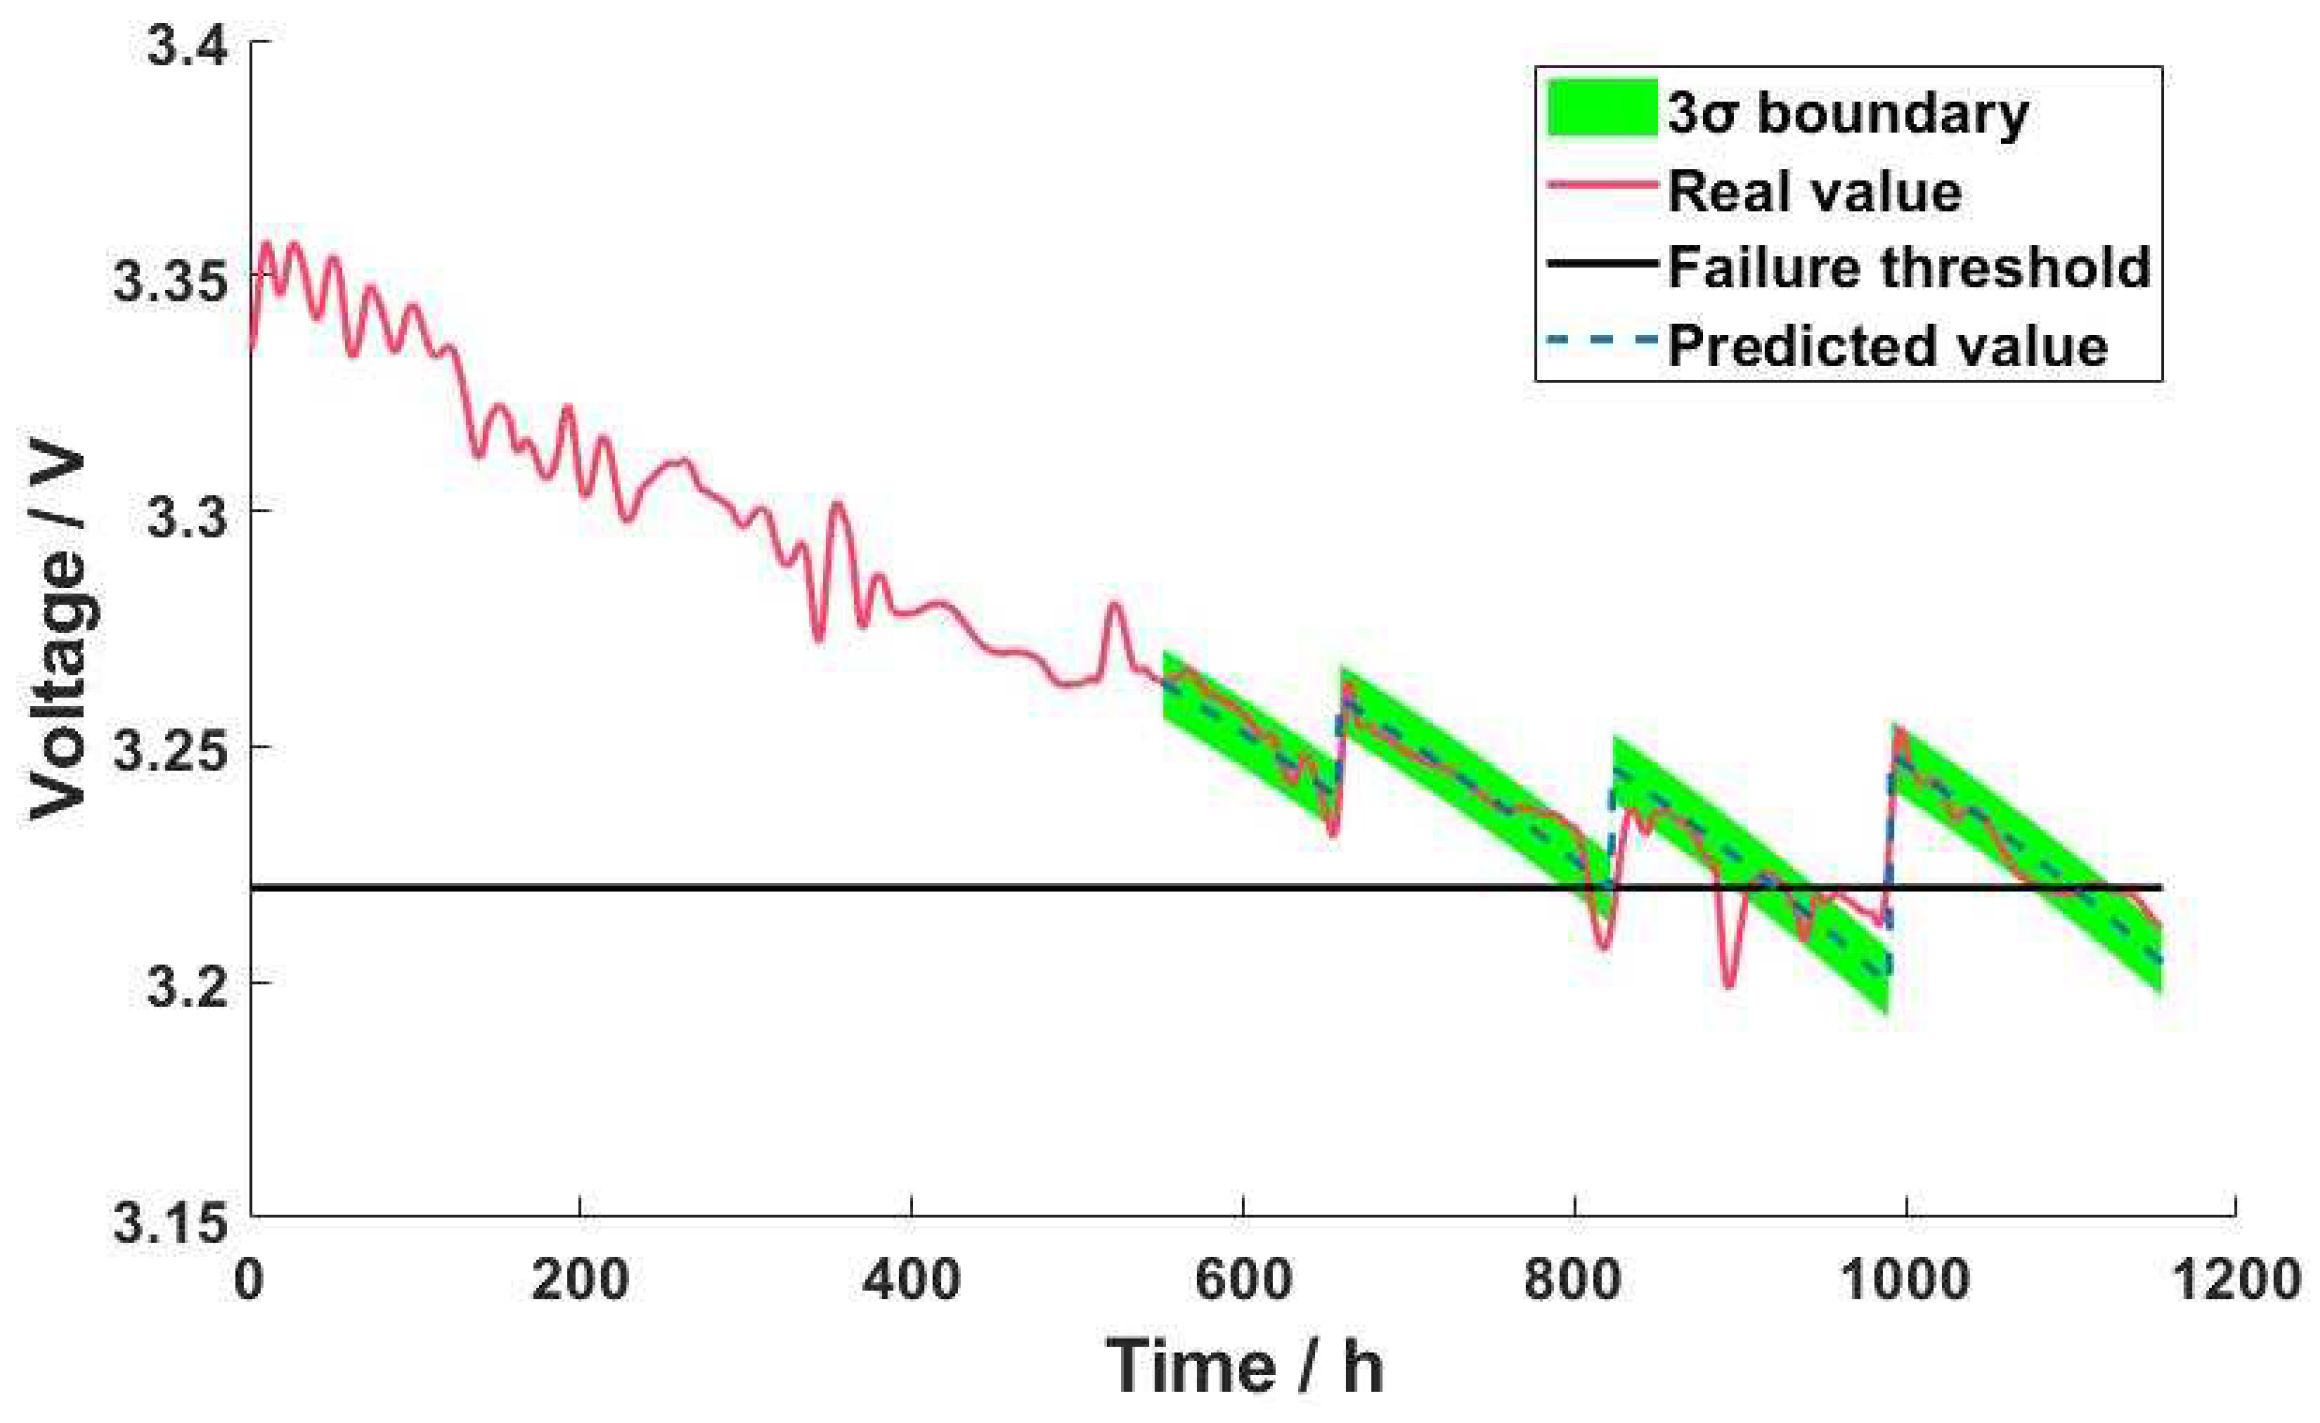
FCLAB provides limited experimental data on fuel cell life, so this paper chooses 3.22V voltage as the failure threshold of the reactor, that is, 95.9% of the initial total voltage, and the failure time of the reactor is 808h. In addition, this paper chooses to set the prediction starting point as 550h, training data as [0,550h], test data as [551,1154], and the corresponding RUL time as 258h.
During the experiment, the training data is first put into the MK-RVM for training, and then the RMSE of voltage prediction is used as the objective function of Bayesian optimization, and the weight coefficient of the kernel function is self-optimized by the Bayesian optimization algorithm. When the optimal solution is close and tends to be stable, the optimal weight coefficient of the kernel function is obtained. In the RUL prediction stage, the optimal kernel function weight coefficient is substituted into the prediction model. The uncertainty expression of the predicted result can better guide the RUL prediction of the reactor than the single estimated result. To avoid the contingency of the prediction results of MK-RVM, the confidence of the prediction results can be verified by repeated prediction of the model many times, and the confidence interval with a 95% significance level is added to the parameter estimation process and prediction process. The prediction results are shown in
Figure 6.
Adding the voltage recovery model of reactor start-stop can effectively improve the accuracy of RUL prediction and help capture the trend of reactor voltage decay. The subsequent experimental analysis only considers the prediction results under the addition of the recovery model.
4.2. Prediction result analysis
To evaluate the reliability and validity of RUL prediction results, this paper selected Mean Square Error (MAE), RMSE, and Relative Accuracy (RA) as a model performance evaluation index, MAE and RMSE mainly reflect the overall deviation between the predicted value and the true value, RA is the relative prediction accuracy of RUL.
Among them, is the actual voltage value of the reactor, the predicted voltage value of the pile, is the actual remaining using life of the pile, and is the predicted remaining service life of the reactor.
The prediction results based on the voltage recovery model and MK-RVM are shown in
Table 2. When the prediction starting point is set to 550h, the predicted and actual RUL values are 270h and 258h, respectively. The MK-RVM algorithm after Bayesian optimization greatly shortens the running time and is conducive to the fast prediction of PEMFC in long-term operation. The MK-RVM algorithm adding the voltage recovery model greatly improves the prediction accuracy and is conducive to the accurate prediction of PEMFC in long-term operation.
4.3. Discuss
It is difficult to accurately predict the RUL of PEMFC, which is affected by many environmental factors in actual operation. Through EMD denoising, the overall attenuation trend of the voltage can be restored to a large extent. However, due to the uncertainty fluctuation of the output voltage, it is necessary to train the training set several times during the training of MK-RVM to improve the prediction accuracy of RUL. By using the Bayesian optimization algorithm, the RMSE of MK-RVM is taken as the objective function, which can realize the parameter self-optimization of the weight coefficient of kernel function, and obtain higher prediction accuracy and faster computing efficiency.
According to the experimental data in
Table 2, RMSE, RA, and confidence interval based on voltage recovery model and Bayesian optimization MK-RVM are far superior to the other two algorithms, which are more suitable for the long-term RUL prediction of PEMFC and have better generalization ability.
5. Conclusion
In this paper, according to the PEMFC data set provided by FCLAB, a prediction method based on the voltage recovery model and Bayesian optimization MK-RVM is proposed to predict the RUL of PEMFC. In the whole prediction framework, EMD de-noising of the training data is firstly carried out, then MK-RVM is used for model training, and then the Bayesian optimization algorithm is adopted to realize parameter self-optimization of the weight coefficient of the kernel function, and then the optimal weight coefficient of the kernel function is updated to the prediction model, and finally, the voltage recovery model is added to the prediction model. The prediction accuracy of the RUL of PEMFC is greatly improved. This method can not only realize the long-term prediction of the RUL of PEMFC but also realize the accurate prediction, which has great practical value.
6. Patents
This work was supported in part by the National Natural Science Foundation of China under Grant 62204019.
References
- Koltsova Eleonora, Vasilenko Violetta, et al: Mathematical Simulation of PEMFC Platinum Cathode Degradation Accounting Catalyst’s Nanoparticles Growth. Chemical Engineering Transactions, 70, 1301-1308(2019).
- Robin C, Gérard M, et al: Proton exchange membrane fuel cell model for aging predictions: Simulated equivalent active surface area loss and comparisons with durability tests. Journal of Power Sources, 326, 417-427(2016).
- Silva R, Gouriveau R, et al: Proton exchange membrane fuel cell degradation prediction based on Adaptive Neuro-Fuzzy Inference Systems. International Journal of Hydrogen Energy, 39(21), 11128-11144(2014).
- Yiming Wu, Elena Breaz, Fei Gao, et al: Prediction of PEMFC stack aging based on Relevance Vector Machine. 2015 IEEE Transportation Electrification Conference and Expo (ITEC), USA, 2015.
- Yujie Cheng, Noureddine Zerhouni, Chen Lu: A hybrid remaining useful life prognostic method for proton exchange membrane fuel cell. International Journal of Hydrogen Energy, 43(27), 12314-12327(2018).
- Hao Liu, Jian Chen, et al: Remaining useful life estimation for proton exchange membrane fuel cells using a hybrid method. Applied Energy, 237, 910-919(2019).
- Fan Liming, Wang Kunsheng, Qian Cheng: Remaining Useful Life Prediction of Lithium Battery Based on Physics of Failure and Particle Filtering. Journal of Ordnance Equipment Engineering, 41(9), 171-175(2020).(in Chinese).
- Wang Dong, Miao Qiang, Pecht Michael: Prognostics of lithium-ion batteries based on relevance vectors and a conditional three-parameter capacity degradation model. Journal of Power Sources, 239, 253-264(2013).
- Zhou Jianbao: Research on Lithium-ion Battery Remaining Useful Life Estimation with Relevance Vector Machine. Harbin: Harbin Institute of Technology, 2013. (in Chinese).
- Bing Long, Weiming Xian, Lin Jiang, Zhen Liu: An improved autoregressive model by particle swarm optimization for prognostics of lithium-ion batteries. Microelectronics Reliability, 53(6), 821-831(2013).
- Xiujuan Zheng, Huajing Fang: An integrated unscented Kalman filter and relevance vector regression approach for lithium-ion battery remaining useful life and short-term capacity prediction. Reliability Engineering and System Safety, 144,74-82(2015).
- Zhang Songcan, Pu Jiexin, Si Yanna, Sun Wenna: Survey on Application of Ant Colony Algorithm in Path Planning of Mobile Robot. Computer Engineering and Applications, 56(08),10-19(2020). (in Chinese).
- Wang Lin, Lv Shengxiang, Zeng Yu: Literature survey of fruit fly optimization algorithm. Control and Decision, 32(07), 1153-1162(2017). (in Chinese).
- Huang Shaorong: Survey of particle swarm optimization algorithm. Computer Engineering and Design, 30(08), 1977-1980(2009). (in Chinese).
- Yanqing Zhang, Zhonggang Yin, Wei Li, Jing Liu, and Yanping Xu: Finite Control Set Model Predictive Torque Control Using Sliding Model Control for Induction Motor. China Electrotechnical Society Transactions on Electrical Machines and Systems, vol. 5, no. 3, pp. 262-270. Chongqing(2021).
|
Disclaimer/Publisher’s Note: The statements, opinions and data contained in all publications are solely those of the individual author(s) and contributor(s) and not of MDPI and/or the editor(s). MDPI and/or the editor(s) disclaim responsibility for any injury to people or property resulting from any ideas, methods, instructions or products referred to in the content. |
© 2023 by the authors. Licensee MDPI, Basel, Switzerland. This article is an open access article distributed under the terms and conditions of the Creative Commons Attribution (CC BY) license (http://creativecommons.org/licenses/by/4.0/).
