Submitted:
21 June 2023
Posted:
21 June 2023
You are already at the latest version
Abstract
Keywords:
1. Introduction
2. Materials and Methods
Strain collection
Βeta-lactam AST
BMD for cefiderocol AST
DD for cefiderocol AST
MIC test strip for cefiderocol AST
Data analysis
Whole genome sequencing and typing
Detection of β-lactam resistance genes
3. Results
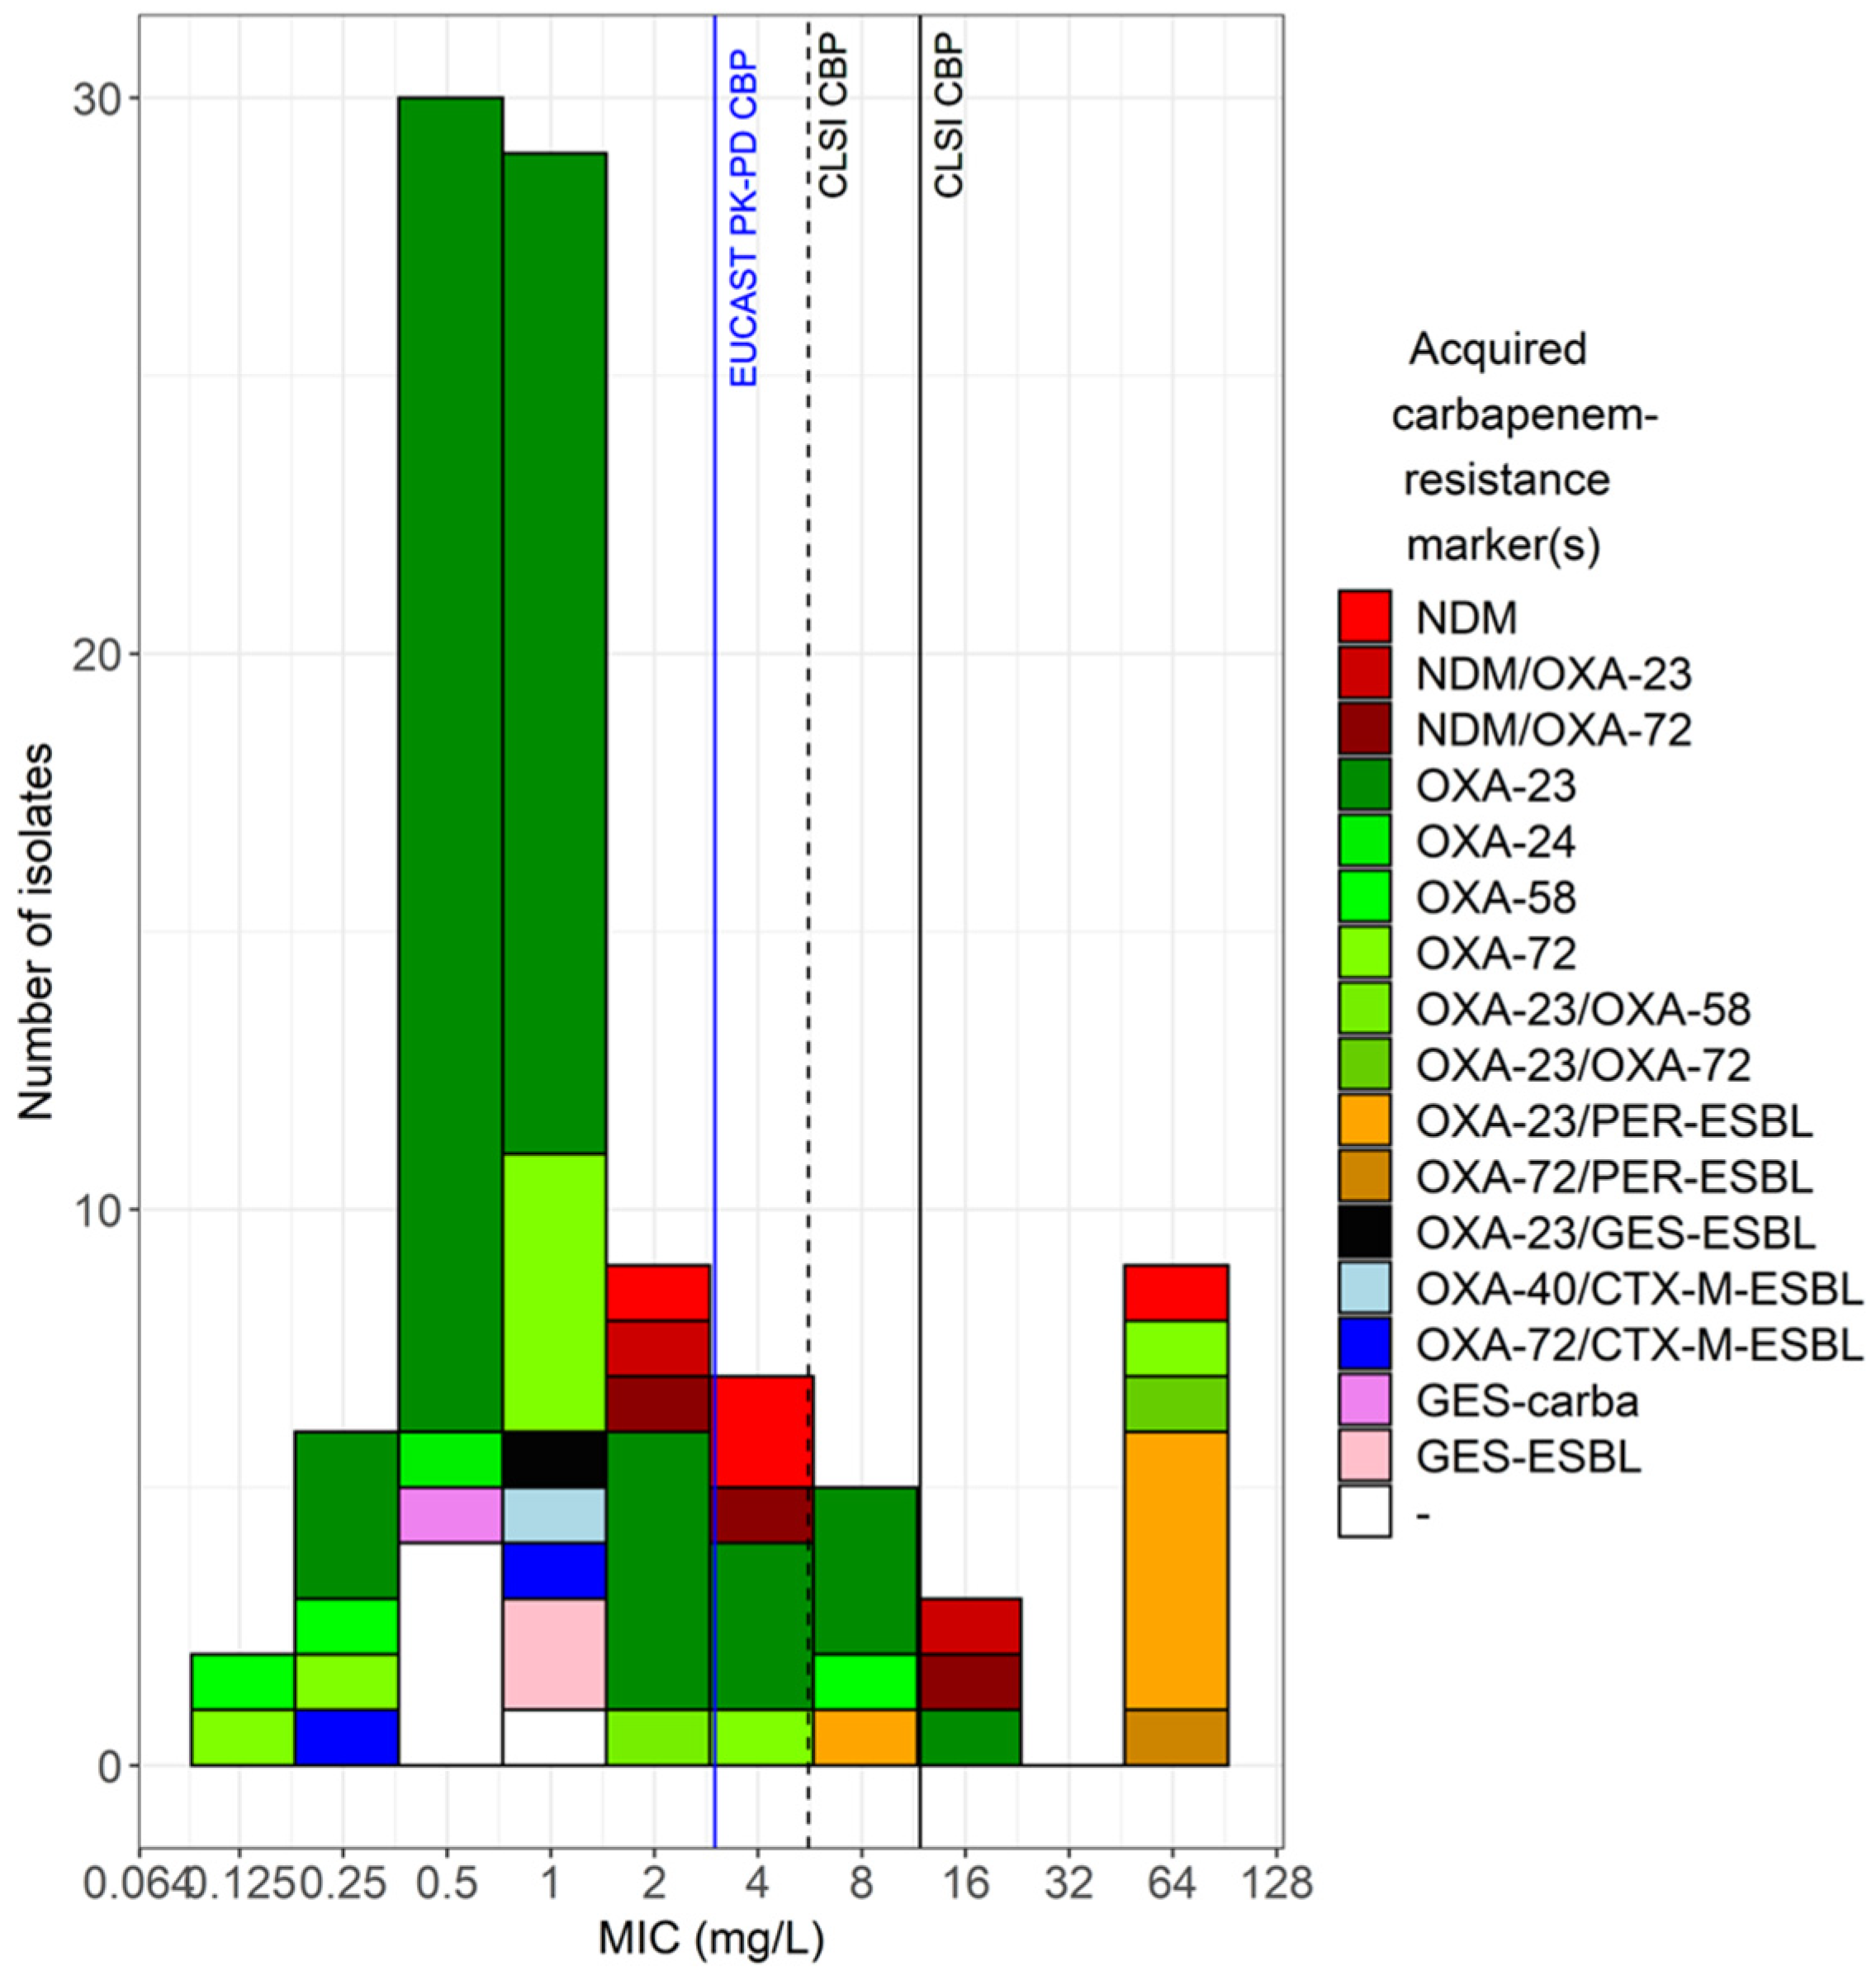
Genotypic analysis and antimicrobial susceptibility


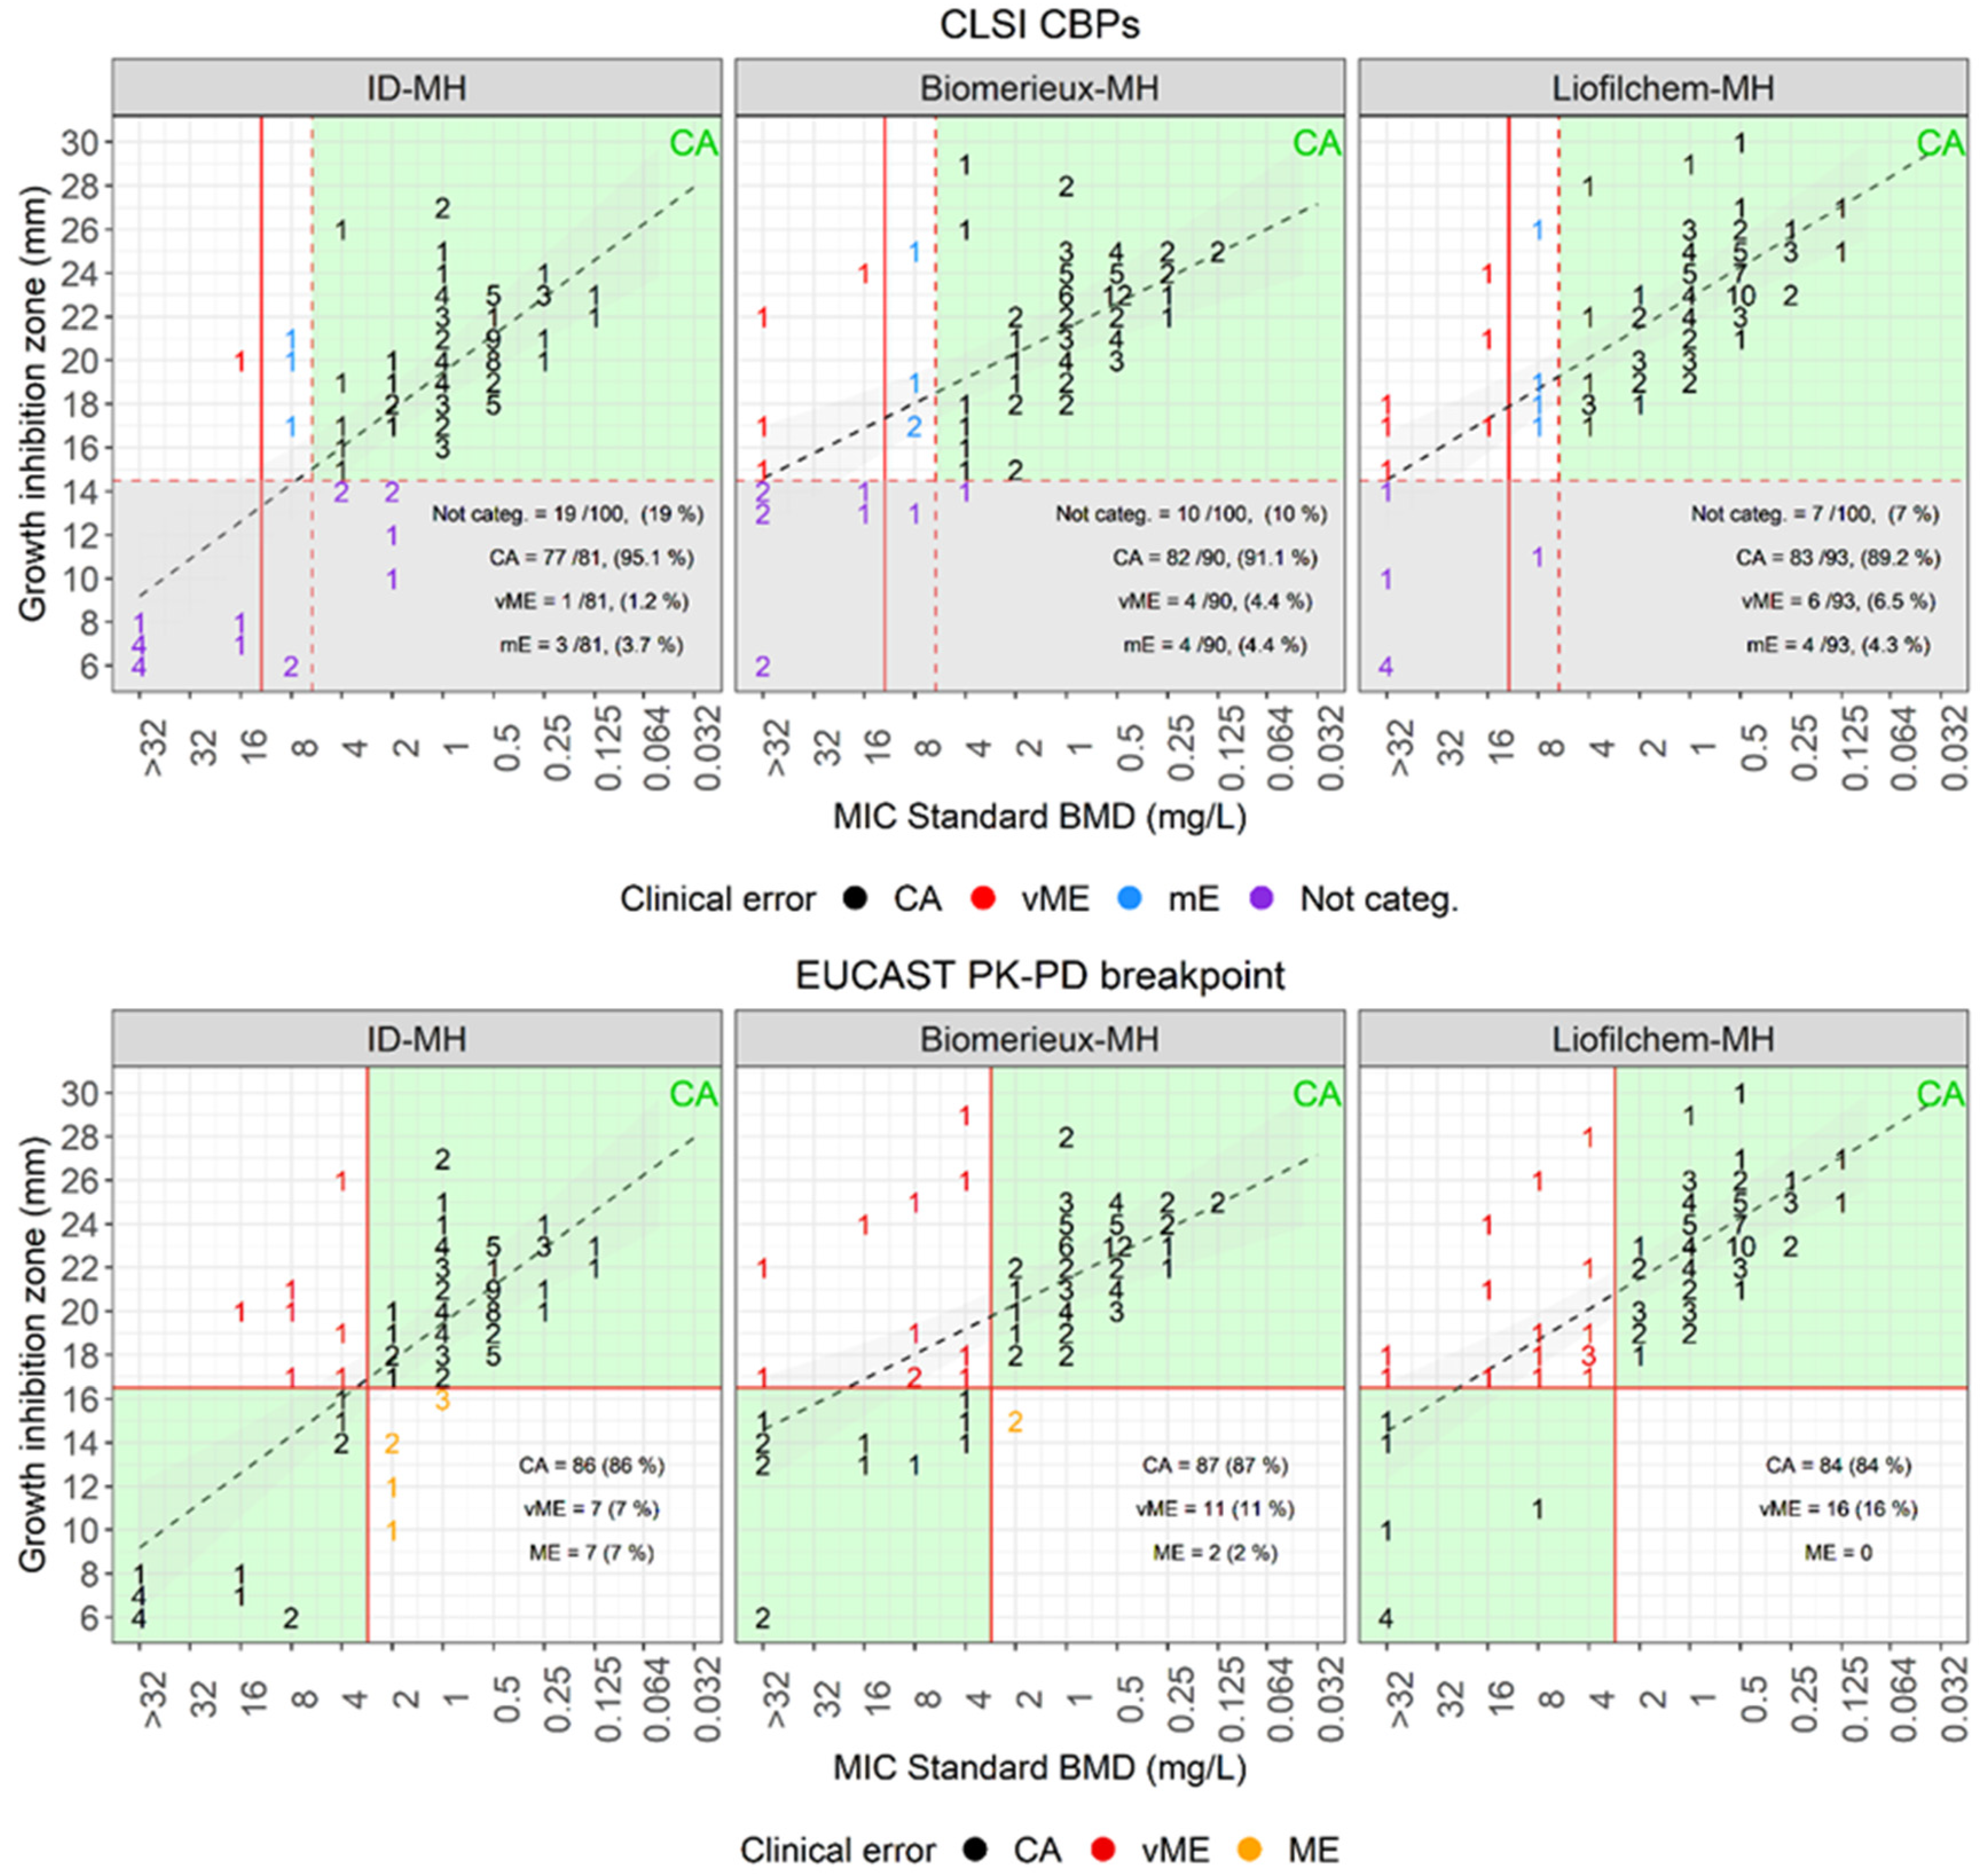
| Disk diffusion versus standard BMD | |||||||||
| Plate | Breakpoint (mm) | Categorized, ≥ 15mm (%) | Not categorized (%) | CA (%) | mE (%) | vME (%) | |||
| S ≥ | R < | Source | |||||||
| MH-Biomerieux | 15 | CLSI | 90 (90) | 10 (10) | 82/90 (91.1) | 4 (4.4) | 4 (4.4) | ||
| MH-Liofilchem | 93 (93) | 7 (67) | 83/93 (89.2) | 4 (4.3) | 6 (6.5) | ||||
| ID-MH-homemade | 81 (81) | 19 (19) | 77/81 (95.1) | 3 (3.7) | 1 (1.2) | ||||
| Plate | Breakpoint (mm) | CA (%) | ME (%) | vME (%) | |||||
| S ≥ | R < | Source | |||||||
| MH-Biomerieux | 17 | 17 | EUCAST PK-PD | 87 (87) | 2 (2) | 11 (11) | |||
| MH-Liofilchem | 84 (84) | 0 (0) | 16 (16) | ||||||
| ID-MH-homemade | 86 (86) | 7 (7) | 7 (7) | ||||||
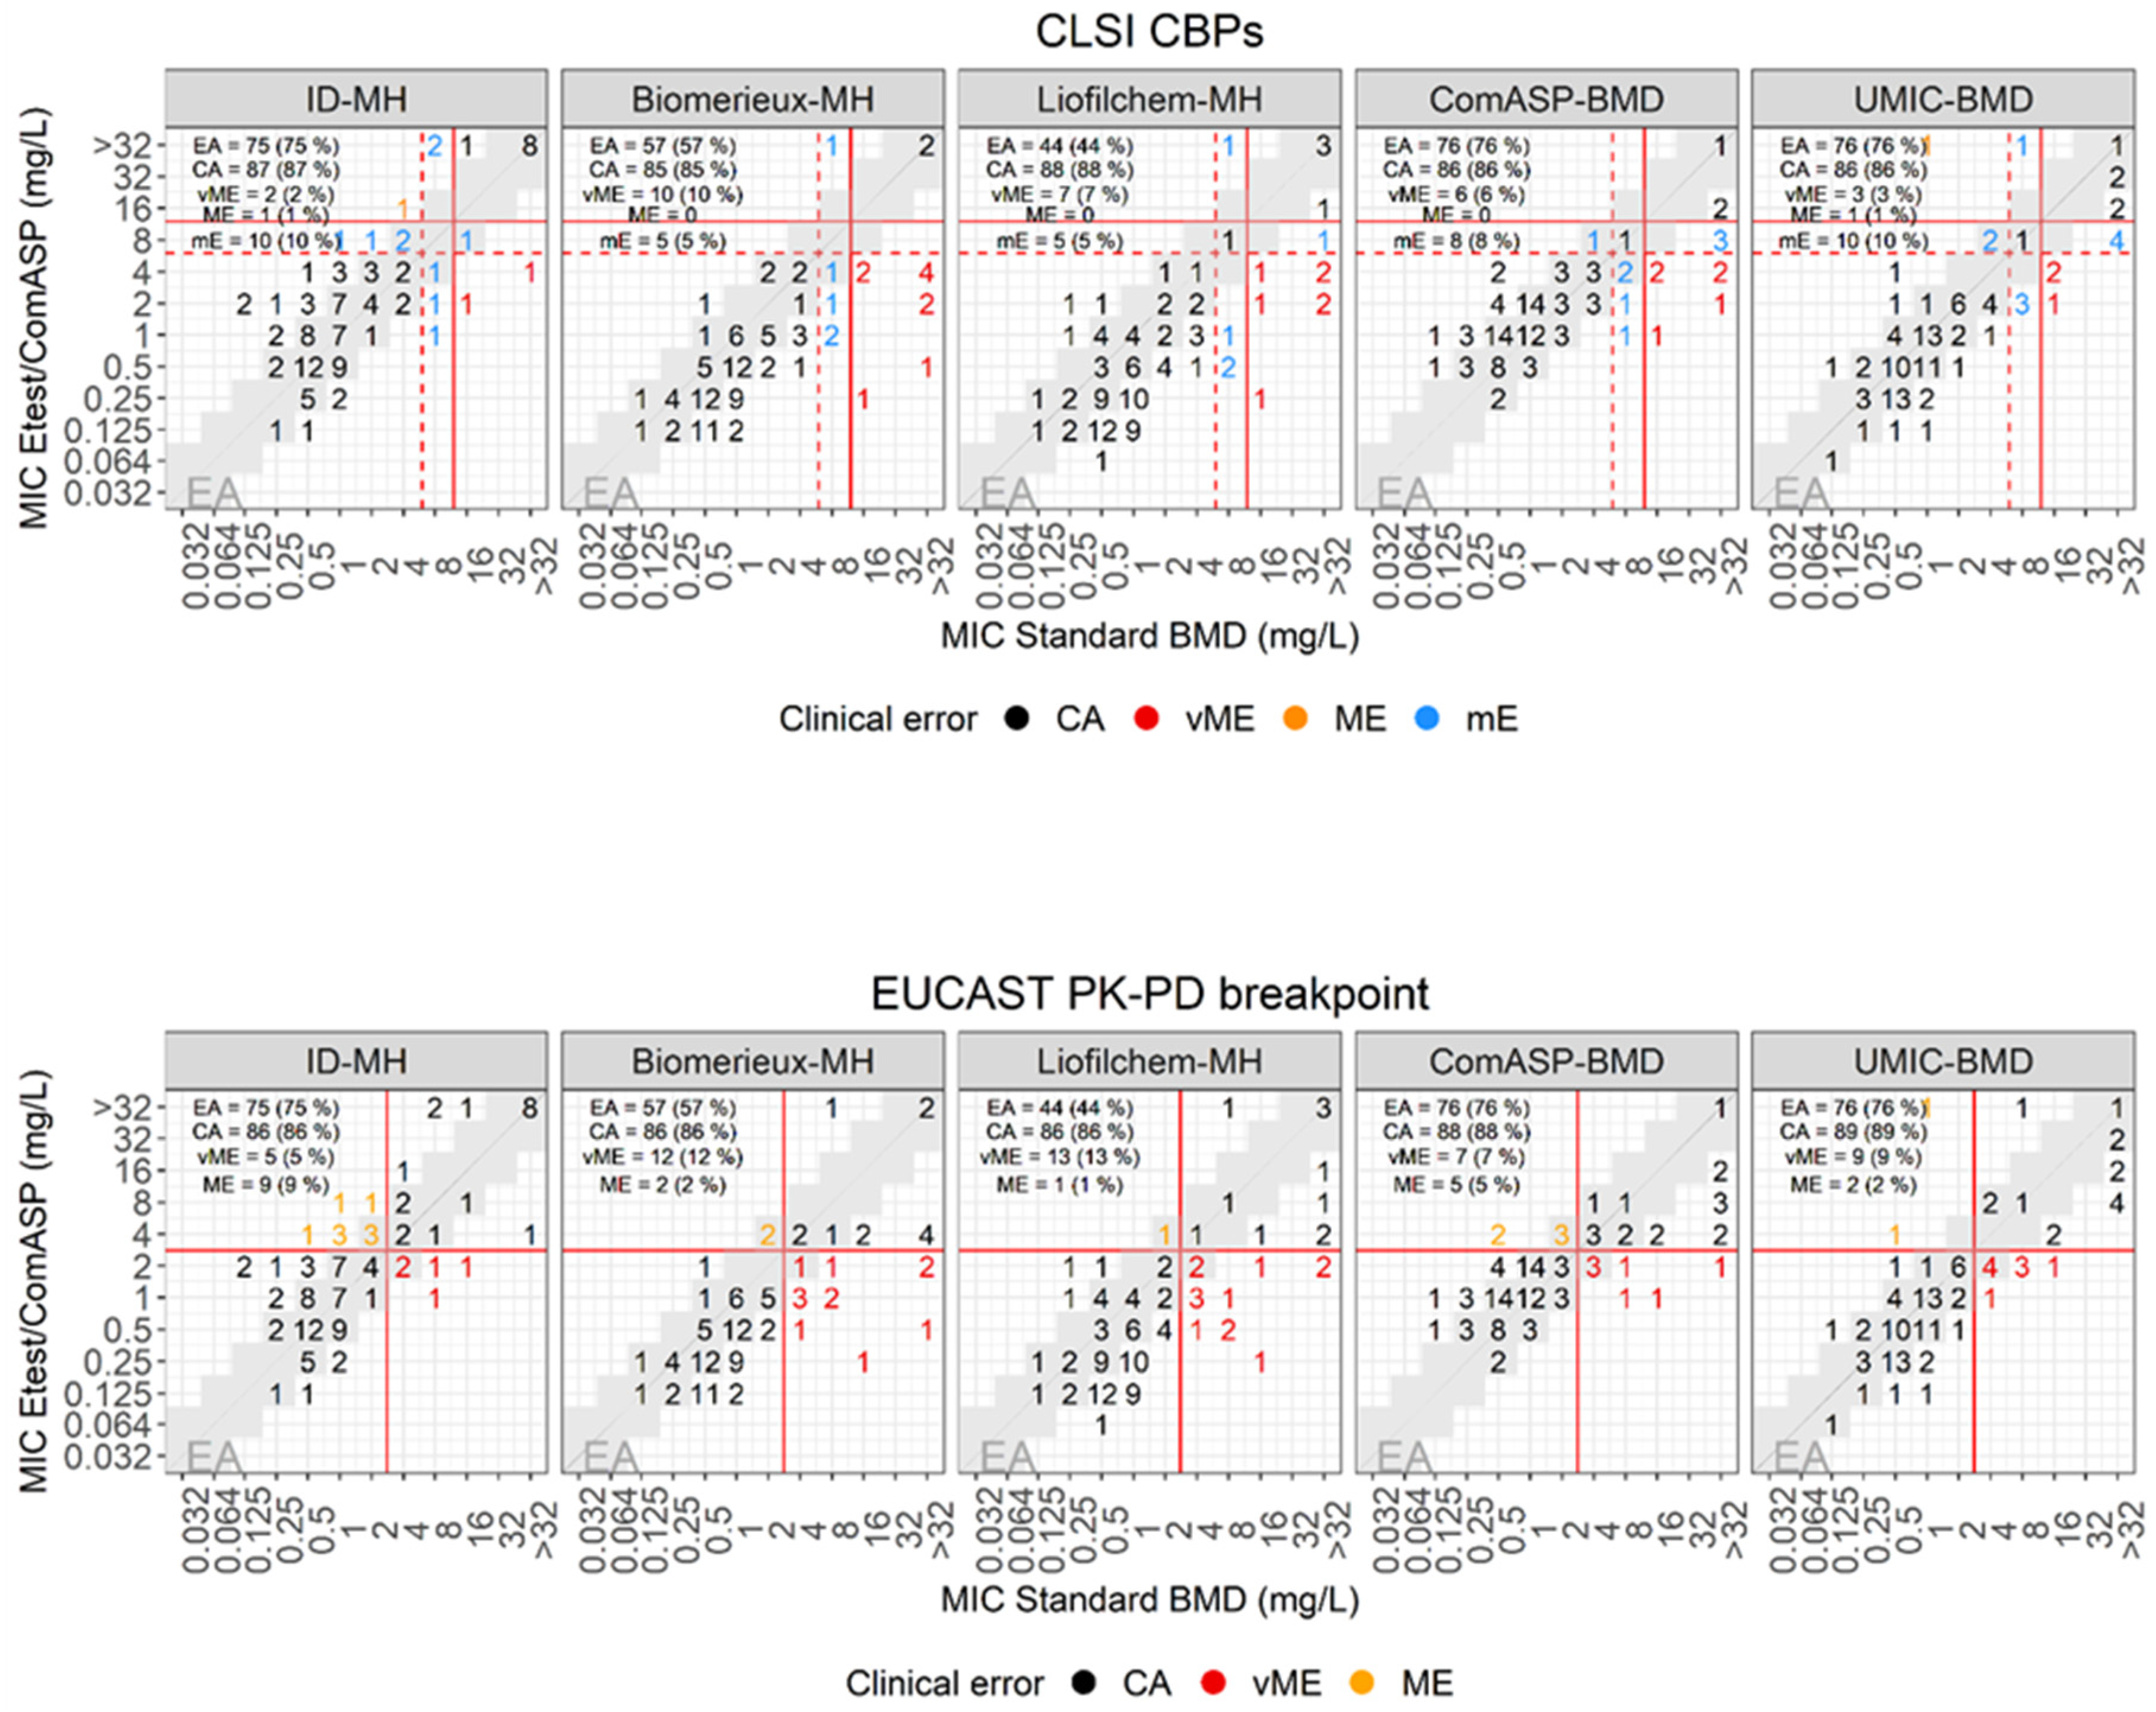
| E-test versus standard BMD | |||||||||
| Plate | Breakpoint (mm) | EA (%) | CA (%) | mE (%) | ME (%) | vME (%) | |||
| S ≤ | I = | R > | Source | ||||||
| MH-Biomerieux | 4 | 8 | 8 | CLSI | 57 (57) | 85 (85) | 5 (5) | 10 (10) | |
| MH-Liofilchem | 44 (44) | 88 (88) | 5 (5) | 7 (7) | |||||
| ID-MH-homemade | 75 (75) | 87 (87) | 10 (10) | 1 (1) | 2 (2) | ||||
| ComASP | 76 (76) | 86 (86) | 8 (8) | 6 (6) | |||||
| UMIC | 76 (76) | 86 (86) | 10 (10) | 1 (1) | 3 (3) | ||||
| Plate | Breakpoint (mm) | EA (%) | CA (%) | mE (%) | ME (%) | vME (%) | |||
| S ≤ | I = | R > | Source | ||||||
| MH-Biomerieux | 2 | 2 | EUCAST PK-PD | 57 (57) | 86 (86) | 2 (2) | 12 (12) | ||
| MH-Liofilchem | 44 (44) | 86 (86) | 1 (1) | 13 (13) | |||||
| ID-MH-homemade | 75 (75) | 86 (86) | 9 (9) | 5 (5) | |||||
| ComASP | 76 (76) | 88 (88) | 5 (5) | 7 (7) | |||||
| UMIC | 76 (76) | 89 (89) | 2 (2) | 9 (9) | |||||
Performances of disk diffusion to assess cefiderocol susceptibility
Performances of E-test to assess cefiderocol susceptibility

Performances of ComASP to assess cefiderocol susceptibility
Performances of UMIC to assess cefiderocol susceptibility
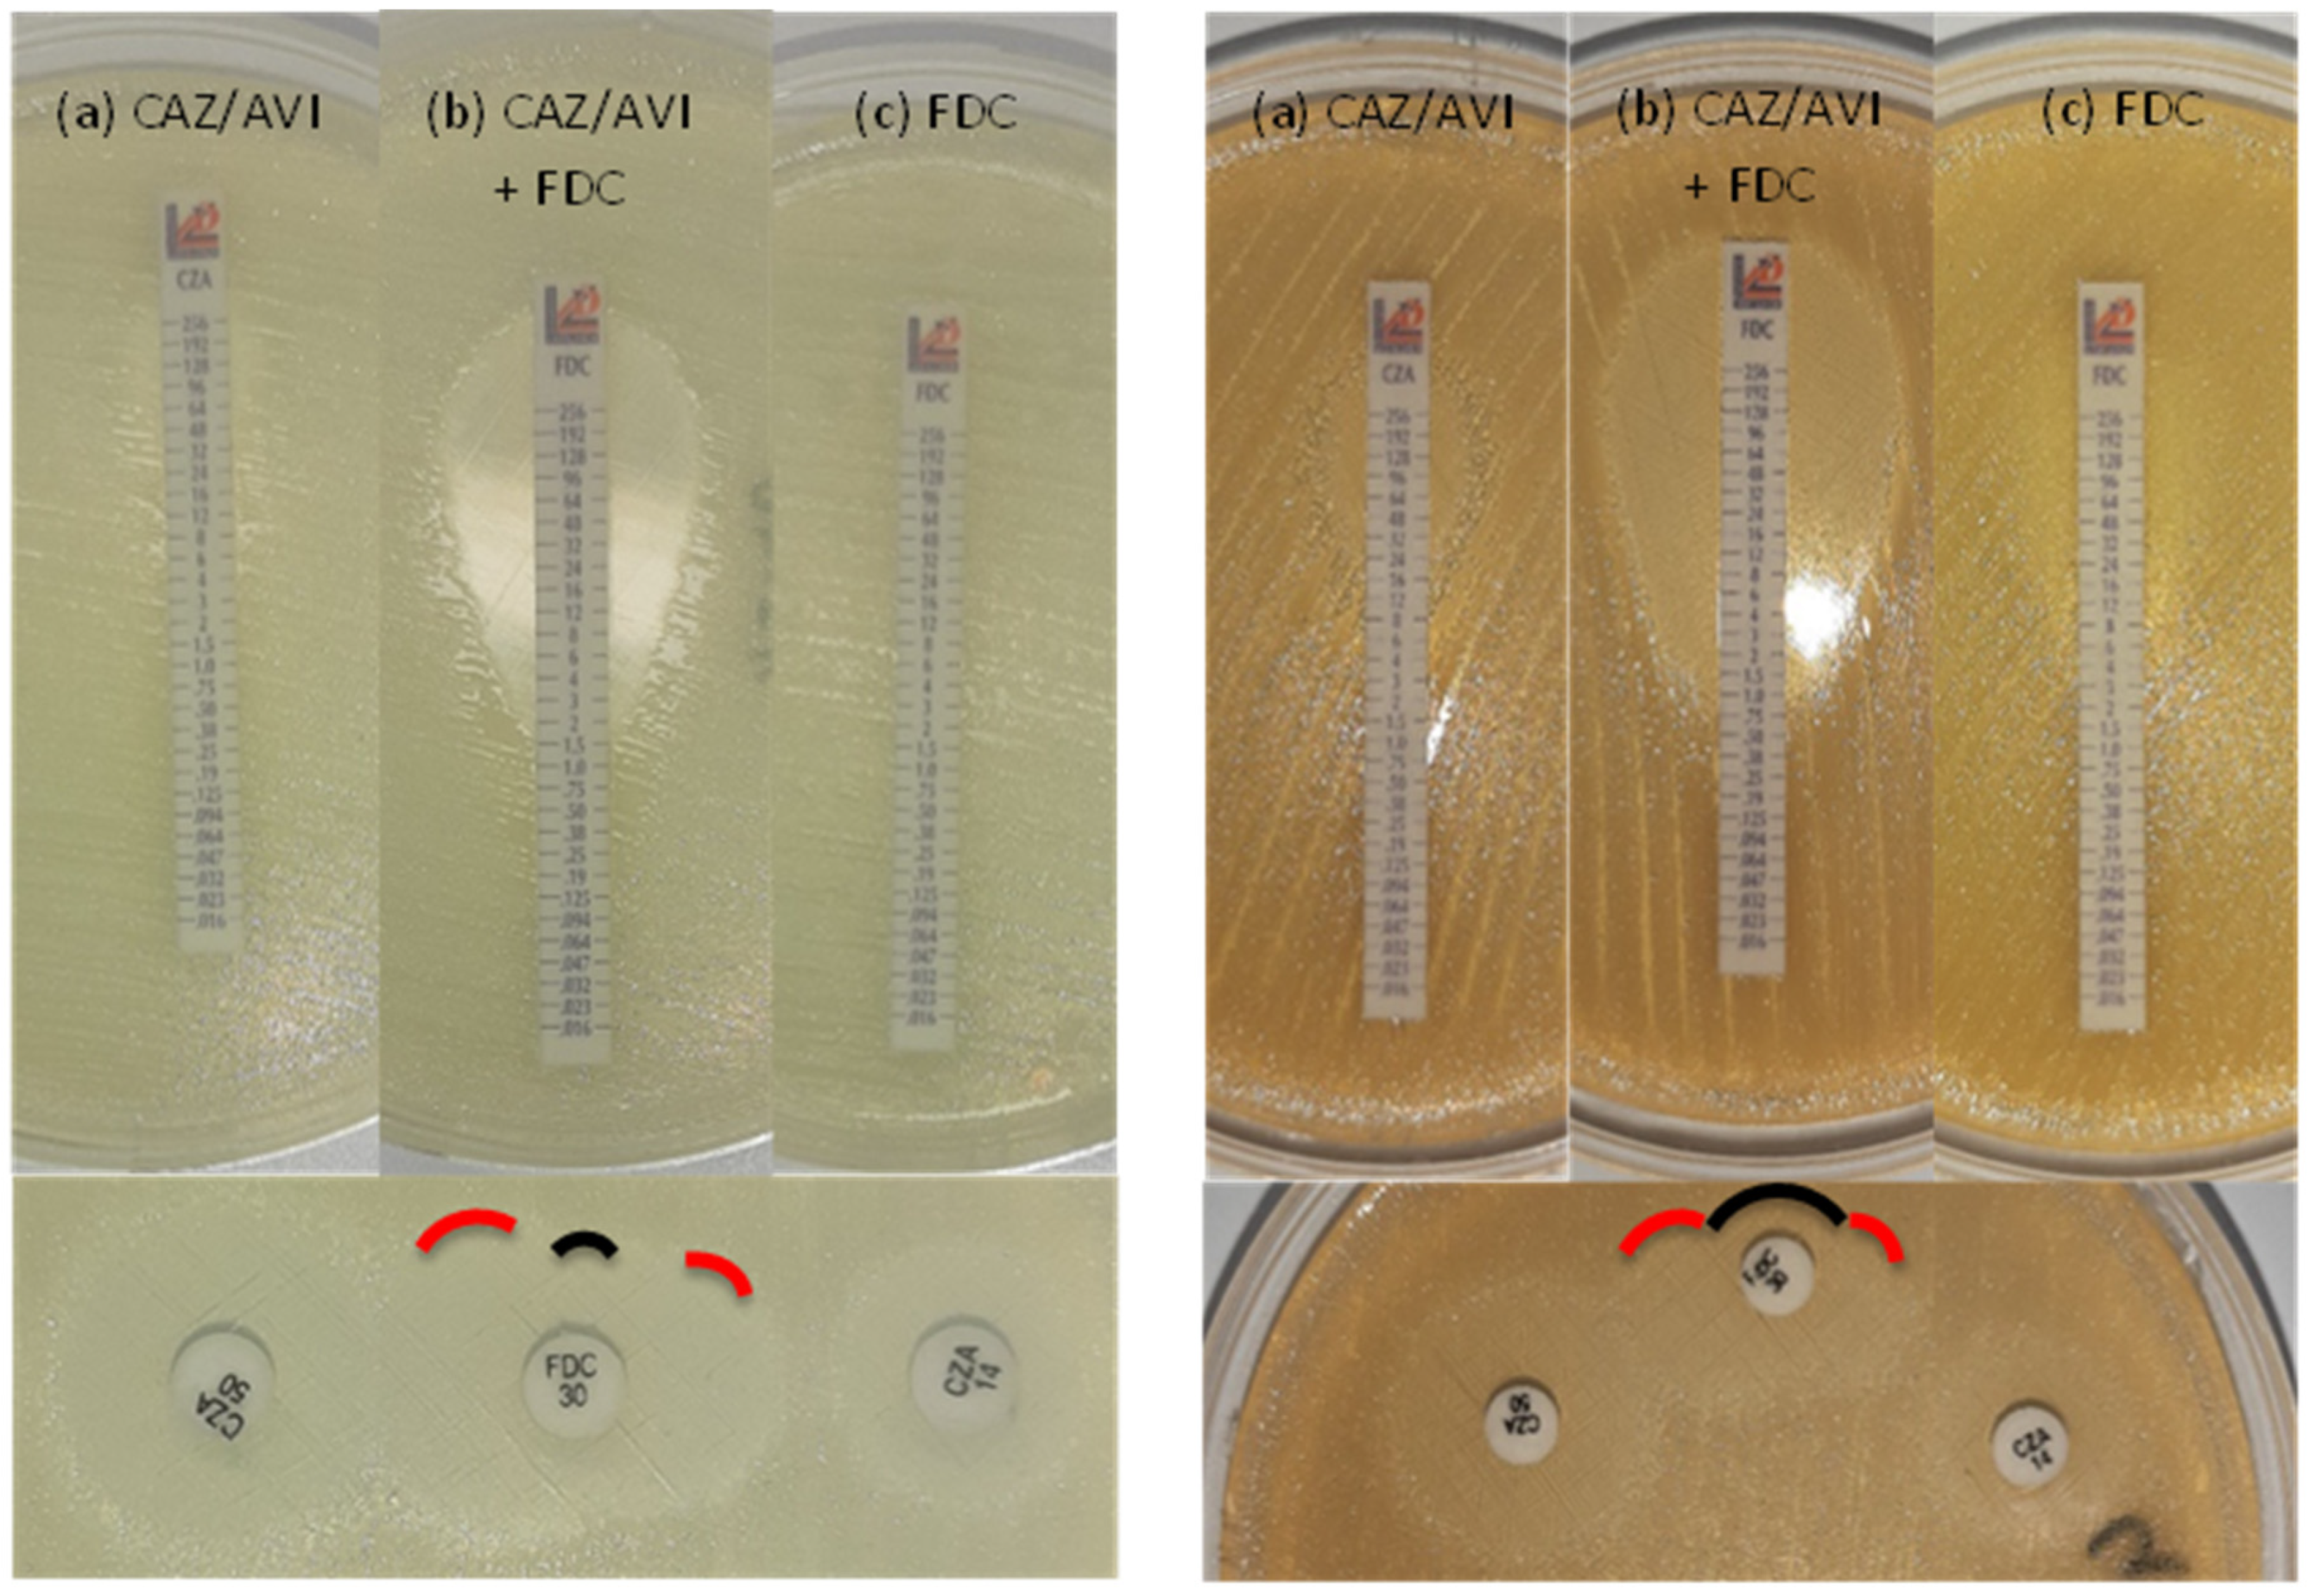
Synergy between cefiderocol and avibactam
| Method | Standard BMD, MIC (μg/ml) | E-test on ID-MH-agar, MIC (μg/ml) | Double disk diffusion on ID-MH-agar, inhibition zone (mm) | ||||||||
|---|---|---|---|---|---|---|---|---|---|---|---|
| Isolate n. | Major plasmidic β-lactamase(s) | CFD | CFD + AVI1 | Fold difference | CZA | CFD | CFD + CZA | Fold difference | CFD | CZA14 | CZA50 |
| 9 | OXA-72 | >32 | 2 | >4 | 32 | >256 | 0.5 | >9 | 6 | 6 | 14 |
| 22 | OXA-23/PER-1 | 8 | 0.5 | 4 | 32 | 1 | 0.125 | 3 | 19 | 10 | 16 |
| 25 | OXA-23/PER-1 | >32 | 0.5 | >6 | 16 | >256 | 0.125 | >11 | 12 | 12 | 17 |
| 30 | OXA-58 | 8 | 4 | 1 | >256 | 6 | 2 | 1.5 | 14 | 6 | 11 |
| 45 | OXA-72/PER-1 | >32 | 1 | >5 | 32 | >256 | 1 | >8 | 6 | 11 | 19 |
| 56 | OXA-23/PER-7 | >32 | 1 | >5 | 16 | >256 | 0.19 | >10 | 6 | 10 | 15 |
| 57 | OXA-23/PER-7 | >32 | 1 | >5 | 96 | >256 | 2 | >7 | 6 | 8 | 14 |
| 69 | OXA-23/PER-7 | >32 | 1 | >5 | 16 | 12 | 1 | 3.5 | 10 | 13 | 18 |
| 73 | OXA-23 | 16 | 2 | 3 | 48 | 0.75 | 0.38 | 1 | 23 | 8 | 15 |
| 78 | OXA-23/PER-7 | >32 | 1 | >5 | 24 | 16 | 0.125 | 7 | 8 | 12 | 17 |
| 85 | OXA-23 | 8 | 1 | 3 | >256 | 3 | 0.38 | 3 | 18 | 6 | 14 |
| 90 | OXA-23 | 8 | 0.0625 | 7 | 192 | >256 | 1.5 | >7 | 6 | 6 | 12 |
| 92 | OXA-23/OXA-72 | ≥32 | ≥32 | 0 | >256 | >256 | 32 | >3 | 6 | 6 | 8 |
| 95 | OXA-23 | 8 | 0.125 | 6 | 64 | 3 | 0.5 | 3 | 18 | 8 | 14 |

4. Discussion
Funding
Acknowledgments
References
- EUCAST. 2022. European Committee on Antimicrobial Susceptibility Testing. Breakpoint tables for interpretation of MICs and zone diameters Version 120:https://www.eucast.org/fileadmin/src/media/PDFs/EUCAST_files/Breakpoint_tables/v_11.0_Breakpoint_Tables.pdf.
- CLSI. 2022. Clinical and Laboratory Standards Institute. Performance Standards for Antimicrobial Susceptibility Testing, 32nd Edition.
- FDA. 2023. Cefiderocol Injection. US Food and Drug Administration doi:https://www.fda.gov/drugs/development-resources/cefiderocol-injection.
- Albano M, Karau MJ, Schuetz AN, Patel R. Comparison of Agar Dilution to Broth Microdilution for Testing In Vitro Activity of Cefiderocol against Gram-Negative Bacilli. J Clin Microbiol 2020, 59.
- Morris CP, Bergman Y, Tekle T, Fissel JA, Tamma PD, Simner PJ. Cefiderocol Antimicrobial Susceptibility Testing against Multidrug-Resistant Gram-Negative Bacilli: a Comparison of Disk Diffusion to Broth Microdilution. J Clin Microbiol 2020, 59.
- Kohira N, Hackel MA, Ishioka Y, Kuroiwa M, Sahm DF, Sato T, Maki H, Yamano Y. Reduced susceptibility mechanism to cefiderocol, a siderophore cephalosporin, among clinical isolates from a global surveillance programme (SIDERO-WT-2014). J Glob Antimicrob Resist 2020, 22, 738–741. [CrossRef] [PubMed]
- Poirel L, Sadek M, Nordmann P. Contribution of PER-Type and NDM-Type beta-Lactamases to Cefiderocol Resistance in Acinetobacter baumannii. Antimicrob Agents Chemother 2021, 65, e0087721. [CrossRef] [PubMed]
- Malik S, Kaminski M, Landman D, Quale J. Cefiderocol Resistance in Acinetobacter baumannii: Roles of beta-Lactamases, Siderophore Receptors, and Penicillin Binding Protein 3. Antimicrob Agents Chemother 2020, 64.
- Nordmann P, Shields RK, Doi Y, Takemura M, Echols R, Matsunaga Y, Yamano Y. Mechanisms of Reduced Susceptibility to Cefiderocol Among Isolates from the CREDIBLE-CR and APEKS-NP Clinical Trials. Microb Drug Resist 2022, 28, 398–407. [CrossRef] [PubMed]
- Karakonstantis S, Rousaki M, Kritsotakis EI. Cefiderocol: Systematic Review of Mechanisms of Resistance, Heteroresistance and In Vivo Emergence of Resistance. Antibiotics (Basel) 2022, 11.
- Choby JE, Ozturk T, Satola SW, Jacob JT, Weiss DS. Does cefiderocol heteroresistance explain the discrepancy between the APEKS-NP and CREDIBLE-CR clinical trial results? Lancet Microbe 2021, 2, e648–e649. [CrossRef] [PubMed]
- Stracquadanio S, Bonomo C, Marino A, Bongiorno D, Privitera GF, Bivona DA, Mirabile A, Bonacci PG, Stefani S. Acinetobacter baumannii and Cefiderocol, between Cidality and Adaptability. Microbiol Spectr 2022, 10, e0234722.
- Abdul-Mutakabbir JC, Nguyen L, Maassen PT, Stamper KC, Kebriaei R, Kaye KS, Castanheira M, Rybak MJ. In Vitro Antibacterial Activity of Cefiderocol against Multidrug-Resistant Acinetobacter baumannii. Antimicrob Agents Chemother 2021, 65, e0264620. [CrossRef] [PubMed]
- Mezcord V, Wong O, Pasteran F, Corso A, Tolmasky ME, Bonomo RA, Ramirez MS. Role of beta-lactamase inhibitors on cefiderocol activity against carbapenem-resistant Acinetobacter species. Int J Antimicrob Agents 2022.
- Hombach M, Zbinden R, Bottger EC. Standardisation of disk diffusion results for antibiotic susceptibility testing using the sirscan automated zone reader. BMC Microbiol 2013, 13, 225. [CrossRef] [PubMed]
- EUCAST. 2020. European Committee on Antimicrobial Susceptibility Testing. Guidance document on broth microdilution testing of cefiderocol:https://www.eucast.org/fileadmin/src/media/PDFs/EUCAST_files/Guidance_documents/Cefiderocol_MIC_testing_EUCAST_guidance_document_201217.pdf.
- CLSI. 2021. Clinical and Laboratory Standards Institute. Performance Standards for Antimicrobial Susceptibility Testing—Thirty-First Informational Supplement: M100.
- EUCAST. 2020. European Committee on Antimicrobial Susceptibility Testing. EUCAST Disk Diffusion Method for Antimicrobial Susceptibility Testing, version 80:EUCAST, Växjö, Sweden, 2020.
- http://www.eucast.org/fileadmin/src/media/PDFs/EUCAST_files/Disk_test_documents/2020_manuals/Manual_v_8.0_EUCAST_Disk_Test_2020.pdf.
- 212, IT. 2007. ISO 20776-2:2007. Clinical laboratory testing and in vitro diagnostic test systems — Susceptibility testing of infectious agents and evaluation of performance of antimicrobial susceptibility test devices — Part 2: Evaluation of performance of antimicrobial susceptibility test devices.
- Bolger AM, Lohse M, Usadel B. Trimmomatic: a flexible trimmer for Illumina sequence data. Bioinformatics 2014, 30, 2114–2120. [CrossRef] [PubMed]
- Wick RR, Judd LM, Gorrie CL, Holt KE. Unicycler: Resolving bacterial genome assemblies from short and long sequencing reads. PLoS Comput Biol 2017, 13, e1005595. [CrossRef] [PubMed]
- Higgins PG, Prior K, Harmsen D, Seifert H. Development and evaluation of a core genome multilocus typing scheme for whole-genome sequence-based typing of Acinetobacter baumannii. PLoS One 2017, 12, e0179228. [CrossRef] [PubMed]
- Feldgarden M, Brover V, Haft DH, Prasad AB, Slotta DJ, Tolstoy I, Tyson GH, Zhao S, Hsu CH, McDermott PF, Tadesse DA, Morales C, Simmons M, Tillman G, Wasilenko J, Folster JP, Klimke W. Validating the AMRFinder Tool and Resistance Gene Database by Using Antimicrobial Resistance Genotype-Phenotype Correlations in a Collection of Isolates. Antimicrob Agents Chemother 2019, 63.
- Bortolaia V, Kaas RS, Ruppe E, Roberts MC, Schwarz S, Cattoir V, Philippon A, Allesoe RL, Rebelo AR, Florensa AF, Fagelhauer L, Chakraborty T, Neumann B, Werner G, Bender JK, Stingl K, Nguyen M, Coppens J, Xavier BB, Malhotra-Kumar S, Westh H, Pinholt M, Anjum MF, Duggett NA, Kempf I, Nykasenoja S, Olkkola S, Wieczorek K, Amaro A, Clemente L, Mossong J, Losch S, Ragimbeau C, Lund O, Aarestrup FM. ResFinder 4.0 for predictions of phenotypes from genotypes. J Antimicrob Chemother 2020, 75, 3491–3500.
Disclaimer/Publisher’s Note: The statements, opinions and data contained in all publications are solely those of the individual author(s) and contributor(s) and not of MDPI and/or the editor(s). MDPI and/or the editor(s) disclaim responsibility for any injury to people or property resulting from any ideas, methods, instructions or products referred to in the content. |
© 2023 by the authors. Licensee MDPI, Basel, Switzerland. This article is an open access article distributed under the terms and conditions of the Creative Commons Attribution (CC BY) license (http://creativecommons.org/licenses/by/4.0/).


