Preprint
Article

Patterns of Shifting Phenostages and Flowering Time in Mango (Mangifera indica L.) Due to Climate Change

Altmetrics

Downloads

422

Views

217

Comments

0

Submitted:

21 June 2023

Posted:

22 June 2023

You are already at the latest version

Alerts
Abstract
Mango flowering phenostages were recorded under global warming conditions to assess the relationship between environmental cues and flowering time shifts and their consequences on reproductive success. Phenological transition to floral destiny was studied in relation to standard metrological week and weather parameters. Shifting of phenostage was recorded in Bud swelling, which is important for the shoot transitioning from vegetative to flowering meristem. Variations were also recorded for panicle elongation and early anthesis. The critical temperature for Bud burst stage was estimated for Dashehari, Langra, Amrapali and Chausa while Chausa had the propensity for late flowering correlated with higher temperature. The shifting of phenological calendar in response to weather parameters was obvious and needed a bigger range of yearly data for arriving at the climatic drives. In general, the results revealed that flower intensity was positively correlated with temperature, sunshine hours and evaporation while humidity showed a negative correlation. Hermaphrodite Flower % is an important attribute affecting fruit set and yield and was found most variable in the two years in the case of the three alternate bearing cultivars. In conclusion, it can be inferred that weather parameters prevailing in subtropics affect flowering intensity and consequently its fate i.e.; fruit yield.
Keywords: 
Subject: Biology and Life Sciences  -   Agricultural Science and Agronomy

1. Introduction

Many tropical and subtropical countries grow mango (Mangifera indica L.) as a common horticultural income crop, and its fruit is prized by consumers around the world for its exquisite flavour, seductive smell, nutritional value, and therapeutic significance [1,2]. It has been cultivated at least for the past 4000 years, with over 1000 varieties evolving over this time.
Unfortunately, a number of issues, such as shifting climatic conditions, pose a threat to the mango–producing system. In light of climate change, phenology—the timing of periodic occurrences in plants' lives and their connections to the environment—has drawn more and more interest globally. Consequently, phenological monitoring has developed into an incredibly useful tool for evaluating the impact of climate change. The current climate shift has left its mark on a wide range of ecosystems and biological processes [3]. The fact that phenological events are extremely responsive to weather variables makes them one of the most primitive recognised indicators of climate change, and the number of reported occurrences is rising every year [4,5,6].
The flowering phenology in plants is a complex trait governed by a variety of environmental cues, tree age, shoot maturity and genetic composition of particular varieties [7,8]. The projected changes in environmental cues have the potential to alter tree phenology through significant perturbations to the timing of fruit, seed and flower availability, with cascading effects on the distribution, fitness and population dynamics of dependent invertebrate and vertebrate fauna (e.g.; birds, bats, primates) [9]. The important environmental cues affecting the phenology of tropical and subtropical plants involve temperature, humidity, sunshine (photoperiod) and evaporation [5,10,11].
The success of a plant's ability to adapt, survive, and reproduce depends on the exact timing of developmental phase transitions. It is thought that mango flowers are induced from October to January in the subtropical environment, which is known for its harsh cold summers and winters. Mango trees develop more flowers and fruits when there is a growth regulation induced by dry or cool weather after the shoots of the preceding growth flush have reached maturity. Moreover, vegetative phase change, also known as the age–regulated pathway in flowering, is required for floral induction to occur as a plant transit from the juvenile to the mature flowering phase [12,13,14]. It has been noticed more frequently that flushes that mature before the winter produce floral shoots, while flushes that mature later produce vegetative shoots [15]. It has also been demonstrated that mature mango leaves are the cause of the floral stimulus, whereas young leaves prevent the initiation of floral buds [16].
Temperature fluctuations frequently cause flowers to bloom [17,18,19]. In the case of mango, flowering is majorly impacted by temperature. It has been discovered that temperature affects the flowering period, panicle growth and development, frequency of hermaphrodite and male flowers, percentages of anther dehiscence and fruit set [20,21]. The complex flowering trait is also influenced and controlled by sunshine or photoperiod. A prolonged period of chilling temperatures i.e., the length of the winter period triggered the flowering attributes related to genetic elements [7,8]. Humidity is also an important environmental cue under subtropics that directly/indirectly influences water relations of fruit crops, leaf growth and enlargement, photosynthesis, the occurrence of disease, evapotranspiration, and water requirement and consequently impacts flowering and fruit yield [11]. The changes in weather parameters viz temperature, sunshine, humidity and rainfall cause alteration in evaporation rate and subsequently impacted soil–water balance that leads to changes in evaporation and plant transpiration. The higher evaporation rate causes water unavailability to plants and consequently crop production due to shortening the crop growth cycle [22].
To comprehend the mango flowering process under global warming conditions, it is necessary to carefully and methodically study the relationship between environmental cues and phenological stages. The most current models for subtropical species are process–based tree phenology models [23]. In light of the aforementioned context, the current study was conducted in an effort to better understand the impact of weather on mango flowering concerning the critical phenological stages, or BBCH scales, that has been established earlier in mango [24,25].

2. Materials and Methods

2.1. Experimental Locations

The ICAR–Central Institute for Subtropical Horticulture in Lucknow, India (latitude: 26° 45′–27° 10′ N, longitude: 80° 30′–80° 55′ E) has the world's largest mango germplasm collection. The mango germplasm is maintained at the protected experimental field. This area got an average of 1000 mm of rainfall per year and is situated 123 metres above sea level (https://en.climate–data.org/asia/india/uttar–pradesh/Lucknow). The experiment was conducted during the two successive flowering seasons of mango during 2018–19 and 2019–20.

2.2. Experimental Mango cultivars

Four important north Indian mango cultivars, Dashehari, Langra, Chausa (alternate bearers), and Amrapali (regular bearers), planted in 20–25–year–old orchards, were selected for observation. The cultivars Dashehari, Langra, Chausa and Amrapali were selected due to their differential behaviour for flowering attributes particularly, flowering regularity, flowering time and intensity in the subtropics, as per below:
  • Dashehari: Midseason, heavy floral induction, alternate bearing
  • Langra: Mid-late bearing, heavy floral induction, strictly alternate bearing
  • Chausa: Late season, shy floral induction, erratic bearer
  • Amrapali: Late season, prolific floral induction, regular bearing

2.3. Collection of Weather Data

The climate data for this study were obtained from the ICAR–CISH Meteorological weather station, Lucknow, India (latitude: 26° 45′–27° 10′ N, longitude: 80° 30′–80° 55′ E). The weather parameters viz.; daily maximum and minimum temperature, daily maximum and minimum humidity, daily sunshine (photoperiod) and daily evaporation rate records for the period 2018–2020were recorded by the weather recording centre of ICAR–CISH, Lucknow and are also publically available on the official website of the Institute (https://cish.icar.gov.in/weather.php).

2.4. Observation of flowering and fruiting attributes

The flowering and fruiting attributes of mango viz. length of panicle (cm), the width of panicle (cm) and the number of hermaphrodite flowers/panicle and the total number of panicles per plant at full bloom stage were recorded. The observations were made daily to determine the time of emergence of panicles from January to March. Panicle length was measured using a measuring scale from shoot apex to panicle apex. An average of ten panicles/plants was taken for calculating the mean value for panicle length. Panicle width at its maximum point was recorded with the help of a measuring scale, expressed in centimetres (cm).
Panicle bearing shoots/m2counted and the flowering intensity was calculated by the formula given by Azam et al. [26].
F l o w e r i n g   i n t e n s i t y = N u m b e r   o f   f l o w e r i n g   s h o o t s T o t a l   n u m b e r   o f   s h o o t s × 100
The calculation of hermaphrodite flowers was made by applying the formula described by Kumar et al. [27].
H e r m a p h r o d i t e   f l o w e r s   ( % ) = N u m b e r   o f   h e r m a p h r o d i t e   f l o w e r s T o t a l   n u m b e r   o f   f l o w e r s × 100
Fruiting characters like fruit set percentage were calculated by the following formula [28].
F r u i t   S e t   ( % ) = N u m b e r   o f   f r u i t s T o t a l   n u m b e r   o f   h e r m a p h r o d i t e   f l o w e r s × 100

2.5. Phenological observations

The phenological observations (five replication/cultivars) were made every day in mango orchards during the flowering season. Management practices in these orchards have remained constant throughout the study period. The progressive phenological stages from bud swelling to fruit set were observed regularly [25].

2.6. Statistical analysis

The statistical analysis of phenological attributes was carried out using the β–version of the software ASSISTAT 7.6. The collected data were statistically analysed using the analysis of variance technique (ANOVA). Significant differences were based on the F–test in ANOVA and means were calculated using Duncan's multiple range test (DMRT) with a significance level of P ≤ 0.05 and P ≤ 0.01. Sigma Plot 11 was used to calculate the standard error (SE) of the mean in vertical bar graphs (systat software, Inc.). Using the SPSS16 program, the correlation study was carried out and related graphs were prepared. 3–D score plot and Principal component analysis (PCA) were performed using JMP17 trial version software.

3. Results

3.1. Impact of weather parameters on floral morphogenesis in different cultivars of mango

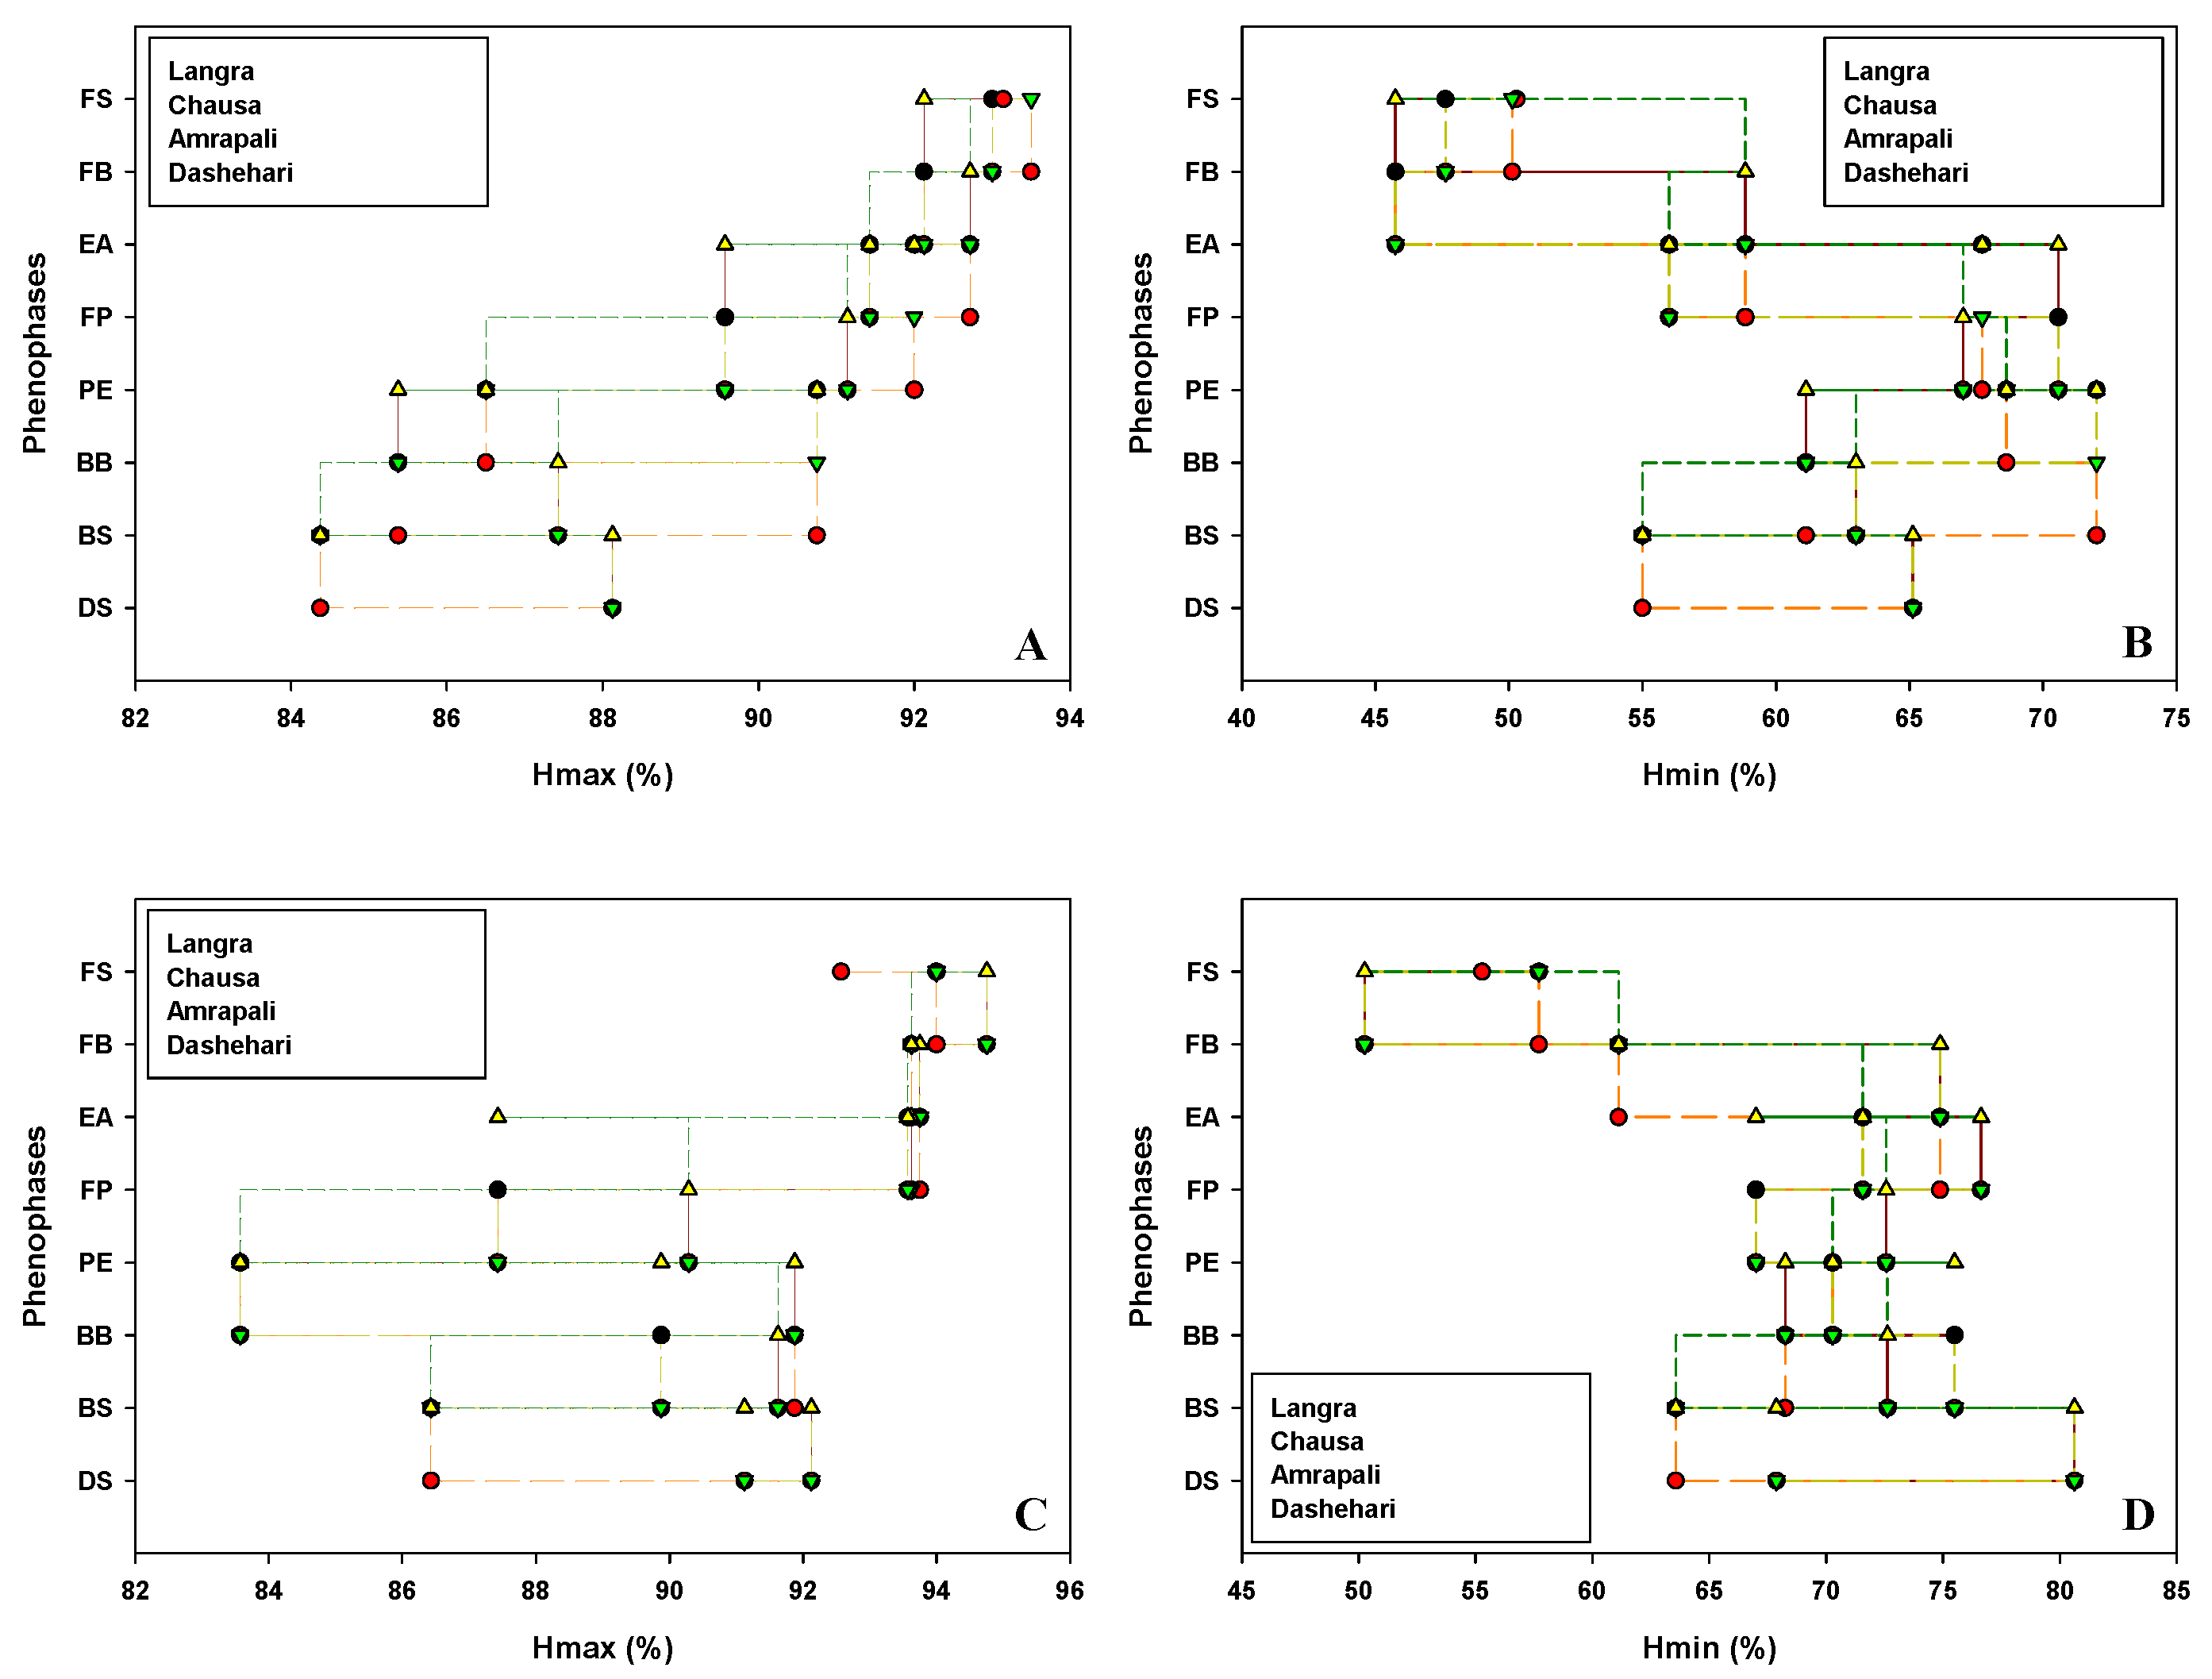
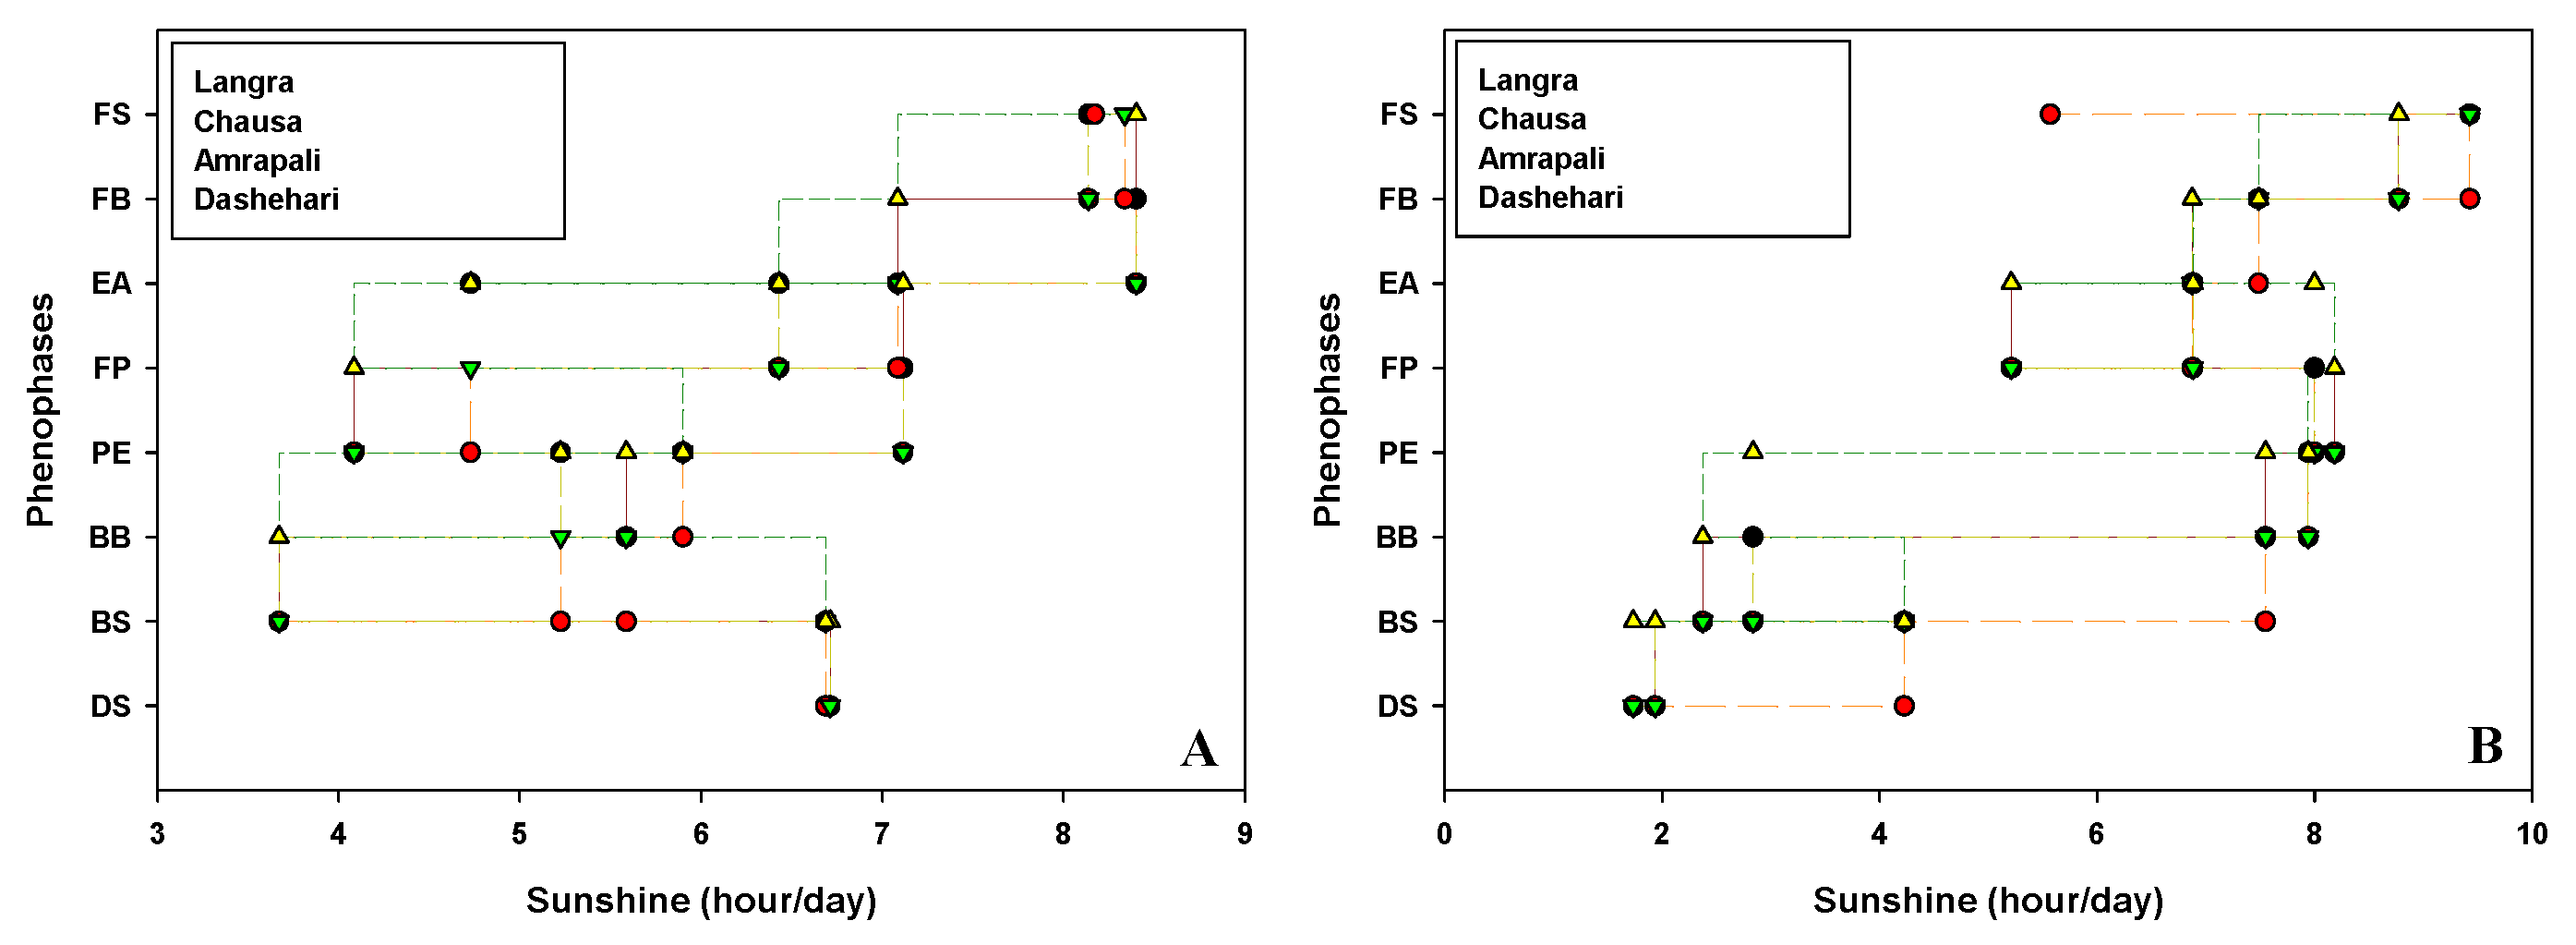
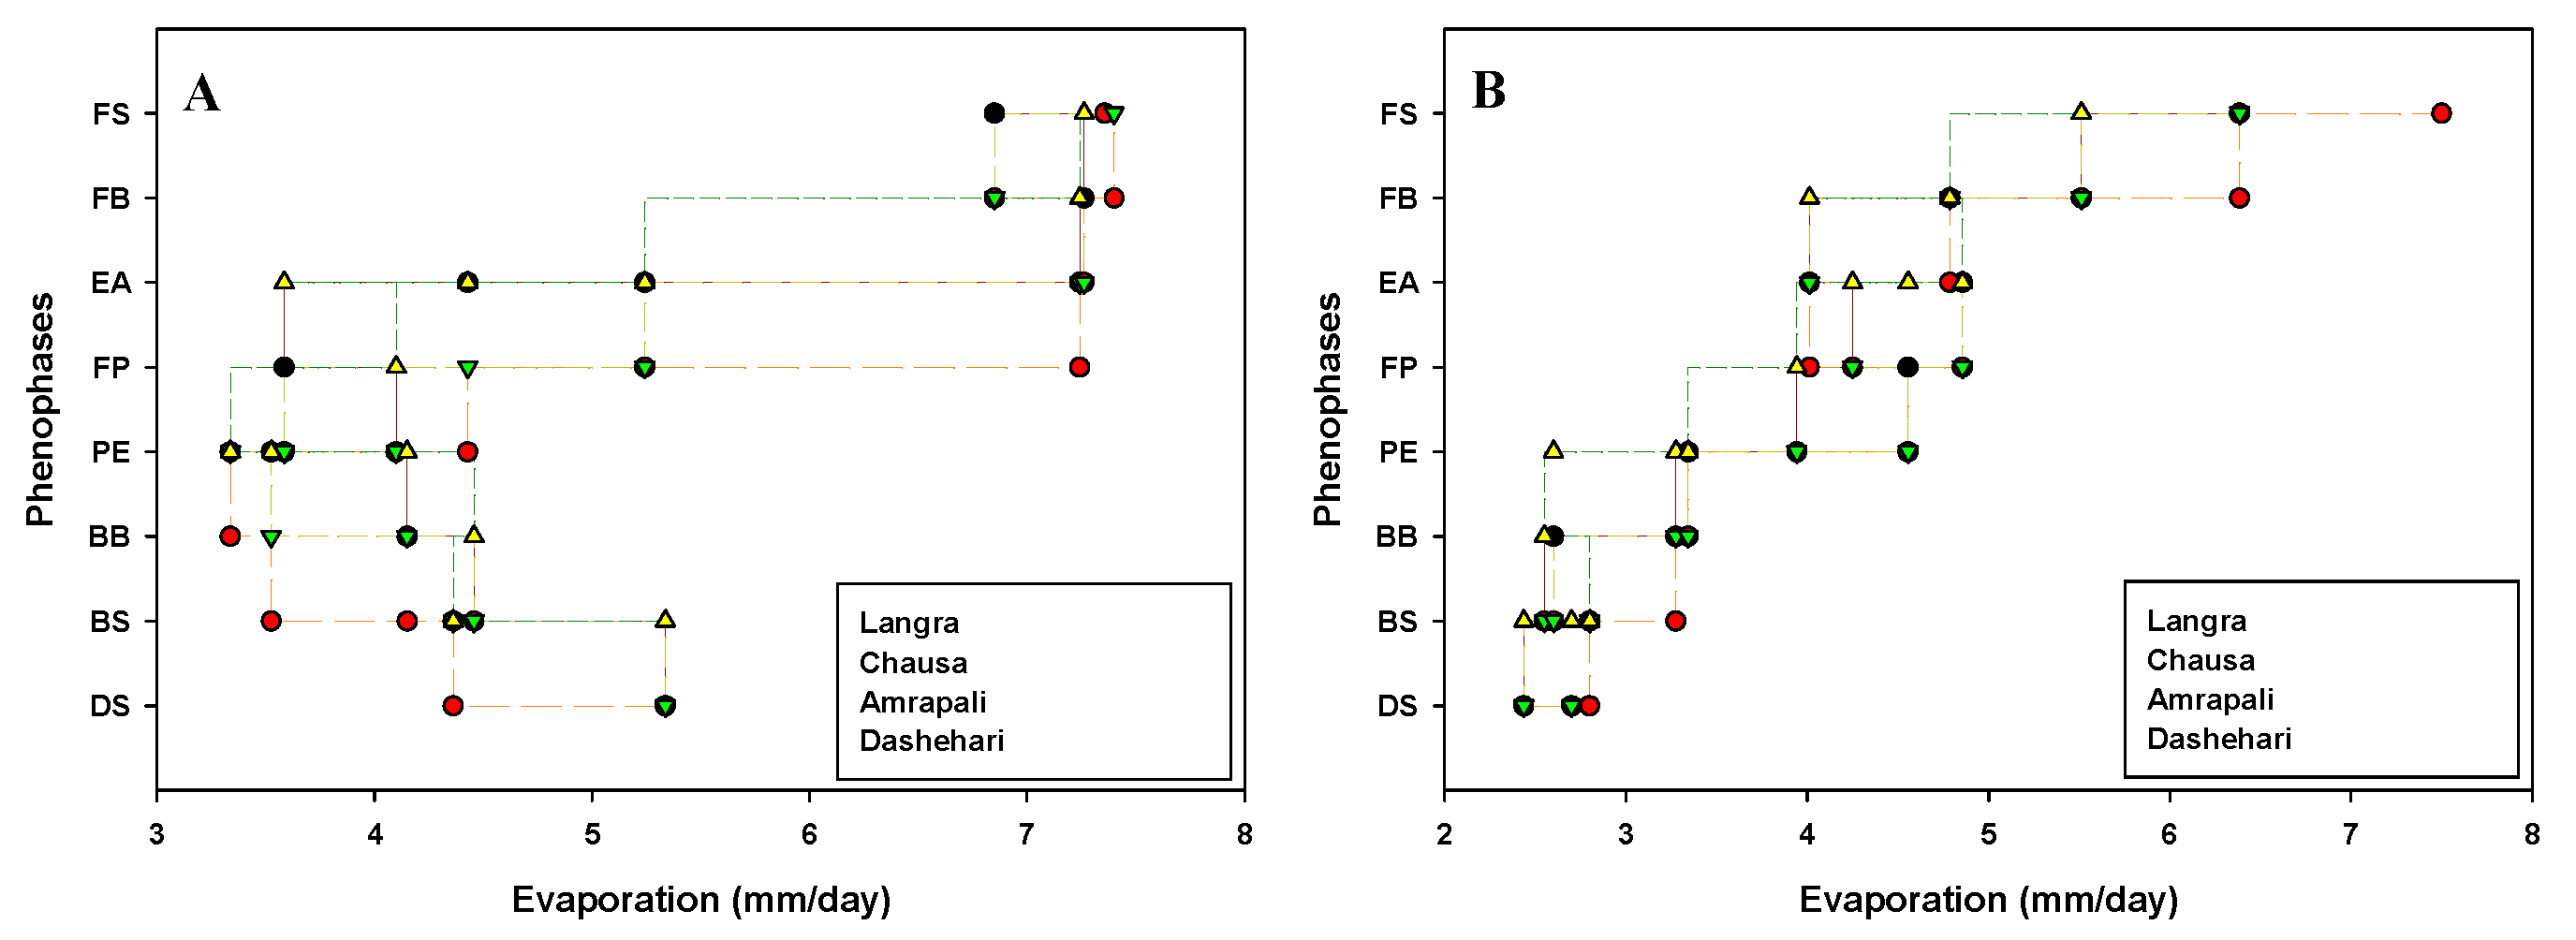
Critical flowering phenological stages of candidate cvs Dashehari, Langra, Chausa and Amrapali were marked and date recorded during the flowering season in the years 2019 and 2020. The impact of weather parameters viz. temperature [Maximum temperature (Tmax); Minimum temperatures (Tmin)], humidity [Maximum humidity (Hmax); Minimum humidity (Hmin)], average hour of sunshine per day (Savg) and evaporation (Eavg) on floral morphogenesis are depicted in Figure 1, Figure 2, Figure 3 and Figure 4 respectively.
The range of weather parameters for the transition from one phenological stage to the next is displayed. The results based on analysis of weather data indicate that under subtropical conditions, mango bud required inductive high day and cool night temperatures for breaking dormancy in the bud. Phenological transition to floral destiny was studied in relation to standard metrological week and weather parameters (recorded and averaged for the preceding fortnight). Bud swelling (BS) is a critical stage in establishing preparedness for the shoot for transitioning from vegetative to flowering meristem. Incidentally, this is marked by prolonged cold conditions (2019–20), so the BS stage persists from 15–23℃ while taking all four cvs under consideration. Mango cv. Chausa, a late-season variety was last to display the BS stage (23–24℃) based on two years of meteorological data). Other critical phenostages that displayed variations for days taken for transitioning include Panicle elongation and Early anthesis. Comparing the Tmax for two years it can be concluded that shoot apical meristem of cv. Dashehari passes from BS to BB stage after sustaining the preceding max temperature of up to 23℃ for 2–3 weeks. Furthermore, the critical temperature for BB stage for cv. Amrapali was worked out to be 23–24℃ (Tmax) and 4–6℃ (Tmin). Chausa had preponderance to exhibit anthesis, full bloom and fruit set, late in a season marked by day temperatures more than 30℃ and night temperatures up to 14–16℃.

3.2. Variation of Main Phenophases in Phenological Calendar

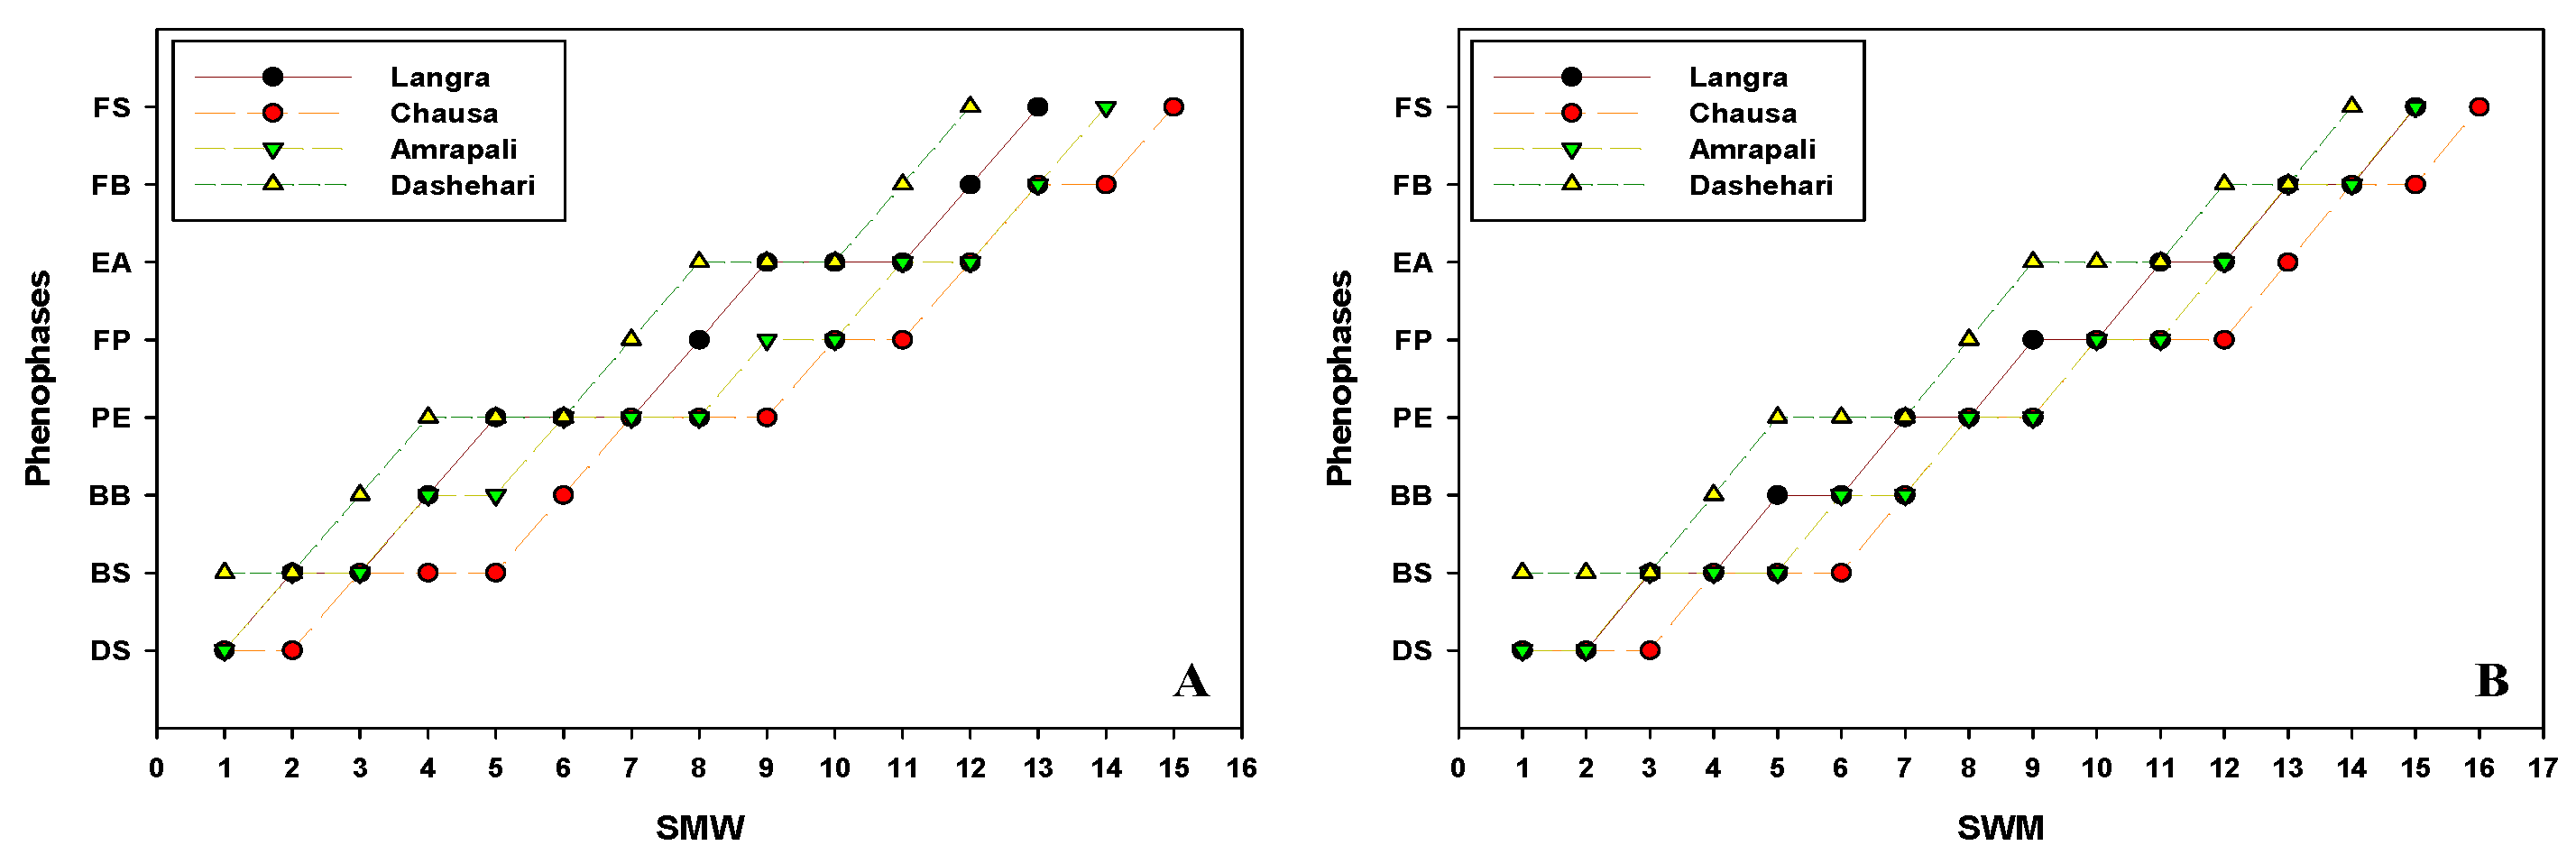
The phenological changes involved in floral morphogenesis leading to panicle formation and flower development were systematically studied in the four cultivars. Flowering initiation is signalled by the initial bud swelling stage that is followed by sequential formation and growth into advanced flowering stages. The timing of critical phenological stages viz, Dormant stage (DS), Bud Swelling (BS), Bud Burst (BB), Panicle Emergence (PE), Full Panicle (FP), Early Anthesis (EA), Full Bloom (FB), and Fruit Set (FS) was recorded in the two calendar years. The schematic representation of different phenological stages is represented in Figure 5. Further, the aforementioned phenological stages in Dashehari, Langra, Chausa and Amrapali during the flowering season of 2018–19 and 2019–20 corresponding to Standard Meteorological Week (SMW) are depicted in the form of a line graph in Figure 6.
At the onset of winter, the plants underwent the phenological dormant stage (DS), after vegetative flushing is over, The initiation of floral induction is signalled by the appearance of meristematic domes, named Bud Swelling (BS) stage on the apical and lateral shoots. This BS stage lasted up to the 5th SMW (2018–19), while it prolonged up to the 6th SMW (2019–20). In Dashehari, the bud swelling (BS) stage was observed in 1st SMW in both the flowering years of 2019 and 2020. Further, the BS stage was visible both in Langra and Amrapali during the 2nd and 3rd SMW of 2019 and 2020 respectively. Similarly, the BS stage in Chausa was recorded during the 3rd and 4th SMW in successive flowering seasons. The findings indicated that the Dashehari cultivar displayed a relatively early onset of flowering phenology stages in 2018–19 and 2019–20. Further, in Dashehari, the transition from BS to BB stage occurred during the 3rd and 4th SMW during the successive flowering years (2019 and 2020) respectively. Langra and Amrapali displayed the shift from BS to BB stage during the 4th SMW of 2019, whereas the same stage occurred in the year 2020 during the 5th and 6th SMW respectively. Chausa displayed the transition from BS to BB during the 6th and 7th SMW of the year 2019 and 2020 respectively (Figure 6).
During the year 2019, the transformation of BB to PE stage in Dashehari, Langra, Chausa and Amrapali was seen during the 4th, 5th, 7th and 6th SMW respectively. In the year 2020, Dashehari and Langra exhibited the PE stage during the 5th and 7th SMW respectively. While both Chausa and Amrapali displayed the same stage during the 8th SMW respectively. All four cvs needed approximately the same time for the panicle to complete its full growth, so the FP stage is recorded in the 7th, 8th, 10th and 9th SMW respectively, in the year 2019. In the year 2019, the switching of FP to EA was recorded in Dashehari and Langra during the 8th and 9th SMW respectively. Additionally, the aforementioned stage was accounted for during the 12th SMW in both Langra and Chausa. During the year 2020, the development of FP to EA stage in Dashehari, Langra, Chausa and Amrapali was seen during the 9th, 11th, 13th and 12th SMW respectively (Figure 6).
In Dashehari and Langra, the EA to FB transition was observed during the 11th – 12th SMW in the year 2019, and the 12th – 13th SMW in the year 2020, respectively. In the case of both Langra and Chausa, the FB stage was seen during the 13th and 14th SMW in the year 2019 and 2020 respectively. In Dashehari, Langra, and Amrapali, the FS stage coincided with FB during the 12th, 13thand 14th SMW respectively during 2018–19, which got delayed in all four cvs by one week respectively. Chausa was the last to display fruit set stage (FS) (Figure 6).

3.3. Pattern of flowering and fruiting in response to climate

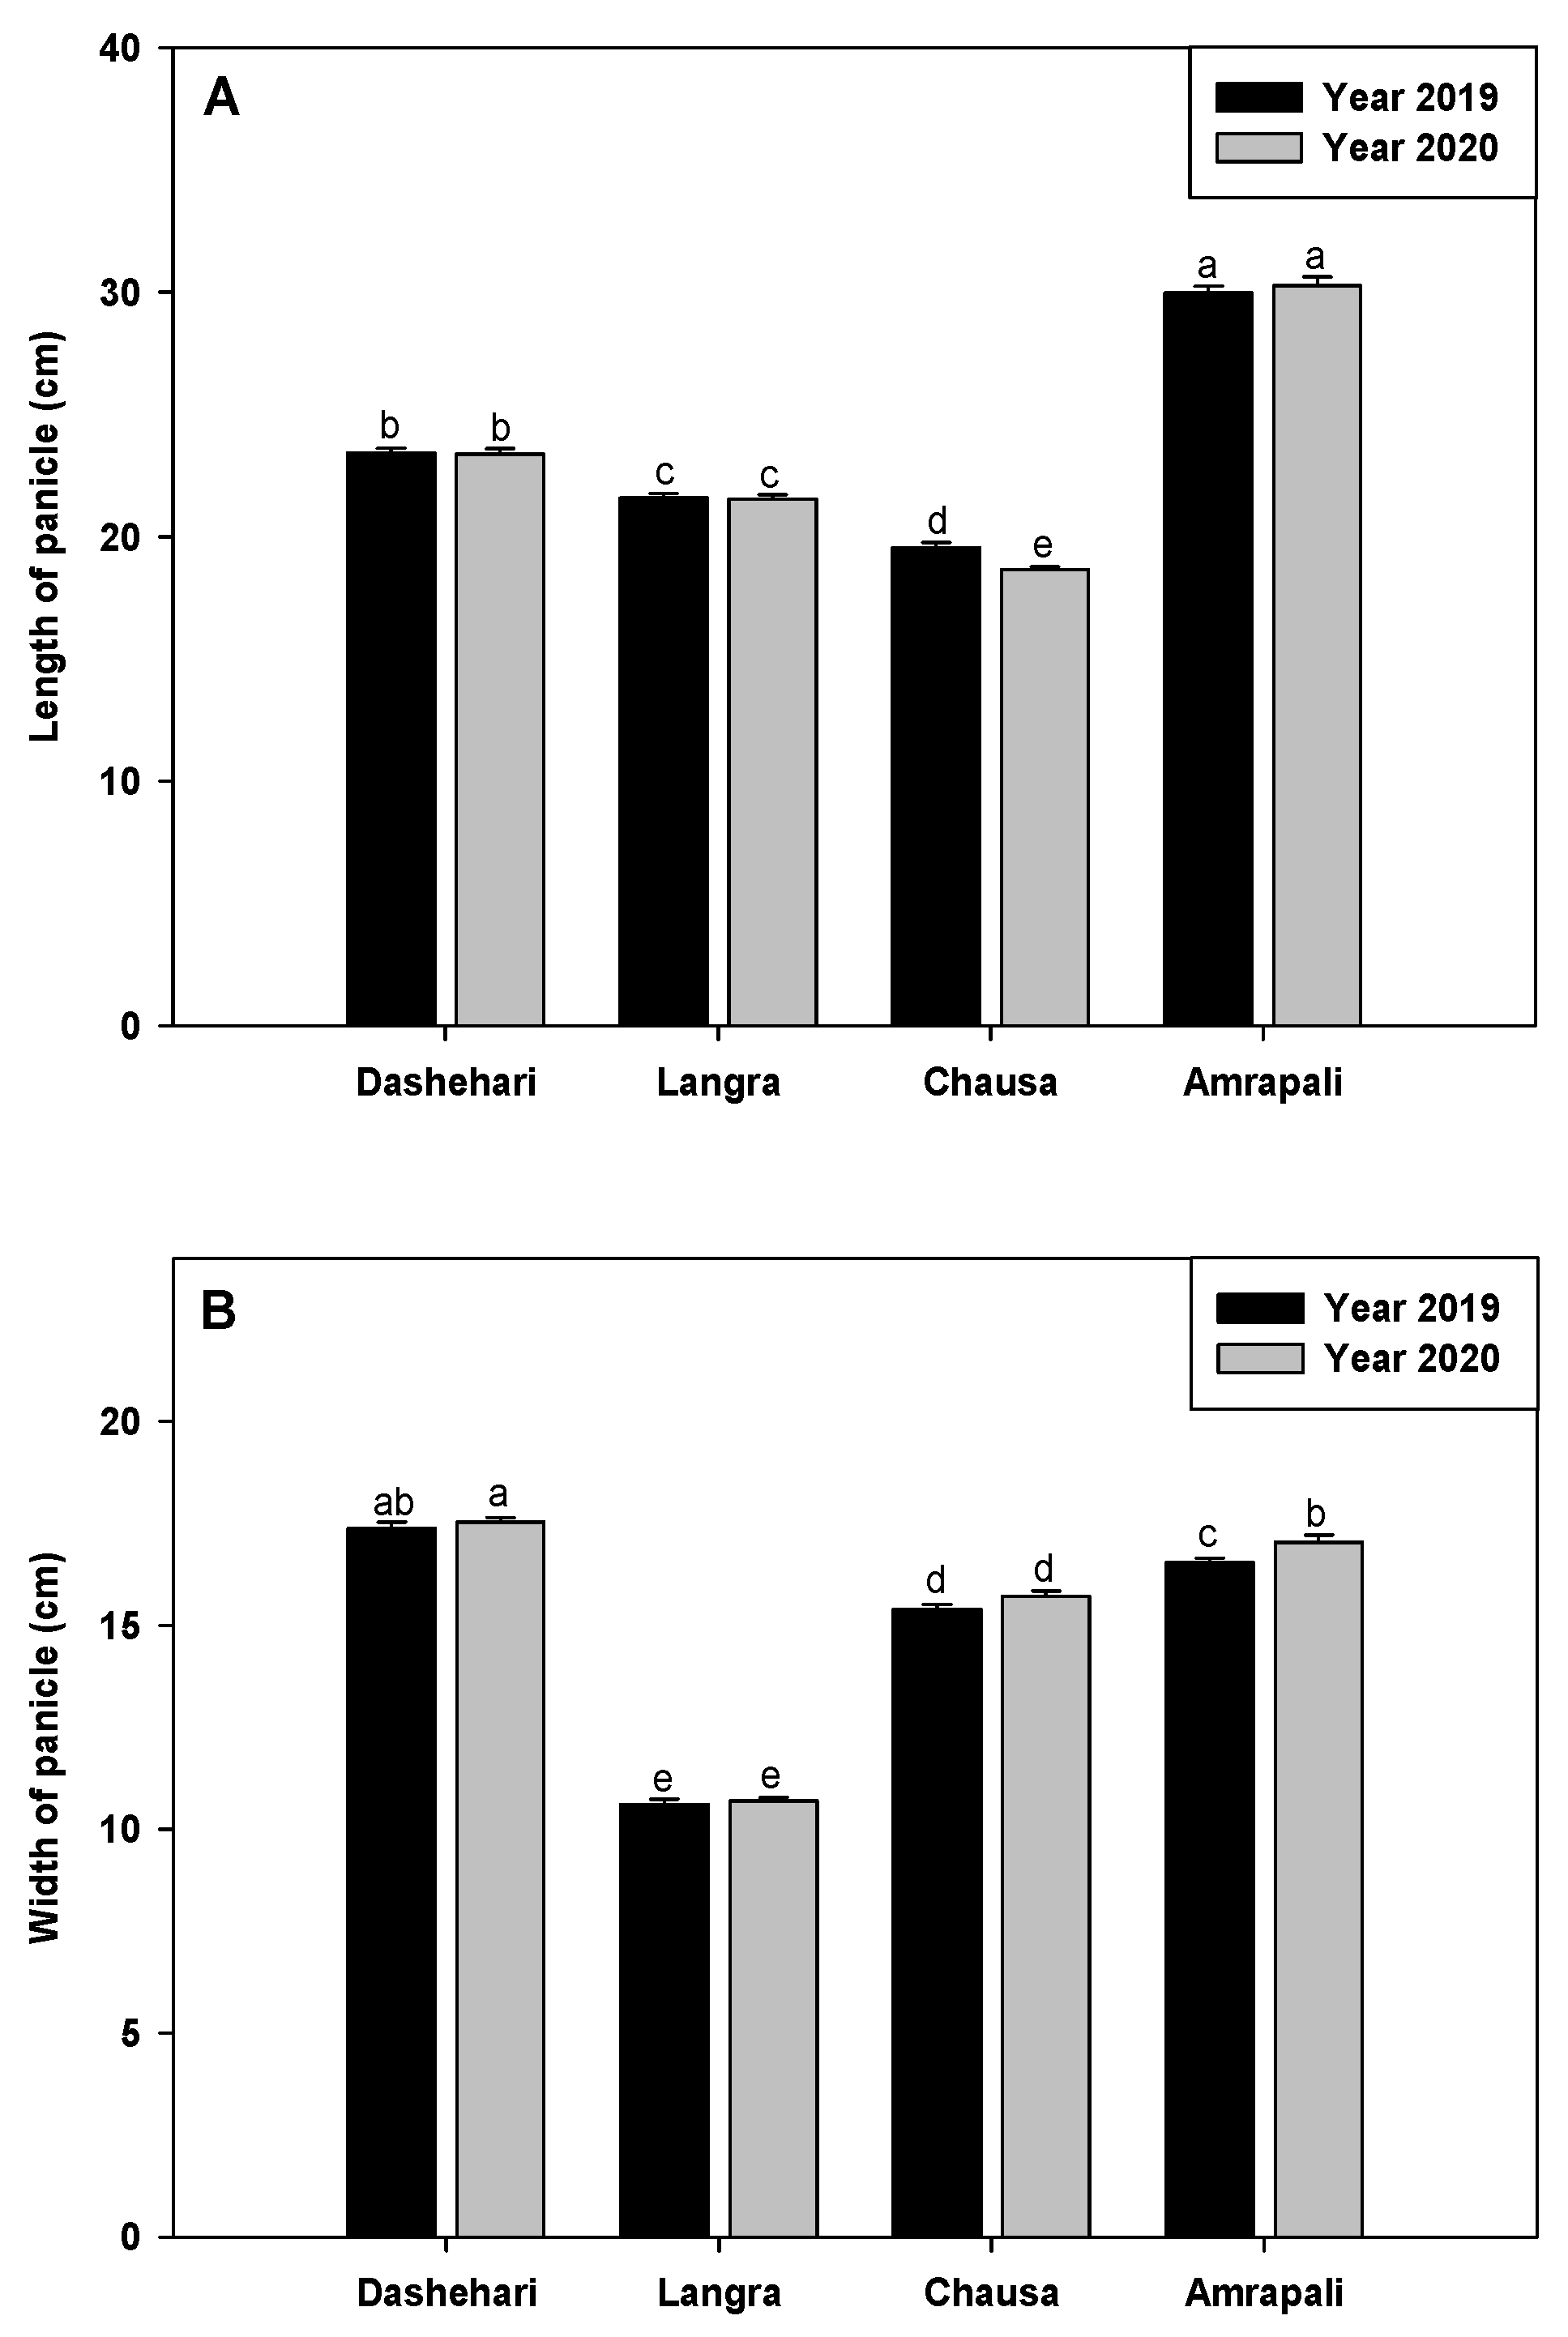
The data pertaining to flowering attributes viz length of panicle (PL), the width of panicle (PW), percent of hermaphrodite flower (HF%), percent of flower intensity (FI%) and percent of fruit set (FS%) of candidate cvs. Dashehari, Langra, Chausa and Amrapali were recorded during the flowering season in the years 2019 and 2020. Further, the results were analysed based on the percent increase or decrease in alternate bearing cvs with consideration of regular bearer Amrapali as reference (Control). The maximum panicle length was observed in cv. Amrapali in the two years under study followed by Dashehari, Langra and Chausa. Panicle length was found to be significantly decreased in cv. Chausa in the year 2020, implying its vulnerability to changed weather conditions (Figure 7A). Furthermore, significant variations were recorded for panicle width in cv. Amrapali (Figure 7B).
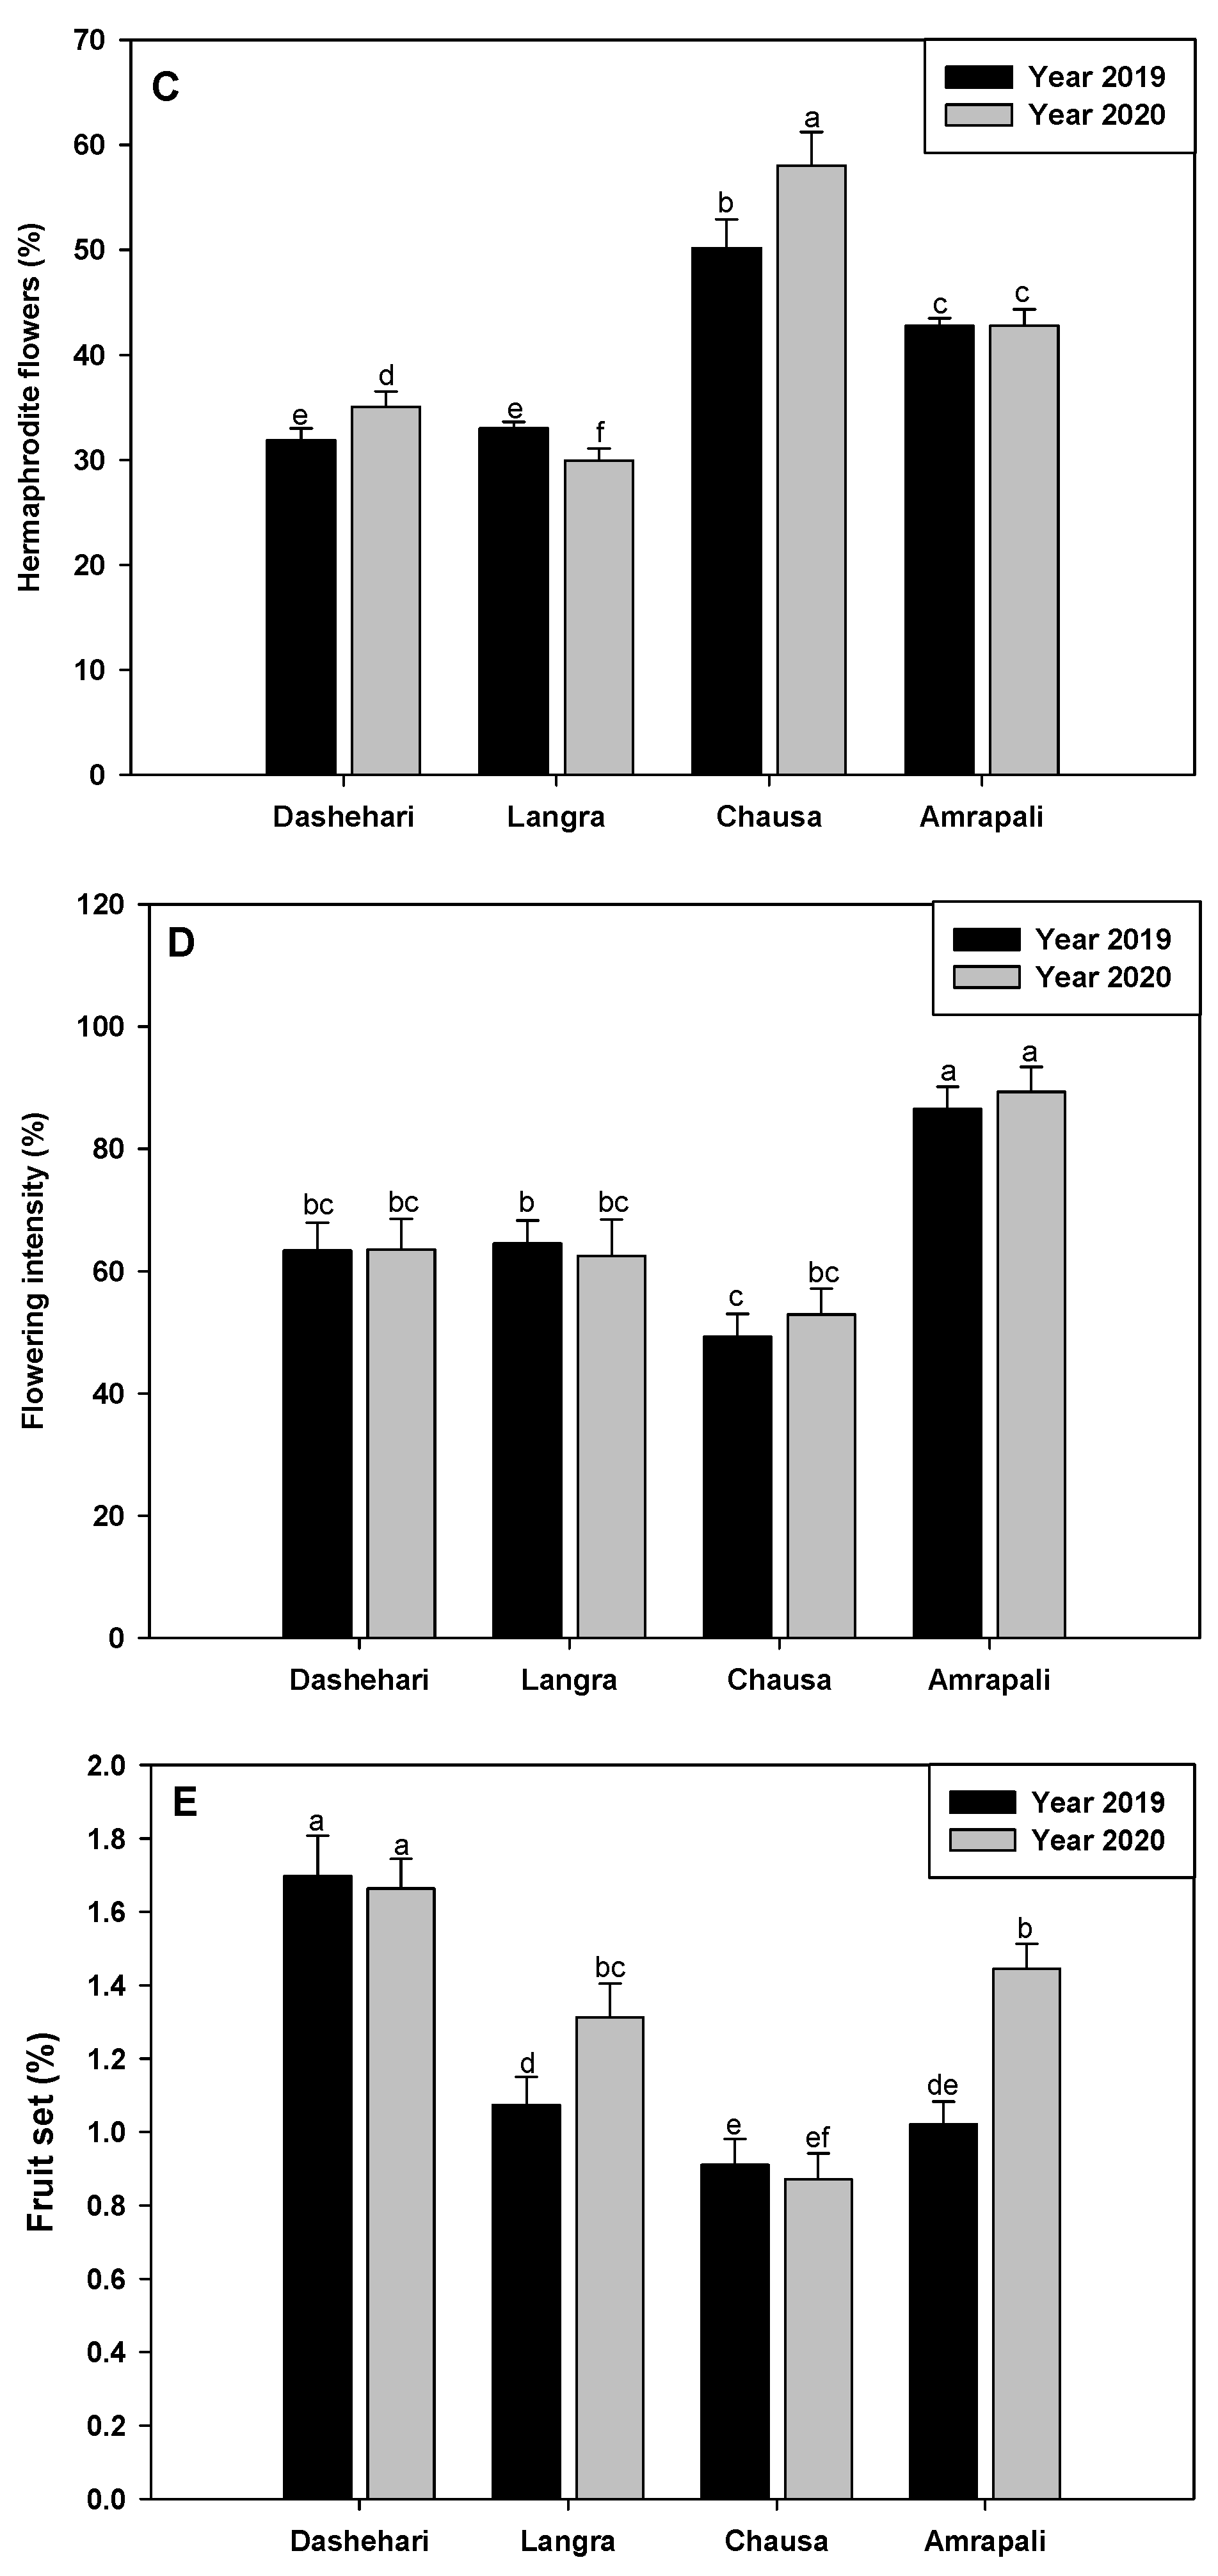
Maximum hermaphrodite flowers (HF%) were recorded in Chausa in both the years under study (Figure 1C). HF% is an important attribute affecting fruit set and yield and was found most variable in the two years in the case of the three alternate bearing cultivars. While Dashehari and Chausa had enhanced HF% in the season of 2020, Langra had reduced HF% in the flowering season of 2020 (Figure 7C). A significant variation in hermaphrodite % in the two years implies changes in phenostage FS brought about by the prevailing climatic conditions that can influence fruit set.
The Flowering Intensity (FI%) was found to be maximum in regular bearer Amrapali cultivars in both the years 2019 and 2020. In Dashehari, Langra and Chausa, the FI% was comparatively less and calculated as decreased by 27%, 25% and 43% respectively (Compared to Amrapali) during the year 2019. There were non-significant variations for FI% in the two years, thereby proving that flowering intensity was genotype-dependent and less impacted by prevalent weather in the two years (Figure 7D).
Even though the Fruit Set (FS%) and FI% of flowering plants are inextricably linked, the initial FS is influenced by pollinator activity and immediate small-scale weather conditions prevalent during anthesis and anther dehiscence. Various biotic (pathogens, infestation, cross–pollination by native pollinators), abiotic (temperature, wind speed, light intensity, etc.), and plant architecture variables (plant density, canopy etc) are known to influence fruit set. The Dashehari cultivar had the highest FS% during the observed study, while Amrapali, despite having the highest FI, had a lesser initial fruit set, thus confirming the better adaptability of Dashehari to the subtropical conditions. Significant variations for FS% were recorded in the two years under study for Langra and Amrapali. In the case of Chausa, the FS% was lowest, but statistically at par in the years 2019 and 2020 (Figure 7E).

3.4. Correlation studies of flowering intensity with weather parameters

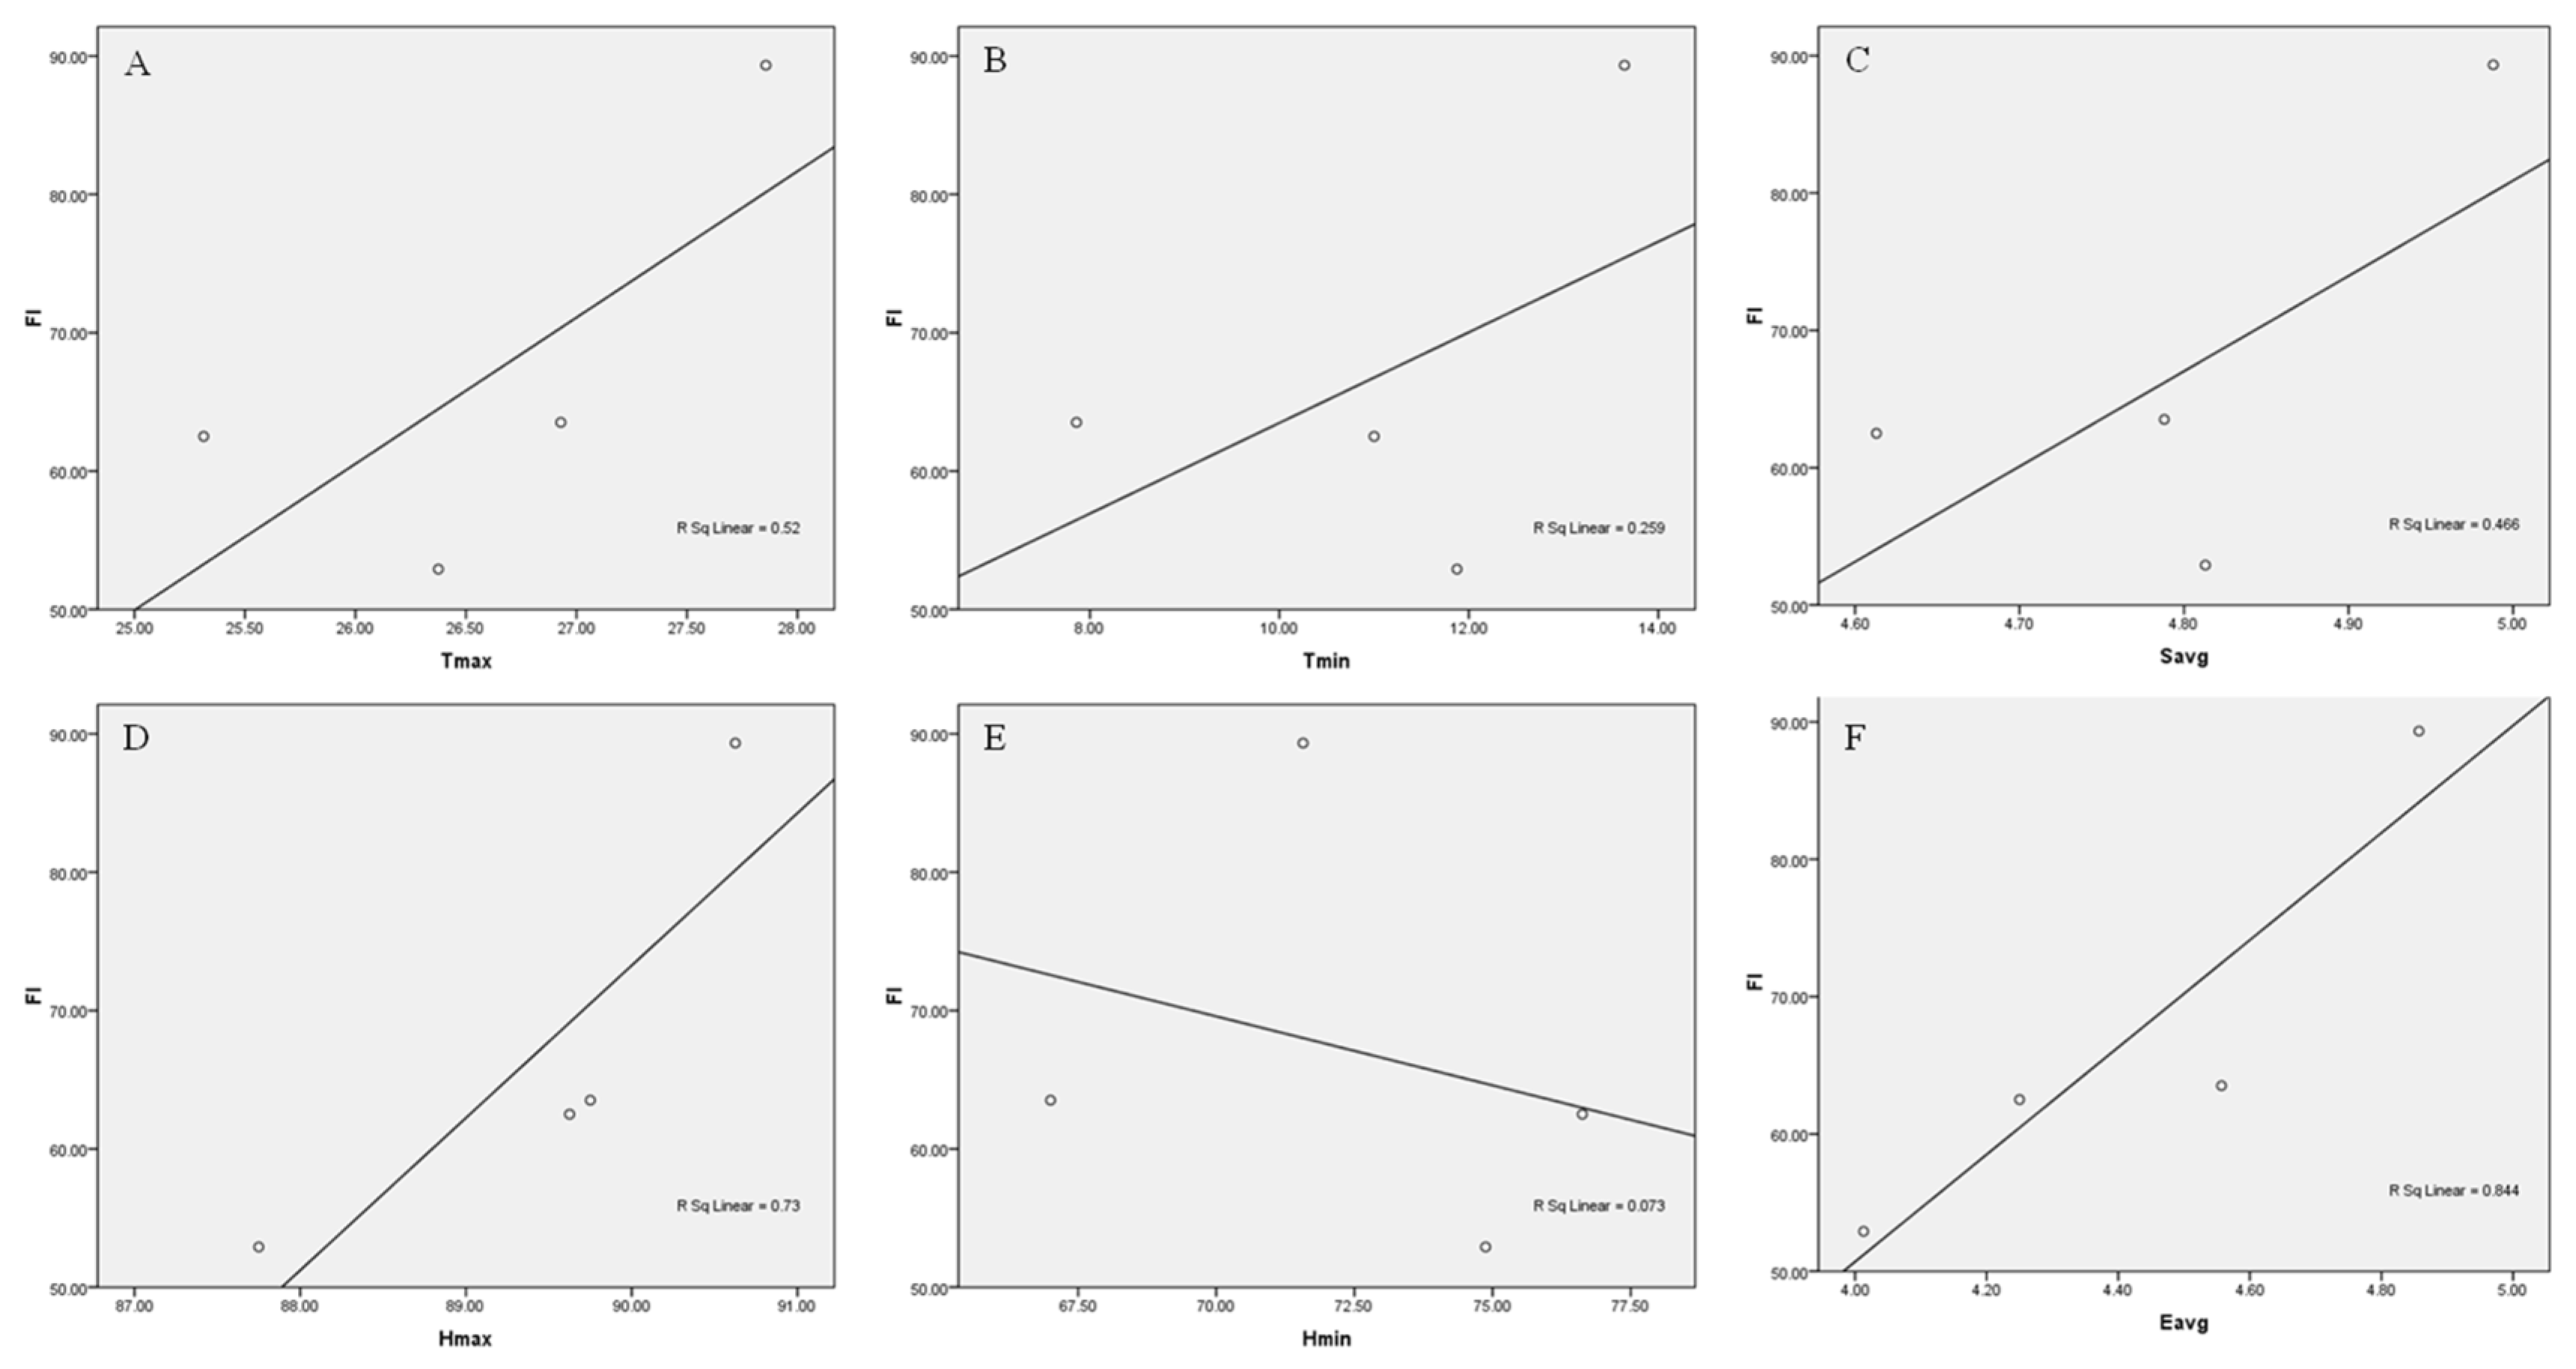
The correlation studies of flowering intensity were performed with weather parameters for both the years under study. The impact of the aforementioned weather parameters on flowering intensity is depicted in Figure 8 and Figure 9 for the flowering years 2019 and 2020 respectively. The results showed that flowering intensity was positively correlated with Tmax (0.851, Figure 8A; 0.520; Figure 9A respectively), Tmin (0.422, Figure 8B; 0.259, Figure 9B respectively), Savg (0.233, Figure 8C; 0.466, Figure 9C respectively), Hmax (0.639, Figure 8D; 0.73, Figure 9D respectively), Eavg (0.558, Figure 8F; 0.844, Figure 9F), whereas it was negatively correlated with the Hmin (–0.477, Figure 8E; –0.073, Figure 9E respectively).
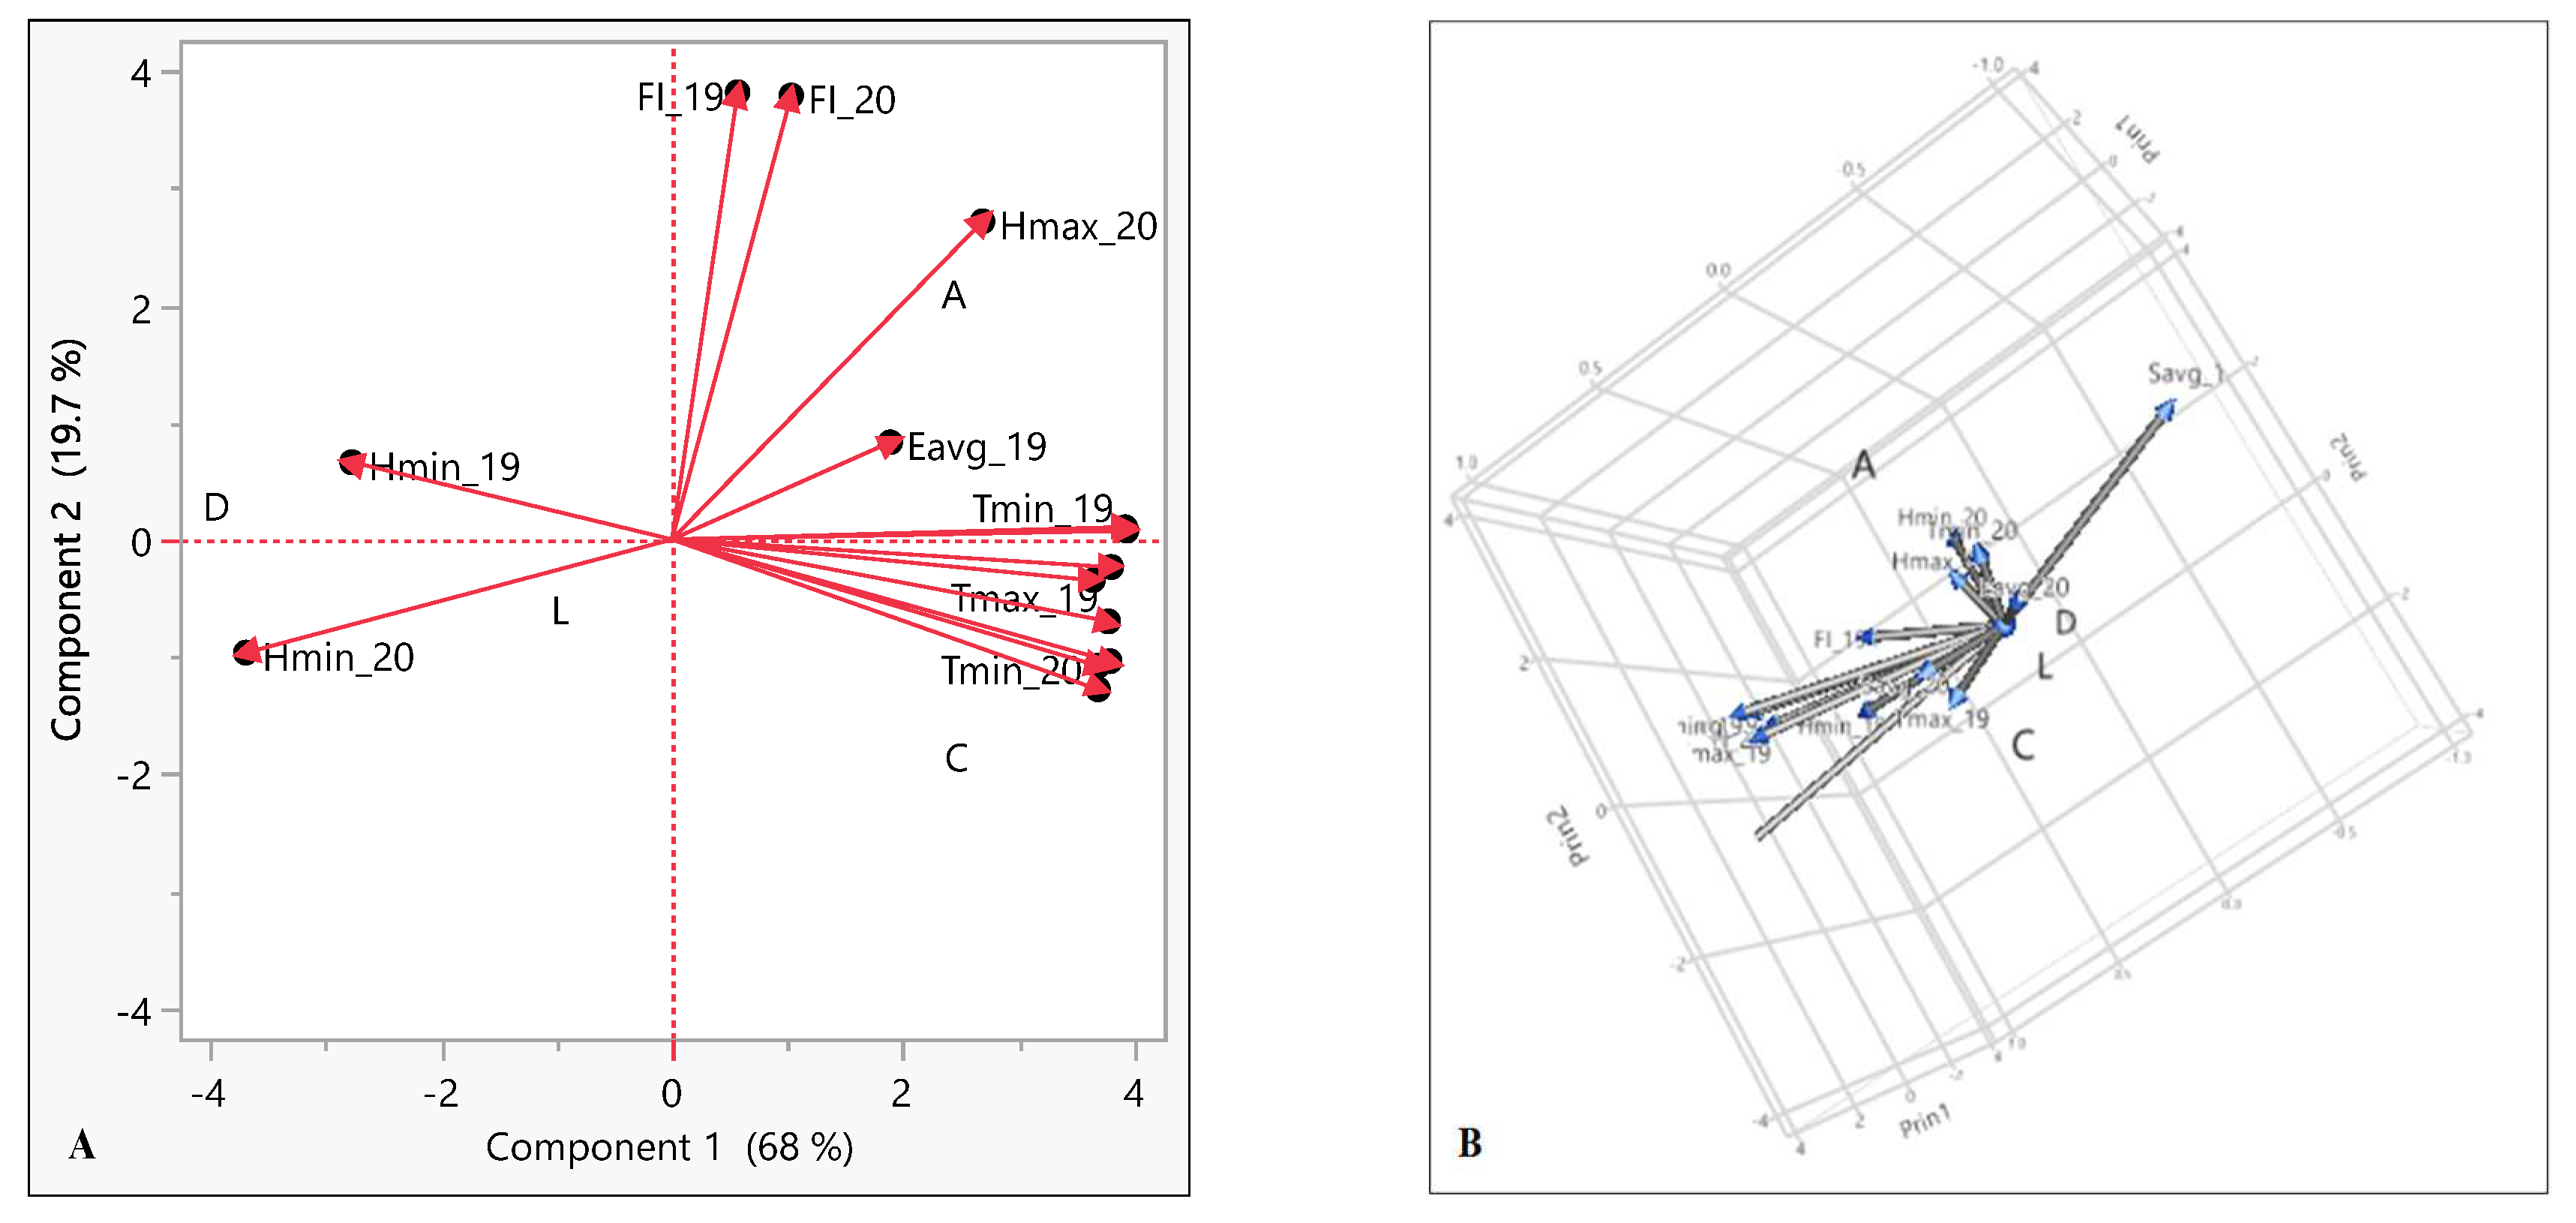
The correlation study was further validated by plotting all the variables of both flowering seasons (the years 2019 and 2020) in a single picture (Figure 10). For this purpose, the principal component analysis (PCA) and 3D score plot were used to better understand the effect of environmental cues on the flowering intensity of mango cultivars (Figure 10A and Figure 10B respectively). The findings revealed an advanced model that explained how all variables interacted with one another. The PCA and 3D score plot indicate that flowering intensity was positively correlated with Tmax, Hmax, Savg and Eavg whereas a negative correlation was established with Hmin.

4. Discussion

Plant phenology is sensitive to climate change; the timing of flowering has served as a visible indicator of plant phenology in numerous studies. Flowering is a key event that takes place for the survival of angiosperms upon encountering stress besides being a mode of perpetuation. The present investigation is based on the work carried out at ICAR–CISH, Lucknow (subtropics) by collecting phenological data and analysing them according to BBCH (BiologischeBundesanstalt, Bundessortenamt und ChemischeIndustrie) scale developed earlier for mango [25,29]. The recorded observation describes the growth and developmental stages of mango floral buds. The influence of weather parameters on mango flower phenology was recorded over 2 years (2018–2020).
The variation in the panicle length and width among the cultivars is mainly due to the fact that genetic constitution of the cultivars and their interaction with the physicochemical conditions and more specifically the physiological conditions of the shoot [7]. This finding was also closely confirmed by other workers [26,30]. Prasad and their co–worker [31] observed that high levels of carbohydrates in the pre–flowering phase may stimulate panicle formation and subsequently flowering intensity. In our study, we also observed a higher level of carbohydrate in Amrapali (data unpublished) which proportionally correlated with the panicle length and flower intensity. In general, it was observed that per cent hermaphrodite flowers were less in early emerged panicles compared to late emerged panicles in all the parental mango cultivars. The lesser number of hermaphrodite flowers in early emerged flowers may be attributed to the fact that cool weather during inflorescence contributes to the fewer perfect flowers [32,33]. In our study, we observed a higher number of hermaphrodite flowers in late variety viz. Chausa and Amrapali. A similar line of the result was obtained by Geeta and her coworkers [34]. It is reported that low temperatures (10–15 °C or below 15 °C) during flowering increased the proportion of staminate flowers while high temperatures increased hermaphrodite flowers [34,35]. Present results are in strong conformity with the findings of Singh et al. [33]. They reported that the panicles emerging during the middle and end of the flowering season produce more perfect flowers, than the early breaking panicles. Based on the results, it may be concluded that the frequency of the hermaphrodite flower is directly proportional to temperature. The variation in the fruit set could be due to genotypic differences. The ability of cultivars to bear fruit set also depends upon the availability of pollen, its viability, populations of pollinating insects and self and cross–compatibility of a cultivar and with other cultivars respectively as well as on an off–year of particular plants [36]. Fruit set is a varietal character depending upon several factors such as time of flowering, sex ratio, efficient cross–pollination and intensity of drop, and weather like rain and hailstorm.
Flowering in many plant species is promoted by temperature, sunshine (photoperiod) or autonomous factors, or some combination thereof [37,38], suggesting that this event is triggered by environmental as well as genetic clues. Normand et al. [39] assessed climate change and its probable effects on mango production and cultivation. They predicted climate for the end of the 21st century, with respect to the mean climate of the last 20 years of the 20th century was warmer and wetter in South Asia conditions and drier and moderately warmer in the Caribbean islands probably leading to lower floral induction. Moreover, in the case of mango, the flower ontogenesis stage (December to March) is a critical phenological stage as weather parameters have a strong influence on flower development. As it is well–known flowering in mango is under environmental control, most probably the photo–thermo period [40].
The plant remains visually dormant for about 3 months during winter [26]. Dormant buds of mango are non–differentiated, consisting of an arrested apical meristem and a set of preformed nodes. Floral induction refers to the commitment of the bud to develop into a floral shoot. There are three necessary parts to flower induction: mature leaves, active growth and inductive temperatures during the early stages of shoot development [41]. Analysis of weather data suggests that floral induction (BS stage) needs comparatively lower maximum and minimum temperatures than other phases. The average maximum and minimum temperature was observed between 20°C and 5°C respectively for flowering induction. Further, the transition of the BS stage required a progressive increase in day and night temperature. However, the difference in range between average maximum and minimum temperature (TavgR= Tavg Max – Tavg Min) should fall between 10–20°C during the flowering development process. In the study conducted by Naphrom et al. [42] suggests that floral morphogenesis in mango needs a cool temperature of around 15°C. Pérez–Barraza and their co–workers [43], in a study with the mango cultivar Ataulfo, concluded that the beginning of floral bud development was stimulated at night temperatures around 15 ºC. Rangare and their co–workers [44] also found a similar line of observation. The aforementioned finding ofNaphrom et al. [42], Pérez–Barraza et al. [43] and Rangare et al. [44] strongly supports our observation. Another study, carried out by Naphrom et al. [42] suggests that climactic factors that affect flower initiation might be due to major phytohormone levels in the leaves and shoots of mango trees. Temperature significantly affects the synthesis/degradation of endogenous growth hormone in plant cells and consequently affects floral morphogenesis. In our earlier study, we also found a significant variation in phytohormone along with other biochemical changes in floral shoots [45]. Moreover, the flowering response of mango to environmental factors such as temperature varies with genotypes [46]. Humidity may affect flowering phenology, particularly as a secondary trigger [47], although the mechanism is unclear. In our study, we also observed that Hmax was positively correlated with flowering intensity while a negative correlation with Hmin was established. Primack et al. [48] pointed out that humidity could have contributed to earlier flowering in their study, which remains to be addressed in future studies. Sunshine (photoperiod) is another important environmental cue that affects on induction of flowering in mango trees, regardless of the cultivation site. However, mango trees responded to temperature variations more critically than to photoperiods as evidenced by the different times of flowering at different places in the world [46,49]. This is because little is known about its contribution to the process. In mango flowering, inflorescences are normally emitted on the outer edges of the plant canopy or in branches more exposed to light. Therefore, access to sunlight is relevant, especially for uniform flowering and hence the number of panicles per plant. In this study, we observed that sunshine was also positively correlated with flower intensity. Davenport [21] reported that mango leaves are demanding sunlight for flowering under unfavourable inductive conditions. Branches exposed to lower light intensities tend to produce vegetative branches, while those exposed to full sun initiate reproductive branches. The Sunshine always positively correlated with photosynthesis rate. In view of this, higher sunshine may increase biomass (carbohydrate) production via the fixing of atmospheric carbon. Pongsomboon et al. [50] stated that mango flowering is induced by high carbohydrate levels. Moreover, Mouco et al. [51] highlighted that the amount of carbon fixed in this process and consequent distribution to different plant organs are important for the events occurring during the plant phenological cycle. Furthermore, Das et al. [52] established that in a normal flowering year, the mango cultivar ‘Amparali’ can maintain carbohydrate contents above the limit for optimal source–to–sink transfers; conversely, the other cultivars, under the same conditions, cannot maintain high carbohydrate levels and hence has its flowering impaired. The evaporation rate also impacts the flowering phenomenon by creating water stress/non–stress conditions.
In the present study, we observed that the higher evaporation rate had a positive impact on flowering intensity. It has been demonstrated that the floral stimulus originates from mature leaves in mango and young leaves inhibit the floral initiation of buds [53]. It is possible that water stress restricts the growth of new leaves and increases the proportion of mature and inductive leaves and consequently makes the trees more receptive to the marginally inductive temperatures in the warm tropics [54]. Another study conducted on a subtropical fruit crop facing alternate bearing problems viz Litchi chinensis by JiShen et al. [55] revealed that water stress followed by cold temperature caused earlier floral induction. The result observed by JiShen and his co–worker [55] supports our finding.

5. Conclusions

Mango flowering is affected by several factors related to weather parameters. Climatic differences in temperature, humidity, sunshine, humidity and evaporation directly affect mango phenology. Such disparities can also alter the period for suitable vegetative growth (hot temperatures, heavy rains) and an optimal floral induction (cool temperatures, drought). Cultivation practices must be adapted to such local conditions to stimulate early vegetative growth and therefore promote high and regular production of mango fruits. Considering the major impact of phenology on trees productivity and reproductive success, it seems urgent to collect wide data on the endo–dormancy break date of major forest and fruit tree species, but also to carry out new experiments and invent new techniques to measure dormancy to better understand its exogenous and endogenous determinism. This is the prerequisite to inventing and testing new phenological models that will be able to provide more robust projections for the future. A study of such a kind could result in accurate fate for flowering frequency in mango.

Author Contributions

Conceptualization, AB, MT; methodology, AB, YB, SKS and Laxmi; software, YB and SKS; validation, AB and YB; formal analysis, AB, YB and SKS; investigation, YB, AB; resources, YB, and AB; data curation, AB, YB SKS and ST; writing, original draft preparation, AB, YB, SKS and ST; writing–review and editing, AB, MT, YB, SKS and ST. All authors have read and agreed to the published version of the manuscript.

Funding

This research received funds from the Indian Council of Agricultural Research, New Delhi, India.

Institutional Review Board Statement

Not Applicable.

Consent for publication

All authors have seen the latest version of the manuscript and agree to its publication.

Data Availability Statement

Not Applicable.

Acknowledgments

The corresponding authors wish to thank the Director, ICAR–Central Institute for Subtropical Horticulture, Lucknow, India, for providing Guidance, necessary facilities and encouragement during the investigation.

Conflicts of Interest

The authors declare that there is no conflict of interest or personal relationships that could have appeared to influence the work reported in this paper.

References

  1. Rastegar, S.; Khankahdani, H.H.; Rahimzadeh, M. Effects of melatonin treatment on the biochemical changes and antioxidant enzyme activity of mango fruit during storage. Sci. Hortic. 2020, 259, 108835. [Google Scholar] [CrossRef]
  2. Nguyen, T.T.; Kato, M.; Ma, G.; Zhang, L.; Uthairatanakij, A.; Srilaong, V.; Laohakunjit, N. and Jitareerat, P. Electron beam radiation delayed the disassembly of cell wall polysaccharides in harvested mangoes. Postharvest Biol. Technol. 2021, 178, 111544. [Google Scholar] [CrossRef]
  3. Rosenzweig, C.; Karoly, D.; Vicarelli, M.; Neofotis, P.; Wu, Q.; Casassa, G.; Menzel, A.; Root, T.L.; Estrella, N.; Seguin, B.; et al. Attributing physical and biological impacts to anthropogenic climate change. Nature 2008, 453, 353–357. [Google Scholar] [CrossRef]
  4. Menzel, A.; Fabian, P. Growing season extended in Europe. Nature 1999, 397, 659. [Google Scholar] [CrossRef]
  5. Menzel, A.; Sparks, T.H.; Estrella, N.; Koch, E.; Aasa, A.; Ahas, R.; Alm-Kübler, K.; Bissolli, P.; Braslavská, O.G.; Briede, A.; et al. European phenological response to climate change matches the warming pattern. Glob. Chang. Biol. 2006, 12, 1969–1976. [Google Scholar] [CrossRef]
  6. Chuine, I.; Bonhomme, M.; Legave, J.M.; García de Cortázar-Atauri, I.; Charrier, G.; Lacointe, A.; Améglio, T. Can phenological models predict tree phenology accurately in the future? The unrevealed hurdle of endodormancy break. Glob. Chang. Biol. 2016, 22, 3444–3460. [Google Scholar] [CrossRef]
  7. Tiwari, D.K.; Patel, V.B.; Pandey, A.K. Floral induction in mango: Physiological, biochemical, and molecular basis. Int. J. Chem. Stud. 2018, 6, 252–259. [Google Scholar]
  8. Hewitt, S.L.; Hendrickson, C.A.; Dhingra, A. Evidence for the Involvement of Vernalization–related Genes in the Regulation of Cold–induced Ripening in ‘D’Anjou’ and ‘Bartlett’ Pear Fruit . Sci. Rep. 2020, 10, 8478. [Google Scholar] [CrossRef]
  9. Parmesan, C. Ecological and evolutionary responses to recent climate change. Annu. Rev. Ecol. Evol. Syst. 2006, 37, 637–669. [Google Scholar] [CrossRef]
  10. Körner, C.; Basler, D. Phenology under global warming. Science 2010, 327, 1461–1462. [Google Scholar] [CrossRef]
  11. Sravani, V. Effect of climate change on major tropical and sub–tropical fruit crops. J. Pharmacogn. Phytochem. 2020, 9, 1710–1712. [Google Scholar]
  12. Wang, J.; Czech, B.; Weigel, D. miR156–regulated SPL transcription factors define an endogenous flowering pathway in Arabidopsis thaliana. Cell 2009, 138, 738–749. [Google Scholar] [CrossRef] [PubMed]
  13. Wang, J.W. Regulation of flowering time by the miR156–mediated age pathway. J. Exp. Bot. 2014, 65, 4723–4730. [Google Scholar] [CrossRef]
  14. Wang, J.; Ding, J. Molecular mechanisms of flowering phenology in trees. J. For. Res. 2023, 3, 2. [Google Scholar] [CrossRef]
  15. Malhotra, S.K.; Singh, S.K.; Nath, V. Physiology of flowering in litchi (Litchi chinensis): A review. Indian J. Agric. Sci. 2018, 88, 1319–1330. [Google Scholar] [CrossRef]
  16. Kulkarni, V.J. Further studies on graft–induced off season flowering and fruiting in mango (Mangiferaindica L.). J. Hortic. Sci. 1986, 63, 361–367. [Google Scholar] [CrossRef]
  17. Hudson, I.L.; Kim, S.W.; Keatley, M.R. Climatic influences on the flowering phenology of four Eucalypts: a GAMLSS approach. In In Phenological Research; Springer Netherlands, 2010; pp. 209–228. [Google Scholar]
  18. Pau, S.; Wolkovich, E.M.; Cook, B.I.; Nytch, C.J.; Regetz, J.; Zimmerman, J.K.; Joseph Wright, S. Clouds and temperature drive dynamic changes in tropical flower production. Nat. Clim. Change 2013, 3, 838–842. [Google Scholar] [CrossRef]
  19. Wright, S.J. Seasonal drought and the phenology of understory shrubs in a tropical moist forest. Ecology 1991, 72, 1643–1657. [Google Scholar] [CrossRef]
  20. Shii, Z.H. Effect of temperature on the flowering biology and fertilization of mangoes (Mangifera indica L..). J. Appl. Hort. 1999, 1, 79–83. [Google Scholar] [CrossRef]
  21. Davenport, T.L. Reproductive physiology. In The mango: botany, production and uses; CABI: Wallingford, UK, 2009; pp. 97–169. [Google Scholar]
  22. Bhatt, R.; Hossain, A. Concept and consequence of evapotranspiration for sustainable crop production in the era of climate change. Adv. Evapotranspiration Methods Appl 2019, 1, 1–13. [Google Scholar] [CrossRef]
  23. Zhang, R.; Lin, J.; Wang, F.; Delpierre, N.; Kramer, K.; Hänninen, H.; Wu, J. Spring phenology in subtropical trees: Developing process–based models on an experimental basis. Agric. For. Meteorol. 2022, 314, 108802. [Google Scholar] [CrossRef]
  24. Rajan, S.; Tiwari, D.; Singh, V.K.; Saxena, P.; Singh, S.; Reddy, Y.T.N.; Upreti, K.K.; Burondkar, M.M.; Bhagwan, A.; Kennedy, R. Application of extended BBCH scale for phenological studies in mango (Mangiferaindica L..). J. Appl. Hort. 2011, 13, 108–114. [Google Scholar]
  25. Rajan, S.; Ravishankar, H.; Tiwari, D.; Singh, V.K.; Saxena, P.; Singh, S.; Reddy, Y.T.N.; Upreti, K.K.; Burondkar, M.M.; Bhagwan, A.; et al. Harmonious phenological data: a basic need for understanding the impact of climate change on mango. In Climate–resilient horticulture: adaptation and mitigation strategies 2013, 53–65. [CrossRef]
  26. Azam, K.; Mir, H.; Kumar, R. and Ahmad, F. Study on flowering behaviour of elite mango cultivars in subtropical conditions of Bihar. Int. J. Chem. Stud. 2018, 6, 2913–2917. [Google Scholar]
  27. Kumar, M.; Ponnuswami, V.; Kumar, P.J.; Saraswathy, S. Influence of season affecting flowering and physiological parameters in mango. Sci. Res. Essays 2014, 9, 1–6. [Google Scholar] [CrossRef]
  28. Sharma, D.K.; Singh, R.N. Studies on some pollination problems in mango (Mangiferaindica L..). Indian J. Hort. 1969, 26, 1–5. [Google Scholar]
  29. Hernández Delgado, P.M.; M. Aranguren, C.; Reig, D.; Fernandez Galvan, C.; Mesejo, A.; Martinez Fuentes, V.; Sauco, G.; Agusti, M. Phenological growth stages of mango (Mangiferaindica L..) according to the BBCH scale. Sci. Hortic. 2011, 130, 536–540. [CrossRef]
  30. Singh, R.; Manav, M.K.; Sharma, A. Effect of weather parameters (Abiotic factors) on flowering fruiting and quality behaviour of mango cultivars. The Ecosan. 2014, 6, 103–109. [Google Scholar]
  31. Prasad, S.S.; Reddy, Y.T.N.; Upreti, K.K.; Rajeshwara, A.N. Studies on changes in carbohydrate metabolism in regular bearing and “off” season bearing cultivars of mango (Mangifera indica L..) during flowering. Int. J. Fruit Sci. 2014, 14, 437–459. [Google Scholar] [CrossRef]
  32. Naik, K.C.; Rao, M.M. Studies on the blossom biology and pollination in mangoes (Mangifera indica L..). Indian J Hortic. 1943, 1, 107–119. [Google Scholar]
  33. Singh, A.R.; Singh, N.D. Studies on bloom biology and pollination in mango (Mangifera indica L.). Recent Hortic. 1996, 3, 4–7. [Google Scholar]
  34. Geetha, G.A.; Shivashankara, K.S.; Reddy, Y.T.N. Varietal variations in temperature response for hermaphrodite flower production and fruit set in mango (Mangifera indica L.). S. Afr. J. Bot. 2016, 106, 196–203. [Google Scholar] [CrossRef]
  35. Ramirez, F; Davenport, T.L. Mango (Mangifera indica L..) flowering physiology. Sci. Hortic. 2010, 126, 65–72. [Google Scholar] [CrossRef]
  36. Anjum, M.A.; Chattha, G. A; Sultan, A; Abbas, S. Studies on flowering behavior, fruit setting and extent of floral malformation in different cultivars of mango (Mangifera indica L.). Int. J. Agric. Biol. 1999, 1, 88–90. [Google Scholar]
  37. Ausin, I.; Alonso–Blanco, C.; Martinez–Zapater, J.M. Environmental regulation of flowering. Int J Dev Biol. 2005, 49, 689–705. [Google Scholar] [CrossRef] [PubMed]
  38. Davenport, T.L. Reproductive physiology of mango. Braz. J. Plant Physiol. 2007, 19, 363–376. [Google Scholar] [CrossRef]
  39. Normand, F.; Lauri, P.E.; Legave, J.M. Climate change and its probable effects on mango production and cultivation. Acta Hortic. 2015, 1075, 21–31. [Google Scholar] [CrossRef]
  40. Palanisamy, V.; Bhaskar Mitra, A.M.S.; Deepa Sankar, P. Studies on fruit bud differentiation in mango (Mangiferaindica L.). Res Plant Biol. 2011, 1, 55–67. [Google Scholar]
  41. Clonan, M.; McConchie, C.; Hall, M.; Hearnden, M.; Olesen, T.; Sarkhosh, A. Effects of ambient temperatures on floral initiation in Australian mango (Mangiferaindica L.) selections. Sci. Hortic. 2021, 276, 109767. [Google Scholar] [CrossRef]
  42. Naphrom, D.; Sruamsiri, P.; Hegele, M.; Boonplod, N.; Bangerth, F.; Manochai, P. Hormonal changes in various tissues of mango trees during flower induction following cold temperature. Acta Hortic. 2004, 645, 453–457. [Google Scholar] [CrossRef]
  43. Pérez–Barraza, M.; Avitia–García, E.; Cano–Medrano, R.; Gutiérrez–Espinosa, M.A.; Osuna–Enciso, T.; Pérez–Luna, A.I. Temperature and gibberellin inhibitors in the flowering process of mango cv.' Ataulfo’. Rev. Fitotec. Mex. 2018, 41, 543–549. [Google Scholar]
  44. Rangare, N.R.; Bhan, M.; Pandey, S.K. Assessment of weather effect on flower morphogenesis and fruit set in mango varieties in central India. J. Agric. Meteorol. 2022, 24, 33–37. [Google Scholar] [CrossRef]
  45. Bajpai, Y.; Trivedi, M.; Muthukumar, M.; Bajpai, A. Novel insights into biochemical and hormonal factors regulating floral transition in mango (Mangifera indica L.). Indian J. Biotechnol. 2021, 20, 54–64. [Google Scholar]
  46. Chacko, K.K.; Randhawa, G.S. Towards an understanding of the factors affecting flowering in mango (Mangifera indica L.). AAJ 1971, 18, 226–236. [Google Scholar]
  47. Pavón, N.P.; Briones, O. Phenological patterns of nine perennial plants in an intertropical semi–arid Mexican scrub. J. Arid Environ. 2001, 49, 265–277. [Google Scholar] [CrossRef]
  48. Primack, D.; Imbres, C.; Primack, R.B.; Miller-Rushing, A.J.; Del Tredici, P. Herbarium specimens demonstrate earlier flowering times in response to warming in Boston. Am. J. Bot. 2004, 91, 1260–1264. [Google Scholar] [CrossRef] [PubMed]
  49. Rajatiya, J.H.; Varu, D.K.; Halepotara, F.H.; Solanki, M.B. Correlation of Climatic Parameters with Flowering Characters of Mango. Int. J. Pure Appl. Biosci. 2018, 6, 597–601. [Google Scholar] [CrossRef]
  50. Pongsomboon, W.; Subhadrabandhu, S.; Stephenson, R. A.Some aspects of the ecophysiology of flowering intensity of mango (Mangifera indica L..) cv. Nam Dok Mai in a semi–tropical monsoon Asian climate. Sci. Hortic. 1997, 70, 45–56. [Google Scholar] [CrossRef]
  51. Mouco, M.A.D.C.; Ono, E.O.; Rodrigues, J.D. Synthesis inhibitors of gibberellins and mango 'Tommy Atkins' seedlings growth. Cienc. Rural 2010, 40, 273–279. [Google Scholar] [CrossRef]
  52. Das, A.; Geetha, G.A.; Ravishankar, K.V.; Shivashankara, K.S.; Roy, T.K.; Dinesh, M.R. Interrelations of growth regulators, carbohydrates and expression of flowering genes (FT, LFY, AP1) in leaf and shoot apex of regular and alternate bearing mango (Mangifera indica L.) cultivars during flowering. Sci. Hortic. 2019, 253, 263–269. [Google Scholar] [CrossRef]
  53. Kulkarni, V.J. Chemical control of tree vigour and the promotion of flowering and fruiting in mango (Mangiferaindica L.) using paclobutrazol. J. Horti. Sci. 1988, 63, 557–566. [Google Scholar] [CrossRef]
  54. Núñez–Elisea, R.; Davenport, T.L. Flowering of mango trees in containers as influenced by seasonal temperature and water stress. Sci. Hortic. 1994, 58, 57–66. [Google Scholar] [CrossRef]
  55. Shen, J.; Xiao, Q.; Qiu, H.; Chen, C.; Chen, H. Integrative effect of drought and low temperature on litchi (Litchi chinensis Sonn.) floral initiation revealed by dynamic genome–wide transcriptome analysis. Sci. Rep. 2016, 6, 32005. [Google Scholar] [CrossRef] [PubMed]
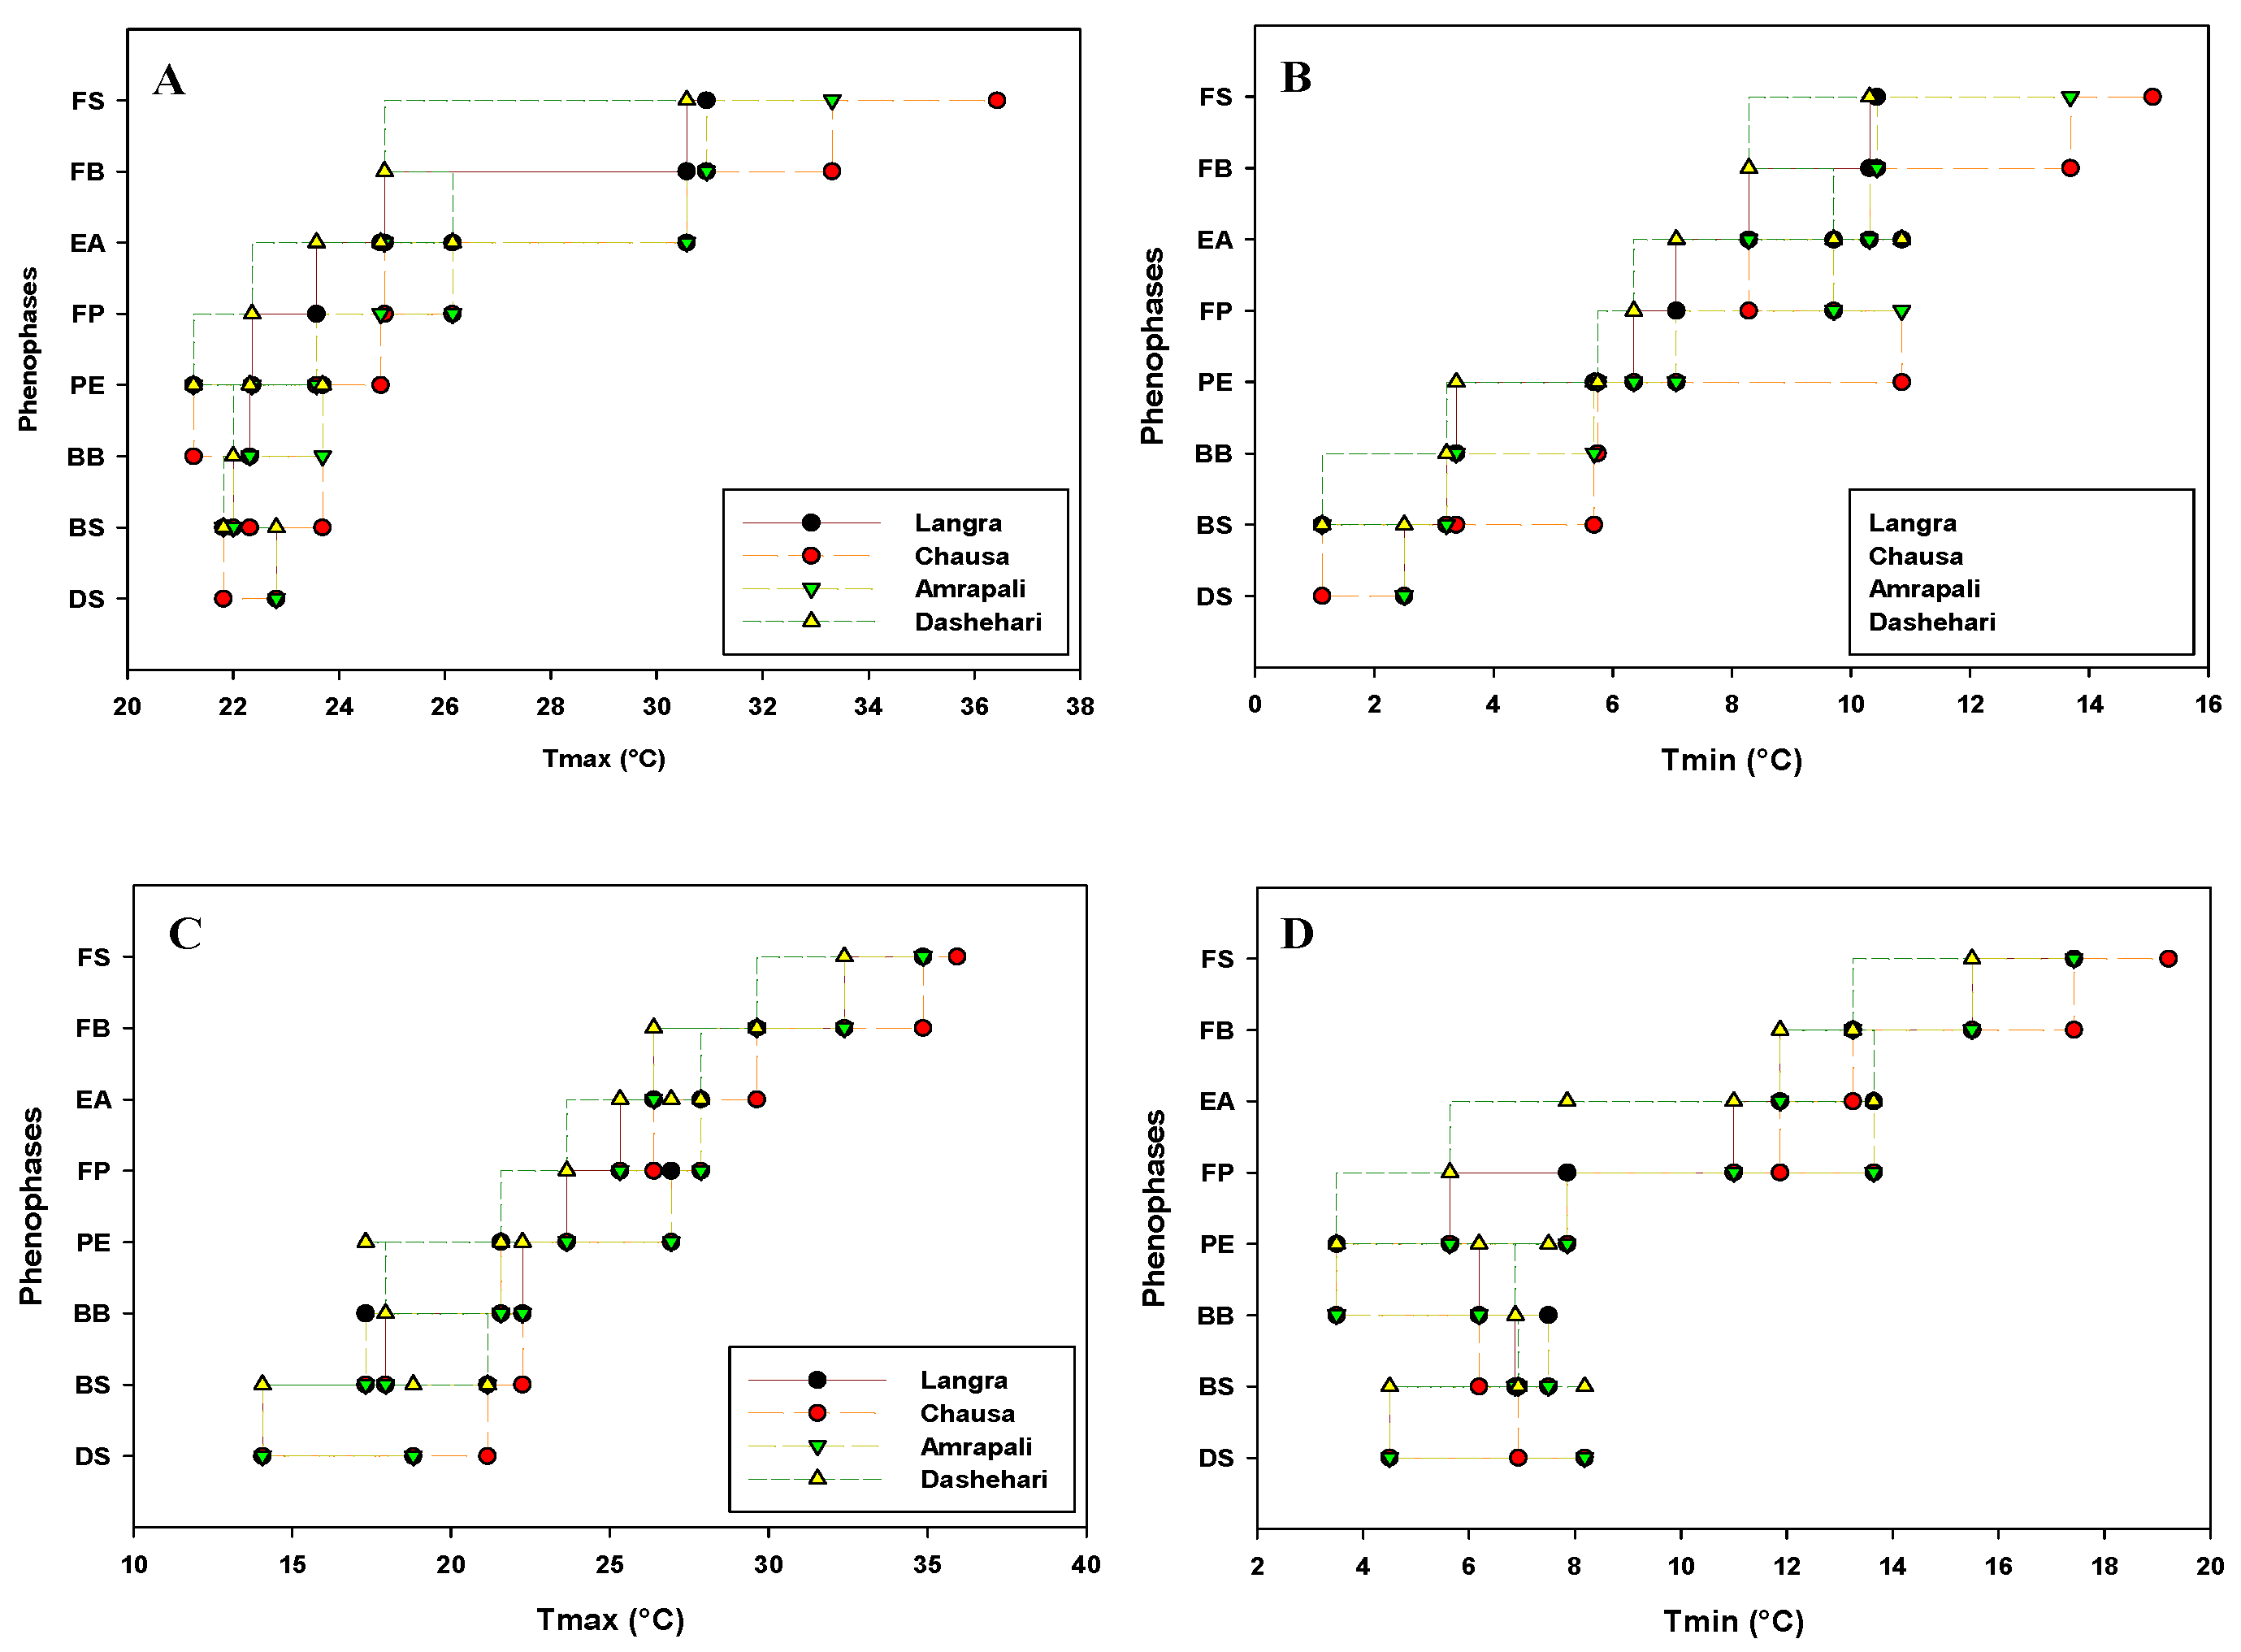
Figure 1. Effect of temperature (A) Maximum temperature (Tmax) (B) Minimum temperature (Tmin) during 2018-19 and (C) Maximum temperature (Tmax) (D) Minimum temperature (Tmin) during 2019-20 on phenophases in different cultivars of mango. DS, Dormant Stage; BS, Bud Swelling, BB, Bud Burst; PE, Panicle Emergence; FP, Full Panicle; EF, Early Anthesis; FB, Full Bloom; FS, Fruit Set.
Preprints 77343 g001
Figure 2. Effect of humidity (A) Maximum humidity (Hmax) (B) Minimum humidity (Hmin) during 2018-19 and (C) Maximum humidity (Hmax) (D) Minimum humidity (Hmin) during 2019-20 on phenophases in different cultivars of mango. DS, Dormant Stage; BS, Bud Swelling, BB, Bud Burst; PE, Panicle Emergence; FP, Full Panicle; EF, Early Anthesis; FB, Full Bloom; FS, Fruit Set.
Preprints 77343 g002
Figure 3. Effect of sunshine (Savg) on phenophases during (A) 2018-19 (B) 2019-20 in different cultivars of mango. DS, Dormant Stage; BS, Bud Swelling, BB, Bud Burst; PE, Panicle Emergence; FP, Full Panicle; EF, Early Anthesis; FB, Full Bloom; FS, Fruit Set.
Preprints 77343 g003
Figure 4. Effect of evaporation (Eavg) on phenophases during (A) 2018-19 (B) 2019-20 in different cultivars of mango. DS, Dormant Stage; BS, Bud Swelling, BB, Bud Burst; PE, Panicle Emergence; FP, Full Panicle; EF, Early Anthesis; FB, Full Bloom; FS, Fruit Set.
Preprints 77343 g004
Figure 5. Schematic diagrams of the developmental stages in the flowering of mango.
Preprints 77343 g005
Figure 6. Phenological changes in different cultivars of mango with respect to Standard Meteorological Week (SMW) (A) 2018-19 (B) 2019-20. DS, Dormant Stage; BS, Bud Swelling, BB, Bud Burst; PE, Panicle Emergence; FP, Full Panicle; EF, Early Anthesis; FB, Full Bloom; FS, Fruit Set.
Preprints 77343 g006
Figure 7. Observation of phenological data (A) Length of panicle (B) Width of panicle (C) Percent of hermaphrodite flower (D) Percent of flowering intensity (E) percent of fruit set. Error bars shown as the standard error of the mean (SE) were computed by Sigma Plot 11.Different letters above the error bars show significant differences at p ≤ 0.05.
Preprints 77343 g007aPreprints 77343 g007b
Figure 8. Correlation of flowering intensity (FI) with weather (2019) (A) FI × Tmax (B) FI × Tmin (C) FI × Savg (D) FI × Hmax (E) FI × Hmin (F) FI × Eavg.
Preprints 77343 g008
Figure 9. Correlation of flowering intensity (FI) with weather (2020) (A) FI × Tmax (B) FI × Tmin (C) FI × Savg (D) FI × Hmax (E) FI × Hmin (F) FI × Eavg.
Preprints 77343 g009
Figure 10. (A) PCA analysis (B) 3D score plot of weather data with flowering intensity of mango cultivars of two flowering season 2019 and 2020. Abbreviation used: D, Dashehari; L, Langra; C, Chausa; A, Amrapali; FI, Flowering intensity; Tmax, Average of temperature maximum; Tmin, Average of temperature minimum; Hmax, Average of humidity maximum; Hmin, Average of humidity minimum; Savg, Average sunshine; Eavg, Average Evaporation; 19, flowering season of year 2019; 20, flowering season of year 2020.
Preprints 77343 g010
Disclaimer/Publisher’s Note: The statements, opinions and data contained in all publications are solely those of the individual author(s) and contributor(s) and not of MDPI and/or the editor(s). MDPI and/or the editor(s) disclaim responsibility for any injury to people or property resulting from any ideas, methods, instructions or products referred to in the content.
Copyright: This open access article is published under a Creative Commons CC BY 4.0 license, which permit the free download, distribution, and reuse, provided that the author and preprint are cited in any reuse.
Prerpints.org logo

Preprints.org is a free preprint server supported by MDPI in Basel, Switzerland.

Subscribe

© 2024 MDPI (Basel, Switzerland) unless otherwise stated