Submitted:
21 June 2023
Posted:
22 June 2023
You are already at the latest version
Abstract
Keywords:
1. Introduction
2. Materials and Methods
2.1. General Settings and Nomenclature
2.2. t-sne
2.3. UMAP and PCA
2.4. Correlation Matrix and Hierarchical Clustering
2.5. Multidimensional Scaling and Network Graphs
2.6. Spatial Heterogeneity
3. Results
3.1. German SARS-CoV-2 Epidemic Activity Geographically Clusters Into East and West
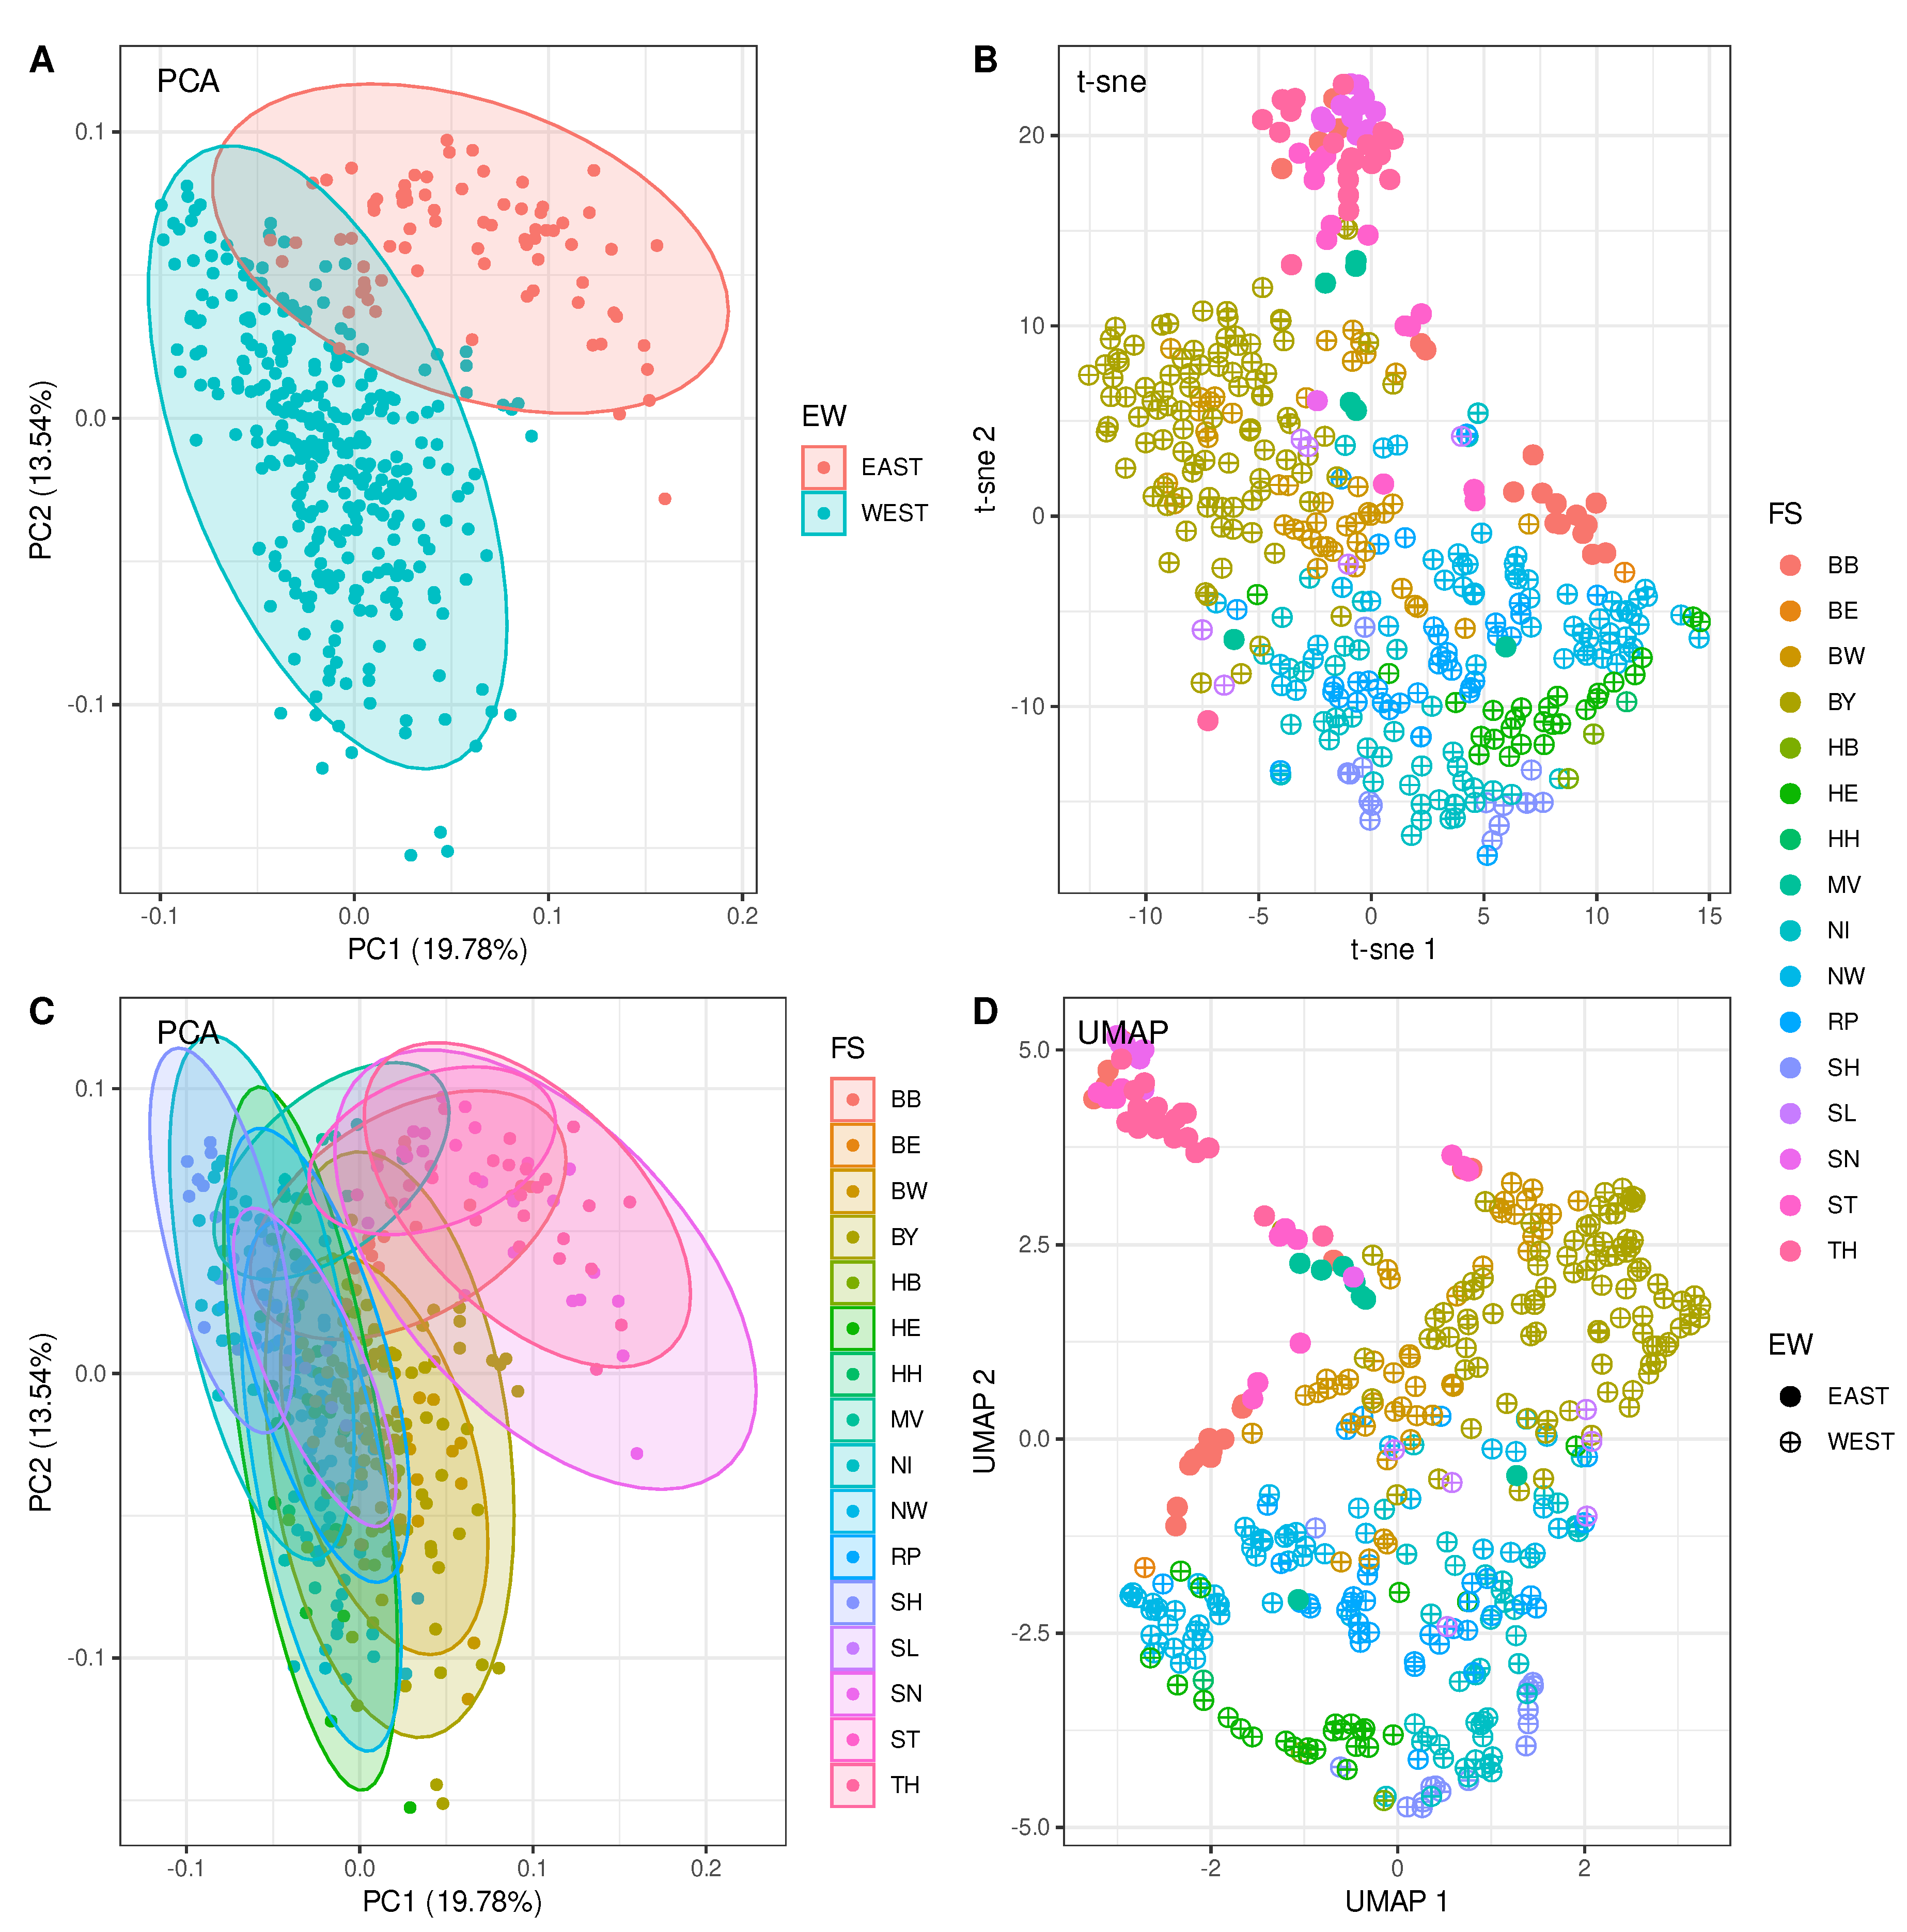
3.1.1. Allowing for a Visual Exploration Through Dimensionality Reduction
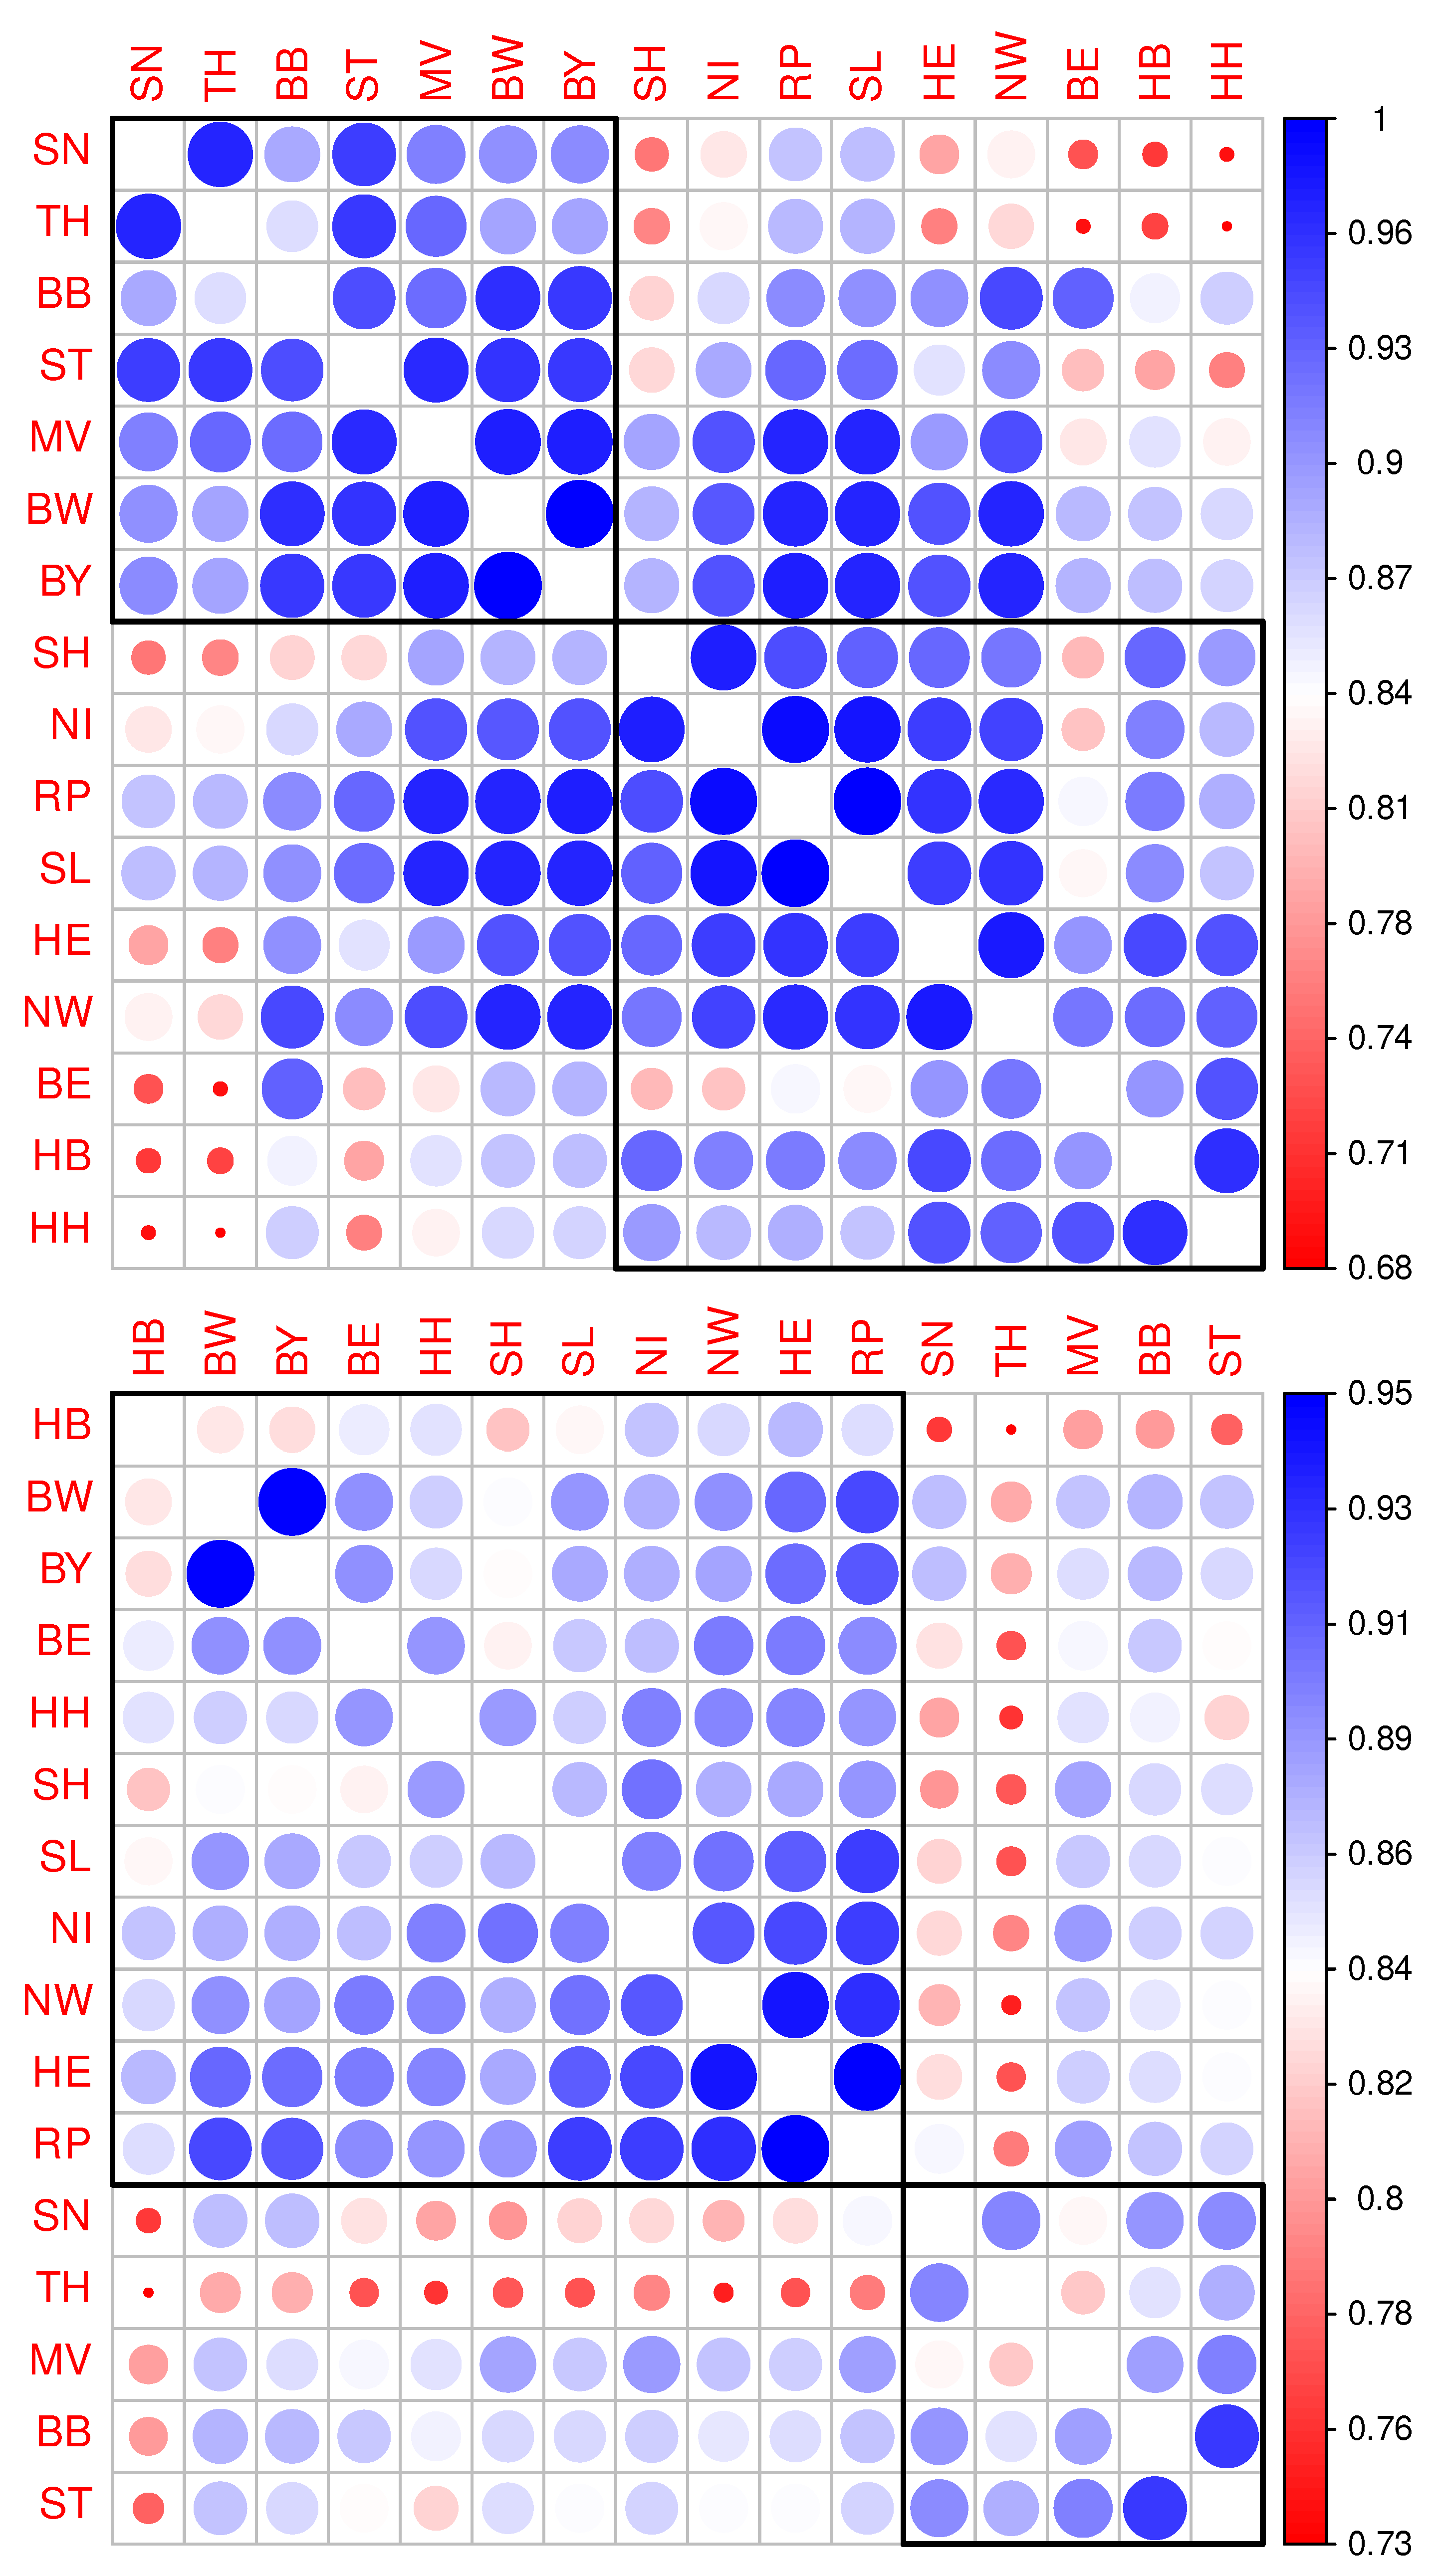
3.1.2. Canonical Correlation Analysis Provides Added Values to the Findings
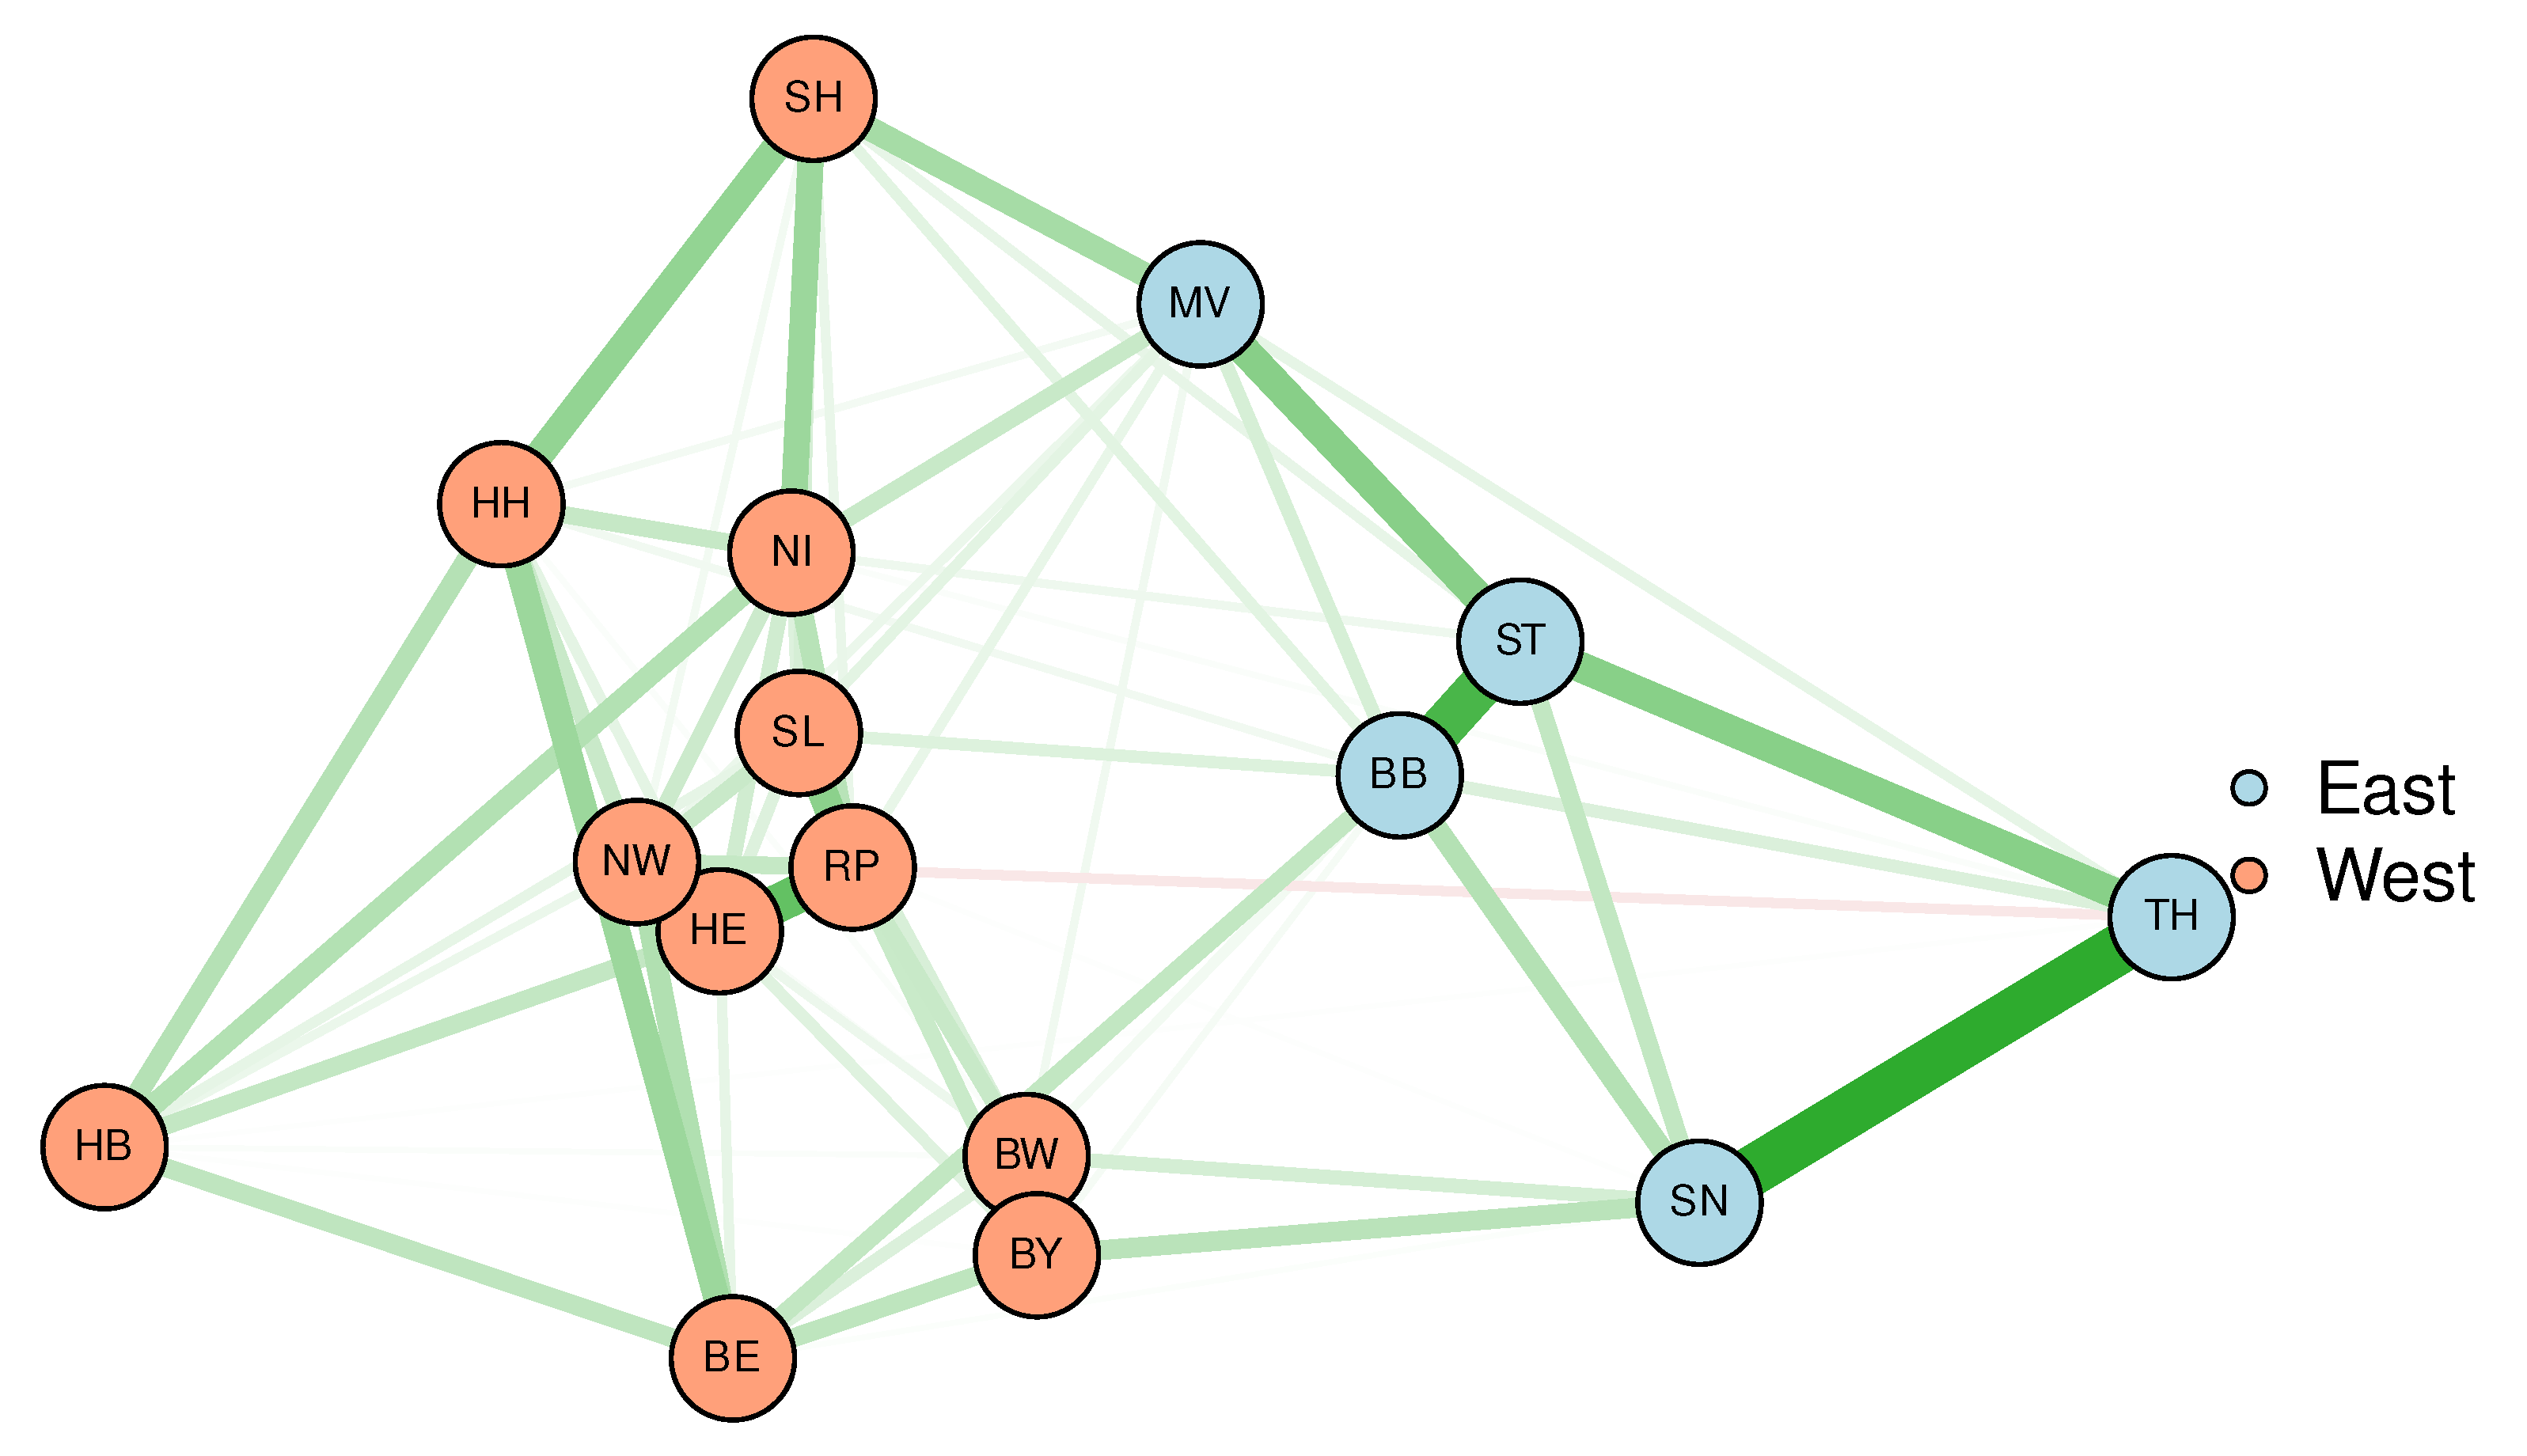
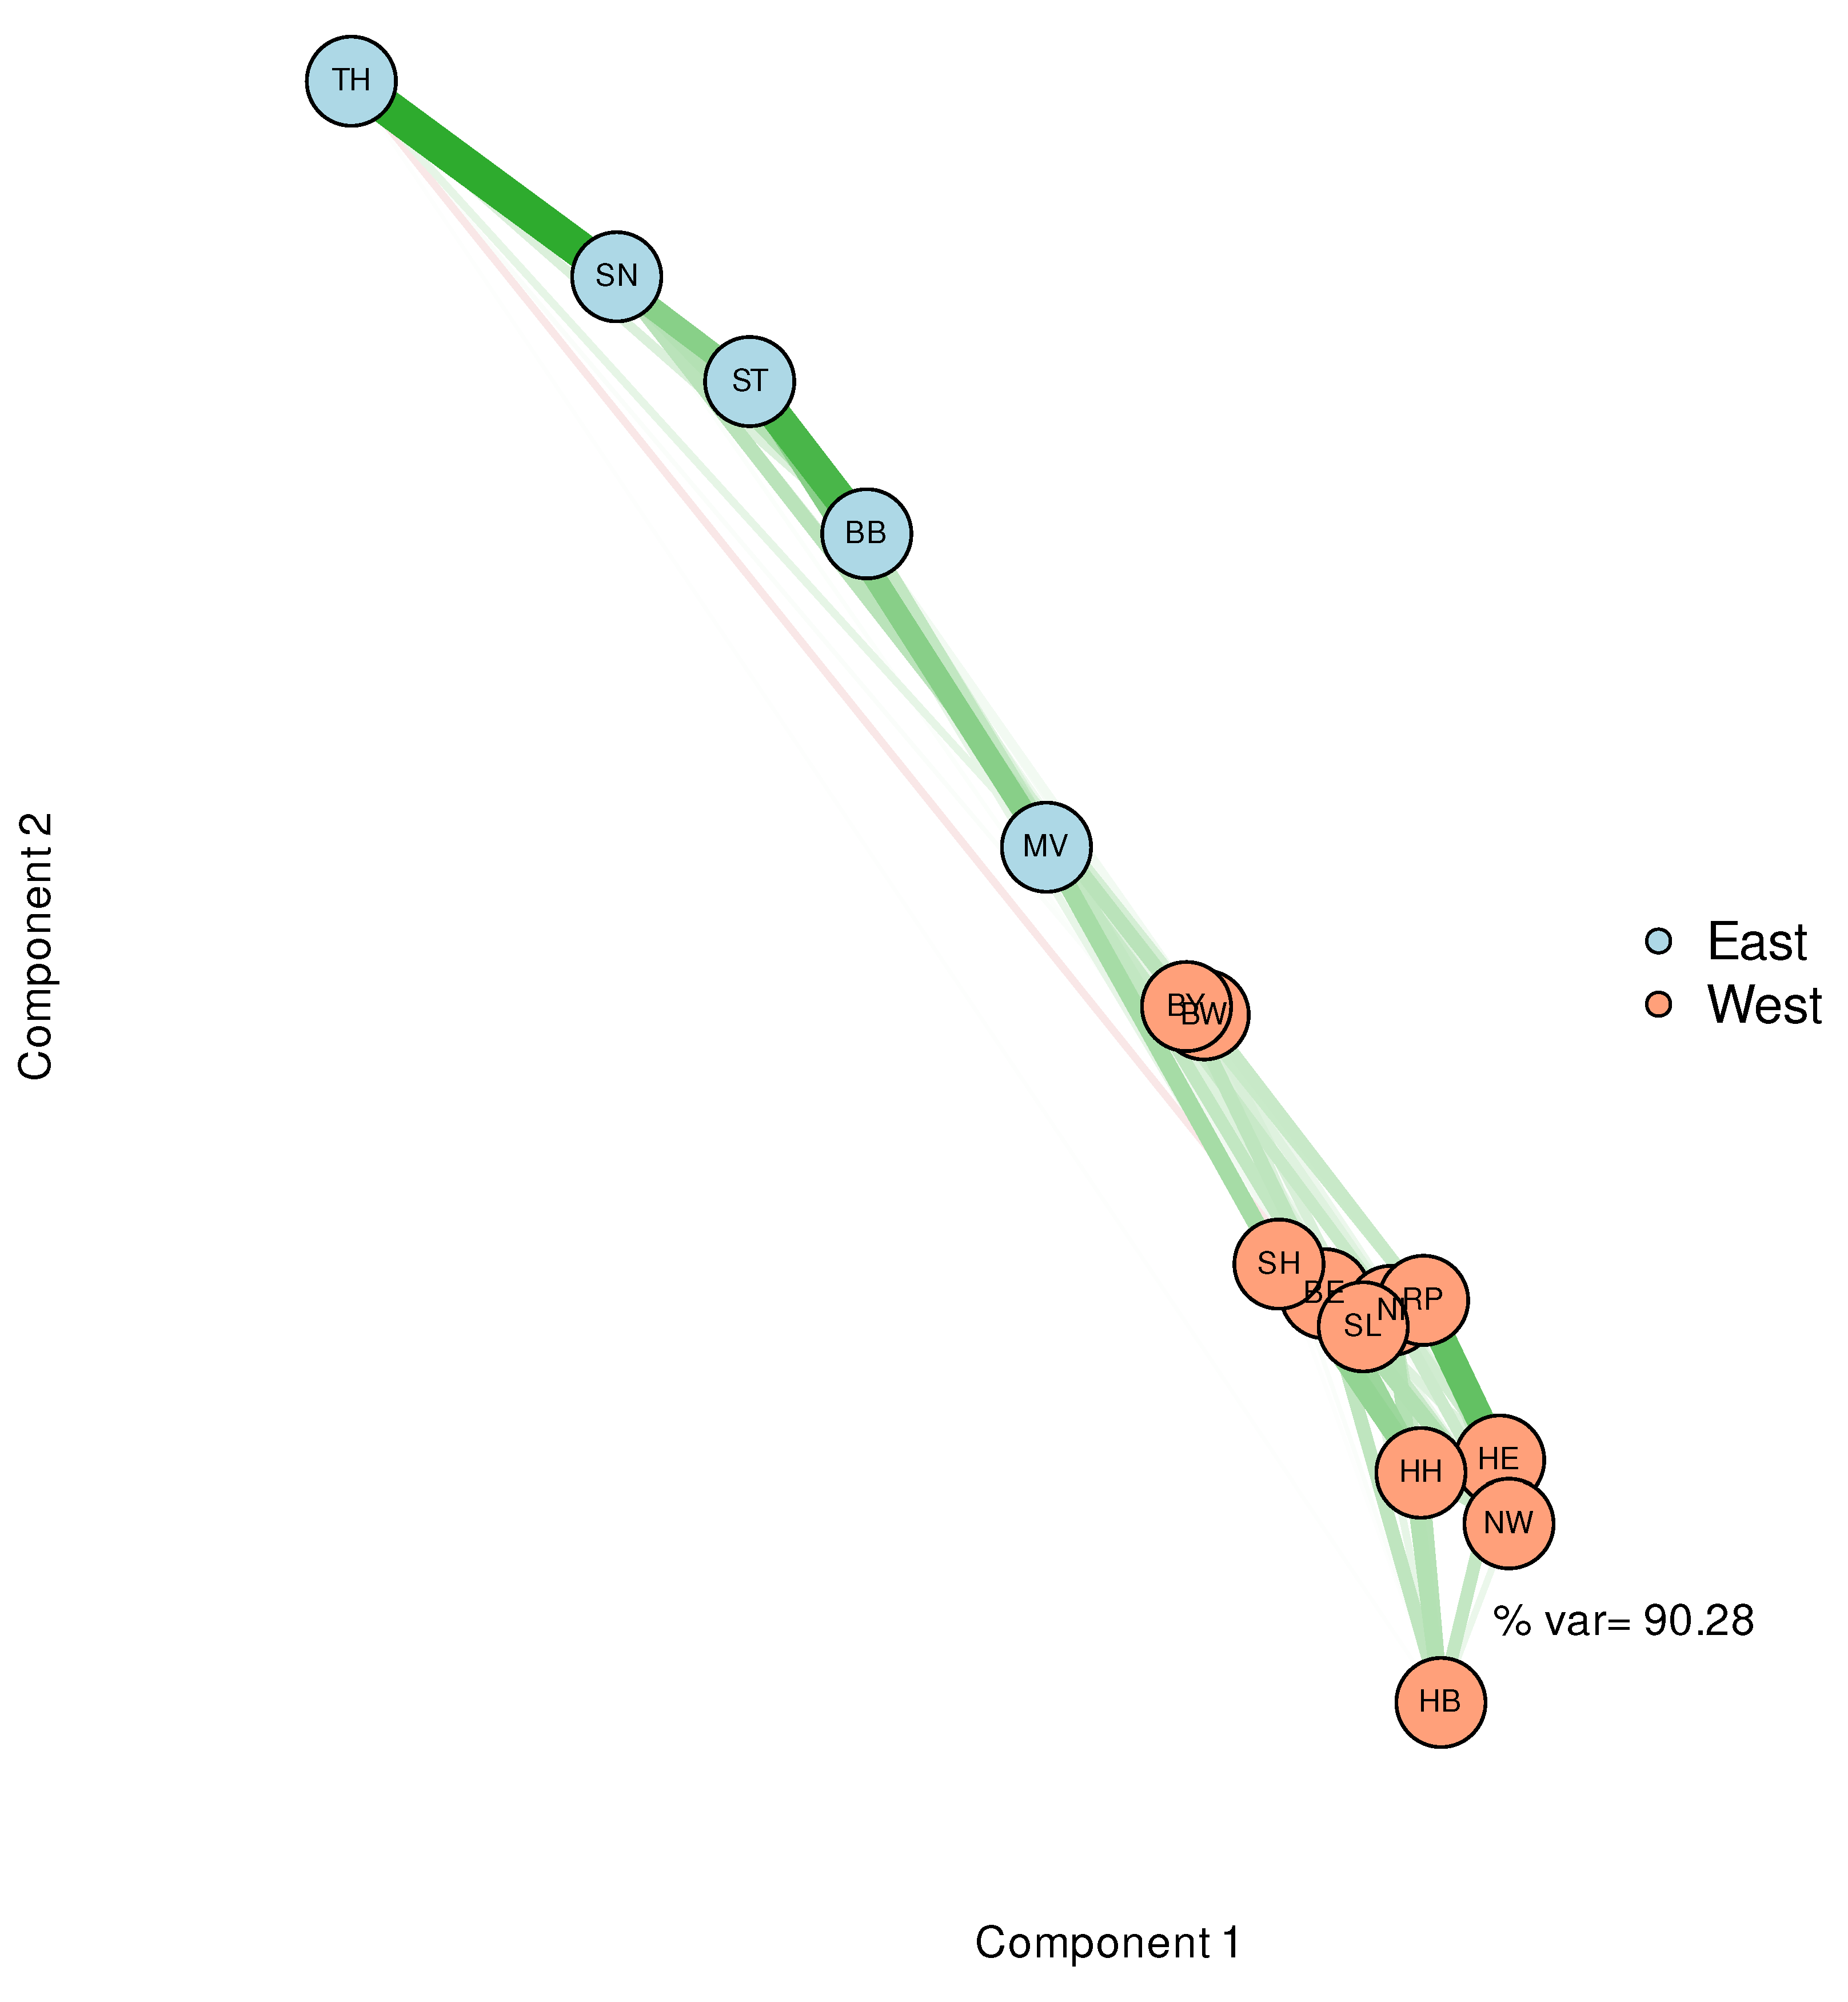
3.1.3. Consolidation of the Observed Clusters Through Network Visualisation
3.2. Variability of County-Specific Fold Changes in Reproduction Numbers Correlates With Spatial Heterogeneity
3.3. Spatial Homogeneity of Child Incidence But Increased Overall Heterogeneity in the East
3.4. Decreasing Trend in Fold Changes in Reproduction Numbers
3.5. Pronounced Fold Changes in Reproduction Numbers for the Younger and the Elder Cohorts
3.6. Federal States Exhibit Dynamic Dissimilarities
4. Discussion
5. Conclusions
Funding
Institutional Review Board Statement
Informed Consent Statement
Data Availability Statement
Conflicts of Interest
Abbreviations
| BB | Brandenburg |
| BE | Berlin |
| BW | Baden Württemberg (Baden-Wuerttemberg) |
| BY | Bayern (Bavaria) |
| HB | Hansestadt Bremen (Hanseatic City of Bremen) |
| HE | Hessen (Hesse) |
| HH | Hansestadt Hamburg (Hanseatic City of Hamburg) |
| MV | Mecklenburg-Vorpommern (Mecklenburg-Western Pomerania) |
| NI | Niedersachsen (Lower Saxony) |
| NW | Nord-Rhein-Westfalen (North Rhine-Westphalia) |
| RP | Rheinland-Pfalz (Rhineland-Palatinate) |
| SH | Schleswig-Holstein (Schleswig-Holstein) |
| SL | Saarland |
| SN | Sachsen (Saxony) |
| ST | Sachsen-Anhalt (Saxony-Anhalt) |
| TH | Thüringen (Thuringia) |
| Counties | Land-/Stadtkreise (rural/urban districts), |
| local administrative districts (subdivisions of the federal states) in Germany | |
| DE | Deutschland (Germany) |
| EW | East/West, used to label the categorical variable with values Eastern and Western |
| Germany, where East comprises the federal states BB, MV, SN, ST, TH. | |
| Western Germany accounts for the remaining federal states. | |
| FS, Fed. State | Bundesland (federal state) |
| agegrp | age group or age class |
| RKI | Robert Koch Institute (Federal Government’s Public Health Institute of Germany) |
| MDS | Multidimensional Scaling |
| PCA | Principal Component Analysis |
References
- Wang, C.; Horby, P.W.; Hayden, F.G.; Gao, G.F. A novel coronavirus outbreak of global health concern. The Lancet 2020, 395, 470–473. [Google Scholar] [CrossRef]
- Abu El Kheir-Mataria, W.; H., E.F.; Chun, S. Global health governance performance during COVID-19, what needs to be changed? A Delphi survey study. Global Health 2023, 19. [Google Scholar] [CrossRef]
- Brainard, J. Scientists are drowning in COVID-19 papers. Can new tools keep them afloat? Science Mag News 2020. [Google Scholar] [CrossRef]
- Ahmad, S.J.; Degiannis, K.; Borucki, J.; Pouwels, S.; Rawaf, D.L.; Head, M.; Li, C.H.; Archid, R.; Ahmed, A.R.; Lala, A.; Raza, W.; Mellor, K.; Wichmann, D.; Exadaktylos, A. The most influential COVID-19 articles: A systematic review. New Microbes and New Infections 2023, 52, 101094. [Google Scholar] [CrossRef] [PubMed]
- Maier, C.; Ankermann, T. Studienrückrufe: Fake News in Fachzeitschriften. Dtsch Arztebl International 2022, 119, A–116. [Google Scholar]
- The Lancet Infectious Diseases. The COVID-19 infodemic. The Lancet Infectious Diseases 2020, 20, 875. [Google Scholar] [CrossRef]
- Green, J.; Edgerton, J.; Naftel, D.; Shoub, K.; Cranmer, S.J. Elusive consensus: Polarization in elite communication on the COVID-19 pandemic. Science Advances 2020, 6, eabc2717. [Google Scholar] [CrossRef]
- Nachtwey, P.; Walther, E. Survival of the fittest in the pandemic age: Introducing disease-related social Darwinism. PLOS ONE 2023, 18, 1–20. [Google Scholar] [CrossRef]
- Geana, M.V.; Rabb, N.; Sloman, S. Walking the party line: The growing role of political ideology in shaping health behavior in the United States. SSM - Population Health 2021, 16, 100950. [Google Scholar] [CrossRef]
- Richter, C.; Wächter, M.; Reinecke, J.; Salheiser, A.; Quent, M.; Wjst, M. Politische Raumkultur als Verstärker der Corona-Pandemie? Einflussfaktoren auf die regionale Inzidenzentwicklung in Deutschland in der ersten und zweiten Pandemiewelle 2020. ZRex–Zeitschrift für Rechtsextremismusforschung 2021, pp. 191–211. [CrossRef]
- Qamar, A.I.; Gronwald, L.; Timmesfeld, N.; Diebner, H.H. Local socio-structural predictors of COVID-19 incidence in Germany. Frontiers in Public Health 2022, 10. [Google Scholar] [CrossRef]
- Emery, F. (Ed.) Systems Thinking; Penguin Books: Harmondsworth, 1969. [Google Scholar]
- Haken, H. Information and Self-Organization – A Macroscopic Approach to Complex System; Springer: Berlin, Heidelberg, 2006. [Google Scholar] [CrossRef]
- Diebner, H.H. Bilder sind komplexe Systeme und deren Interpretationen noch viel komplexer - Über die Verwandtschaft von Hermeneutik und Systemtheorie. In The Picture´s Image. Wissenschaftliche Visualisierung als Komposit; Hinterwaldner, I., Buschhaus, M., Eds.; Fink-Verlag: München, 2006; pp. 282–299. [Google Scholar]
- Diebner, H.H., Performative Science—Transgressions from Scientific to Artistic Practices and Reverse. In Complexity and Synergetics; Müller, S.C.; Plath, P.J.; Radons, G.; Fuchs, A., Eds.; Springer International Publishing: Cham, 2018; pp. 373–381. [CrossRef]
- Seo, M.; Chang, H., Context of Discovery and Context of Justification. In Encyclopedia of Science Education; Gunstone, R., Ed.; Springer Netherlands: Dordrecht, 2015; pp. 229–232. [CrossRef]
- Diebner, H.H.; Timmesfeld, N. Exploring COVID-19 Daily Records of Diagnosed Cases and Fatalities Based on Simple Nonparametric Methods. Infectious disease reports 2021, 13, 302–328. [Google Scholar] [CrossRef]
- Diebner, H.H. Phase Shift Between Age-Specific COVID-19 Incidence Curves Points to a Potential Epidemic Driver Function of Kids and Juveniles in Germany. medRxiv 2021. [Google Scholar] [CrossRef]
- R Core Team, R: A Language and Environment for Statistical Computing; R Foundation for Statistical Computing: Vienna, Austria, 2023.
- Robert Koch-Institut. SurvStat@RKI 2.0, URL survstat.rki.de, accessed on 01 Sep 2022, 2022.
- Federal Statistical Office of Germany. German Census Data. URL: www.destatis.de, accessed on 02 Nov 2022, 2022.
- van der Maaten, L.; Hinton, G. Visualizing Data using t-SNE. Journal of Machine Learning Research 2008, 9, 2579–2605. [Google Scholar]
- Hinton, G.; Roweis, S. Stochastic Neighbor Embedding. In Advances in Neural Information Processing Systems; MIT press: Cambridge, MA, USA, 2002; Vol. 15, pp. 833–840. [Google Scholar]
- Krijthe, J.H. Rtsne: T-Distributed Stochastic Neighbor Embedding using Barnes-Hut Implementation, 2015. R package version 0.16.
- McInnes, L.; Healy, J.; Melville, J. UMAP: Uniform Manifold Approximation and Projection for Dimension Reduction. arXiv 2018. [Google Scholar] [CrossRef]
- Hotelling, H. Analysis of a complex of statistical variables into principal components. Journal of Educational Psychology 1933, 24, 417–441. [Google Scholar] [CrossRef]
- Konopka, T. umap: Uniform Manifold Approximation and Projection, 2023. R package version 0.2.10.0.
- William Revelle. psych: Procedures for Psychological, Psychometric, and Personality Research. Northwestern University, Evanston, Illinois, 2023. R package version 2.3.3.
- Wei, T.; Simko, V. R package ’corrplot’: Visualization of a Correlation Matrix, 2021. (Version 0.92).
- Mair, P.; Groenen, P.J.F.; de Leeuw, J. More on Multidimensional Scaling and Unfolding in R: smacof Version 2. Journal of Statistical Software 2022, 102, 1–47. [Google Scholar] [CrossRef]
- Epskamp, S.; Cramer, A.O.J.; Waldorp, L.J.; Schmittmann, V.D.; Borsboom, D. qgraph: Network Visualizations of Relationships in Psychometric Data. Journal of Statistical Software 2012, 48, 1–18. [Google Scholar] [CrossRef]
- Tuomisto, H. A consistent terminology for quantifying species diversity? Yes, it does exist. Oecologia 2010, 164, 853–860. [Google Scholar] [CrossRef]
- Diebner, H.H.; Kather, A.; Roeder, I.; de With, K. Mathematical basis for the assessment of antibiotic resistance and administrative counter-strategies. PloS one 2020, 15, e0238692. [Google Scholar] [CrossRef]
- Berger, U.; Fritz, C.; Kauermann, G. Schulschließungen oder Schulöffnung mit Testpflicht? Epidemiologisch-statistische Aspekte sprechen für Schulöffnungen mit verpflichtenden Tests. Report CODAG Bericht Nr. 14 vom 30.04.2021, Uni München, München, 2021.
- Goodman-Bacon, A.; Marcus, J. Using Difference-in-Differences to Identify Causal Effects of COVID-19 Policies. Survey Research Methods 2020, 14, 153–158. [Google Scholar] [CrossRef]
- Herby, J.; Jonung, L.; Hanke, S.H. A Literature Review and Meta-Analysis of the Effects of Lockdowns on COVID-19 Mortality. Technical report, Institute for Applied Economics, Global Health, and the Study of Business Enterprise at the Johns Hopkins University, Baltimore, 2022.
- Korencak, M.; Sivalingam, S.; Sahu, A.; Dressen, D.; Schmidt, A.; Brand, F.; Krawitz, P.; Hart, L.; Maria Eis-Hübinger, A.; Buness, A.; Streeck, H. Reconstruction of the origin of the first major SARS-CoV-2 outbreak in Germany. Computational and Structural Biotechnology Journal 2022, 20, 2292–2296. [Google Scholar] [CrossRef]
- Böhmer, M.M.; Buchholz, U.; Corman, V.M.; Hoch, M.; Katz, K.; Marosevic, D.V.; Böhm, S.; Woudenberg, T.; Ackermann, N.; Konrad, R.; Eberle, U.; Treis, B.; Dangel, A.; Bengs, K.; Fingerle, V.; Berger, A.; Hörmansdorfer, S.; Ippisch, S.; Wicklein, B.; Grahl, A.; Pörtner, K.; Muller, N.; Zeitlmann, N.; Boender, T.S.; Cai, W.; Reich, A.; an der Heiden, M.; Rexroth, U.; Hamouda, O.; Schneider, J.; Veith, T.; Mühlemann, B.; Wölfel, R.; Antwerpen, M.; Walter, M.; Protzer, U.; Liebl, B.; Haas, W.; Sing, A.; Drosten, C.; Zapf, A. Investigation of a COVID-19 outbreak in Germany resulting from a single travel-associated primary case: a case series. The Lancet Infectious Diseases 2020. [Google Scholar] [CrossRef]
- Häussler, B. Pandemie-Meldewesen: Deutschland im Corona-Blindflug. ÄrzteZeitung 2021, 15.01.2021. [Google Scholar]
- Klement, R.J. Systems Thinking About SARS-CoV-2. Front. Public Health 2020, 8, 585229. [Google Scholar] [CrossRef]
- Müller, B. Zur Modellierung der Corona-Pandemie - Eine Streitschrift. Monitor Versorgungsforschung 2021, 14. [Google Scholar] [CrossRef]
- Heath, A.; Hunink, M.G.M.; Krijkamp, E.; Pechlivanoglou, P. Prioritisation and design of clinical trials. Eur J Epidemiol 2021, 36, 1111–1121. [Google Scholar] [CrossRef]
- Ott, R.; Achenbach, P.; Ewald, D.A.; Friedl, N.; Gemulla, G.; Hubmann, M.; Kordonouri, O.; Loff, A.; Marquardt, E.; Sifft, P.; Sporreiter, M.; Zapardiel-Gonzalo, J.; Ziegler, A.G. SARS-CoV-2 seroprevalence in preschool and school-age children. Dtsch Arztebl International 2022, 119, 765–770. [Google Scholar] [CrossRef]
- Brinkmann, F.; Diebner, H.H.; Matenar, C.; Schlegtendal, A.; Spiecker, J.; Eitner, L.; Timmesfeld, N.; Maier, C.; Lücke, T. Longitudinal Rise in Seroprevalence of SARS-CoV-2 Infections in Children in Western Germany–A Blind Spot in Epidemiology? Infectious Disease Reports 2021, 13, 957–964. [Google Scholar] [CrossRef]
- Brinkmann, F.; Schlegtendal, A.; Hoffmann, A.; Theile, K.; Hippert, F.; Strodka, R.; Timmesfeld, N.; Diebner, H.H.; Lücke, T.; Maier, C. SARS-CoV-2 Infections Among Children and Adolescents With Acute Infections in the Ruhr Region. Dtsch Arztebl International 2021, 118, 363–364. [Google Scholar] [CrossRef]
- Brinkmann, F.; Diebner, H.H.; Matenar, C.; Schlegtendal, A.; Eitner, L.; Timmesfeld, N.; Maier, C.; Lücke, T. Seroconversion rate and socio-economic and ethnic risk factors for SARS-CoV-2 infection in children in a population-based cohort, Germany, June 2020 to February 2021. Euro Surveill. 2022, 27. [Google Scholar] [CrossRef]
- Nachtwey, O.; Schäfer, R.; Frei, N. Politische Soziologie der Corona-Proteste. SocArXiv 2020. [Google Scholar] [CrossRef]
- Nachtwey, O.; Frei, N.; Markwardt, N. “Querdenken”: Die erste wirklich postmoderne Bewegung. Oliver Nachtwey und Nadine Frei, im Interview mit Nils Markwardt. Philosophie Magazin Online 2021. Accessed on Dec 20, 2021. [Google Scholar]
- Wachtler, B.; Hoebel, J. Soziale Ungleichheit und COVID-19: Sozialepidemiologische Perspektiven auf die Pandemie. Gesundheitswesen 2020, 82, 670–675. [Google Scholar] [CrossRef]
- Hoebel, J.; Michalski, N.; Wachtler, B.; Diercke, M.; Neuhauser, H.; Wieler, L.H.; Hövener, C. Socioeconomic Differences in the Risk of Infection During the Second SARS-CoV-2 Wave in Germany. Dtsch Arztebl International 2021, 118, 269–270. [Google Scholar] [CrossRef]
- Maftei, A.; Petroi, C.E. "I’m luckier than everybody else!”: Optimistic bias, COVID-19 conspiracy beliefs, vaccination status, and the link with the time spent online, anticipated regret, and the perceived threat. Front. Public Health 2022, 10, 1019298. [Google Scholar] [CrossRef]
- Fuhrmann, J.; Barbarossa, M.V. The significance of case detection ratios for predictions on the outcome of an epidemic - a message from mathematical modelers. Arch Public Health 2020, 78, 63. [Google Scholar] [CrossRef]
Disclaimer/Publisher’s Note: The statements, opinions and data contained in all publications are solely those of the individual author(s) and contributor(s) and not of MDPI and/or the editor(s). MDPI and/or the editor(s) disclaim responsibility for any injury to people or property resulting from any ideas, methods, instructions or products referred to in the content. |
© 2023 by the authors. Licensee MDPI, Basel, Switzerland. This article is an open access article distributed under the terms and conditions of the Creative Commons Attribution (CC BY) license (http://creativecommons.org/licenses/by/4.0/).


