Preprint
Article

The Center and Spin of the Universe

Altmetrics

Downloads

124

Views

57

Comments

0

This version is not peer-reviewed

Submitted:

22 June 2023

Posted:

23 June 2023

You are already at the latest version

Alerts
Abstract
It is generally believed that the universe emerged from the Big Bang, before which space and time did not exist. However, Penrose proposed his theory of conformal cyclic cosmology, in which an aeon existed preceding this universe. Based on the cosmological principle, the universe is homogeneous and isotropic, expanding without center, but recently more and more deviations have been observed. By studying the fundamental particles and reactions of nature, we initiated a model that the Big Bang is the result of the collapse of a neutrino star within a black hole. We therefore re-analyze the cosmic microwave background (CMB) and find that the Center of the universe where the Big Bang occurred was at 0.66 +0.03 -0.01 times the radius of the surface of last scattering away from the Local Supercluster (LS) and at Galactic coordinates (l, b) = (286o +/- 10o, -43o +7 -6). If we look from the LS to the Center, the universe is spinning clockwise. Our findings are supported by Penrose’s conformal cyclic cosmology, low-variance circle sets in the CMB, and many other independent observational evidence of cosmic inhomogeneities, spatial anisotropies, and time variations.
Keywords: 
Subject: Physical Sciences  -   Astronomy and Astrophysics

1. INTRODUCTION

While Lamaître and Hubble discovered an expanding universe in the 1920s, Gamow (1946) and Gödel (1949) suspected that the universe is rotating. To date, the universe is generally believed to be isotropic and homogeneous; questions like where the Big Bang occurred are meaningless. There has been little knowledge on whether the universe is truly rotating (Hawking 1969) or what the universe is rotating about.
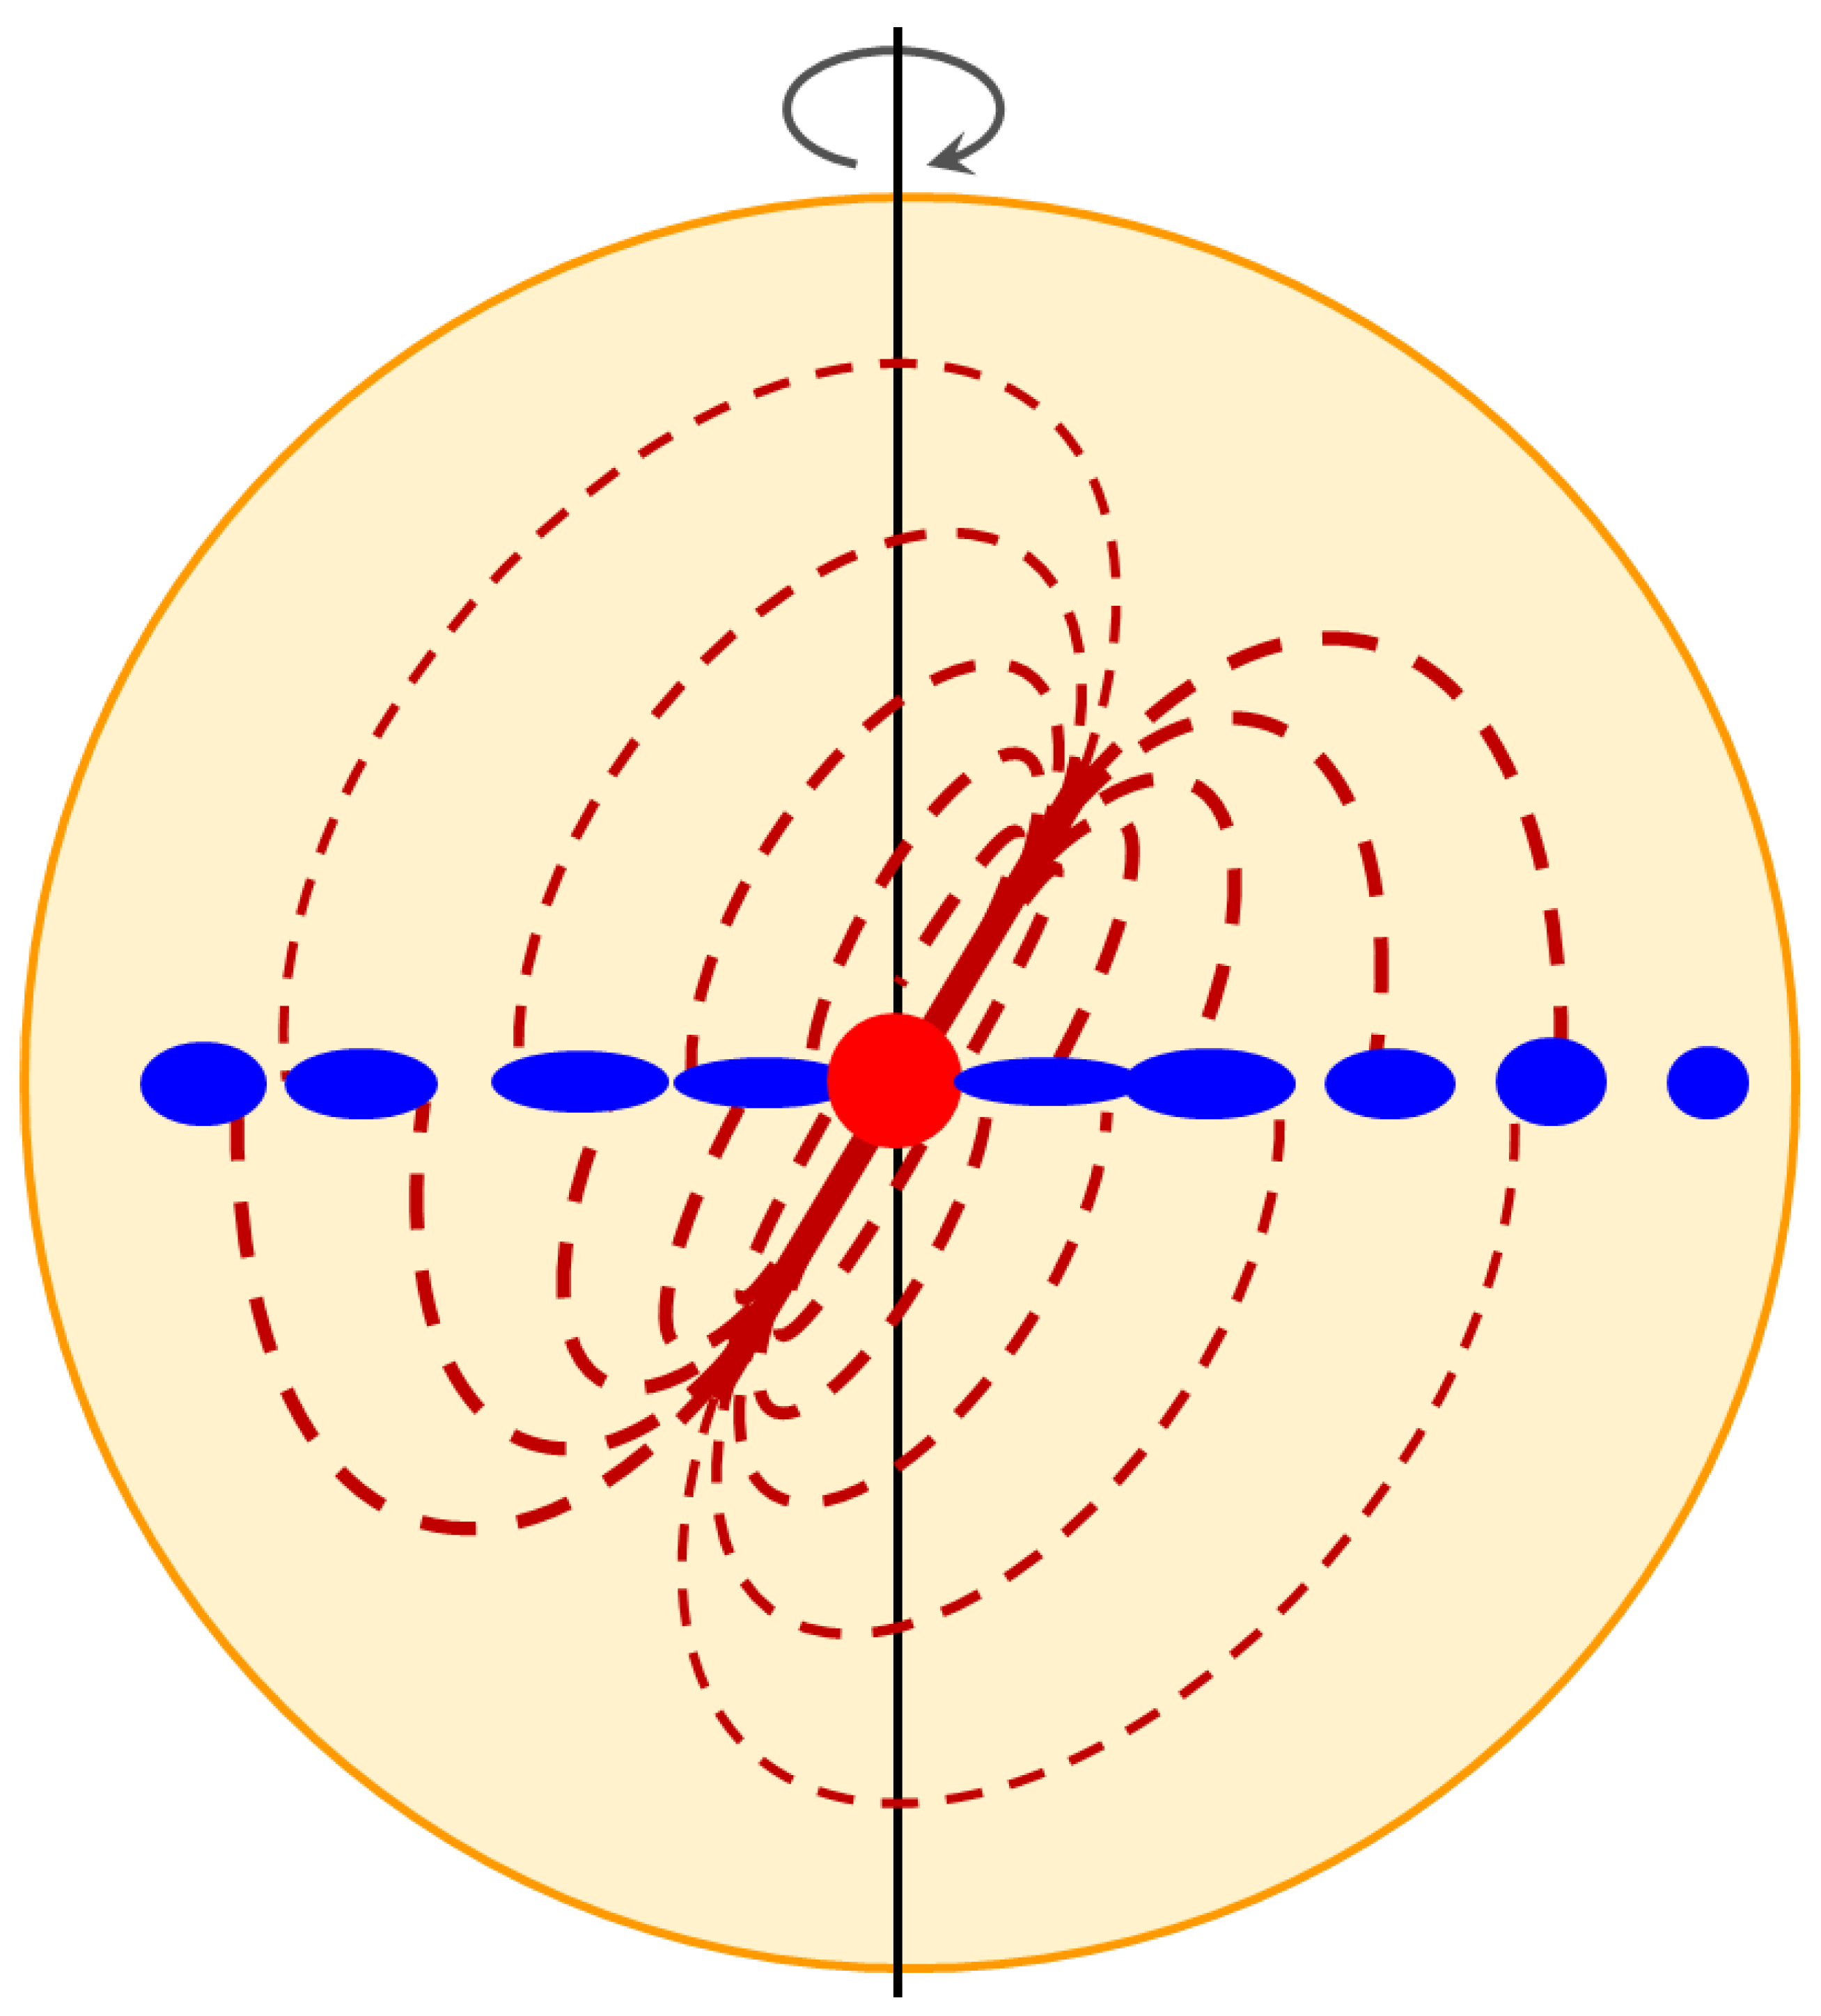
The most condensed star that can be directly observed is a neutron star. If its mass further increases, it collapses into a black hole. Within a black hole, it is generally believed to form a singularity. However, by studying the fundamental particles and reactions of nature, we initiated a model that neutrino degeneracy pressure would provide new support to prevent a black hole from collapsing into the singularity; the core of a black hole would be a neutrino star (Bao & Bao 2020). Outside its event horizon, a rotating black hole has an accretion disk perpendicular to the axis of rotation. The accretion plane is the primary direction that matter-energy falls into the black hole. Although we do not exactly know the physical law inside the event horizon, it is reasonable to assume that matter-energy would continue to fall into the core of the black hole in spiral flows Vs (Figure 1). The matter-energy falling into the black hole would be in a process of being converted into neutrinos and immobilized at the core. That not immediately immobilized would temporarily escape from the core as emission beams Vb along the magnetic axis of the core (Figure 1). Of course nothing would be able to escape beyond the event horizon; the Vb would fall back as back falling flows Vf for further conversion and immobilization. The Vf would exist in two ways: a) immediately surrounding the Vb, and b) eventually falling into the Vs plane (Figure 1). This scene of a neutrino star inside a black hole would be similar to that of a pulsar, its less dense counterpart1.
Estimated from the vacuum energy density (Perkins 2003): ε vac m ν 4 c 5 16 π 2 3 , the upper limit of the mass of the lightest neutrino: m ν 8 m e V (Bao & Bao 2020). Analogous to the Tolman-Oppenheimer-Volkoff limit for neutron stars, we estimate a mass limit for a neutrino star or a black hole:
M m n m ν 2 M n 939.6   MeV 8   meV 2 × 2.2 M = 3 × 10 22 M
where mn, Mn, and M are the masses of a neutron, a neutron star, and the sun, respectively. Another method to estimate the mass limit for a neutrino star is to calculate the Jeans mass of the neutrino (Prakash 2013):
M = 1.8 M Pl 3 m ν 2 1.8 × ( 1.22 × 10 19 GeV ) 3 ( 8   meV ) 2 = 5 × 10 22 M
where MPl is the Planck mass. Without considering any addition due to the rotation of the black hole, both lowermost values estimated from the uppermost mass of neutrino are close to the mass of the observable universe, ca. 10 23 M . If it exceeds the mass limit, a black hole or neutrino star would collapse and annihilate into a singularity. Thus the black hole would turn into a white hole, producing the Big Bang.

2. METHODS

2.1. Challenges of Finding the Center of the Universe

Where the Big Bang occurred or the Center of the universe must be within the observable universe, otherwise we would not find it. Even if the Center is within our observable universe, we might not be able to find it if the universe were absolutely isotropic and homogeneous. The Big Bang produced isotropic radial expansion waves VBB from the Center. After the Big Bang, the expansion of the universe has been driven by vacuum energy. There is nothing special at the Center after the Big Bang (for comparison, before the Big Bang there was a massive neutrino star core). Unless we were near the edge of the universe (we are not), the universe would appear to be very isotropic and homogeneous. This is in fact what the standard cosmology assumes: the universe is homogeneous and isotropic, expanding without center.
To find the Center, we focus on the primordial surroundings of the new-born universe. There were multiple flows within the event horizon of the precursor black hole. Of all the flows, the Vs and Vb would determine the Center, because they either terminated at or originated from the neutrino star core (Figure 1). Although their generations would be interrupted during the short emitting moment of the white hole, the Vs flows would exist once the gravity was regenerated at the Planck time after the Big Bang, so would the Vb beams due to the momenta they had in the precursor black hole. The Vs and Vb would certainly interact with the VBB. However, the small signals from the interactions might be easily concealed during the evolution of the universe. As the first picture of the universe, the cosmic microwave background (CMB) would be the best chance for us to explore.
Note that even though they are called flows or beams, the Vs and Vb would not be continuous. Instead their intensities would have highs and lows, therefore clumps might be a better description (Figure 1). This character of the flows would easily cause artificial results in numerical analyses.

2.2. The Axis of Evil or the Vs Flows

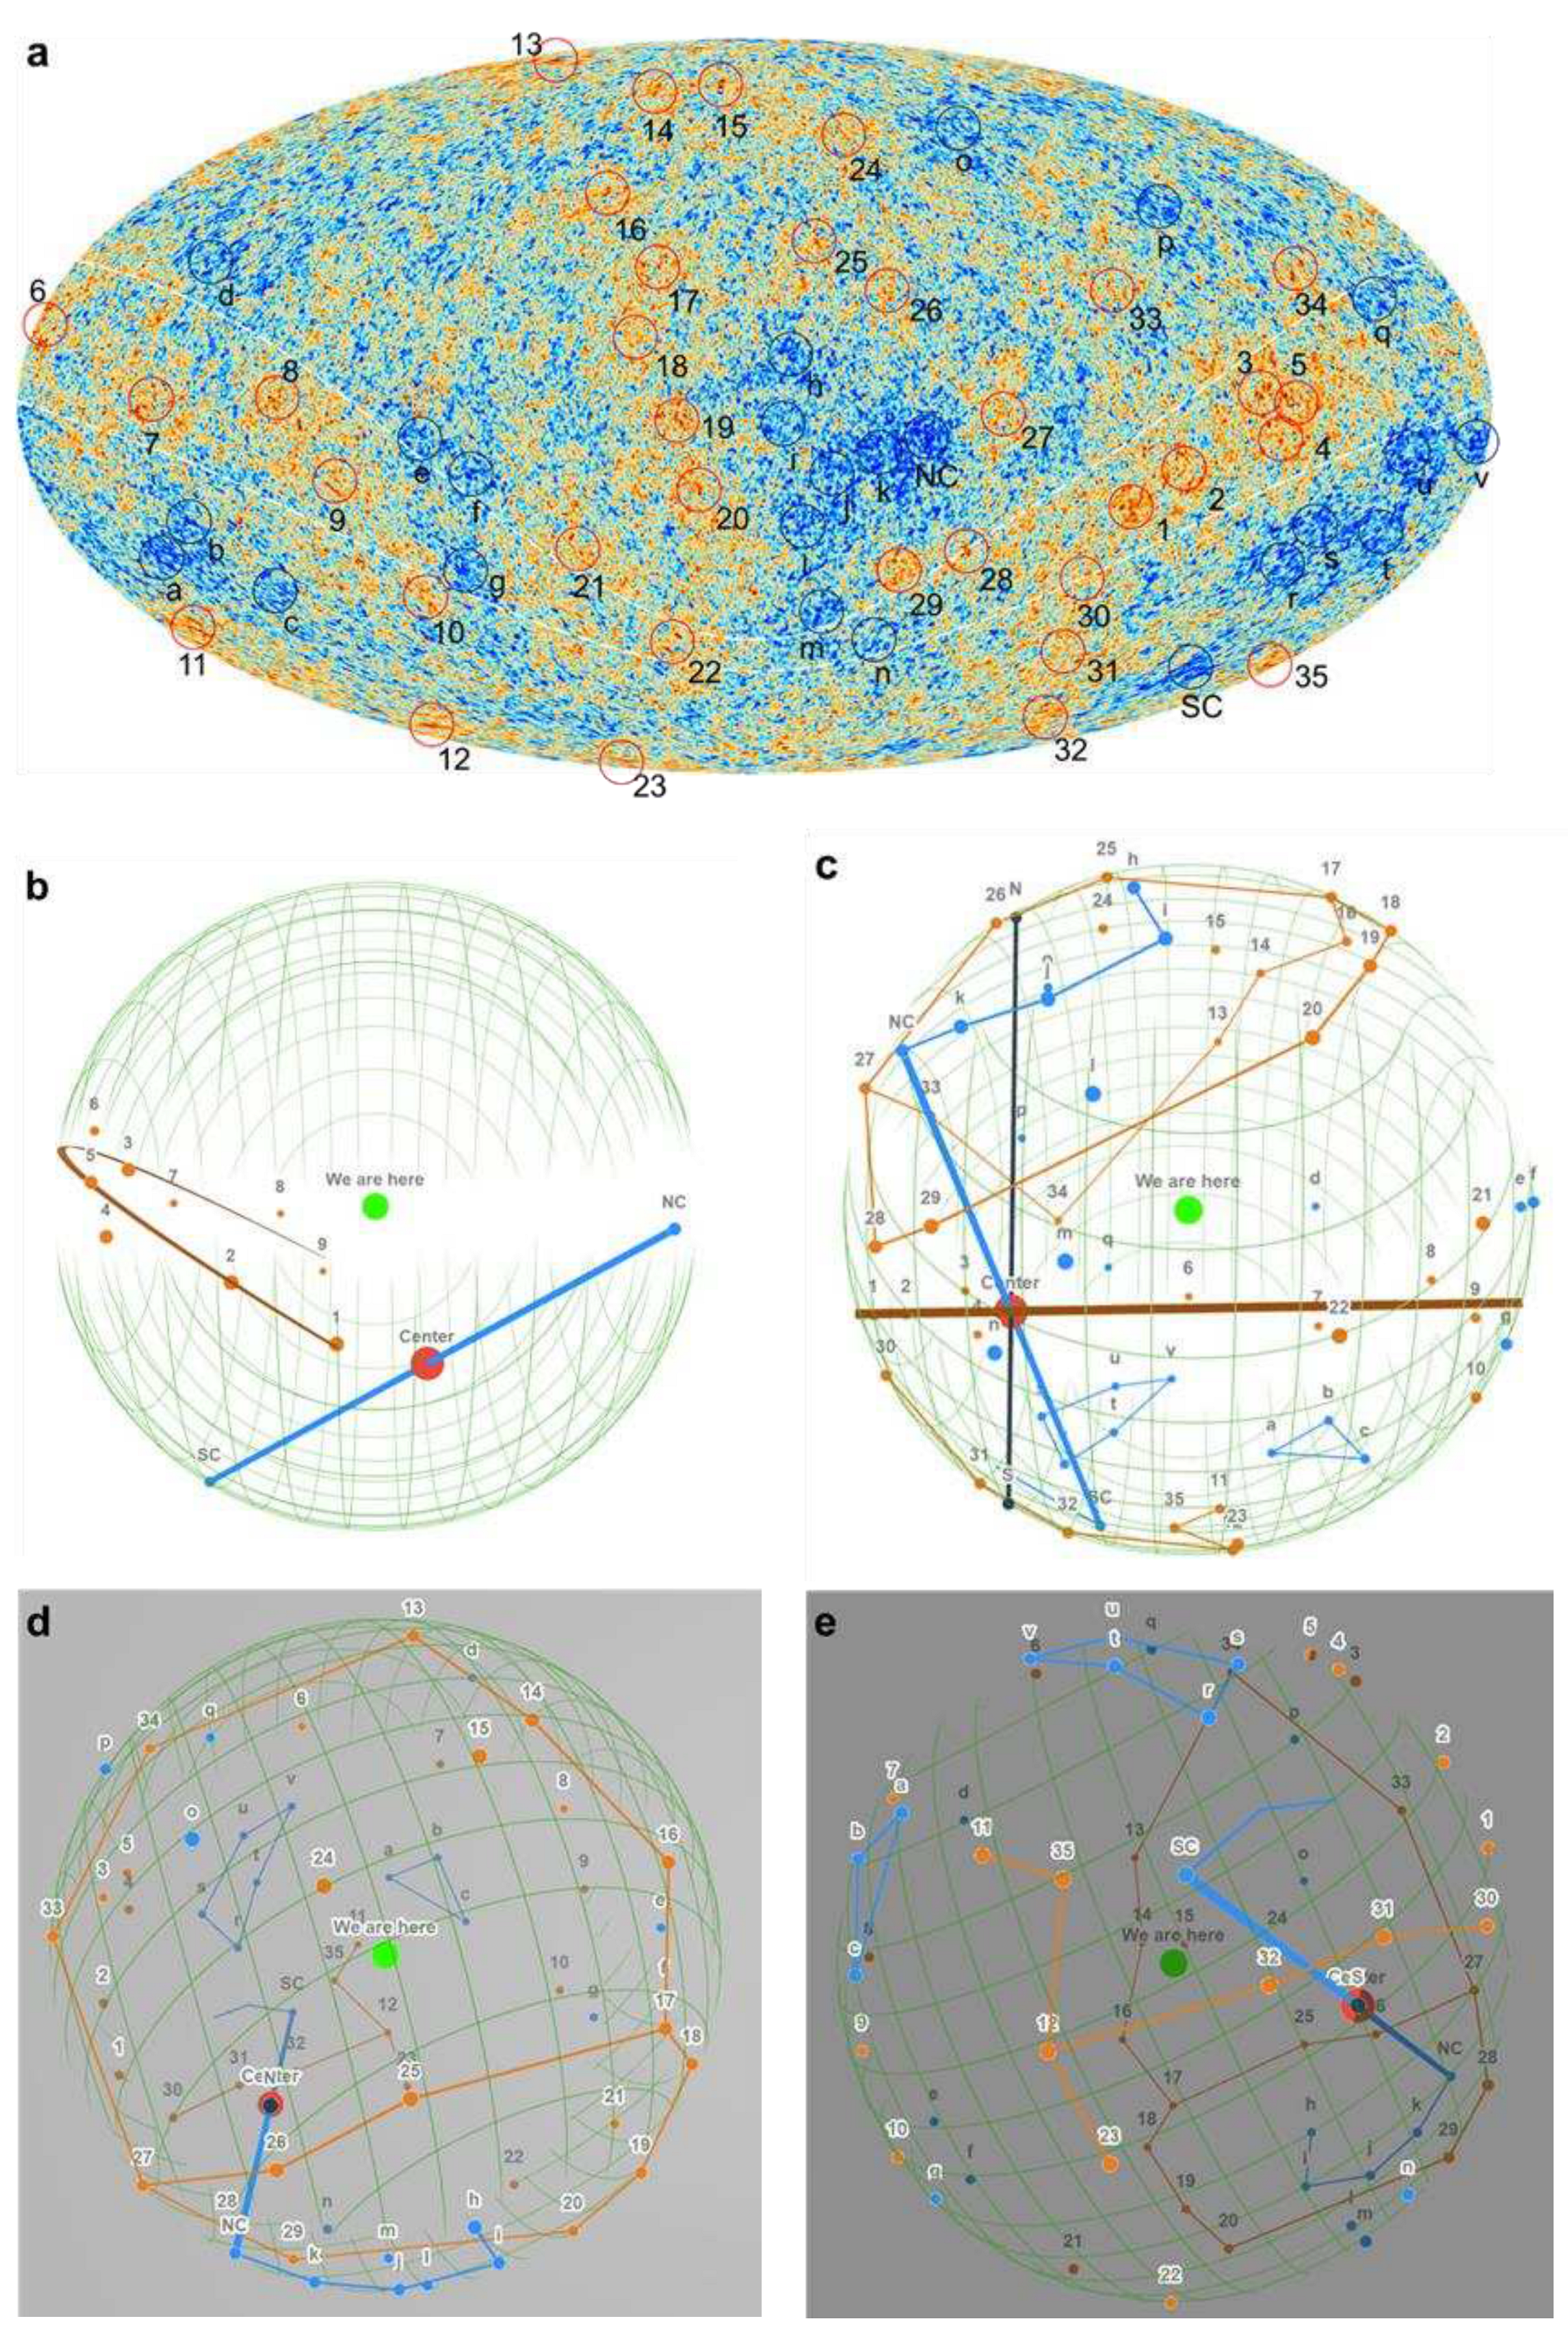
Because the Vs flows were perpendicular to the VBB, they collided, resulting in hot spirals in the infant universe. The hot spirals intersected with the surface of last scattering (SLS) generating a hot ring in the CMB. Half of the hot ring is easily noticeable in the range from Galactic coordinates l ,   b ~ 265 ° , 20 °   to   100 ° , 15 ° in the CMB, the most noticeable part of which is known as the Axis of Evil (de Oliveira-Costa et al. 2004; Land & Magueijo 2005; Copi et al. 2006)2,3. The hot ring is super thick, with an open angle larger than 30 ° in the CMB, but is not always continuous, which is reasonable as it originated from the Vs. The hottest points in the middle of the ring, labelled as 1 to 9 (Figure 2a), are taken to define the Vs plane. The standard deviations of reading the Galactic coordinates from multiple Planck CMB maps: SMICA, Commander, NILC, SEVEM, SMICA-NOSZ, and Fgsub-sevem4, are less than 1 ° . The Galactic coordinates of the points were converted into the Cartesian coordinates for best fitting of a 3D plane. The fitting was performed using a standard least-square method.

2.3. Synchronous Cold Spots

After the hot Vs plane is determined, one additional parameter is required to locate the Center. It is known that the beams Vb would develop in symmetric trajectories about the Center. However, it is impossible to observe the whole Vb trajectories in the CMB. Because the Vb had the same direction as the VBB, compared to other regions (with falling vacuum), less collisions happened, leading to a pair of cold spots with the largest temperature depression where the Vb passed through. Therefore, if the Center is within the observable universe, on the CMB there must exist two cold spots divided by the Vs plane. If they are distributed at equal distances about the Vs plane (meaning that they are synchronous), then even if the real Vb trajectories were not straight, by linking the two cold spots with a line, its intersection with the hot plane is the location of the Center. Like the Axis of Evil, the cold spots have also been well studied (Bennett et al. 2001; Akrami, et al. 2020). Without our model, the existence of the Center would be unknown.
It should be emphasized that without physical laws and the parameters inside the precursor black hole, the traditional scientific method of using physical laws to deduce the properties of interest is invalid. Therefore, the cold spots that are used to determine the Center must be synchronous so that they are ascertained to be symmetric about the Center. In the case that the cold spots were not synchronous, we would not be able to determine the location of the Center.
Fortunately, we have the required symmetry. After the Center was determined, we checked the distances from the cold spots to the Center and found that they are the same: ( 0.74 ± 0.12 ) r SLS for the NC versus ( 0.76 ± 0.12 ) r SLS for the SC, where r SLS is the radius of the SLS, therefore our results are reasonable.

3. NEW FINDINGS FROM THE CMB

3.1. Center and Spin of the Universe

The best-fitting plane of the spiral flows Vs (Figure 2) is:
z = ( 0.58 ± 0.10 ) x + ( 0.03 ± 0.03 ) y ( 0.36 ± 0.06 ) r SLS
Two observed cold spots with the largest temperature depression in the CMB are: SC, at l ,   b = ( 208 ° , 56 ° ) , on the South of the Vs plane, and NC, at l ,   b = ( 318 ° , 5 ° ) , on the North (Bennett 2001; Akrami, et al. 2020). We therefore have the following important results:
The Vs plane and the line between the cold spots intersected at l ,   b = ( 286 ° ± 10 ° , 43 ° 6 ° + 7 ° ) and at a distance ( 0.66 0.01 + 0.03 ) r SLS away from where we are (hereafter represented by the Local Supercluster or LS). This intersection is the point where the Big Bang occurred or the Center of the universe (Figure 2b). Since the radius of the SLS is 14 Gpc (Gott et al. 2005), the Center is ca. 9.3 Gpc or 30 billion light years away from the LS.
Only half of the hot ring is observed, while the other half is hardly visible (Figure 2). This is due to the Doppler effect and the Doppler beaming: if we look from the LS, the Vs flows were spiraling clockwise into the precursor core of the universe. Due to the frame-dragging effect, the core of the precursor black hole also rotated clockwise. We therefore know that: a) if we look from the LS to the Center, the universe is rotating or spinning clockwise; b) the plane of the hot ring is the equatorial plane of the universe (equation 3); c) the angle between the equatorial plane of the universe and the Galactic plane is 30 ° ± 5 ° ; d) the Northern observable universe is bigger than the Southern (Figure 3); e) the LS is inside the Northern observable universe (Figure 3); f) the axis of spin of the universe, perpendicular to the equatorial plane, is:
x ,   y , z = 0.13 r SLS , 0.47 r SLS , 0.45 r SLS + 0.58 , 0.03 ,   1.00 t
g) the spin axis intersects with the SLS at l ,   b = ( 325 ° , 31 ° ) on the North end and l ,   b = ( 256 ° , 62 ° ) on the South end.

3.2. Self-Consistence of CMB Characters

This clockwise spin is confirmed by the cold spots and a tail in the CMB. The angle between the Vs plane and the line between the NC and SC is 58 ° ± 6 ° . With this angle or larger, the rotating precursor core dragged the beams to sweep the inner space within the event horizon, just like a pulsar sweeps through space. Therefore, a low-temperature tail spreading in a wide range is observed following the NC in the CMB (NC-k-j-i-h, Figure 2c). A similar tail should also exist following the SC. However, the regions of the SLS that the two beams were sweeping are very different. As the Northern beam swept from h to i, j, k, and NC, the distance to the Center reduced (Figure 2c). This is very suitable for the tail to be observed, because the sweeping beam arrived at the SLS at almost the same time. On the contrary, as the Southern beam swept, the distance of the SLS to the universe Center increased quickly (Figure 2c). Any potential tail would thus fly beyond the SLS.
The Eridanus supervoid is generally believed to be insufficient to cause the temperature depression at the cold spot SC, though a recent Dark Energy Survey reported a much stronger Integrated Sachs-Wolfe imprint (Kovács et al. 2021). Our findings naturally provide an explanation on the temperature depression.
Almost all the other characters in the CMB can be explained by our mechanism. The regions immediately surrounding the Vb show higher temperatures (the Northern: 29-28-27-26-25-17-18-19-20, Figs. 2c and 2d; the Southern: 35(11)-12(23)-32-31-30, Figure 2e), due to the Vf surrounding the Vb. Other regions that show higher temperatures are close to the edge of the Northern SLS (33-34-13-14-16, Figure 2d), due to the Vf falling towards the equatorial plane. Geometrically, the Vf flows look longer and hence brighter on the edge. On the contrary, due to the lack of the Vf, the vast region below 20-19-18-17-16-14-13-34 (Figure 2c) is very uniform. The temperatures are lower for those close to the axis of spin rotating towards the opposite direction of the LS, such as the l, m, and n regions (towards the left in the front, Figure 2c), and for those rotating slower far away, such as the r-s-u-v-t and a-b-c regions (Figs. 2c and 2e), due to the Doppler effect. For the regions immediately close to the equator from the South side (a-b-c and r-s-u-v-t), there existed an additional effect: the super thick spirals that originated from the Vs on the equatorial plane decoupled later because they were hotter, and hence were not as transparent as other regions.

3.3. Universal Coordinate System

For the convenience of future discussion, we define a Universal Coordinate System, in which the LS is set at zero degrees longitude and the r SLS is the unit length. The angle between the line from the Center to the LS and the equatorial plane is ca. 28 ° and the distance between the LS and the Center is ca. 0.66 r SLS , so the universal coordinates for the LS is: ( J ,   W , R ) = ( 0 ° , + 28 ° , 0.66 ) . As shown in Figure 3, while it has been expanding dominatingly along its radial direction from the Center: J ,   W = ( 0 ° , + 28 ° ) or l ,   b = ( 106 ° , 43 ° ) , the LS has been rotating about the axis of spin (equation 4) on the plane z = 0.58 x + 0.03 y (parallel to the equator): the forward tangential direction l ,   b = ( 39 ° , 23 ° ) and the outward rotationally radial direction l ,   b = ( 121 ° , 18 ° ) .

4. INDEPENDENT EVIDENCE

4.1. Conformal Cyclic Cosmology

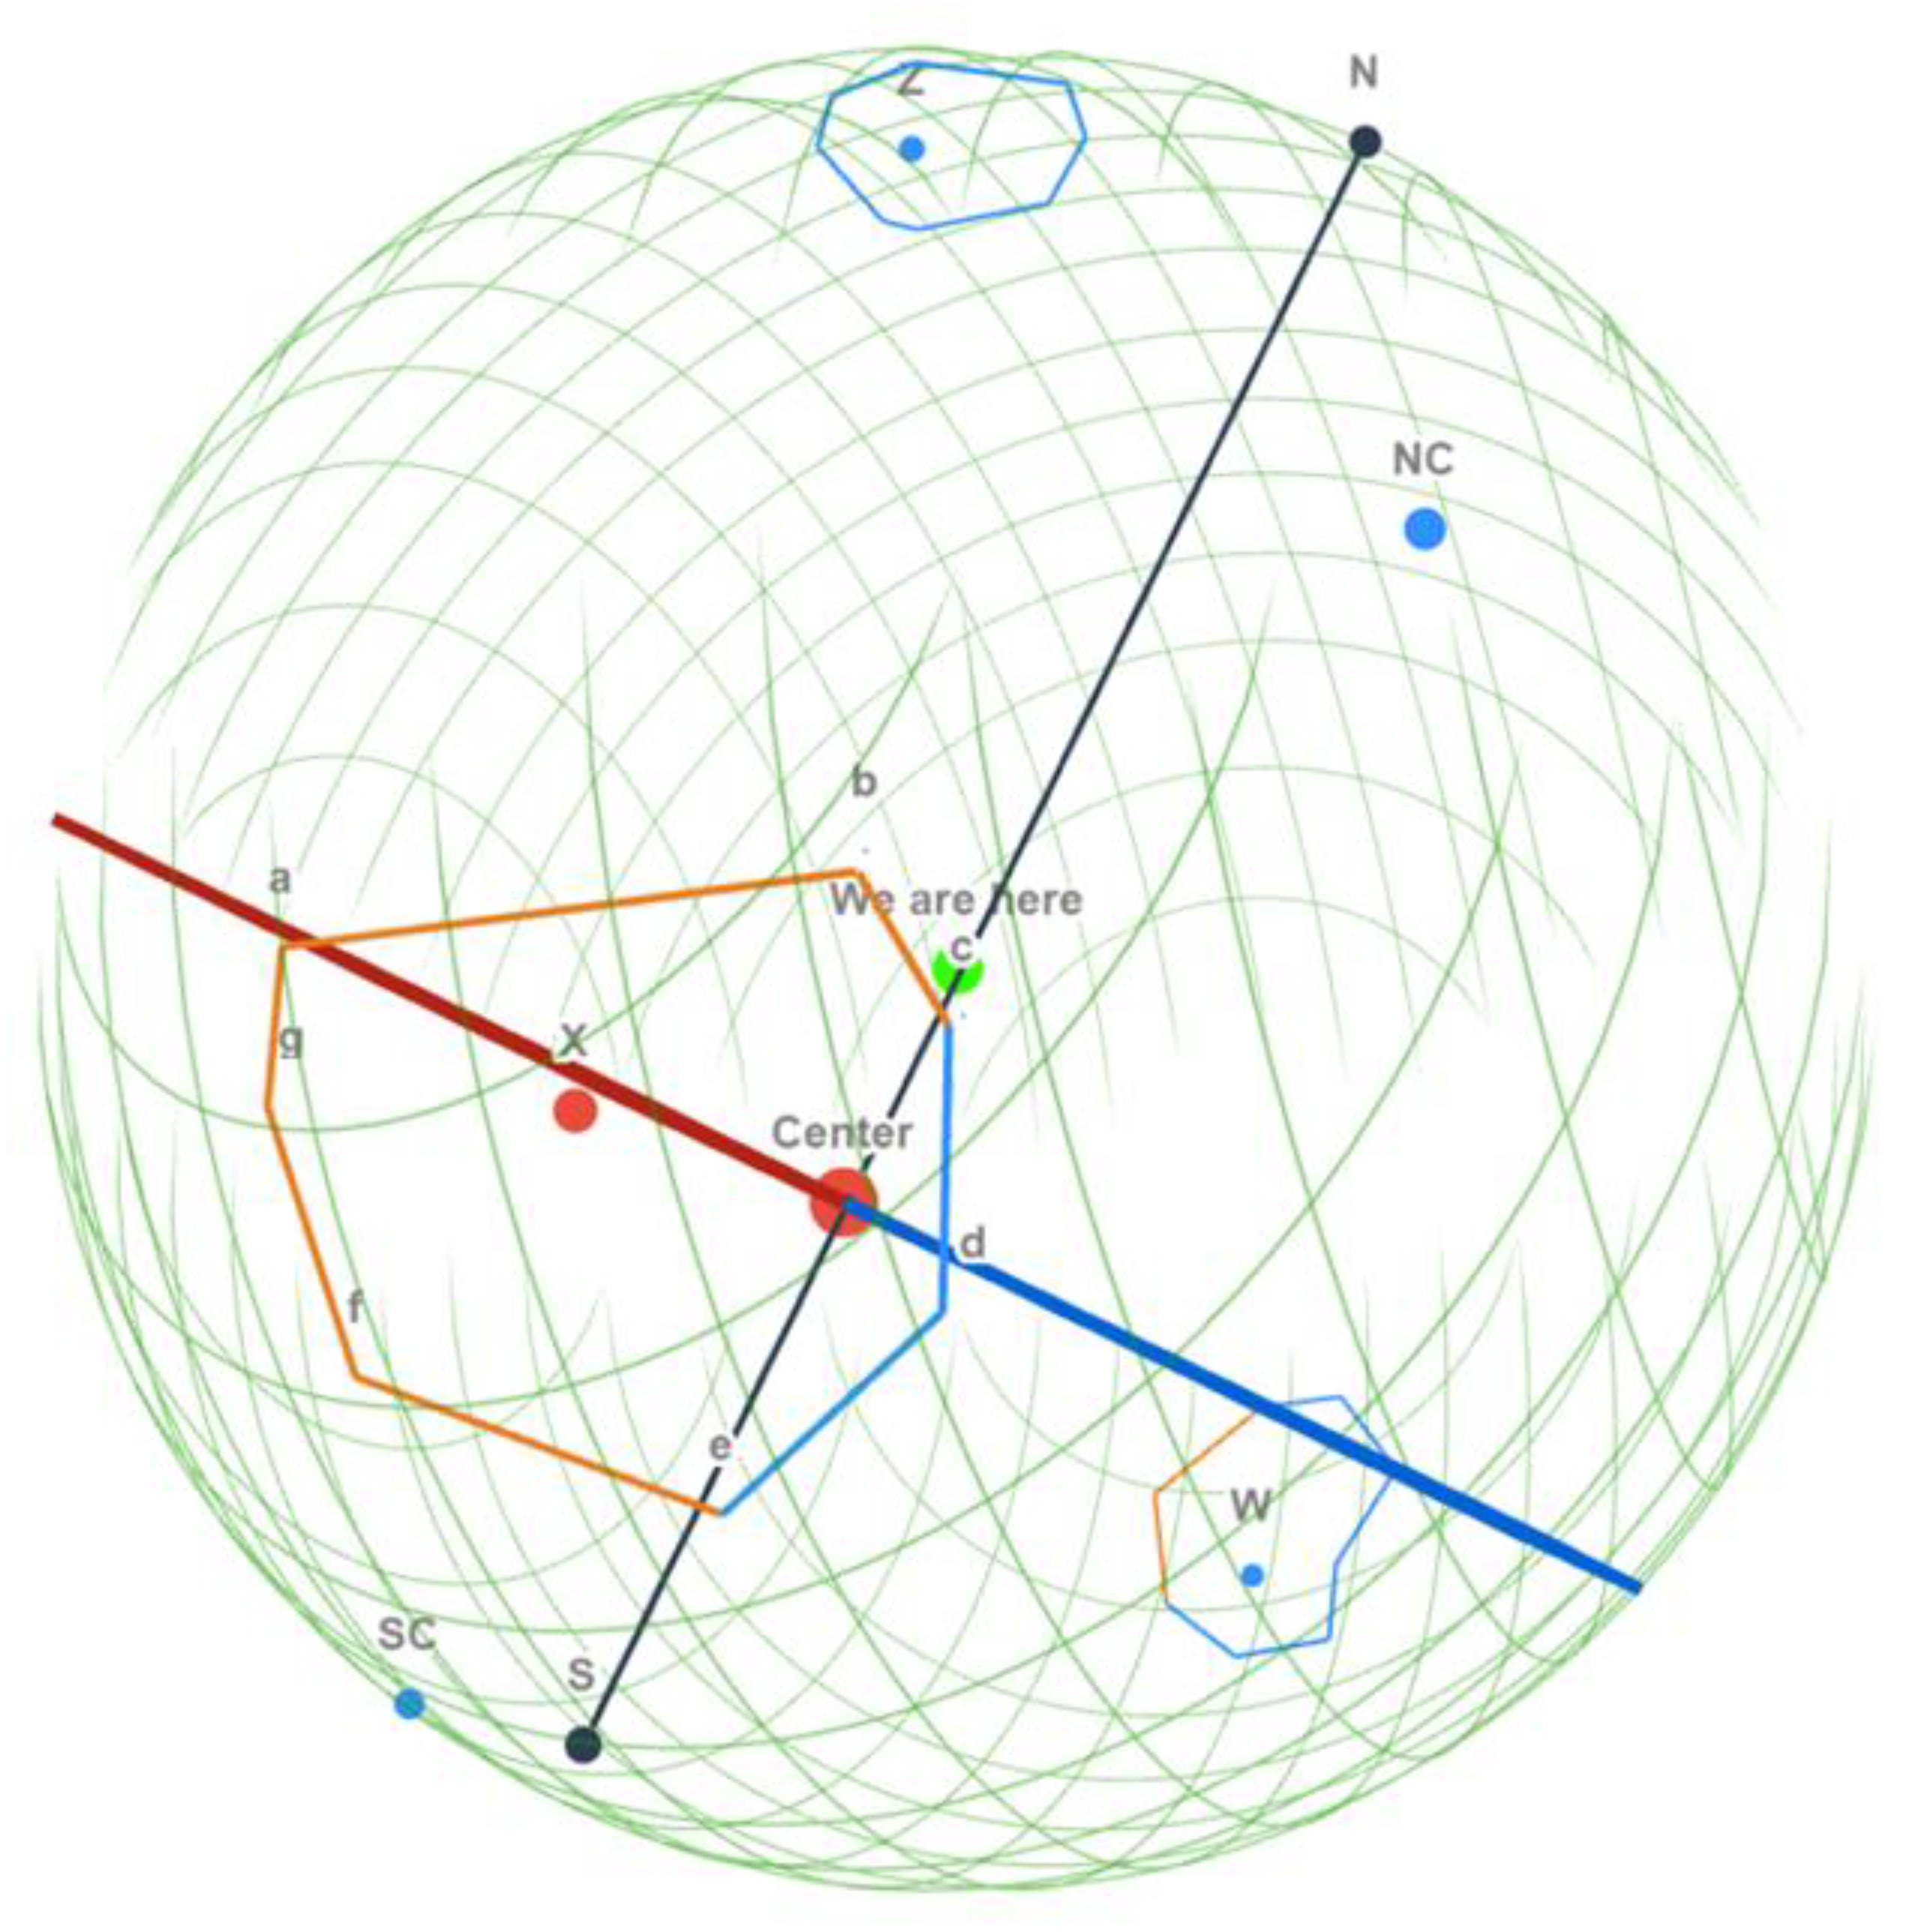
It is generally believed that the universe emerged from the Big Bang, before which space and time did not exist. However, Penrose (2010) proposed the conformal cyclic cosmology (CCC) that predicts there was an aeon preceding this universe. To support this theory, Gurzadyan and Penrose (2013, 2016) found multiple concentric low-variance circles (LVC) in the CMB maps. From the WMAP data, they found region X, a large, higher-temperature LVC region concentrated around l ,   b = ( 280 ° , 30 ° ) , and a small, lower-temperature LVC region Y at around l ,   b = ( 330 ° , 20 ° ) (Gurzadyan & Penrose 2013). When they updated their search on the Planck data, region X was confirmed to have the strongest LVC signal at the same coordinates, while region Y was insignificant. Instead, they found two other large lower-temperature LVC regions (Gurzadyan & Penrose 2016). Since they did not name them, we assign names accordingly: region Z concentrated around l ,   b = ( 290 ° , 65 ° ) , and region W concentrated around l ,   b = ( 90 ° , 32 ° ) . Very recently, Bodnia et al. (2023) searched for the LVC and found CMB anomalies instead. From the WMAP data, they obtained an anomalously bright spot at l ,   b = ( 279.5 ° , 31.8 ° ) , corresponding to region X. For the Planck data, although the comparison of temperature was confusing, the anomalies discovered with the highest magnitudes match Gurzadyan and Penrose’s LVC regions: l ,   b = 280.1 ° , 31.5 ° , corresponding to region X; l ,   b = ( 290.2 ° , 64.9 ° ) , corresponding to region Z; and l ,   b = ( 86.1 ° , 38.2 ° ) , corresponding to region W. From both CMB data, they also obtained a pronounced higher baseline variance region at region X, with a sharp circular boundary (Bodnia et al. 2023).
These results prove our findings in a direct manner. Region X, from either the WMAP or Planck data, all centered near l ,   b = ( 280 ° , 30 ° ) , is on the equatorial plane close to the Center of the universe (Figure 4). Like the hot half ring is observed (Figure 2), it was the collision between the Vs and VBB flows and the Doppler effect that resulted in higher temperatures of region X. Region Z is located at the lower-temperature half of the equatorial plane (Figure 4). Region W is the result of less collisions between the outward Northern Vb beam and the VBB flow, because it has almost the same universal latitude as the NC: converted from l ,   b = ( 86.1 ° , 38.2 ° ) (Bodnia et al. 2023), region W is centered at the universal latitude: W W = + 59.8 ° , while that for the NC is: W NC = + 58 ° ± 6 ° .
In addition, we noticed an incredible detail about the regions on the equatorial plane: Region X has a cold corner near l ,   b = ( 296 ° , 41 ° ) , while Region W has a hot corner near l ,   b = ( 98 ° , 28 ° ) (Gurzadyan & Penrose 2016). Figure 4 clearly shows that the cold corner of Region X is in the cold half of the universal equatorial plane, while the hot corner of Region W is close to the hot half. For region X, the hot part and the cold corner are clearly divided by a plane that is defined by the LS and the axis of spin (Figs. 4b and 4c), indicating that region X is very close to the Center. Without our findings, this detail should be impossible to explain.
Gurzadyan and Penrose believed that the low variances result from the addition of light from the previous aeon. The LVC regions with high temperatures come from distant previous-aeon galactic conglomerations, while the low-temperature LVC regions correspond to closer ones (Gurzadyan & Penrose 2013, 2016). This mechanism is not supported in this work. By analyzing our findings, we found that the low variances would be generated similar to the mechanism of baryon acoustic oscillations (BAO). All the collisions between flows, including that between the Vb and VBB flows, would result in overdense regions in the primordial plasma. The overdense regions produced high outward pressure. Like the BAO, the inward gravity and outward pressure created oscillations or spherical sound waves. By enhancing local heat transfer, the waves, like smoothers, reduced the temperature variances, leaving behind the LVC. This smoothing process requires time to process. Therefore, following the low temperature tail on the Northern SLS (NC-k-j-i-h, Figure 2c), there is a low-temperature LVC region, region Z. Similarly, no tail is observed on the Southern SLS, neither are the LVC regions.
Another interesting detail to support our BAO-like mechanism is about the LVC void at the center of Region X (Gurzadyan & Penrose 2016). As analyzed above, at the center of this overdense region, the densities were the highest, so were the initial variances. Because the variances were too high to be smoothed by the BAO-like process, the center appears as an LVC void. This explanation is also supported by the fact that the position of the void accurately matches that of Bodnia et al.’s anomaly with the highest magnitude (Bodnia et al. 2023), both of which, as expected, are on the equatorial plane (Figure 4).

4.2. Cosmic Inhomogeneities

Besides the CCC, a lot of other independent observational evidence supports our findings, one category of which is the inhomogeneous compositions of the universe. As discussed above, the emission beams Vb and the back falling flows Vf would sweep in a high angular speed, producing discontinuous clumps of high-density matter-energy across the space within the event horizon of the precursor black hole (Figure 1). During the early expansion of the universe, these flows, together with the falling spiral flows Vs, would collide with the powerful VBB, resulting in overdense clumps and debris as primordial nucleation centers (PNC) or primordial seeds for the new-born universe. In addition to the LVC, some PNC would have been observed as the Hawking points (An et al. 2020). Compared to the standard ΛCDM model in which overdensities were generated by quantum fluctuations, our findings provide a mechanism to have the PNC much earlier and more mature, and hence explains multiple extraordinary astronomical facts.
The James Webb Space Telescope (JWST) has observed numerous distant, complex galaxies that should not exist (Witze 2022; Clery 2023; Labbé et al. 2023; Boylan-Kolchin 2023; Donnan, et al. 2023). How an unexpectedly large number (Witze 2022) of unexpectedly mature (Witze 2022) and unexpectedly bright (Clery 2023) galaxies with unexpectedly high mass (Labbé et al. 2023; Boylan-Kolchin 2023) form at an unexpectedly short time (Witze 2022) after the Big Bang challenges the standard cosmology. Yet there is no convincing explanation. With the existence of the PNC from the precursor black hole, the formation of the first galaxies would naturally be much faster than predicted by the ΛCDM model or the cosmological principle.
The PNC would also generate other cosmic structures or objects larger than expected. One type would be the extraordinarily large great walls whose sizes are incompatible with the cosmological principle. Such candidates include the Hercules–Corona Borealis Great Wall, Giant GRB Ring, and Huge-LQG, etc.5 Another type would be the extraordinarily supermassive black holes whose masses exceed the theoretical limits. Such candidates are Phoenix A and 4C+74.13, etc.6
The PNC would exist across the sky, because overdense clumps would be sprayed anywhere by the flows within the event horizon (Figure 1). However, the distribution might not be uniform: the sky zones near the Center or with lower universal latitudes ( W 58 ° ± 6 ° ) would be of higher density, while those near the axis of spin ( W   ~   90 ° ) would be of lower density. It seems that the first galaxies in the early JWST deep fields (Donnan, et al. 2023), such as SMACS-0723 (close to the Center, W   ~ + 43 ° ), CEERS ( W   ~ + 37 ° ), and GLASS ( W   ~ 27 ° ), are in the higher-density zones, so are the extraordinarily large great walls5 and black holes6.

4.3. Cosmic Anisotropies

4.3.1. Ellipsoidal Universe

Another category of evidence to support our findings is cosmic anisotropies (e. g. King et al. 2012; Mariano & Perivolaropoulos 2012; Chang & Lin 2015; Colin et al. 2019; Migkas et al. 2021; Abdalla et al. 2022; Perivolaropoulos & Skara 2022; Aluri et al. 2023). Because of the isotropic VBB expansion from the Center, the universe was born to be a sphere. Despite being surrounded by the flows Vb, Vf, and Vs, the new-born universe would have very uniform surroundings to expand, because the mass-energy of the flows was negligible compared to that of the neutrino star core.
However, since it spins, the universe does not expand equally in different directions. Our model does not provide any real structures with heavy mass at the Center after the Big Bang (for comparison, the precursor black hole had the heaviest neutrino star core before the Big Bang). Without having sufficient centripetal force during the course of accelerating expansion, matter, including the fabric of space-time, has been flying away from the axis of spin (vr, Figure 3). In the direction parallel to the axis of spin, gravity exists for anything not on the equatorial plane (vs, Figure 3). Therefore, during its course of expansion, the universe has been veering towards the ellipsoidal. The ellipsoidal universe: X 2 a 2 + Y 2 a 2 + Z 2 b 2 = 1 has two isometric long axes 2a on the equatorial plane and a short axis 2b along the axis of spin (Figure 3). The dominating expansion of the universe is the isotropic Hubble flow in the radial direction from the Center. If it were excluded, the universe would be elongated in the directions parallel to its equator and contracted in the direction parallel to its axis of spin.

4.3.2. Fast Expansion Direction and Slow Expansion Direction

The deformation of the universe changes our observable universe accordingly. Campanelli et al. (2006) suspected that the SLS was ellipsoidal. Strictly speaking, the observable universe or SLS is not ellipsoidal, because it does not have orthogonal axes as the universe does or, equivalently, the LS is not on the equatorial plane. For this reason, the exact direction of the fastest or slowest expansion of the observable universe is unknown, because it is related to the size of the universe that is unknown (the lowest limit of the size of the universe would be 3.32 r SLS ). For the same reason, though it is known that the obtained location of the Center would slightly bias the North, it is not wise to thoroughly study its deviation before our model is well accepted.
If the Hubble flow were removed, the LS would move towards the direction that would be asymptotic to the equatorial plane: while always in the Northern universe, the LS would move closer with the equatorial plane. Therefore, the fastest expansion direction (FED) of the observable universe shall be close to the outward rotationally radial direction, slightly skewing towards the equatorial plane (i.e. the blue direction in Figure 3). As the contraction along the axis of spin slows the expansion on the opposite side, we, at the LS, shall observe slower expansion in the slow expansion direction (SED), which is close to the inward rotationally radial direction l ,   b = ( 301 ° , 18 ° ) , skewing away from the equatorial plane (i.e. the red direction in Figure 3).

4.3.3. Astronomical Observations

4.3.3.1. Cosmic Dipoles Aligning with the SED
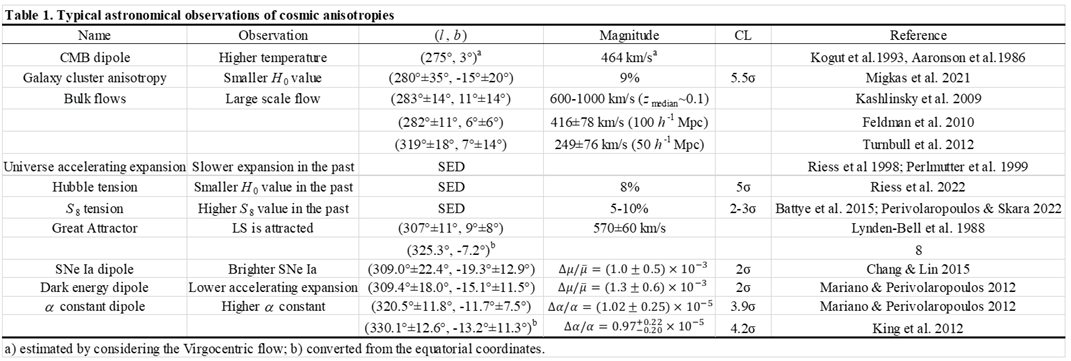
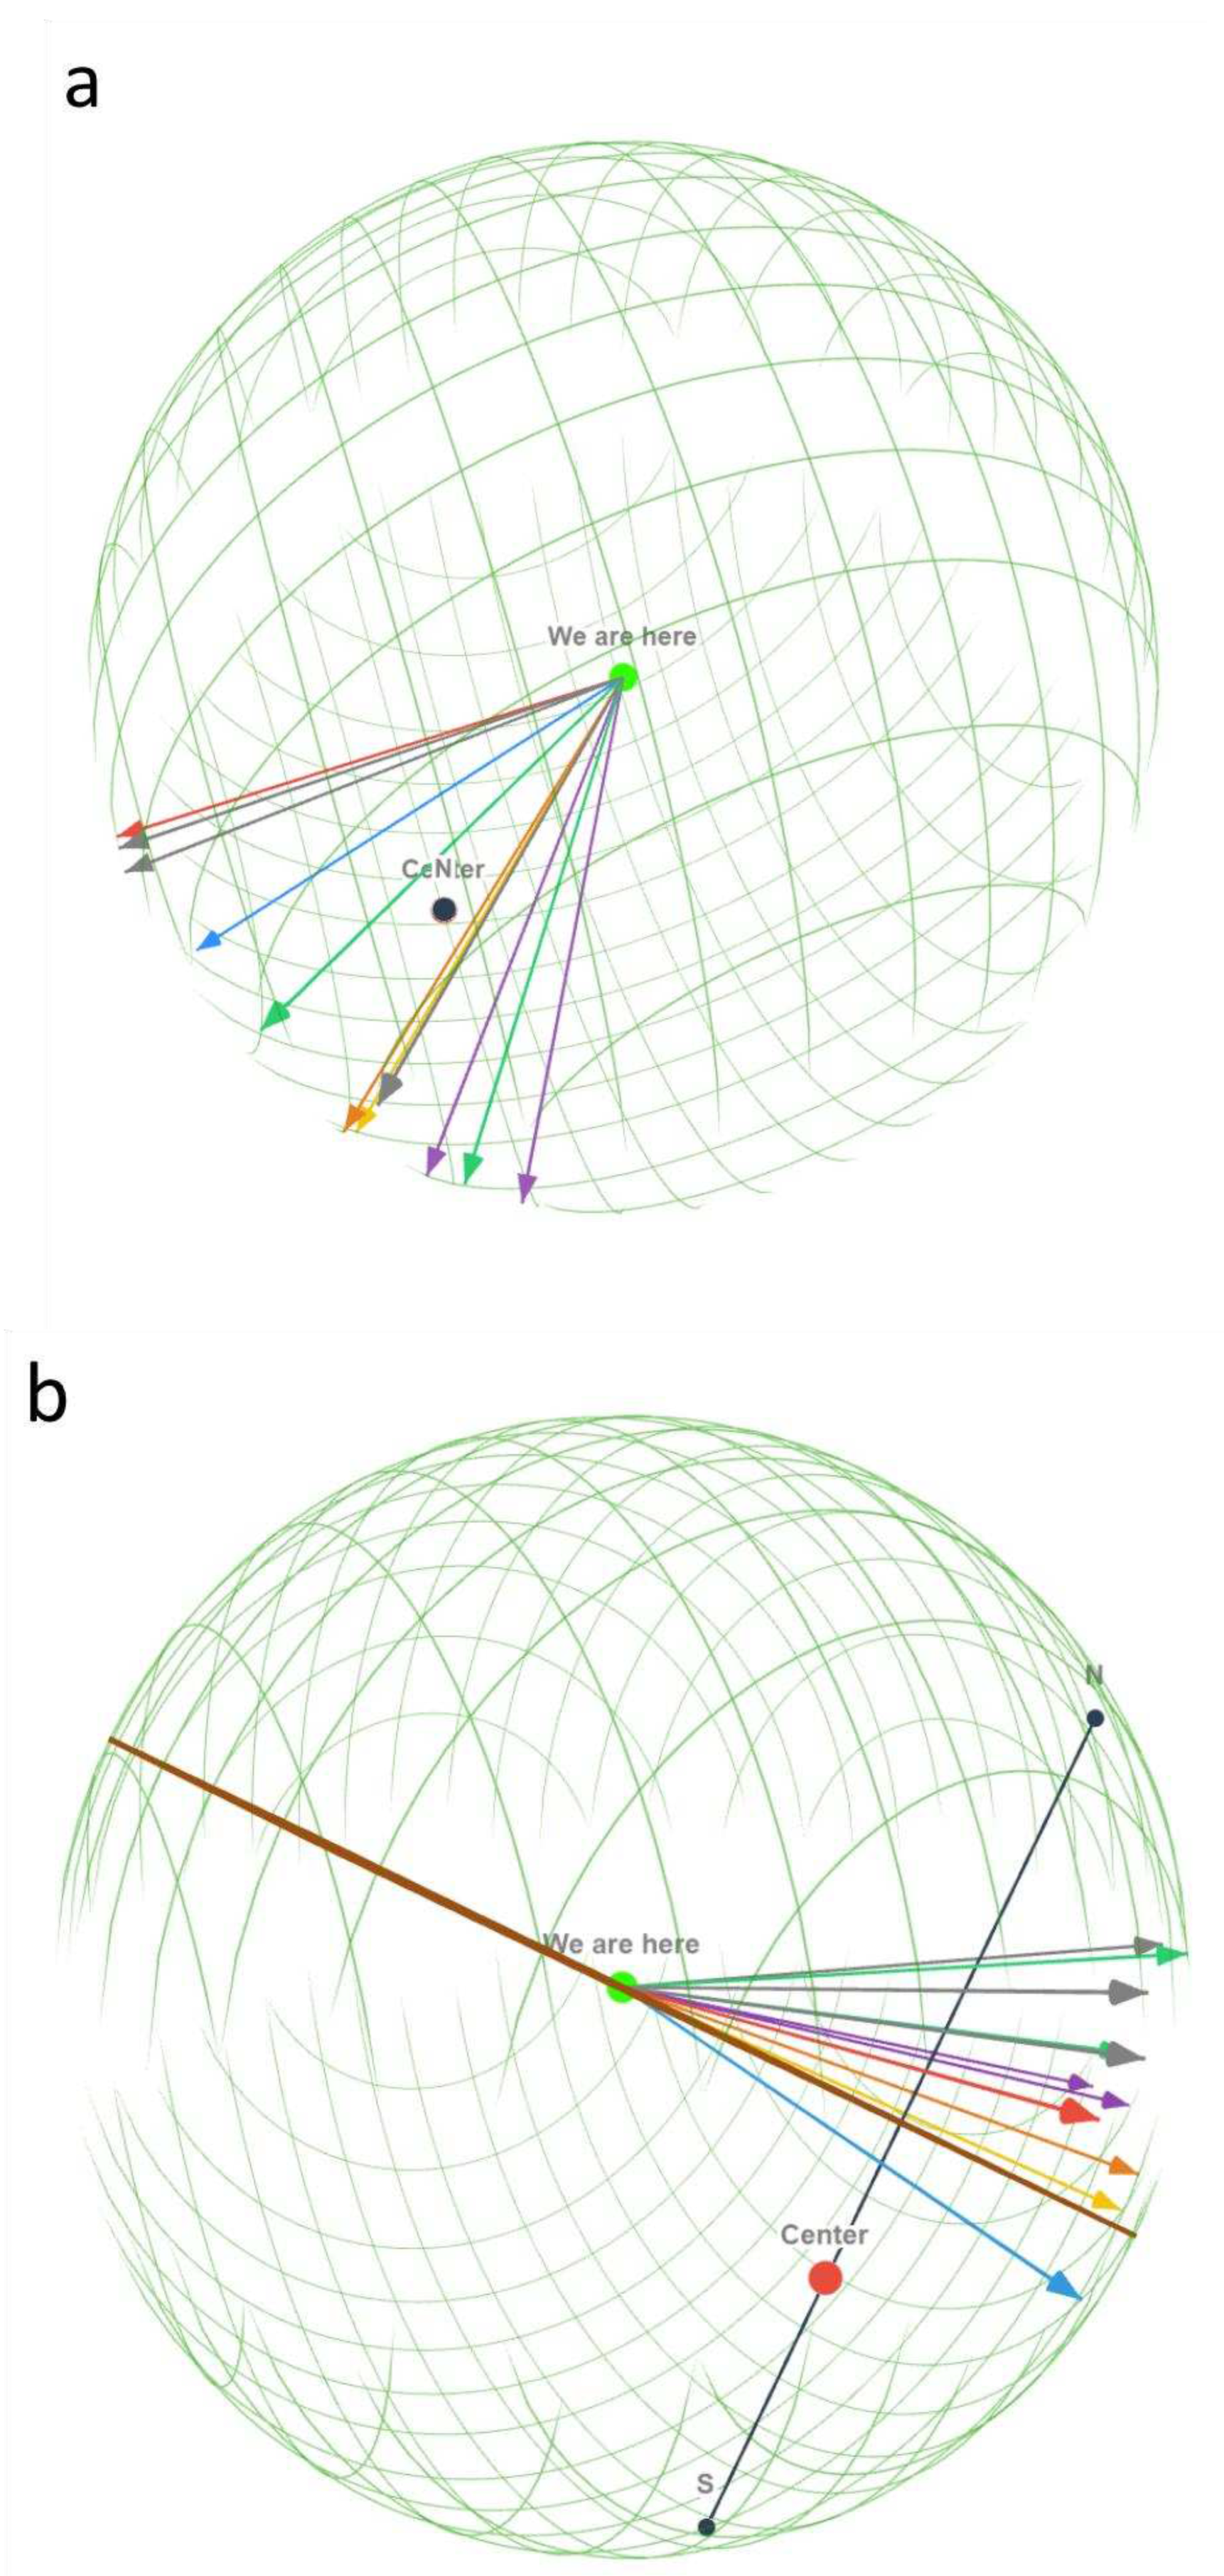
This preferred direction from our findings is confirmed by multiple independent astronomical observations. Some typical anisotropies observed are listed with their SED in Table 1, indicating without doubt that the universe has a preferred direction (e.g. Hudson et al. 1999; Kashlinsky, et al. 2009; Feldman et al. 2010; Turnbull et al. 2012; King et al. 2012; Mariano & Perivolaropoulos 2012; Chang & Lin 2015; Colin et al. 2019; Migkas et al. 2021; Abdalla et al. 2022; Perivolaropoulos & Skara 2022; Aluri et al. 2023). Probably because the magnitudes of those anisotropies are small, the observed directions are scattering for different properties, as well as for the same properties (Figure 5). Other than the fine-structure constant α dipole (King et al. 2012; Mariano & Perivolaropoulos 2012) that is generally attributed to a different mechanism (Davies et al. 2003), slower expansion in the SED appears as lower accelerating expansion (i.e. dark energy dipole, Mariano & Perivolaropoulos 2012), brighter Type Ia supernovae (i.e. SNe Ia dipole, Chang & Lin 2015), smaller Hubble constant H 0 (i.e. galaxy cluster anisotropy, Migkas et al. 2021), or mutually approaching flows of galaxies (such as bulk flows, Hudson et al. 1999; Kashlinsky et al. 2009; Feldman et al. 2010; Turnbull et al. 2012).
With the understanding that those anisotropies share the same mechanism, we can convert from one to another. Here is an example of conversion from the dark energy dipole to the bulk flow. For a galaxy in the SED at a distance D away from the LS, the recessional velocity of the Hubble flow is: v iso = H 0 D , where the Hubble constant H 0 = 73.04   km   s 1 Mpc 1 (Riess et al. 2022). With the existence of the dark energy dipole (Mariano & Perivolaropoulos 2012): μ / μ ¯ = ( 1.3 ± 0.6 ) × 10 3 , where μ is the distance modulus in the context of ΛCDM, the recessional velocity is: v aniso = H 0 D 1 μ μ ¯ / 10 1 5 μ 0 μ μ ¯ , where μ 0 is a constant related to the Hubble parameter h: μ 0 = 42.38 5 log 10 h . We thus have a bulk flow: v BF = v aniso v iso . If D = 50 h-1 Mpc (Turnbull 2012), then v BF = 180 ± 80   km / s ; if D = 100 h-1 Mpc (Feldman et al. 2010), then v BF = 370 ± 170   km / s ; if D = 400 Mpc (Kashlinsky et al. 2009), then v BF = 1100 ± 500   km / s . The calculated flows match the observations listed in Table 1. Doubt with the existence of bulk flows due to their broad range of velocities observed from galaxies with different distances and directions should now be clarified.
Preprints 77437 i001

4.3.3.2. The CMB dipole and Great Attractor

The Local Group velocity with respect to the CMB points towards l ,   b = ( 276 ° ,   30 ° ) (45). If the Virgocentric flow is considered with a value (Aaronson et al. 1986) of VVC = 300 km/sec (VVC is generally believed to be in the range7 of 100-400 km/sec), then the LS velocity with respect to the CMB points towards l ,   b = ( 275 ° , 3 ° ) , which is in roughly the same direction as the SED (Figure 5). Therefore, instead of the LS moving against the “CMB rest frame,” it would be the space-time that is moving towards us. Although its direction (Lynden-Bell et al. 1988)8 must be affected by local sources, the Great Attractor is also roughly in this direction, implying a similar mechanism of approaching.

4.3.3.3. The Axis of Evil or the CMB Quadrupole and Octopole

The Axis of Evil (de Oliveira-Costa et al. 2004; Land & Magueijo 2005; Copi et al. 2006)2,3 is one of the very first noticeable characters in the CMB. In literature, there are different definitions. The long hot stretch in the CMB (i.e. 1-2-3&4-5, Figure 2) can directly be called the Axis of Evil3. With this hot stretch as well as the cold spots on either of its sides, the CMB quadrupole (l = 2) and octopole (l = 3) were obtained by numerical algorithms (de Oliveira-Costa et al. 2004; Copi et al. 2006). Since we, at the LS, are not on the equatorial plane of the universe, the hot zone on the other side (i.e. points 6-7-8-9) is not exactly at the opposite position (Figure 2). This geometry allows the CMB temperatures to be optimized into either the quadrupole or octopole with close directions (de Oliveira-Costa et al. 2004; Land & Magueijo 2005; Copi et al. 2006), though the best would probably be a combination of both of them (i.e. l = 2 + 3) (Copi et al. 2006). Therefore the line (in fact, it is a circle on the SLS) to link the poles can also be called the Axis of Evil2, though more often we call their moments the CMB quadrupole and octopole. No matter how the Axis of Evil is defined, the most obvious, certain portion is the long hot stretch: 1-2-3&4-5, which we now know is the equatorial plane close to the Center.
Of course our findings would not explain all the observed anisotropies. For example, the high energy cosmic ray dipoles are from specific sources (Ahlers 2016; Aab, et al. 2017), while high-l CMB multipoles are not available in our model.

4.4. Time Variations

Interestingly, the spatially anisotropic direction is consistent with a few well-known time variations, which could be regarded as the time anisotropies of the universe. The LS is moving away from the direction of the slower expansion, while observations show that the universe is expanding in acceleration (Riess et al. 1998; Perlmutter et al. 1999). The LS moves away from the direction of the smaller H 0 , while observations find the Hubble tension indicating that the H 0 was smaller in the past (Riess et al. 2022). The LS moves away from the direction of the slower expansion or higher matter density and amplitude of growth of structures, while observations show the S8 tension saying that the S8 value was larger in the past (Battye et al. 2015).

5. CONCLUSIONS AND THE FATE OF THE UNIVERSE

By re-analyzing the CMB, we find that the Center of the universe where the Big Bang happened was at 0.66 0.01 + 0.03 times the radius of the surface of last scattering away from the Local Supercluster (LS) and at Galactic coordinates l ,   b = ( 286 ° ± 10 ° , 43 ° 6 ° + 7 ° ) . If we look from the LS to the Center, the universe is spinning clockwise. Our findings are supported by Penrose’s CCC theory, LVC sets in the CMB, and many other independent observational evidence of cosmic inhomogeneities, spatial anisotropies, and time variations.
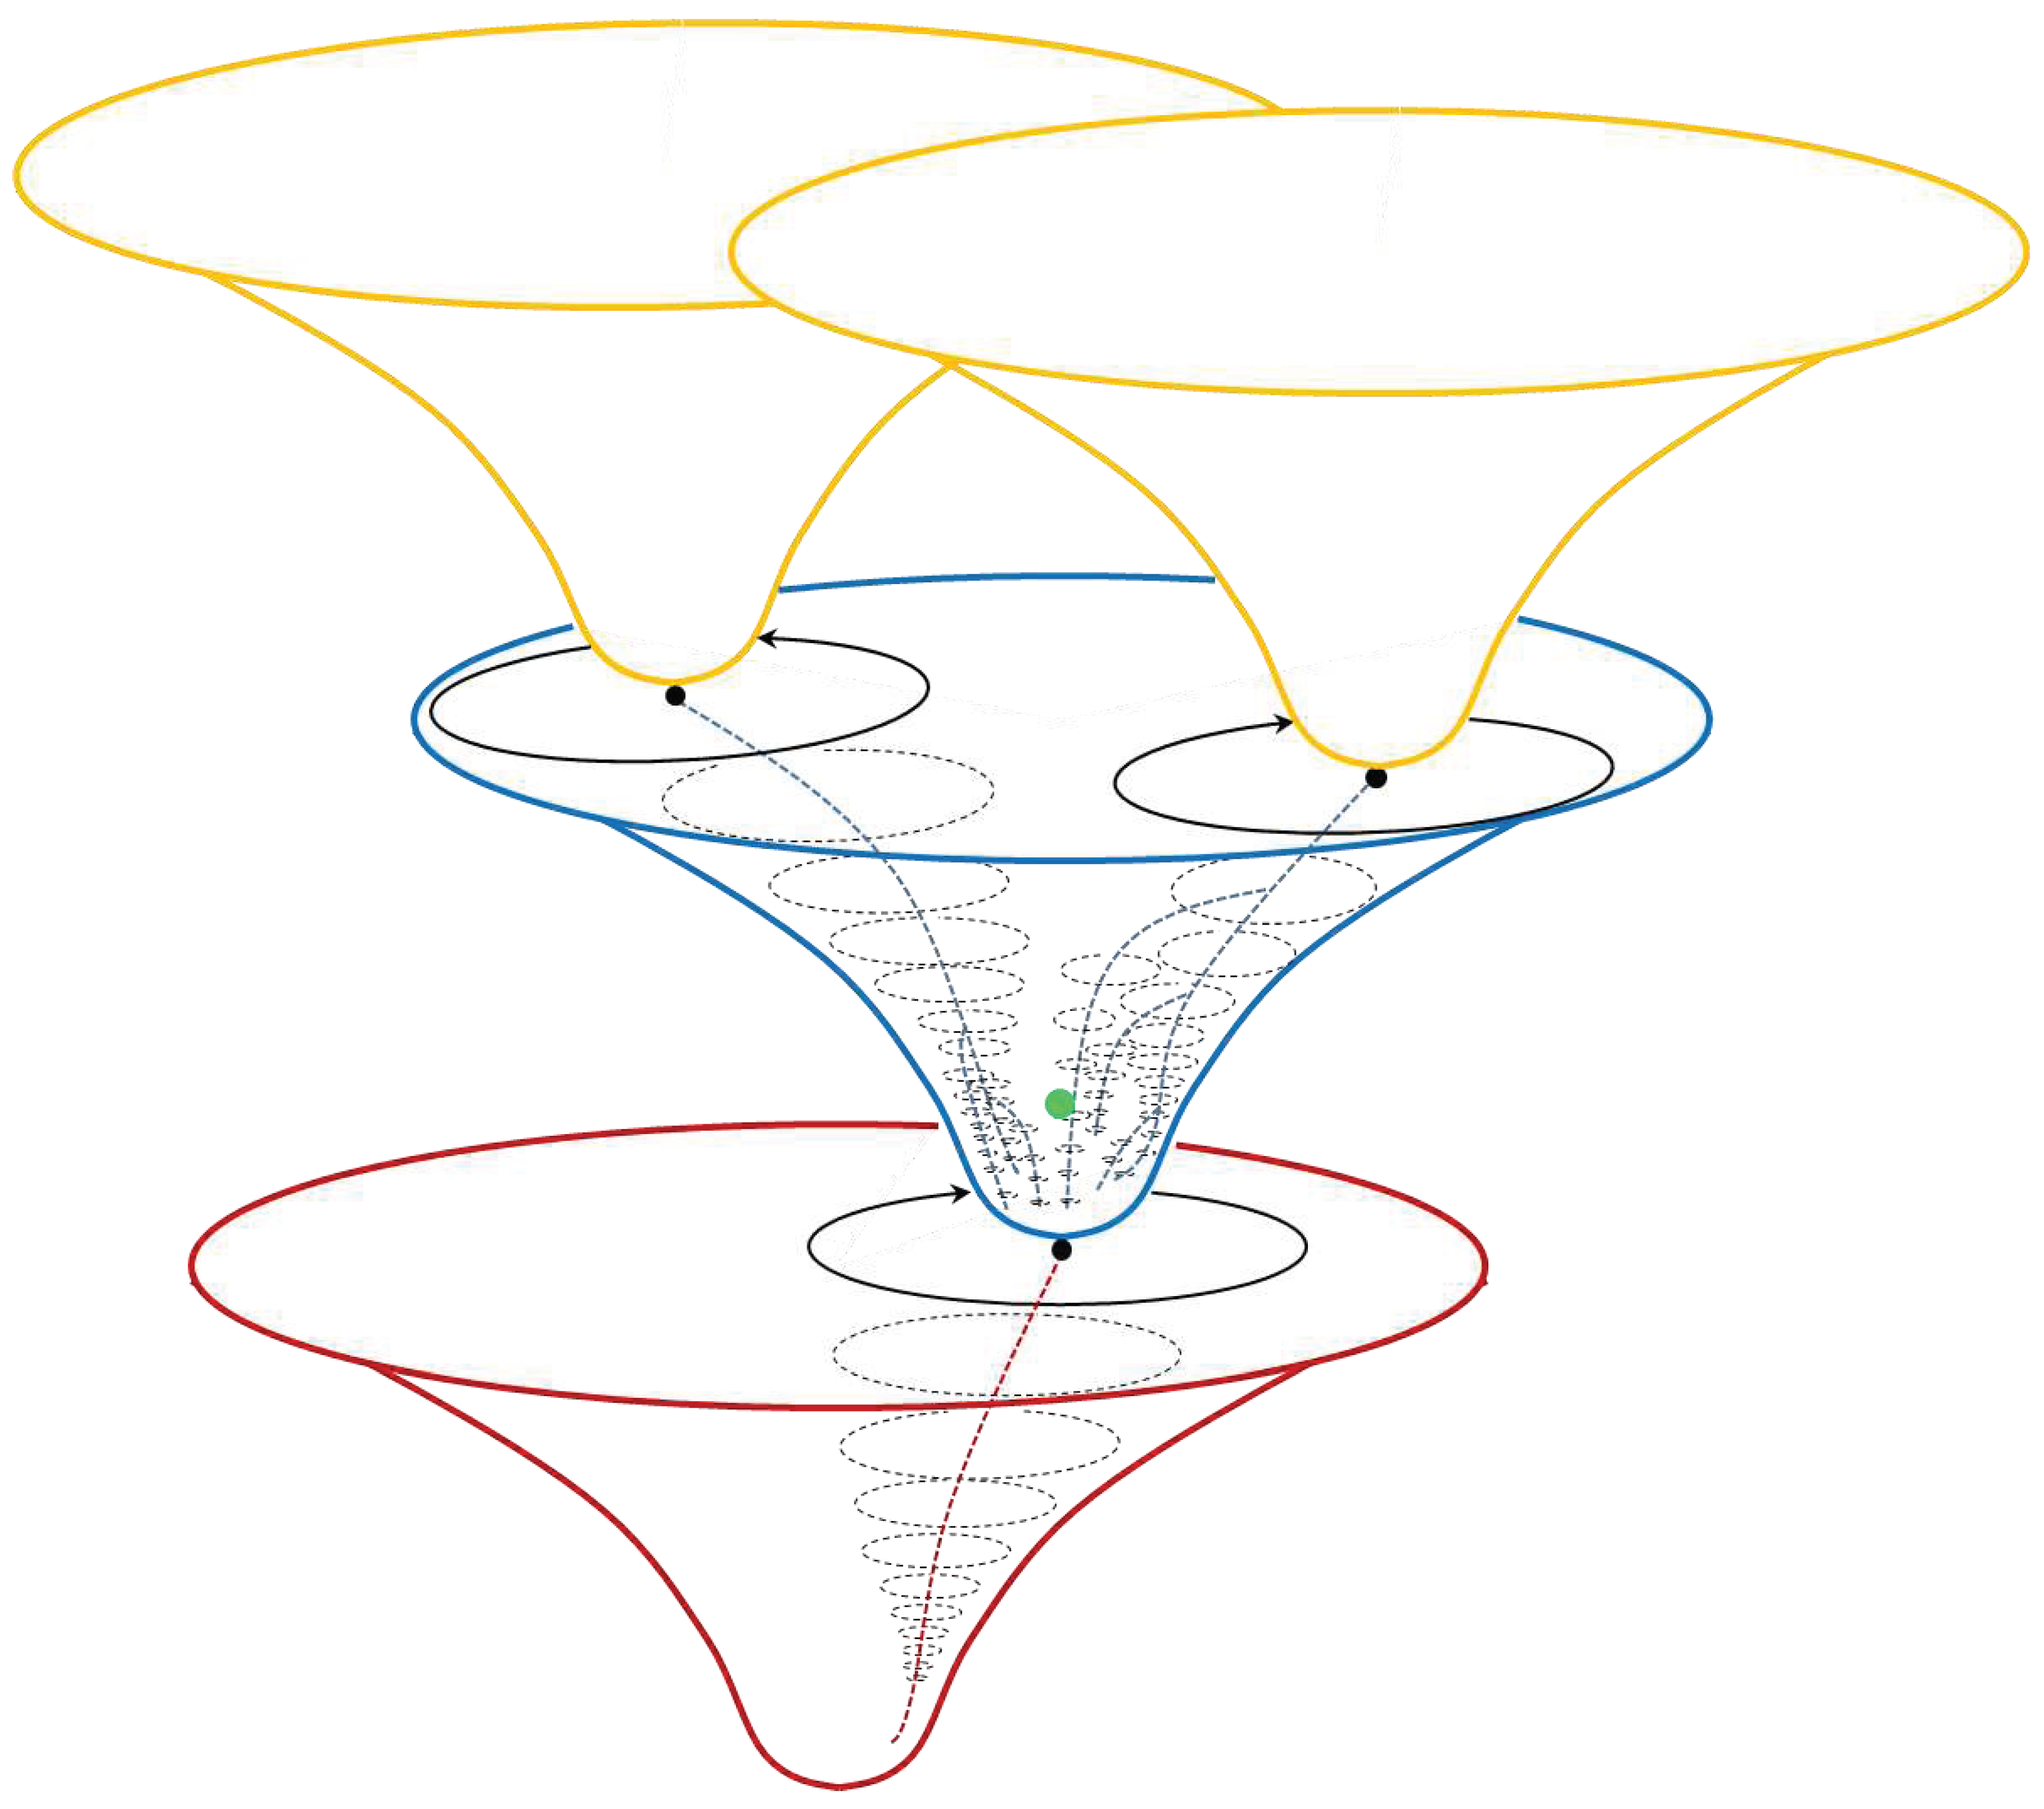
Based on our findings, the universe would be an open system (as defined in thermodynamics) and end up with new Big Bangs (Figure 6). As the universe keeps deforming, its eccentricity: e = 1 b 2 / a 2 increases, and hence the universe would eventually become a disk-shape. As we can imagine, a flattened disk-shaped universe would be ideal for the generation of new Big Bangs, because it supplies more vacuum energy for the new births and more space to avoid collisions between new-born universes. This naturally explains the accelerating expansion of the current universe (Riess et al. 1998; Perlmutter et al. 1999). Black holes, or their mergers, would be the precursors of the universes of the next generation, and hence require space or vacuum energy to grow. The surroundings of this open universe system, based on our neutrino star model, would be an infinite vacuum.
Given the fact that the current universe is still nearly homogeneous and isotropic (e is very small), and that the currently observed maximum mass6 of black holes is merely 1011 M , far below the mass limit for a neutrino star (equations 1 and 2), our universe, as shown in Figure 6, is still at her young age!

Data Availability Statement

All results in this paper are obtained using publicly available data.

Acknowledgments

J.B.B. would like to thank Profs. Z. Shen, K. Yao, X. Jiang, F. Bo, Y. Cheng, S. Han, G. Chen, and Q. Yu at Zhejiang University for their inspiration. N.P.B. would like to dedicate this work to his grandparents in China. This work has been pursued upon interest without external financial support.

(Notes)

References

  1. Aab, A. et al. 2017. [Google Scholar]
  2. Aaronson, M. et al. 1986. [Google Scholar]
  3. Abdalla, E. et al., 2022, J. High Energy Astrophys. 34.
  4. Ahlers, M. , 2016, Phys. Rev. Lett. 1511. [Google Scholar]
  5. Akrami, Y. et al. 2020. [Google Scholar]
  6. Aluri P., K. , 2023, arXiv: 2207. 0 5765v4.
  7. An, D. et al. 2020. [Google Scholar]
  8. Bao, J.-B.; Bao, N.P. 2020, Preprint, 2020120703. [CrossRef]
  9. Battye R., A. , Charnock T. & Moss A. 2015, Phys. Rev. 1035; 91. [Google Scholar]
  10. Bennett C., L. et al. 2001. [Google Scholar]
  11. Bodnia, E. et al., arXiv 2023, arXiv:2208.06021v2. [Google Scholar]
  12. Boylan-Kolchin, M. , 2023, Nat. Astron. [CrossRef]
  13. Campanelli, L. , Cea P. & Tedesco L., 2006, Phys. Rev. Lett. 1313; 97. [Google Scholar]
  14. Chang, Z. & Lin H.-N. 2015. [Google Scholar]
  15. Clery, D. 2023.
  16. Colin, J. et al. 2019. [Google Scholar]
  17. Copi C., J. et al. 2006. [Google Scholar]
  18. Davies P. C., W. , Davis T. M. & Lineweaver C. H. 2003. [Google Scholar]
  19. de Oliveira-Costa, A. et al., 2004, Phys. Rev. 0635; 69. [Google Scholar]
  20. Donnan C., T. et al. 2023. [Google Scholar]
  21. Feldman H., A. , Watkins R. & Hudson M. J. 2010. [Google Scholar]
  22. Gamow, G. 1946.
  23. Gödel, K. , 1949, Rev. Mod. Phys. 21.
  24. Gott III J., R. et al. 2005. [Google Scholar]
  25. Gurzadyan V., G. & Penrose R., 2013, Eur. Phys. J.
  26. Gurzadyan V., G. & Penrose R., 2016, Eur. Phys. J.
  27. Hawking, S. 1969.
  28. Hudson M., J. et al. 1999. [Google Scholar]
  29. Kashlinsky, A. et al. 2009. [Google Scholar]
  30. King J., A. et al. 2012. [Google Scholar]
  31. Kogut, A. et al. 1993. [Google Scholar]
  32. Kovács, A. et al. 2021. [Google Scholar]
  33. Labbé, I. et al. 2023. [Google Scholar]
  34. Land, K. & Magueijo J., 2005, Phys. Rev. Lett. 0713; 95. [Google Scholar]
  35. Lynden-Bell, D. et al. 1988. [Google Scholar]
  36. Mariano, A. & Perivolaropoulos L., 2012, Phys. Rev. 0835; 86. [Google Scholar]
  37. Migkas, K. et al. 2021. [Google Scholar]
  38. Penrose, R. a: 2010, Cycles of time, 2010.
  39. Perivolaropoulos, L. & Skara F., 2022, New Astron. Rev. 1016; 95. [Google Scholar]
  40. Perkins, D. , 2003, Particle Astrophysics. 2nd ed., Oxford Univ.
  41. Perlmutter, S. et al. 1999. [Google Scholar]
  42. Prakash, N. , 2013, Dark matter, neutrinos, and our solar system, World Sci.
  43. Riess A., G. et al. 1998. [Google Scholar]
  44. Riess A., G. et al. 2022. [Google Scholar]
  45. Turnbull S., J. et al. 2012. [Google Scholar]
  46. Witze, A. 2022.
Figure 1. A schematic diagram of a black hole. The circle (yellow) is the event horizon. The center (red) is a neutrino star. The vertical line (black) is the axis of spin. The horizontal row of clumps (blue) represents the falling spiral flows, going in on the left and coming out on the right. The slashed lines (dark red) are the emission beams, emitting along the magnetic axis from the neutrino star (red). The dashed curves (dark red) represent the back falling flows, either immediately surrounding the beams (dark red) or further into the spiral plane (blue).
Preprints 77437 g001
Figure 2. The Center of the universe. The lines in this figure are for guidance only. a, Hot (red, number) and cold (black, letter) spots are labelled in the CMB. The zone between the white dashed curves is a hot ring. Particularly, the long hot stretch, labelled by points: 1-2-3&4-5, is the most noticeable character in the CMB and often known as the Axis of Evil7. b, 3D globe of the SLS (green), on which half of the hot ring (dark red), 1-2-3&4-5-6-7-8-9, is visible. The plane of the hot ring and the line (blue) between the SC and NC (blue) intersect at the Center (red). If we look from the LS (green), the universe is spinning clockwise. The plane of the hot ring is the equatorial plane, and the LS is inside the Northern observable universe. c, The axis of spin is the line (black) between the N and S (black), perpendicular to the equator (dark red). On the Northern SLS, a low-temperature tail, NC-k-j-i-h, is following the cold spot NC. The regions immediately surrounding the Northern beam, 29-28-27-26-25-17-18-19-20, show higher temperatures. d, The Northern SLS, looking from the N (black). Higher temperatures are close to the edge of the Northern SLS, 33-34-13-14(15)-16, together with those surrounding the Northern Vb beam. The space below them is uniform. e, The Southern SLS, smaller than the Northern SLS. The regions immediately surrounding the Southern Vb beam, 35(11)-12(23)-32-31-30, show higher temperatures. The regions immediately close to the hot equator, u-s-r-t-v and a-b-c, have lower temperatures. The thin blue line from the SC shows the position of a tail if it exists.
Preprints 77437 g002
Figure 3. A schematic picture for the universe. Note that this figure is not to scale, in particular, the size and eccentricity of the universe are unknown. The universe was born from the Center (red dot) to be a sphere. As it expands, the universe has been veering towards the ellipsoidal (represented by a blue eclipse). If the isotropic expansion were excluded, the universe would be elongated (orange thick horizontal arrow) in the directions parallel to its equator ( W = 0 ° ) and contracted (orange thick vertical arrow) in the direction parallel to its axis of spin ( W = ± 90 ° ). For specific objects in the universe, in the direction parallel to the equatorial plane, they are flying away from the axis of spin (vr), and in the direction parallel to axis of spin, they are falling towards the equatorial plane (vs). The LS (green dot) is rotating about the axis of spin on the plane (dark red): z = 0.58 x + 0.03 y . The faster expansion shall be towards the furthest equatorial plane of the universe (blue direction), while the slower expansion shall be near the opposite direction (red direction). The observable universe is nearly ellipsoidal (represented by a green eclipse), within which are: the equatorial plane (red line), and the axis of spin (black line, between N and S).
Preprints 77437 g003
Figure 4. Regions of concentric LVC in the CMB: region X (closed by orange and blue lines: a-b-c-d-e-f-g, front), a higher-temperature LVC region concentrated around l ,   b = 280 ° , 30 ° with a cold corner (blue: c-d-e) around l ,   b = 296 ° , 41 ° ; region Z (closed by blue lines, top), a lower-temperature LVC region; and region W (closed by blue and orange lines, far end), a lower-temperature LVC region with a hot corner (orange) . All the coordinates are taken from fig. 2 of Gurzadyan and Penrose (2016). The labelled points (X, W and Z, red or blue) within each of the regions are taken from Bodnia et al. (2023). The equator is drawn into two halves: the hot half (dark red) and the cold half (blue). The angle of the line between Z and the Center (red) with the equatorial plane is ca. 59.8°. The Zone of Avoidance (not shown) is above line a-b (orange). The colors used to duplicate the LVC points: blue (low temperature)-green-light green-yellow-orange-red-purple (high temperature). The other symbols are the same as in Figure 2.
Preprints 77437 g004
Figure 5. Unit vectors of observational cosmic anisotropies: CMB dipole (red), galaxy cluster anisotropy (blue), bulk flows (grey), Great Attractor (green), SNe Ia dipole (yellow), dark energy dipole (orange), fine-structure constant dipole (violet). a, top view, along the axis of spin. b, side view, parallel to the equatorial plane. The line (dark red) going through the LS (green) is the rotational plane of the LS: z = 0.58 x + 0.03 y All vectors are plotted in length of the radius of SLS; the other symbols are the same as in Figure 2.
Preprints 77437 g005
Figure 6. Fate of the universe. Before our current universe (blue), there was a previous aeon (dark red), in which there was a precursor black hole (black eclipses) spinning clockwise. The collapse of its core, a neutrino star (black dot), generated the Big Bang of our universe (blue). Within our universe, there are many black holes (black eclipses). As they grow and merge (dashed lines), their masses of the survived black holes have been increasing. Once any one of them exceeds the mass limit of a neutrino star, a new Big Bang will occur to generate the next aeon (orange). The dot (green) in our universe (blue) represents when and where we are.
Preprints 77437 g006
Disclaimer/Publisher’s Note: The statements, opinions and data contained in all publications are solely those of the individual author(s) and contributor(s) and not of MDPI and/or the editor(s). MDPI and/or the editor(s) disclaim responsibility for any injury to people or property resulting from any ideas, methods, instructions or products referred to in the content.
Copyright: This open access article is published under a Creative Commons CC BY 4.0 license, which permit the free download, distribution, and reuse, provided that the author and preprint are cited in any reuse.
Prerpints.org logo

Preprints.org is a free preprint server supported by MDPI in Basel, Switzerland.

Subscribe

© 2024 MDPI (Basel, Switzerland) unless otherwise stated