Submitted:
23 June 2023
Posted:
25 June 2023
You are already at the latest version
Abstract
Keywords:
1. Introduction
2. Materials and Methods
2.1. Preparation of titanium discs and decontamination groups
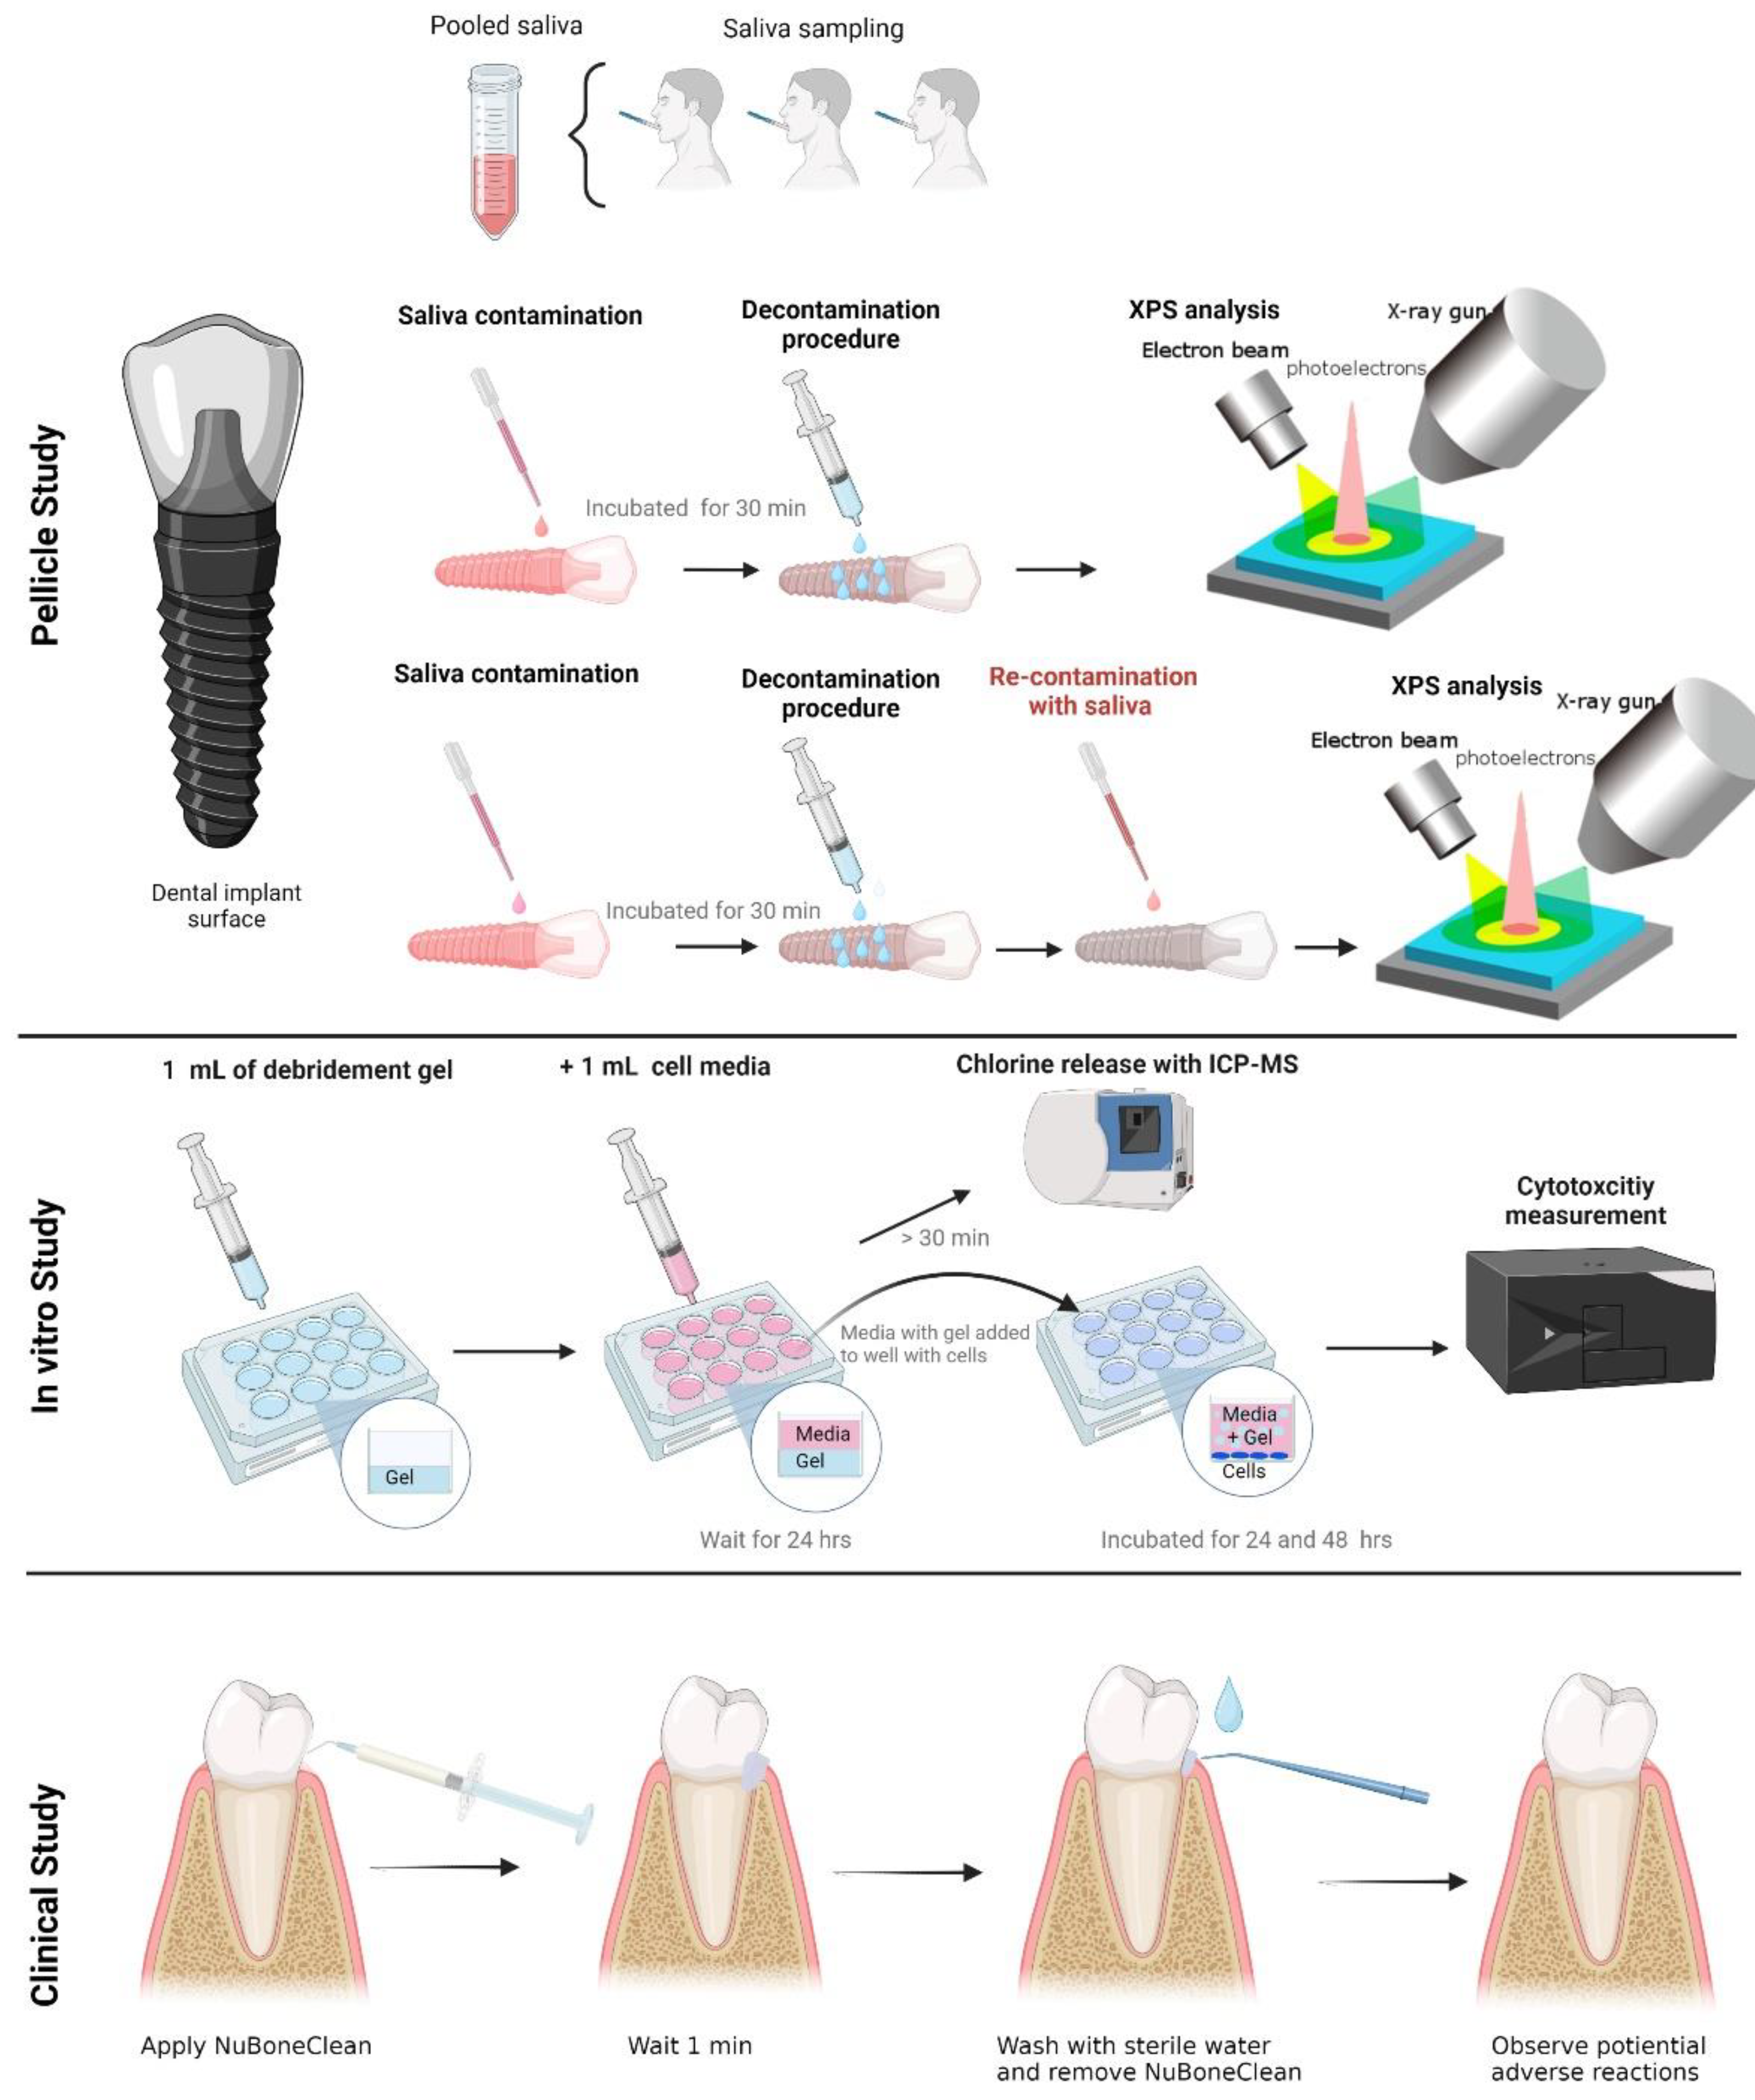
2.2. Dental pellicle model – Pellicle formation and decontamination
2.3. X-ray photoelectron spectroscopy (XPS) – analysis of chemical surface composition
2.4. Cell culture and cytotoxicity assay
2.5. Clinical safety assessment
- Good general health
- Between 18 and 65 years of age
- Healthy oral tissues.
- At least 10 remaining teeth and/or fixed implants.
- No active oral pathologies.
- Signed Informed Consent was obtained before the start.
- Psychological appropriateness.
- Consent to complete follow-up interview.
- Patients were excluded if they met any of the following conditions:
- Not optimal general health condition
- Abscess or infection anywhere in the body at the time of study entry.
- Current pregnancy or nursing.
- Patients were excluded if they met any of the following conditions:
- Not optimal general health condition
- Abscess or infection anywhere in the body at the time of study entry.
- Current pregnancy or nursing.
- Any condition or current treatment for any condition, which in the opinion of the investigator and/or consulting physician, may constitute an unwarranted risk.
- Presence of psychological characteristics such as inappropriate attitude or motivation which, in the opinion of the investigator, are incompatible with the risks involved with the cleaning procedure and the prosthesis.
- Unwillingness to undergo a post-procedure interview.
- If, in the medical opinion of the dental professional, conditions are such that dental cleaning is deemed unsuitable for the patient.
- Intake of Non-Steroidal Anti-Inflammatory Drugs (NSAID), pain-killers or antibiotics one week before and three days after the procedure.
2.6. Statistics
3. Results
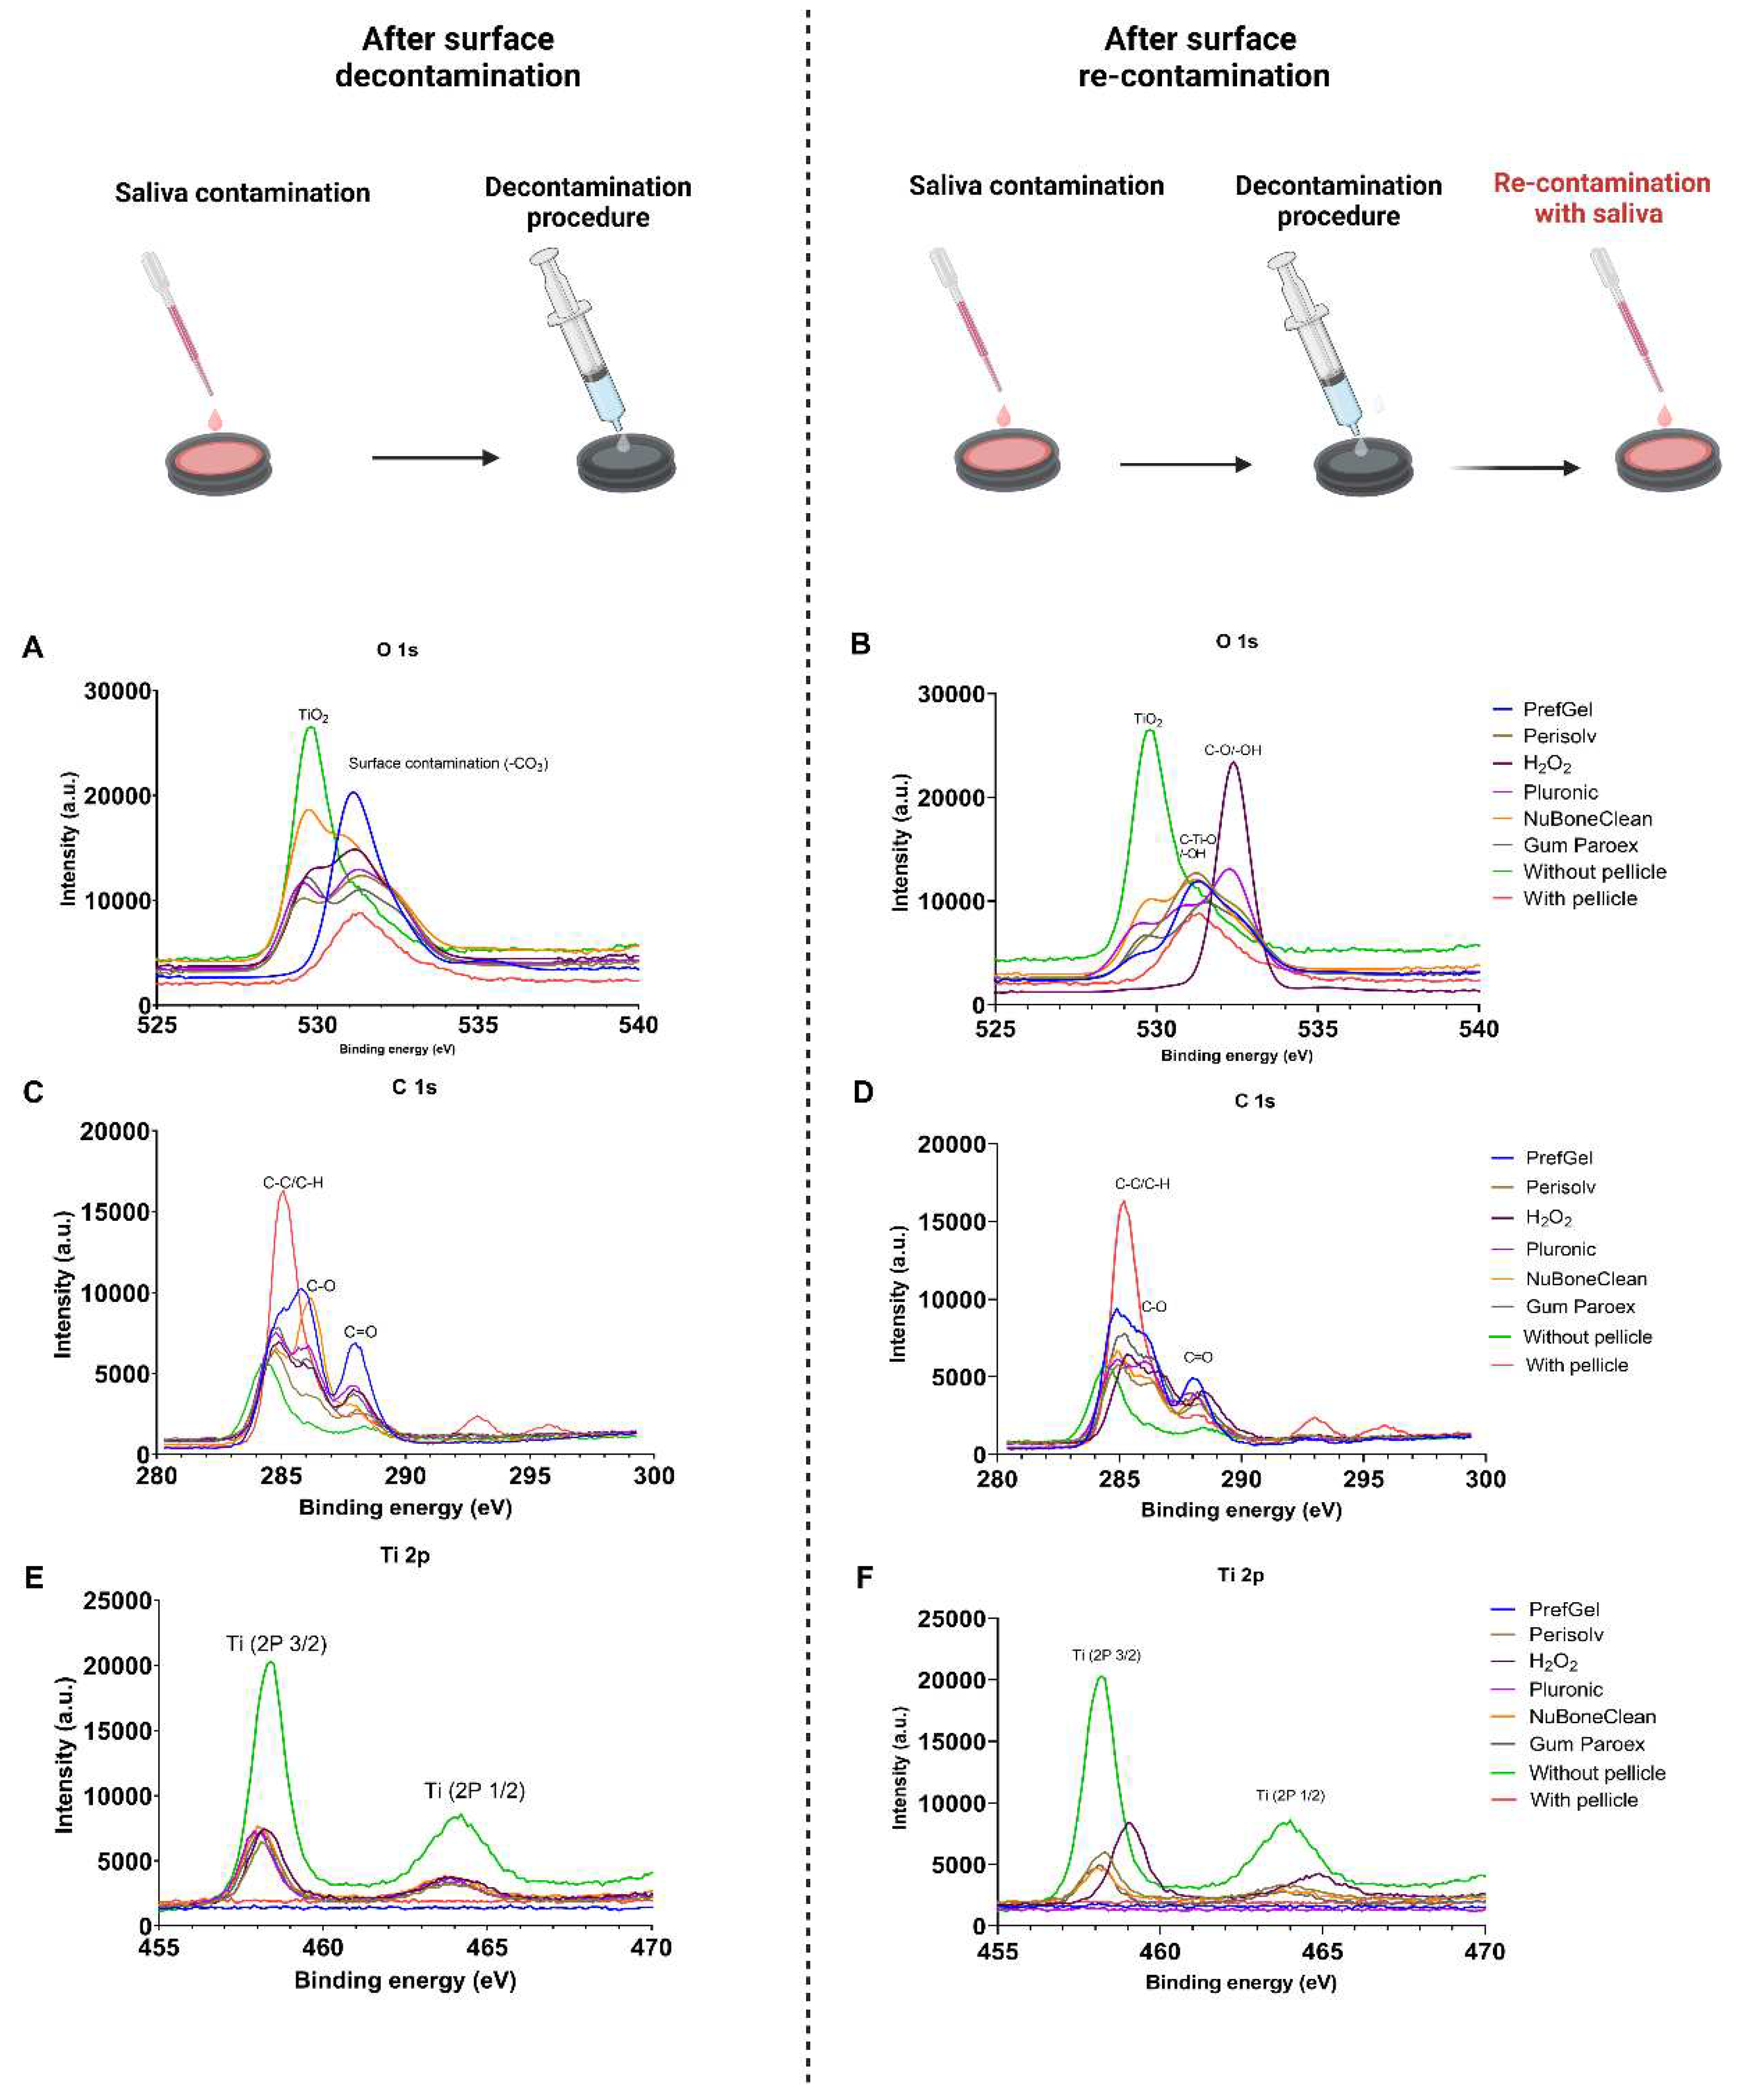
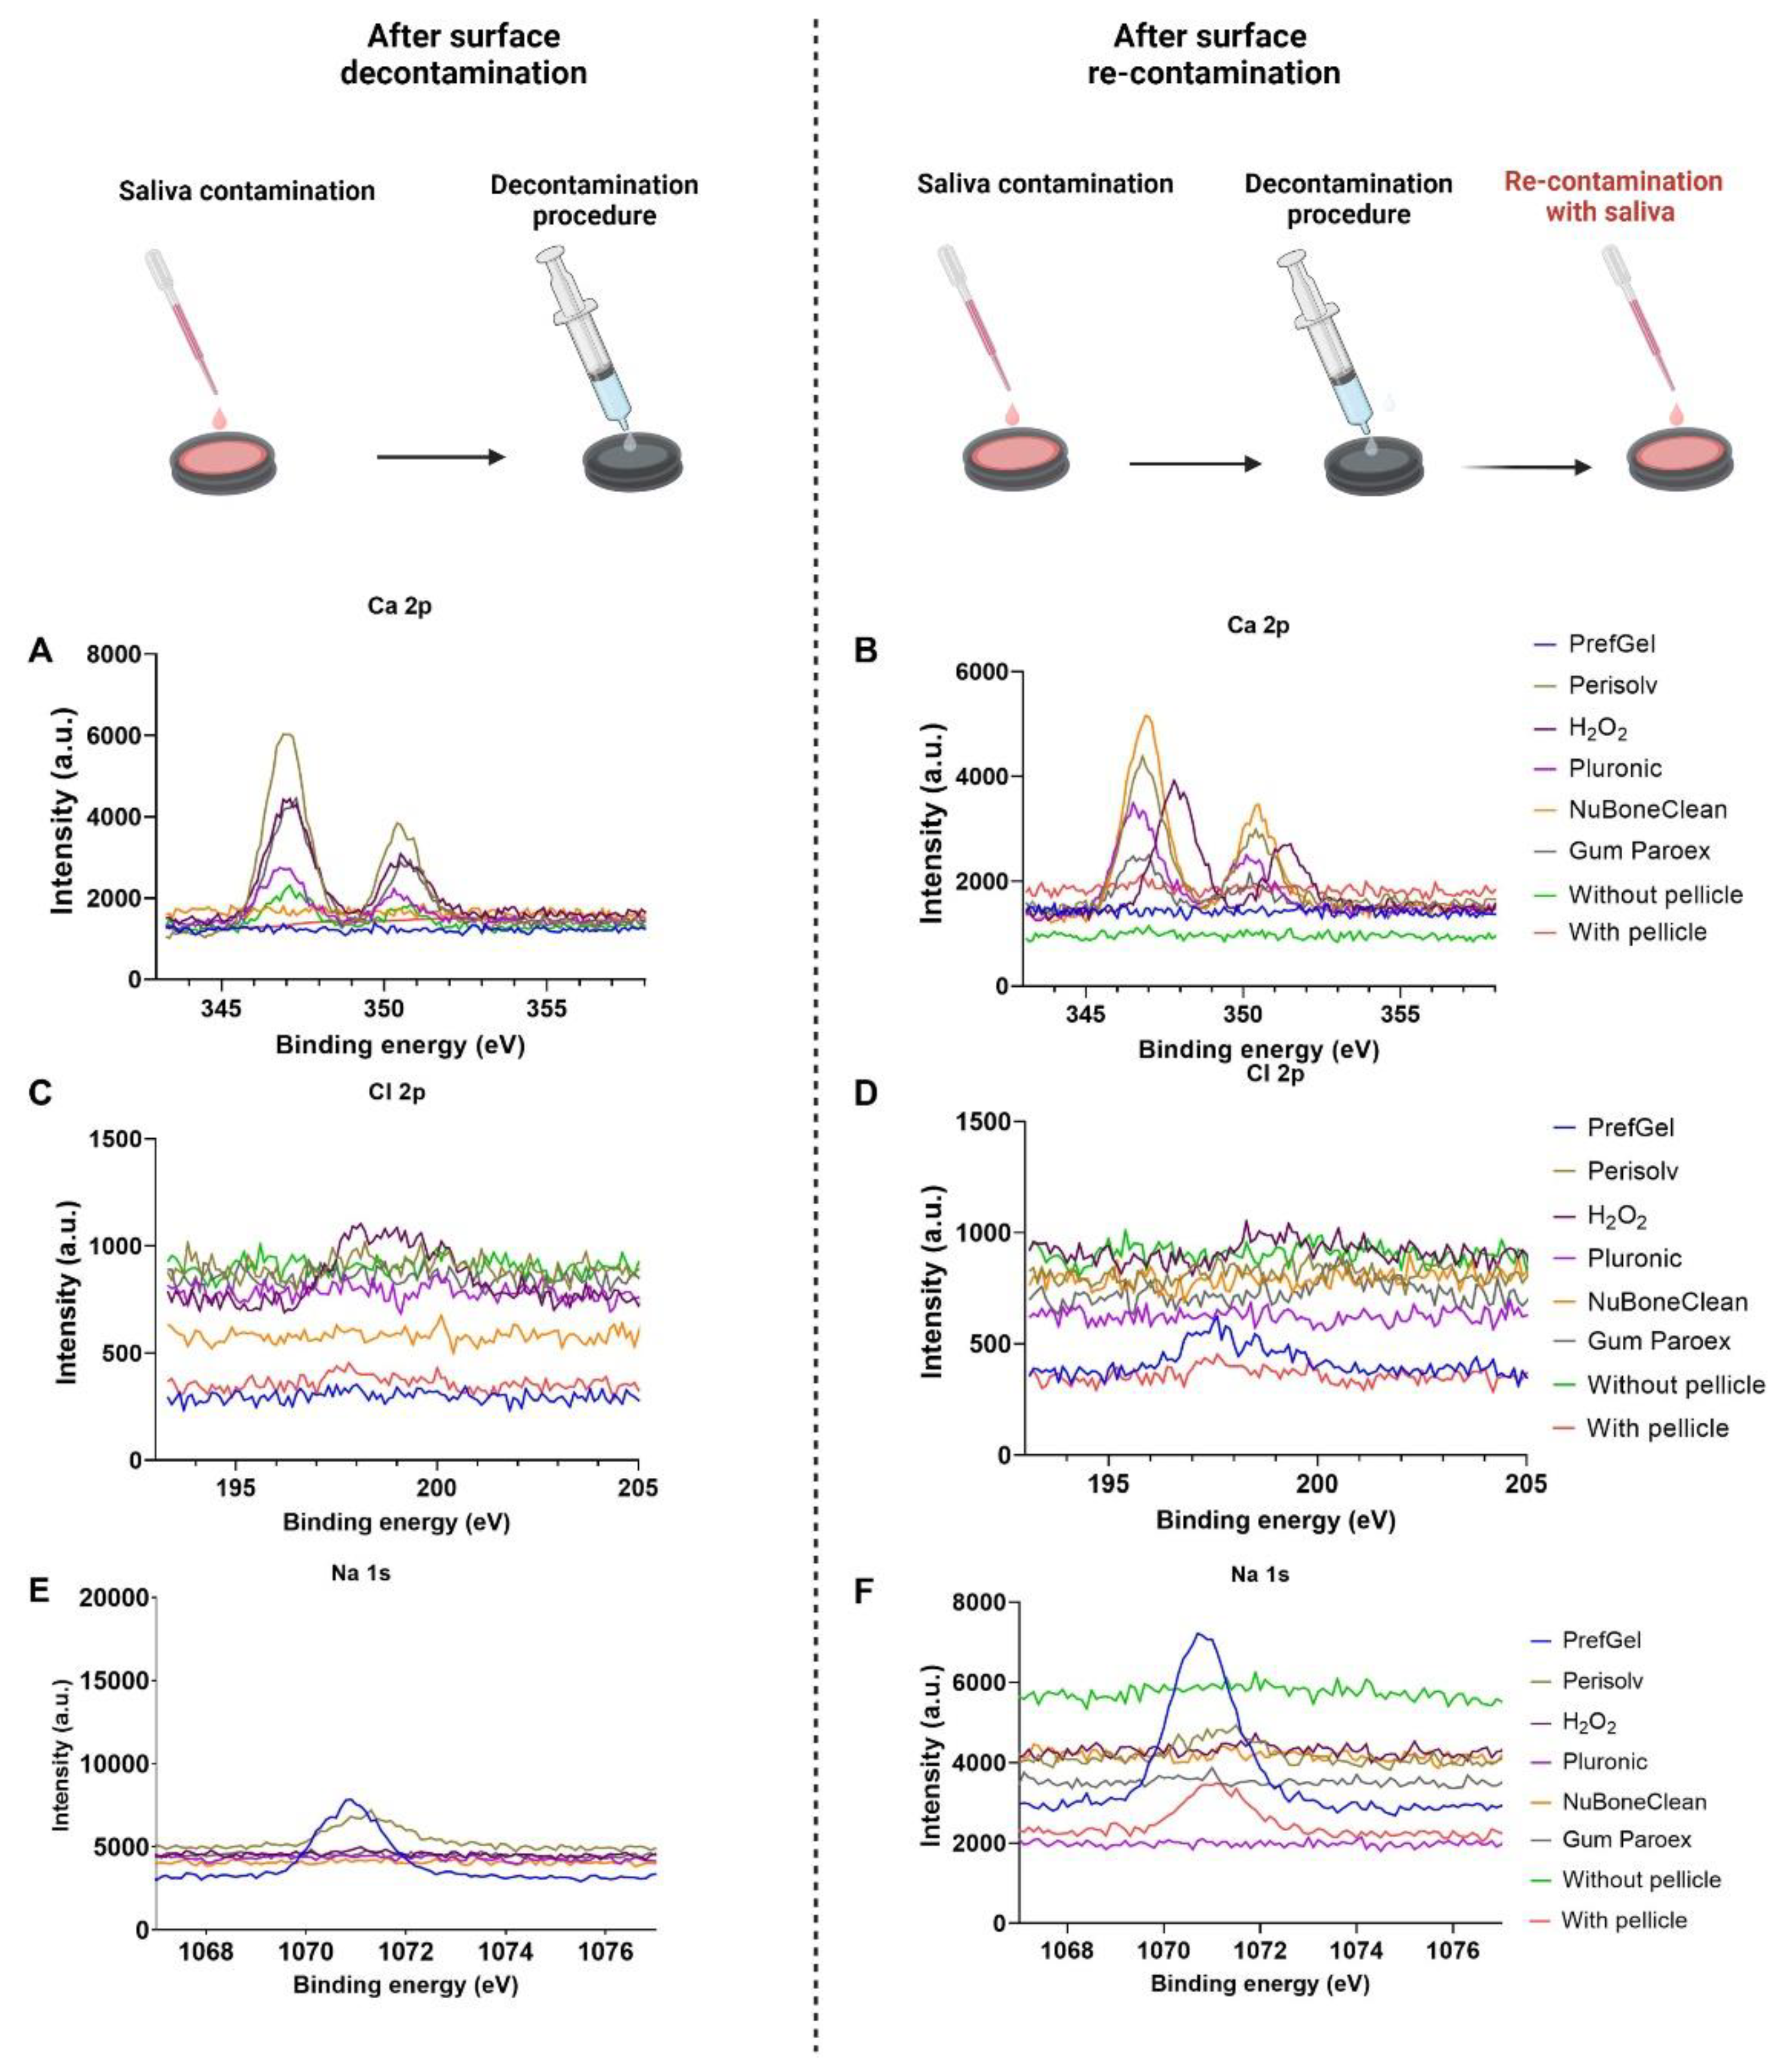
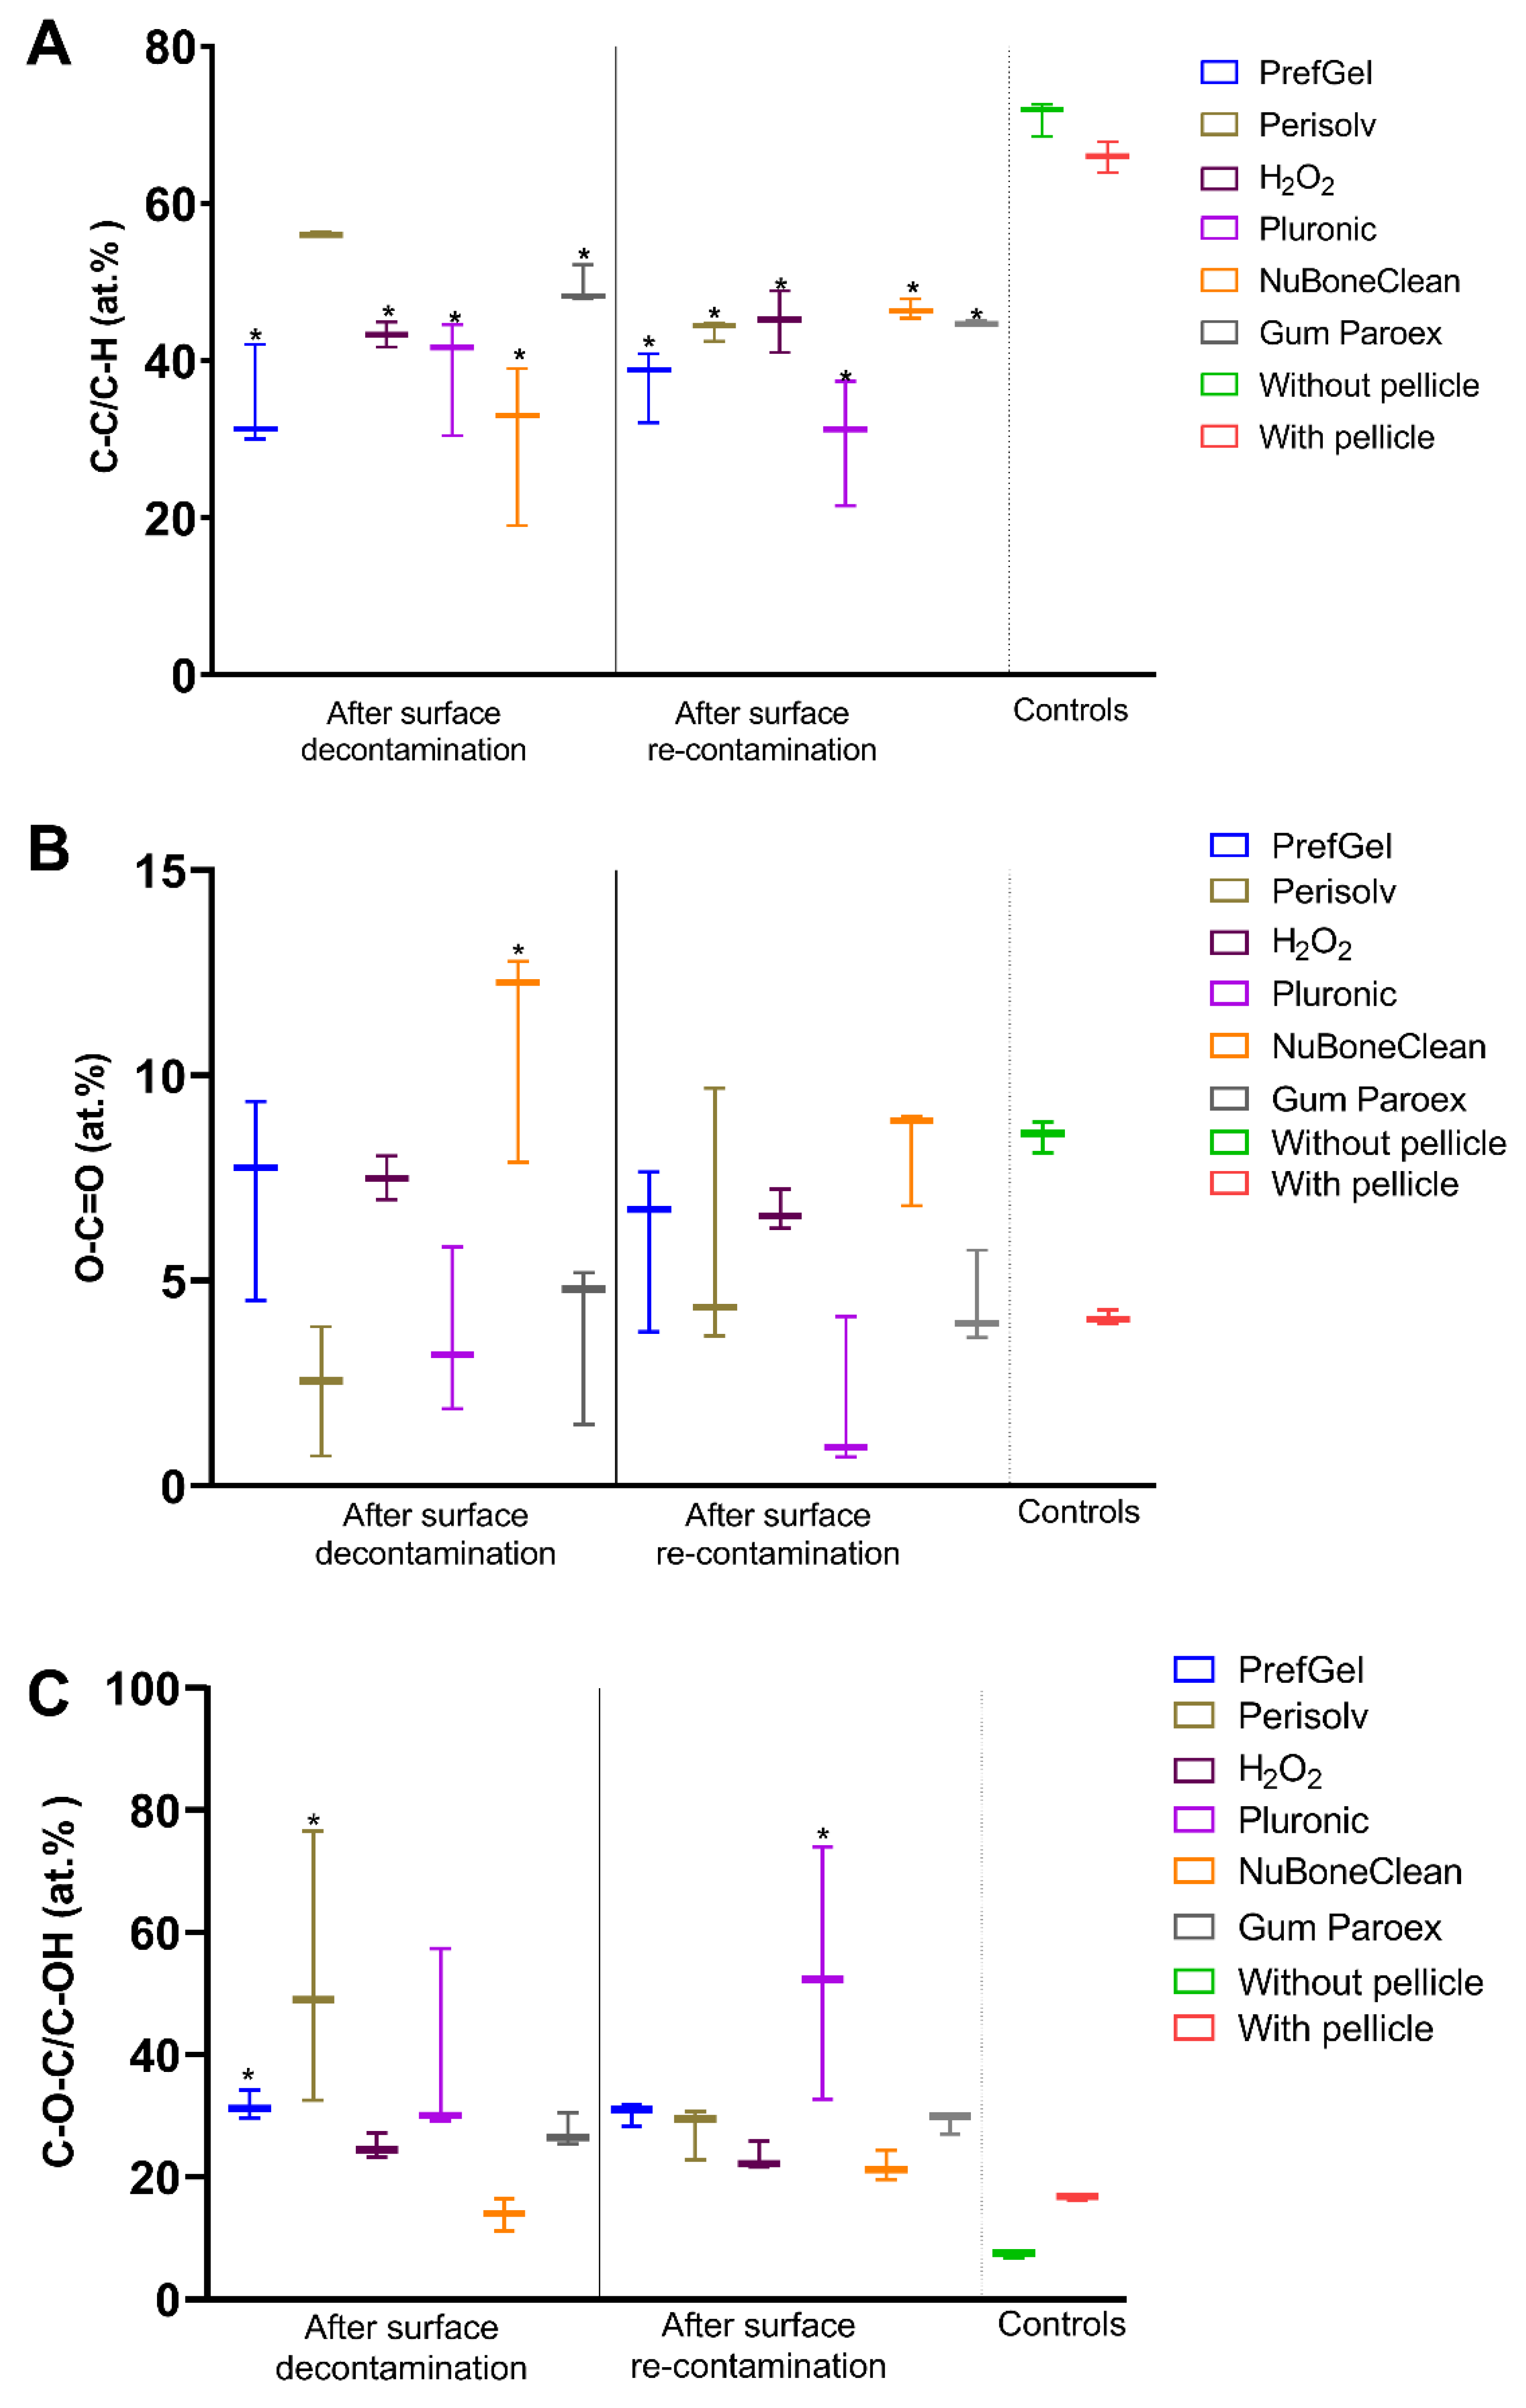
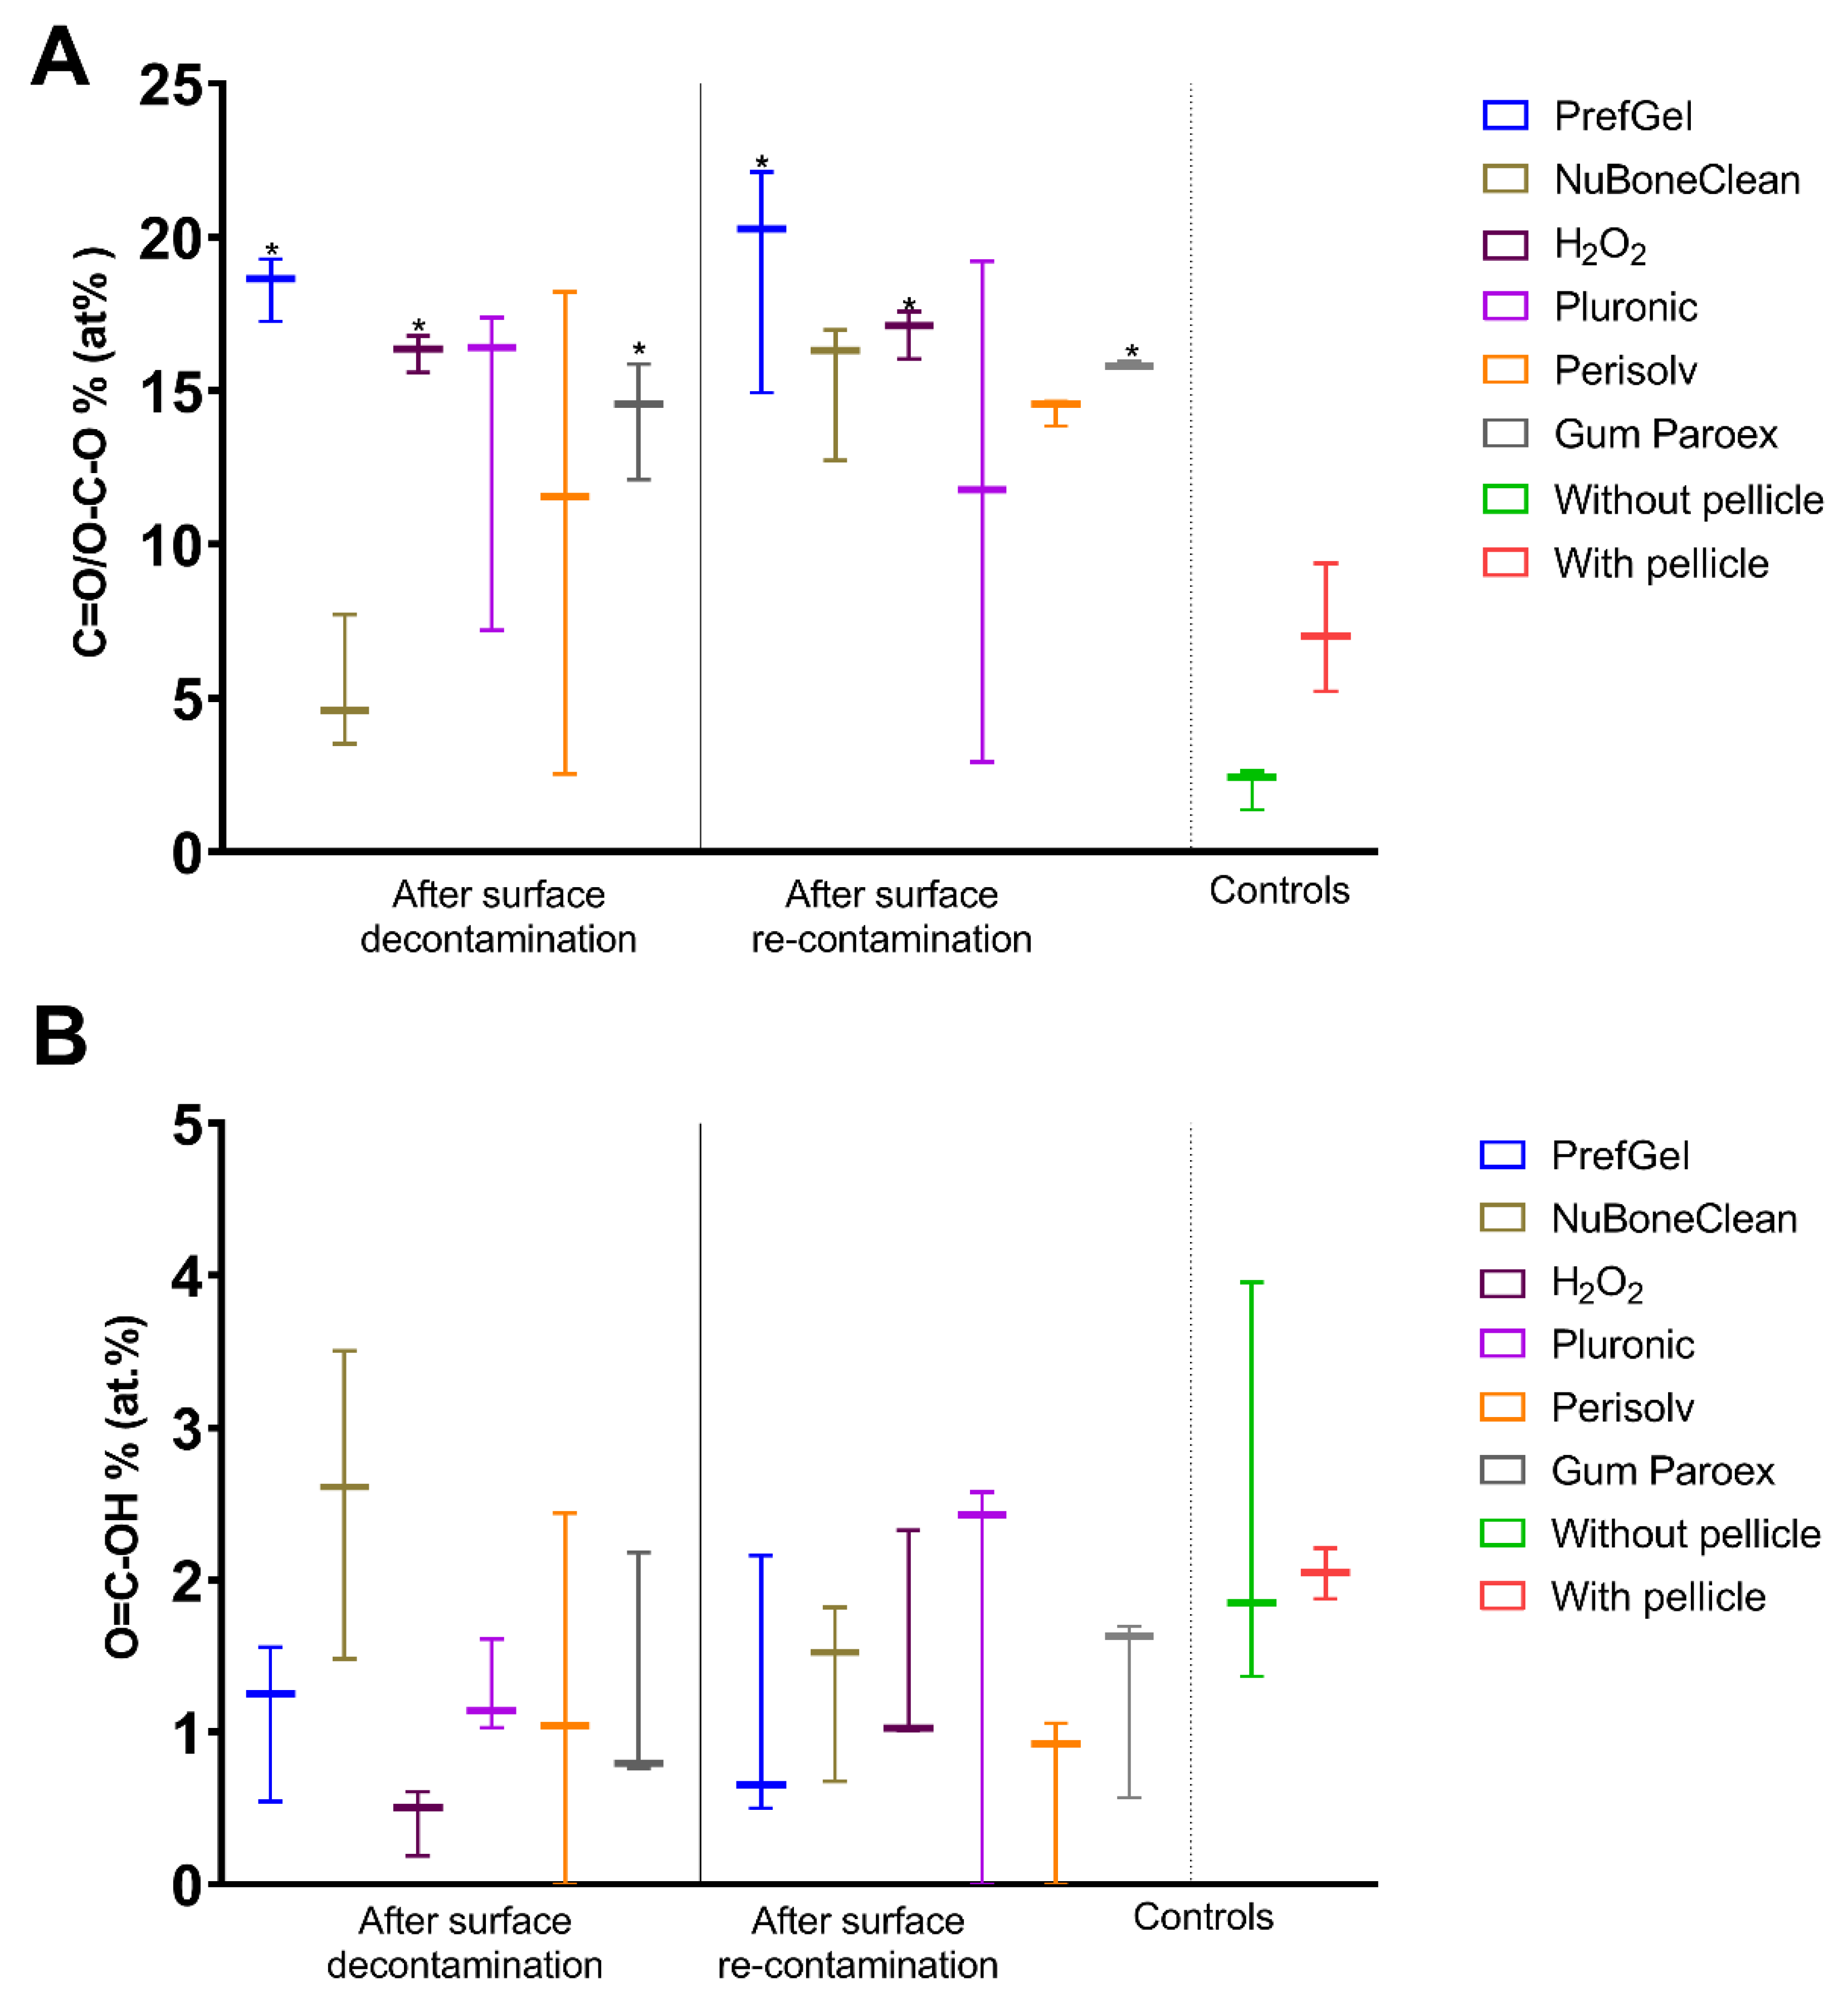
3.1. XPS
 |
||||||
|---|---|---|---|---|---|---|
| Elemental analysis after decontamination (atomic % ± standard deviation) | ||||||
| Element | PrefGel | Perisolv | H2O2 | Pluronic | NuBoneClean | GumPareox |
| C 1s % | 61.9±1.9 | 62.2±8.8 | 50.0±2.8* | 56.5±4.0* | 38.8±1.9* | 56.0±1.7* |
| N 1s % | 10.0±0.7 | 5.1±3.7 | 8.5±0.5 | 7.2±2.1 | 2.2±0.1* | 8.7±0.0 |
| O 1s % | 26.1±1.6* | 28.6±2.2* | 32.3±1.8 * | 30.0±1.0*,b | 43.4±1.0*b | 28.1±1.4* |
| Na 1s % | 0.9±1.3 | 0.0±0.0 | 0.0±0.0 | 0.0±0.0 | 0.0±0.0 | 0.0±0.0 |
| Si 2p % | 0.9±0.5 | 0.1±0.1, | 0.5±0.2 | 0.4±0.3 | 0.7±0.0 | 0.1±0.1 |
| P 2p % | 0.0±0.0 | 0.5±0.4 | 1.0±0.3 | 0.4±0.2 | 1.7±0.4 | 0.5±0.1 |
| S 2p % | 0.0±0.0 | 0.0±0.0 | 0.2±0.1 | 0.1±0.0 | 0.0±0.0 | 0.1±0.1 |
| Cl 2p % | 0.0±0.0 | 0.6±0.0 | 0.4±0.3 | 0.0±0.0 | 0.0±0.0 | 0.1±0.0 |
| K 2p % | 0.0±0.0 | 0.0±0.0 | 0.1±0.1 | 0.0±0.0 | 0.0±0.0 | 0.0±0.0 |
| Ca 2p % | 0.0±0.0 | 1.2±0.9 | 2.6±0.5* | 1.2±0.1 | 4.6±0.7* | 1.0±0.1 |
| Ti 2p % | 0.0±0.1 | 2.3±1.8 | 4.6±1.4* | 4.1±1.4* | 7.9±2.2* | 5.3±0.6* |
 | ||||||
|---|---|---|---|---|---|---|
| Elemental analysis after both decontamination and re-contaminations with saliva (atomic % ± standard deviation) | ||||||
| Element | PrefGel | Perisolv | H2O2 | Pluronic | NuBoneClean | GumPareox |
| C 1s % | 63.4±2.2 | 49.7±4.5* | 47.6±3.3* | 60.8±9.2 | 48.2±2.2* | 57.7±2.1* |
| N 1s % | 10.8±0.4 | 7.4±1.1 | 8.6±1.3 | 4.9±3.7 | 8.4±0.5 | 10.2±0.2 |
| O 1s % | 24.6±1.4* | 33.6±3.7* | 33.4±2.3* | 29.7±3.1* | 33.7±1.9* | 26.4±1.2* |
| Na 1s % | 0.0±0.0 | 0.0±0.0 | 0.0±0.0 | 0.0±0.0 | 0.0±0.0 | 0.0±0.0 |
| Si 2p % | 0.1±0.2 | 0.4±0.2 | 0.2±0.2 | 0.2±0.2 | 0.1±0.2 | 0.0±0.0 |
| P 2p % | 0.1±0.1 | 1.3±0.2* | 1.6±0.7 | 0.6±0.4 | 1.7±0.4 | 0.7±0.2 |
| S 2p % | 0.0±0.0 | 0.0±0.0 | 0.2±0.1 | 0.0±0.0 | 0.1±0.1 | 0.1±0.1 |
| Cl 2p % | 0.2±0.1 | 0.3±0.3 | 0.4±0.2 | 0.0±0.0 | 0.0±0.0 | 0.1±0.0 |
| K 2p % | 0.1±0.1 | 0.4±±0.2 | 0.6±0.6 | 0.0±0.0 | 0.0±0.0 | 0.0±0.0 |
| Ca 2p % | 0.1±0.1 | 3.0±0.4* | 2.8±0.9* | 1.2±0.6 | 3.6±0.9* | 1.7±0.4 |
| Ti 2p % | 0.5±0.6 | 3.8±2.0* | 4.7±0.3* | 2.5±1.3 | 4.1±1.4* | 3.0±0.7 |
| Controls (at % ± SD) | ||
|---|---|---|
| Element | Without Pellicle | With Pellicle |
| C 1s % | 32.1±0.5 | 73.4±3.3 |
| N 1s % | 0.9±0.1 | 6.1±0.8 |
| O 1s % | 47.6±0.5 | 17.1±1.8 |
| Na 1s % | 0.0±0.0 | 0.0±0.0 |
| Si 2p % | 0.2±0.2 | 0.0±0.0 |
| P 2p % | 0.2±0.2 | 0.4±0.1 |
| S 2p % | 0.0±0.0 | 0.4±0.1 |
| Cl 2p % | 0.1±0.2 | 0.1±0.0 |
| K 2p % | 0.0±0.1 | 2.2±0.6 |
| Ca 2p % | 0.0±0.1 | 0.1±0.1 |
| Ti 2p % | 18.7±0.3 | 0.0±0.0 |
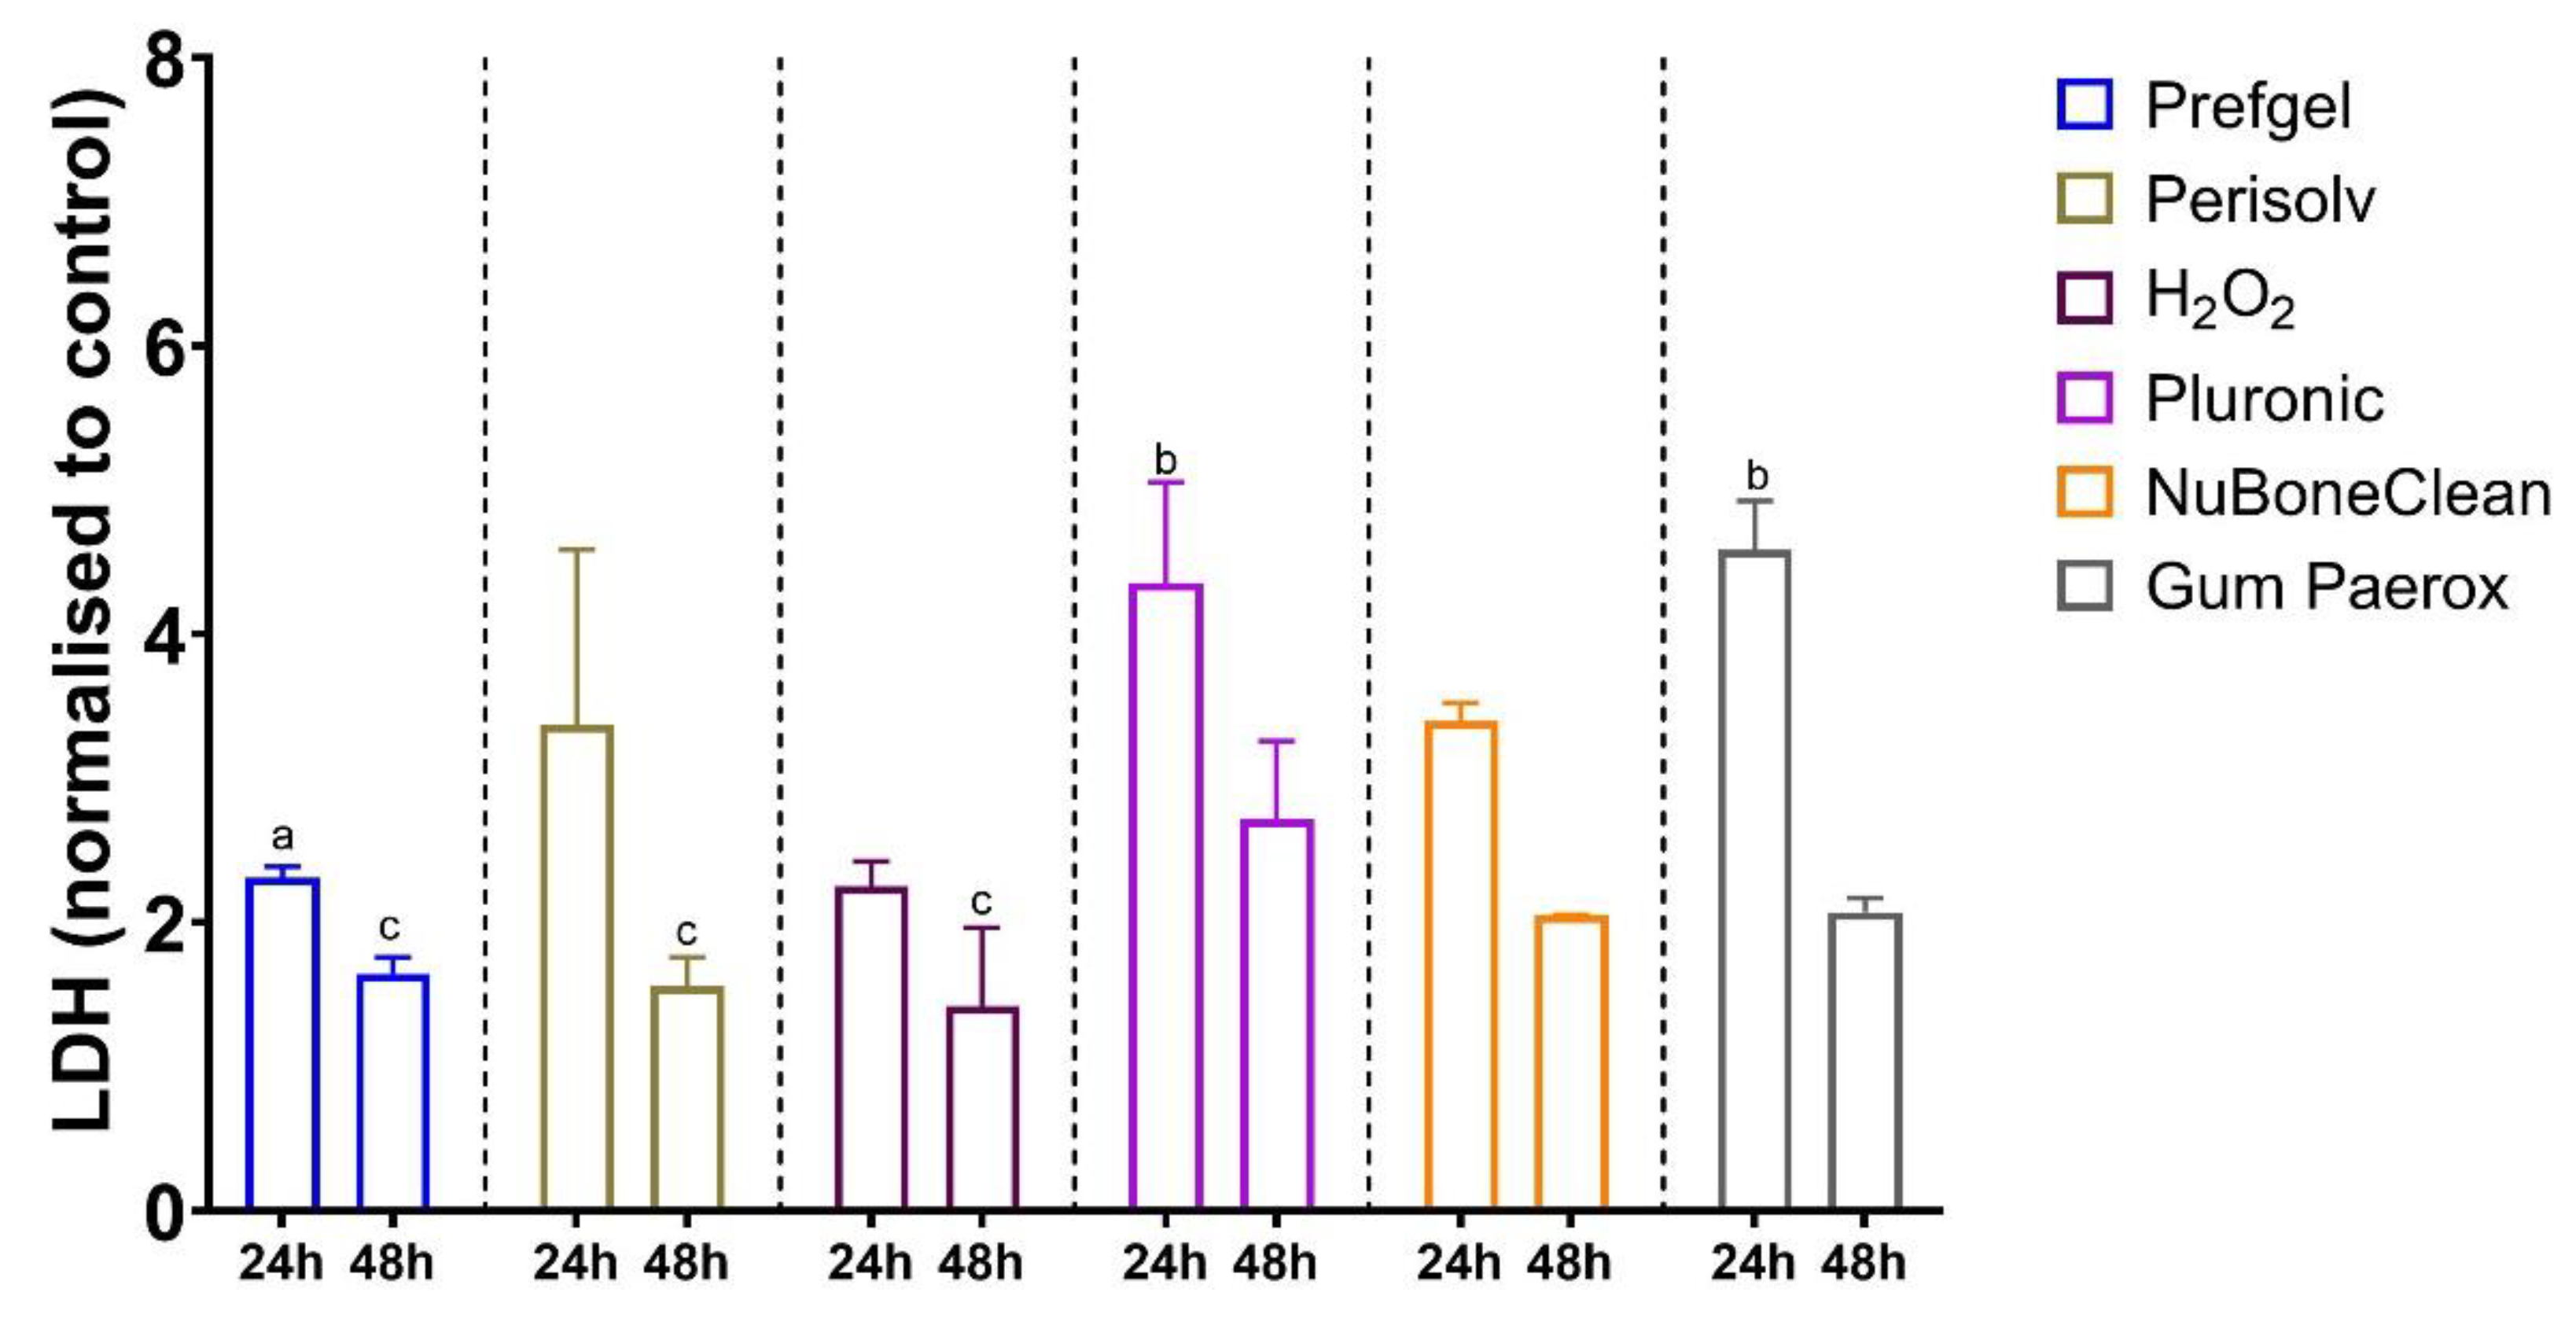
3.2. Cytotoxicity
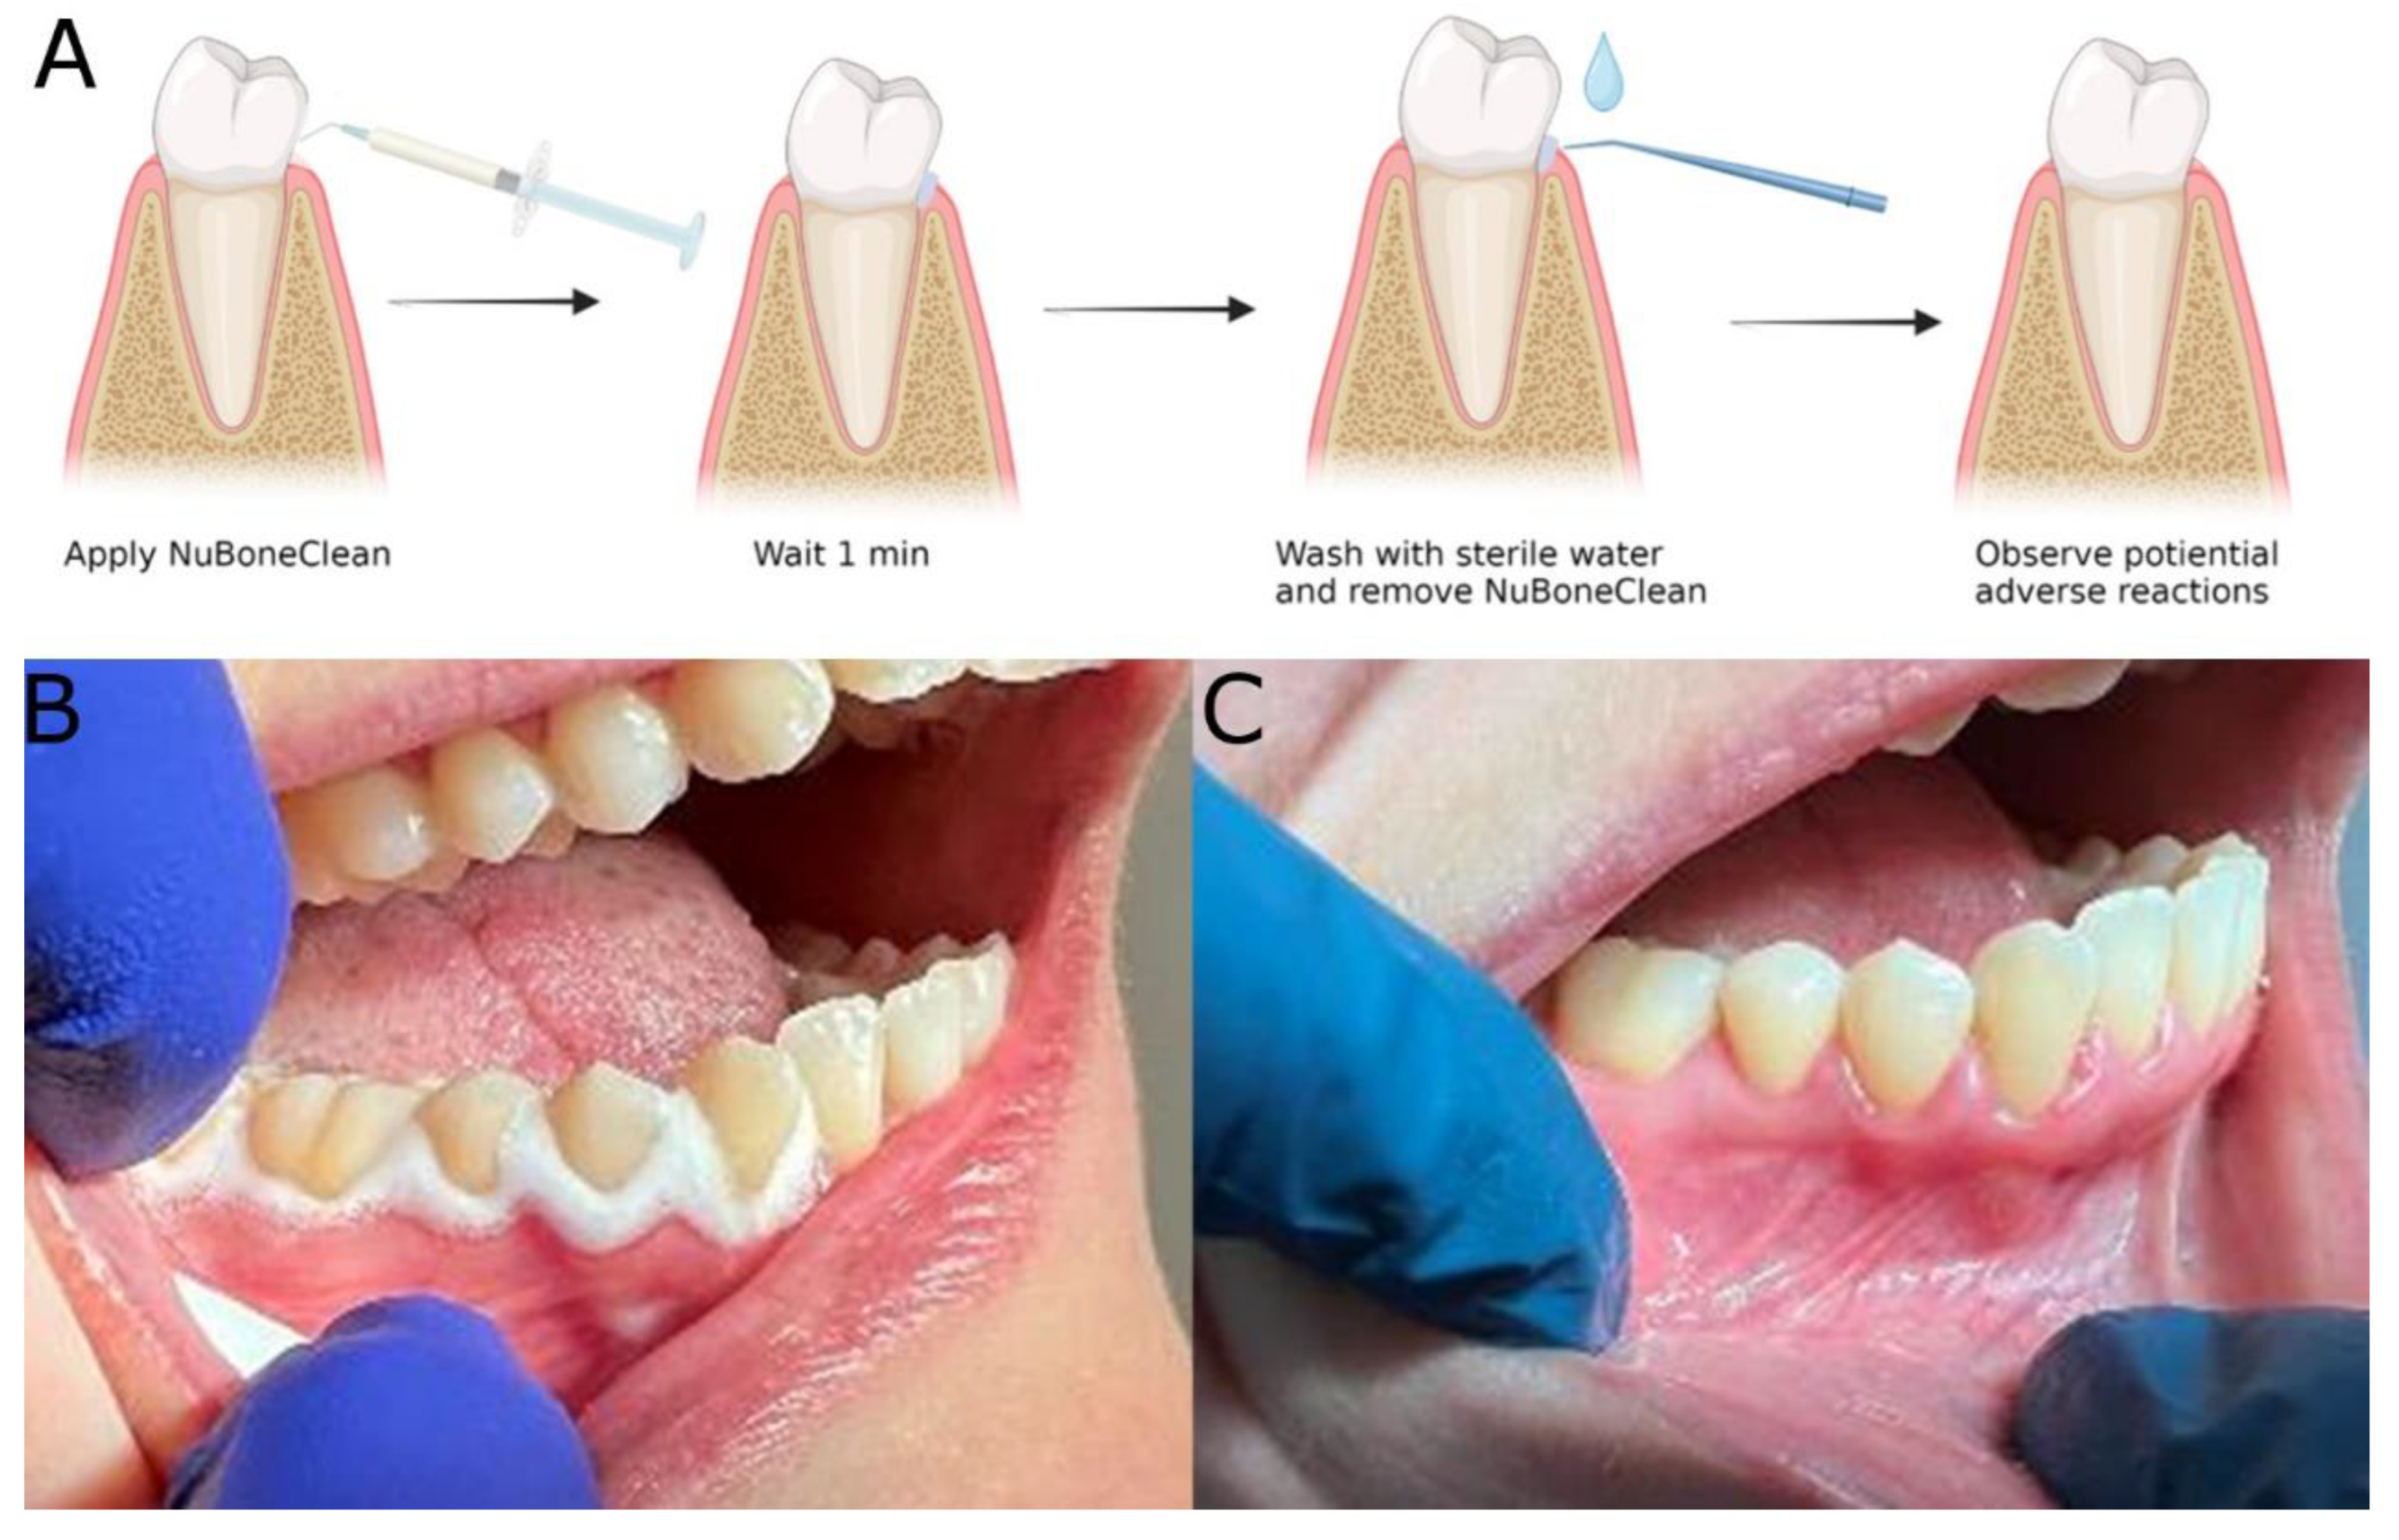
3.3. Clinical safety assessment
4. Discussion
5. Conclusions
Author Contributions
Funding
Data Availability Statement
Acknowledgments
Conflicts of Interest
References
- Campoccia, D.; Montanaro, L.; Arciola, C.R. The significance of infection related to orthopedic devices and issues of antibiotic resistance. Biomaterials 2006, 27, 2331–2339. [Google Scholar] [CrossRef] [PubMed]
- Grundy, E.M.; Murphy, M. Population ageing in Europe. Oxford textbook of geriatric medicine 2017, 11. [Google Scholar]
- Owens, C.D.; Stoessel, K. Surgical site infections: Epidemiology, microbiology and prevention. J Hosp Infect 2008, 70 Suppl 2, 3–10. [Google Scholar] [CrossRef]
- Donlan, R.M. Biofilms and device-associated infections. Emerg Infect Dis 2001, 7, 277–281. [Google Scholar] [CrossRef] [PubMed]
- Stewart, P.S.; Costerton, J.W. Antibiotic resistance of bacteria in biofilms. The lancet 2001, 358, 135–138. [Google Scholar] [CrossRef] [PubMed]
- Stevens, P.M.; Klatt, J.B. Guided growth for pathological physes: Radiographic improvement during realignment. J Pediatr Orthop 2008, 28, 632–639. [Google Scholar] [CrossRef]
- Prathapachandran, J.; Suresh, N. Management of peri-implantitis. Dental research journal 2012, 9, 516. [Google Scholar] [CrossRef]
- Lee, C.-T.; Huang, Y.-W.; Zhu, L.; Weltman, R. Prevalences of peri-implantitis and peri-implant mucositis: Systematic review and meta-analysis. J. Dent. 2017, 62, 1–12. [Google Scholar] [CrossRef]
- Berglundh, T.; Armitage, G.; Araujo, M.G.; Avila-Ortiz, G.; Blanco, J.; Camargo, P.M.; Chen, S.; Cochran, D.; Derks, J.; Figuero, E.; et al. Peri-implant diseases and conditions: Consensus report of workgroup 4 of the 2017 World Workshop on the Classification of Periodontal and Peri-Implant Diseases and Conditions. J Periodontol 2018, 89 Suppl 1, S313–S318. [Google Scholar] [CrossRef]
- Chawhuaveang, D.D.; Yu, O.Y.; Yin, I.X.; Lam, W.Y.; Mei, M.L.; Chu, C.H. Acquired salivary pellicle and oral diseases: A literature review. J Dent Sci 2021, 16, 523–529. [Google Scholar] [CrossRef]
- Länge, K.; Herold, M.; Scheideler, L.; Geis-Gerstorfer, J.; Wendel, H.P.; Gauglitz, G. Investigation of initial pellicle formation on modified titanium dioxide (TiO2) surfaces by reflectometric interference spectroscopy (RIfS) in a model system. Dent Mater 2004, 20, 814–822. [Google Scholar] [CrossRef] [PubMed]
- Sterzenbach, T.; Helbig, R.; Hannig, C.; Hannig, M. Bioadhesion in the oral cavity and approaches for biofilm management by surface modifications. Clinical oral investigations 2020, 24, 4237–4260. [Google Scholar] [CrossRef] [PubMed]
- Hussain, B.; Haugen, H.J.; Aass, A.M.; Sanz, M.; Antonoglou, G.N.; Bouchard, P.; Bozic, D.; Eickholz, P.; Jepsen, K.; Jepsen, S. Peri-Implant Health and the Knowing-Doing Gap—A Digital Survey on Procedures and Therapies. Frontiers in Dental Medicine 2021, 2, 726607. [Google Scholar] [CrossRef]
- Buser, D.; Sennerby, L.; De Bruyn, H. Modern implant dentistry based on osseointegration: 50 years of progress, current trends and open questions. Periodontol 2000 2017, 73, 7–21. [Google Scholar] [CrossRef]
- Lamolle, S.F.; Monjo, M.; Rubert, M.; Haugen, H.J.; Lyngstadaas, S.P.; Ellingsen, J.E. The effect of hydrofluoric acid treatment of titanium surface on nanostructural and chemical changes and the growth of MC3T3-E1 cells. Biomaterials 2009, 30, 736–742. [Google Scholar] [CrossRef]
- Zhu, X.; Wen, G.; Liu, H.; Han, S.; Chen, S.; Kong, Q.; Feng, W. One-step hydrothermal synthesis and characterization of Cu-doped TiO 2 nanoparticles/nanobucks/nanorods with enhanced photocatalytic performance under simulated solar light. Journal of Materials Science: Materials in Electronics 2019, 30, 13826–13834. [Google Scholar] [CrossRef]
- Zhao, Z.; Zhou, Y.; Wan, W.; Wang, F.; Zhang, Q.; Lin, Y. Nanoporous TiO2/polyaniline composite films with enhanced photoelectrochemical properties. Materials Letters 2014, 130, 150–153. [Google Scholar] [CrossRef]
- Caracciolo, L.; Madec, L.; Martinez, H. XPS analysis of K-based reference compounds to allow reliable studies of solid electrolyte interphase in K-ion batteries. ACS Applied Energy Materials 2021, 4, 11693–11699. [Google Scholar] [CrossRef]
- Valencia-Alvarado, R.; De La Piedad-Beneitez, A.; López-Callejas, R.; Rodríguez-Méndez, B.; Mercado-Cabrera, A.; Peña-Eguiluz, R.; Muñoz-Castro, A.; De La Rosa-Vázquez, J. Sequential processes to produce N-TiO2 films through Rf plasmas. In Proceedings of the MATEC Web of Conferences; 2016; p. 06075. [Google Scholar] [CrossRef]
- Natu, V.; Benchakar, M.; Canaff, C.; Habrioux, A.; Celerier, S.; Barsoum, M.W. A critical analysis of the X-ray photoelectron spectra of Ti3C2Tz MXenes. Matter 2021, 4, 1224–1251. [Google Scholar] [CrossRef]
- Popov, A.A.; Tikhonowski, G.V.; Shakhov, P.V.; Popova-Kuznetsova, E.A.; Tselikov, G.I.; Romanov, R.I.; Markeev, A.M.; Klimentov, S.M.; Kabashin, A.V. Synthesis of titanium nitride nanoparticles by pulsed laser ablation in different aqueous and organic solutions. Nanomaterials 2022, 12, 1672. [Google Scholar] [CrossRef] [PubMed]
- Peña-Juárez, M.G.; Robles-Martínez, M.; Méndez-Rodríguez, K.B.; López-Esparza, R.; Pérez, E.; Gonzalez-Calderon, J.A. Role of the chemical modification of titanium dioxide surface on the interaction with silver nanoparticles and the capability to enhance antimicrobial properties of poly(lactic acid) composites. Polymer Bulletin 2021, 78, 2765–2790. [Google Scholar] [CrossRef]
- Vitanov, P.; Stefanov, P.; Harizanova, A.; Ivanova, T. XPS characterization of thin (Al2O3) x (TiO2) 1-x films deposited on silicon. In Proceedings of the Journal of Physics: Conference Series; 2008; p. 012036. [Google Scholar] [CrossRef]
- Buser, D.; Janner, S.F.; Wittneben, J.G.; Brägger, U.; Ramseier, C.A.; Salvi, G.E. 10-year survival and success rates of 511 titanium implants with a sandblasted and acid-etched surface: A retrospective study in 303 partially edentulous patients. Clinical implant dentistry and related research 2012, 14, 839–851. [Google Scholar] [CrossRef] [PubMed]
- Simão Jr, B.S.; Costa, D.D.; Cangussu, M.C.T.; Sotto-Maior, B.S.; Devita, R.L.; de Carvalho, J.J.; da Silva Brum, I. Observational Study on the Success Rate of Osseointegration: A Prospective Analysis of 15,483 Implants in a Public Health Setting. BioMed 2022, 2, 422–430. [Google Scholar] [CrossRef]
- Derks, J.; Schaller, D.; Hakansson, J.; Wennstrom, J.L.; Tomasi, C.; Berglundh, T. Peri-implantitis - onset and pattern of progression. J Clin Periodontol 2016, 43, 383–388. [Google Scholar] [CrossRef] [PubMed]
- Guo, T.; Gulati, K.; Arora, H.; Han, P.; Fournier, B.; Ivanovski, S. Race to invade: Understanding soft tissue integration at the transmucosal region of titanium dental implants. Dent Mater 2021, 37, 816–831. [Google Scholar] [CrossRef]
- Campbell, M.K.; Farrell, S.O.; McDougal, O.M. Amino Acids and Peptides. In Biochemistry, 9th ed.; Cengage Learning: Boston, USA, 2016; pp. 60–74. [Google Scholar]
- Habibovic, P.; Barralet, J. Bioinorganics and biomaterials: Bone repair. Acta biomaterialia 2011, 7, 3013–3026. [Google Scholar] [CrossRef]
- Anitua, E.; Piñas, L.; Murias, A.; Prado, R.; Tejero, R. Effects of calcium ions on titanium surfaces for bone regeneration. Colloids and Surfaces B: Biointerfaces 2015, 130, 173–181. [Google Scholar] [CrossRef]
- Kant, V.; Gopal, A.; Kumar, D.; Gopalkrishnan, A.; Pathak, N.N.; Kurade, N.P.; Tandan, S.K.; Kumar, D. Topical pluronic F-127 gel application enhances cutaneous wound healing in rats. Acta Histochem 2014, 116, 5–13. [Google Scholar] [CrossRef]
- Percival, S.L.; Chen, R.; Mayer, D.; Salisbury, A.M. Mode of action of poloxamer-based surfactants in wound care and efficacy on biofilms. Int. Wound J. 2018, 15, 749–755. [Google Scholar] [CrossRef]
- Narendrakumar, K.; Kulkarni, M.; Addison, O.; Mazare, A.; Junkar, I.; Schmuki, P.; Sammons, R.; Iglič, A. Adherence of oral streptococci to nanostructured titanium surfaces. Dent Mater 2015, 31, 1460–1468. [Google Scholar] [CrossRef]
- Neoh, K.G.; Wang, R.; Kang, E.T. 7 - Surface nanoengineering for combating biomaterials infections. In Biomaterials and Medical Device - Associated Infections, Barnes, L., Cooper, I.R., Eds.; Woodhead Publishing: Oxford, 2015; pp. 133–161. [Google Scholar] [CrossRef]
- Astolfi, V.; Ríos-Carrasco, B.; Gil-Mur, F.J.; Ríos-Santos, J.V.; Bullón, B.; Herrero-Climent, M.; Bullón, P. Incidence of Peri-Implantitis and Relationship with Different Conditions: A Retrospective Study. Int J Environ Res Public Health 2022, 19. [Google Scholar] [CrossRef] [PubMed]
| Product name | Content | In clinical dental use |
|---|---|---|
| PrefGel® | 24% EDTA + hydrogel | Yes |
| Perisolv® | Sodium hypochlorite + a hydrogel | Yes |
| Hydrogenperoxide | 3% H2O2 in water | Yes |
| Pluronic® F-127 | 28 % Poloxamer in water | No |
| NuBone® Clean | 3% H2O2 + a hydrogel (poloxamer) | No |
| GUM® Paroex® | 0.12 % Chlorhexidine digluconate + 0.05 % Cetylpyridinium chloride | Yes |
| Patient | Patient satisfaction Score |
|---|---|
| 1 | 10 |
| 2 | 10 |
| 3 | 10 |
| 4 | 10 |
| 5 | 10 |
| 6 | 10 |
| 7 | 10 |
| 8 | 10 |
| 9 | 10 |
| 10 | 5 |
| 11 | 10 |
| 12 | 10 |
| Mean | 9.6 |
| Median | 10.0 |
Disclaimer/Publisher’s Note: The statements, opinions and data contained in all publications are solely those of the individual author(s) and contributor(s) and not of MDPI and/or the editor(s). MDPI and/or the editor(s) disclaim responsibility for any injury to people or property resulting from any ideas, methods, instructions or products referred to in the content. |
© 2023 by the authors. Licensee MDPI, Basel, Switzerland. This article is an open access article distributed under the terms and conditions of the Creative Commons Attribution (CC BY) license (http://creativecommons.org/licenses/by/4.0/).


