1. Introduction
Laser additive manufacturing technology (LAM) is becoming an increasingly popular manufacturing technology in aerospace industry. In LAM process, high-energy laser deposit metallic wires or powders, layer-by-layer, to build components [
1,
2,
3,
4]. The high-efficiency and fast-forming process does not require subsquent expensive tooling and machining, enabling the directly fabrication of near-net-shaped components. Titanium alloys, for example Ti-6Al-4V, are probably the most widely studied LAM materials. Due to the good mechanical properties, especially the high performance in fatigue resistance and damage tolerance, titanium alloys are commonly utilized as turbine blisks, compressor discs and blades, etc. Titanium alloy components always experience high cycle fatigue loading under vibration and resonance. This tends to induce crack initiation and propagation [
5,
6], which lead to fatigue failure and fracture [
7,
8]. Hence, to reveal vibration fatigue behavior of LAM manufactured titanium alloy makes a great significance for assuring the security of aerospace structures.
Unlike materials produced by traditional manufacturing process, the final mechanical properties of LAM materials are influenced not only by processing parameters, but also by solidification behavior. During the LAM process, short energy pulses produced a highly localized melting and solidification, resulting in a strong temperature gradient [
9]. The steep temperature gradients, combined with repetitive thermal cycling, caused macroscopically epitaxial growth to the grains. Moreover, the unique solidification behavior can inevitably lead to process-induced defects. It has been reported that spherical pores and lack-of-fusion (LoF) are the most common types of defects [
10,
11]. The LoF defects tend to extend along scanning direction. Accordingly, the microstructure exhibits strong directionality, and consequently result in anisotropy of mechanical properties [
12,
13,
14,
15,
16,
17,
18,
19]. Li et al. [
13] studied dynamic tensile mechanical anisotropy of LAM Ti-6Al-4V, and the results showed that samples along deposition direction present a better ductility, while samples along scanning direction exhibit a higher strength. Scholars suggested that the tensile anisotropy was caused by different deformation behaviors of the LoF defects, and was aggravated by the different deformation mechanism of the columnar grain boundaries [
13]. The anisotropic mechanical properties are affected by the process-induced defects and the epitaxially elongated grains.
Recently, fatigue properties of LAM manufactured Ti-6Al-4V have received much attention. Most of these studies focused on traditional tensile fatigue behavior [
20,
21,
22,
23,
24,
25,
26]. Bandyopadhyay et al. [
20] studied the influence of building direction on fatigue properties of laser engineered net shaped (LENS) Ti-6Al-4V, and reported that the horizontally orientated samples showed a higher fatigue strength. This is due to the smaller defect size distribution on the cross-section of such oriented samples. Zhang et al. [
16] found that projected area of LoF defects vertical to the deposition direction is larger than that along the deposition direction, which results in lower fatigue strength of vertically orientated samples. Lv et al. [
21] studied the anisotropic fatigue crack growth rate in laser melted deposited (LMD) Ti-6Al-4V, and pointed out that horizontally orientated sample exhibited fatigue cracks interacting with only one or two columnar grains, resulting in lower fatigue crack growth resistance.
Structural components, such as blades, are prone to failure due to material fatigue when subjected to vibrational loading. Fatigue analysis in this context focus on the fatigue behavior near the natural frequency of flexible structures [
27,
28]. Accordingly, traditional tensile fatigue data is insufficient to represent the failure of these components under vibration loading. Furthermore, traditional fatigue experiments performed via servo-hydraulic testing machines are known to be costly and time-consuming. Therefore, in recent years, researchers have investigated fatigue behavior of LAM alloy based on first-order bending vibration tests using a shaker, which offers the advantage of shorter test durations [
29,
30,
31]. Wanjara et al. [
32] studied the fatigue performance of wire-fed electron beam additive manufactured (WBD) Ti-6Al-4V thin-plated samples via a vibration (resonance) fatigue testing, and calculated the fatigue limits and standard deviations of the samples. Zhao et al. and Ellyson et al. conducted vibration fatigue tests on Ti-6Al-4V samples fabricated by SLM [
33], WBD [
34] and LMD [
35] processes, respectively. They found that process-induced defects were the primary factor contributing to lower fatigue lives and significant life dispersion. Zhao [
35] examined the anisotropy of fatigue lives and crack propagation in LMD Ti-6Al-4V samples at a stress amplitude of 500MPa and suggested that samples aligned with deposition direction exhibited lower crack propagation speed. However, a very limited amount of paper covered the anisotropic studies of vibration fatigue behavior of LAM Ti-6Al-4V alloy. This paper aims to address this gap in knowledge.
The purpose of this paper is to investigate the vibration fatigue properties of LAM Ti-6Al-4V samples manufactured using the LMD technology in both the transversely de-posited (TD) and parallelly deposited (PD) direction. The paper is structured as follows. In
Section 2, microstructural characterization and fabrication of the samples is presented. The validity of a fatigue sample geometry and feasibility of the fatigue experiment is verified. In
Section 3, via the fracture surface morphology, vibration fatigue failure mechanism and failure features at crack initiation sites are analyzed. Moreover, fatigue lives and fracture position of the LAM samples in TD and PD based on the failure features at initiation sites are analyzed. In
Section 4, the influence of process-induced defects and columnar grains orientation on the anisotropic fatigue behavior are discussed. Finally, a comprehensive conclusion is made in
Section 5. By following this structure, the paper provides a detailed analysis of the vibration fatigue properties of LAM Ti-6Al-4V samples, including the examination of fracture surfaces, analysis of failure features at initiation sites, and the influence of process-induced defects and columnar grains orientation on the anisotropy of vibration fatigue behavior. The paper contributes to the understanding of the fatigue performance of LAM Ti-6Al-4V and its potential applications in aerospace structural components.
2. Materials and Methods
2.1. LAM process and Material
The material used in this paper was prepared using the LMD technology at the State Key Laboratory of Solidification Processing of Northwestern Poly-technical University (NPU; Xi′an, China). The Ti-6Al-4V alloy powder, with a size range of 44 to 178 μm, was dried at 120℃ under vacuum for 4 h to eliminate moisture absorption. The nominal chemical compositions (wt%) of the powder are presented in
Table 1. Prior to deposition, the surface of the wrought Ti-6Al-4V substrate was cleaned using an acetone solution. The LAM manufacturing system utilized in this study consists of a 3D numerically controlled working table, a PRC4000 CO
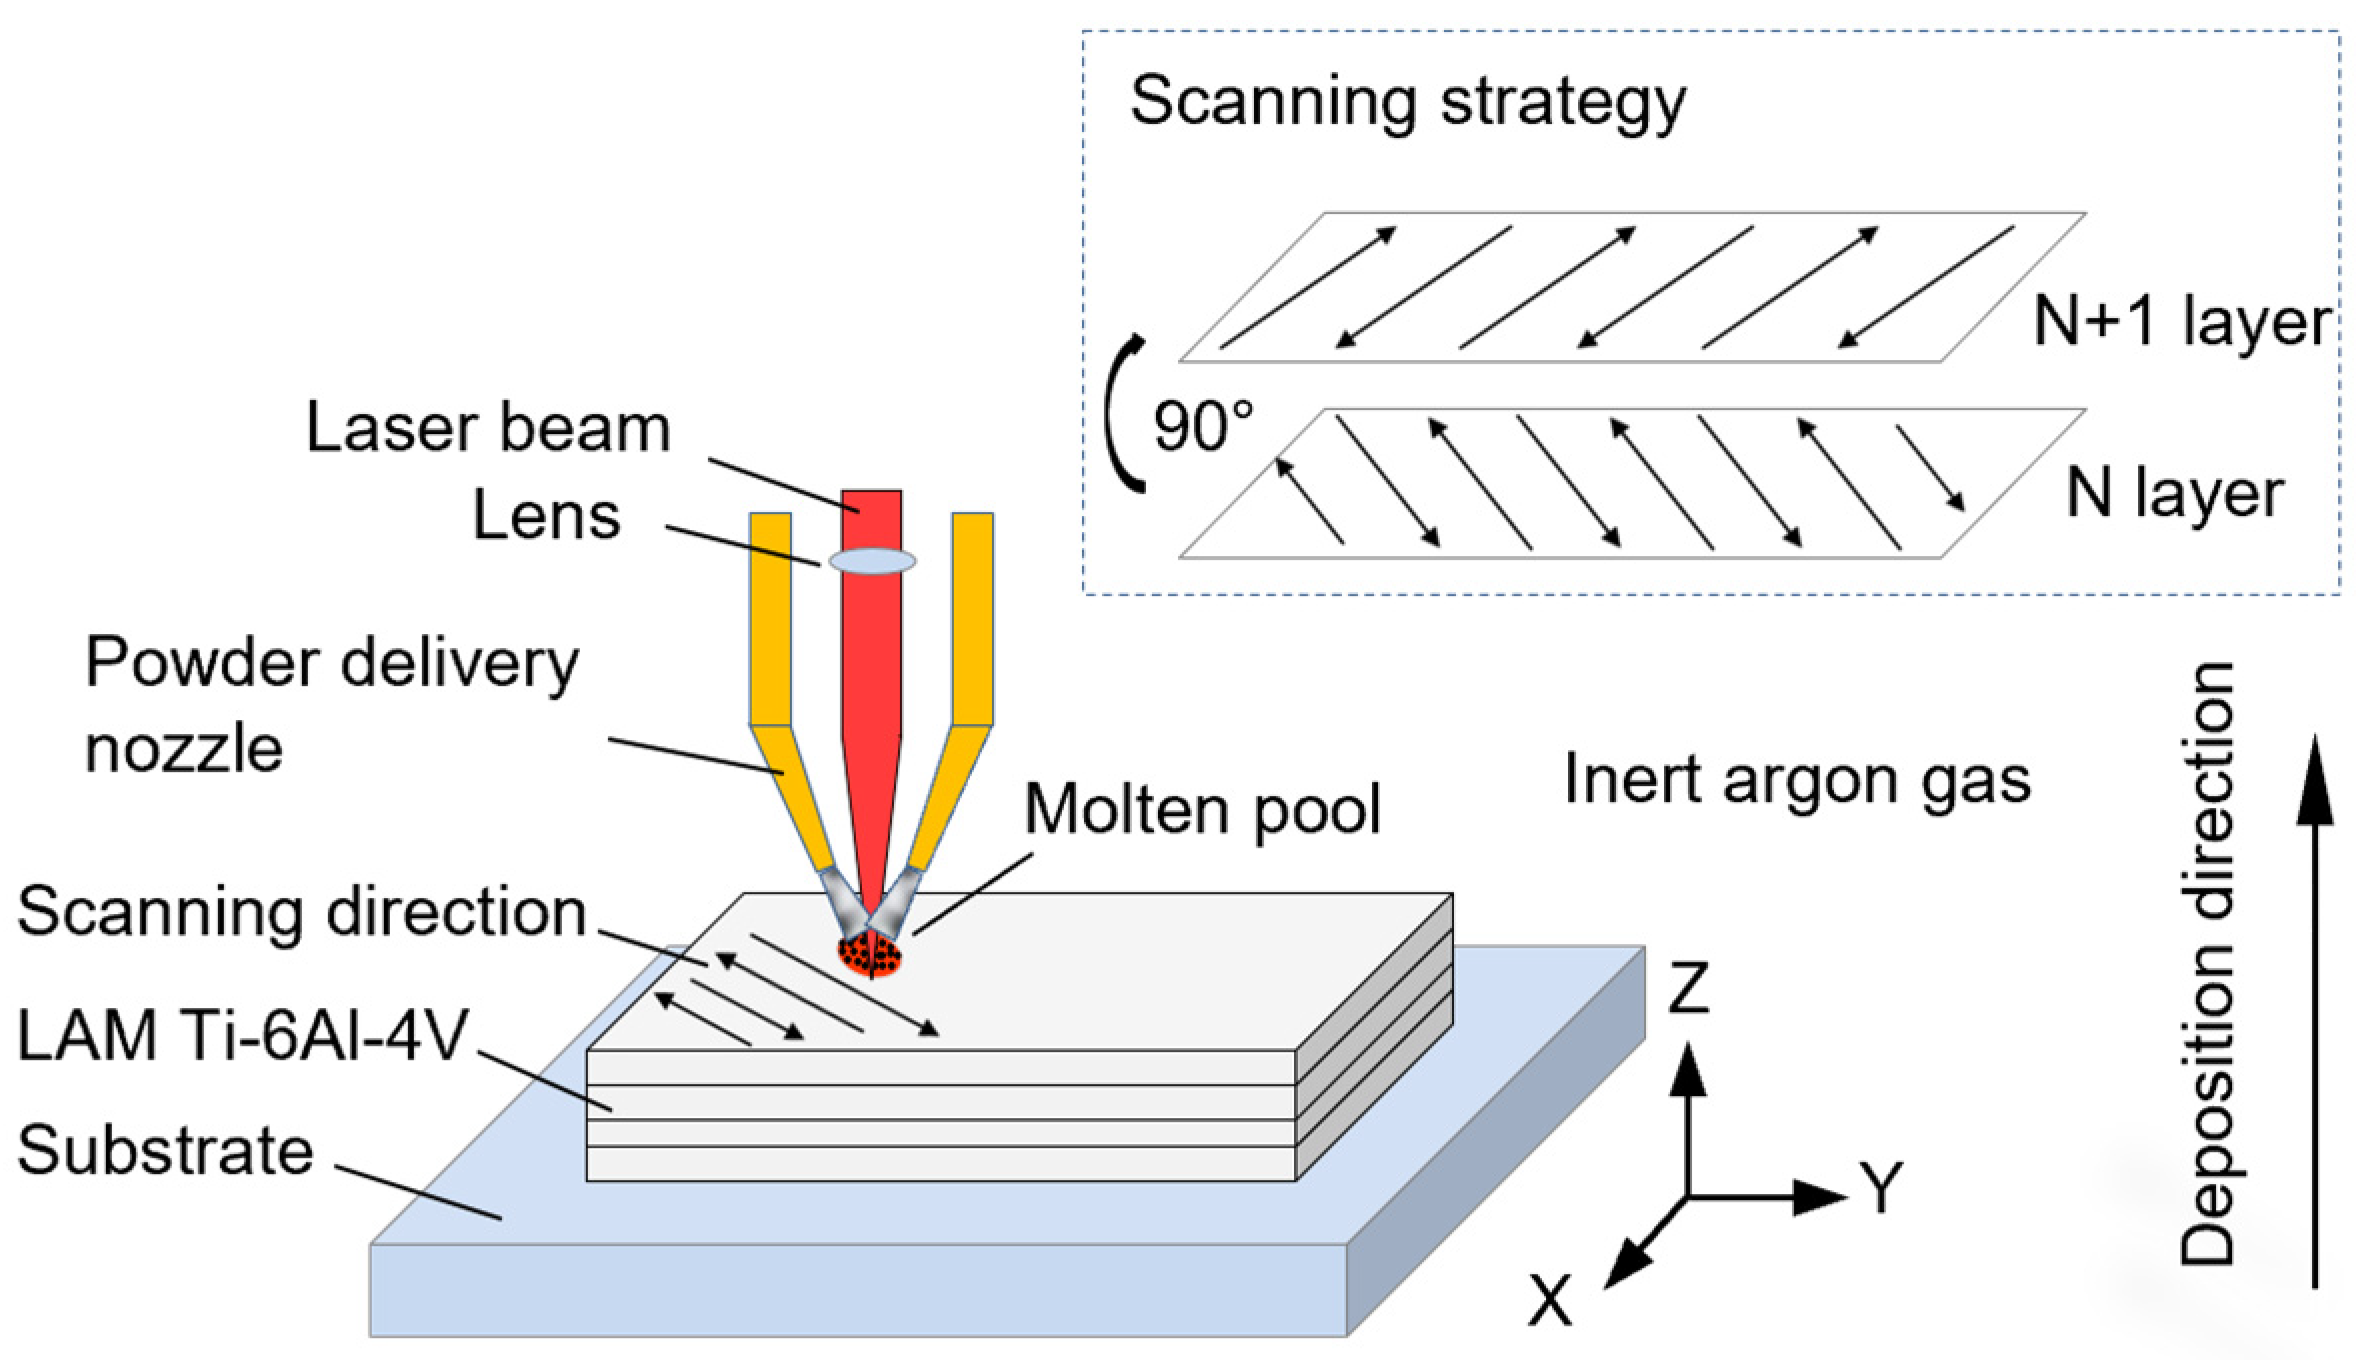
2 laser, a DPSF-2 automatic adjusted feeding system and an inert gas chamber (oxygen content less than 50 ppm), as schematically in
Figure 1. The scanning direction on each consecutive deposited layer was kept 90°. The applied process parameters are listed in
Table 2. The deposition direction was designated as the Z direction, while the two orthogonal scanning direction were designated as the X and Y direction, respectively. To alleviate residual stress within the Ti-6Al-4V alloy, the deposited part underwent a post treatment procedure involving solid solution and aging. This process included heating the part to 920℃ for 2 h followed by air cooling(AC), and subsequently heating to 520℃ for 4 h followed by AC. The post treatment not only helped mitigate residual stress but also enhanced the ductility and uniformity of the LAM alloy.
2.2. Microstructure Characteristics
To examine the microstructure of the LAM alloy, metallographic samples were prepared by stepwise polishing using sandpaper, and subsequently etched for 60 s with Kroll's reagent (1 ml HF: 3 ml HNO
3: 50 ml H
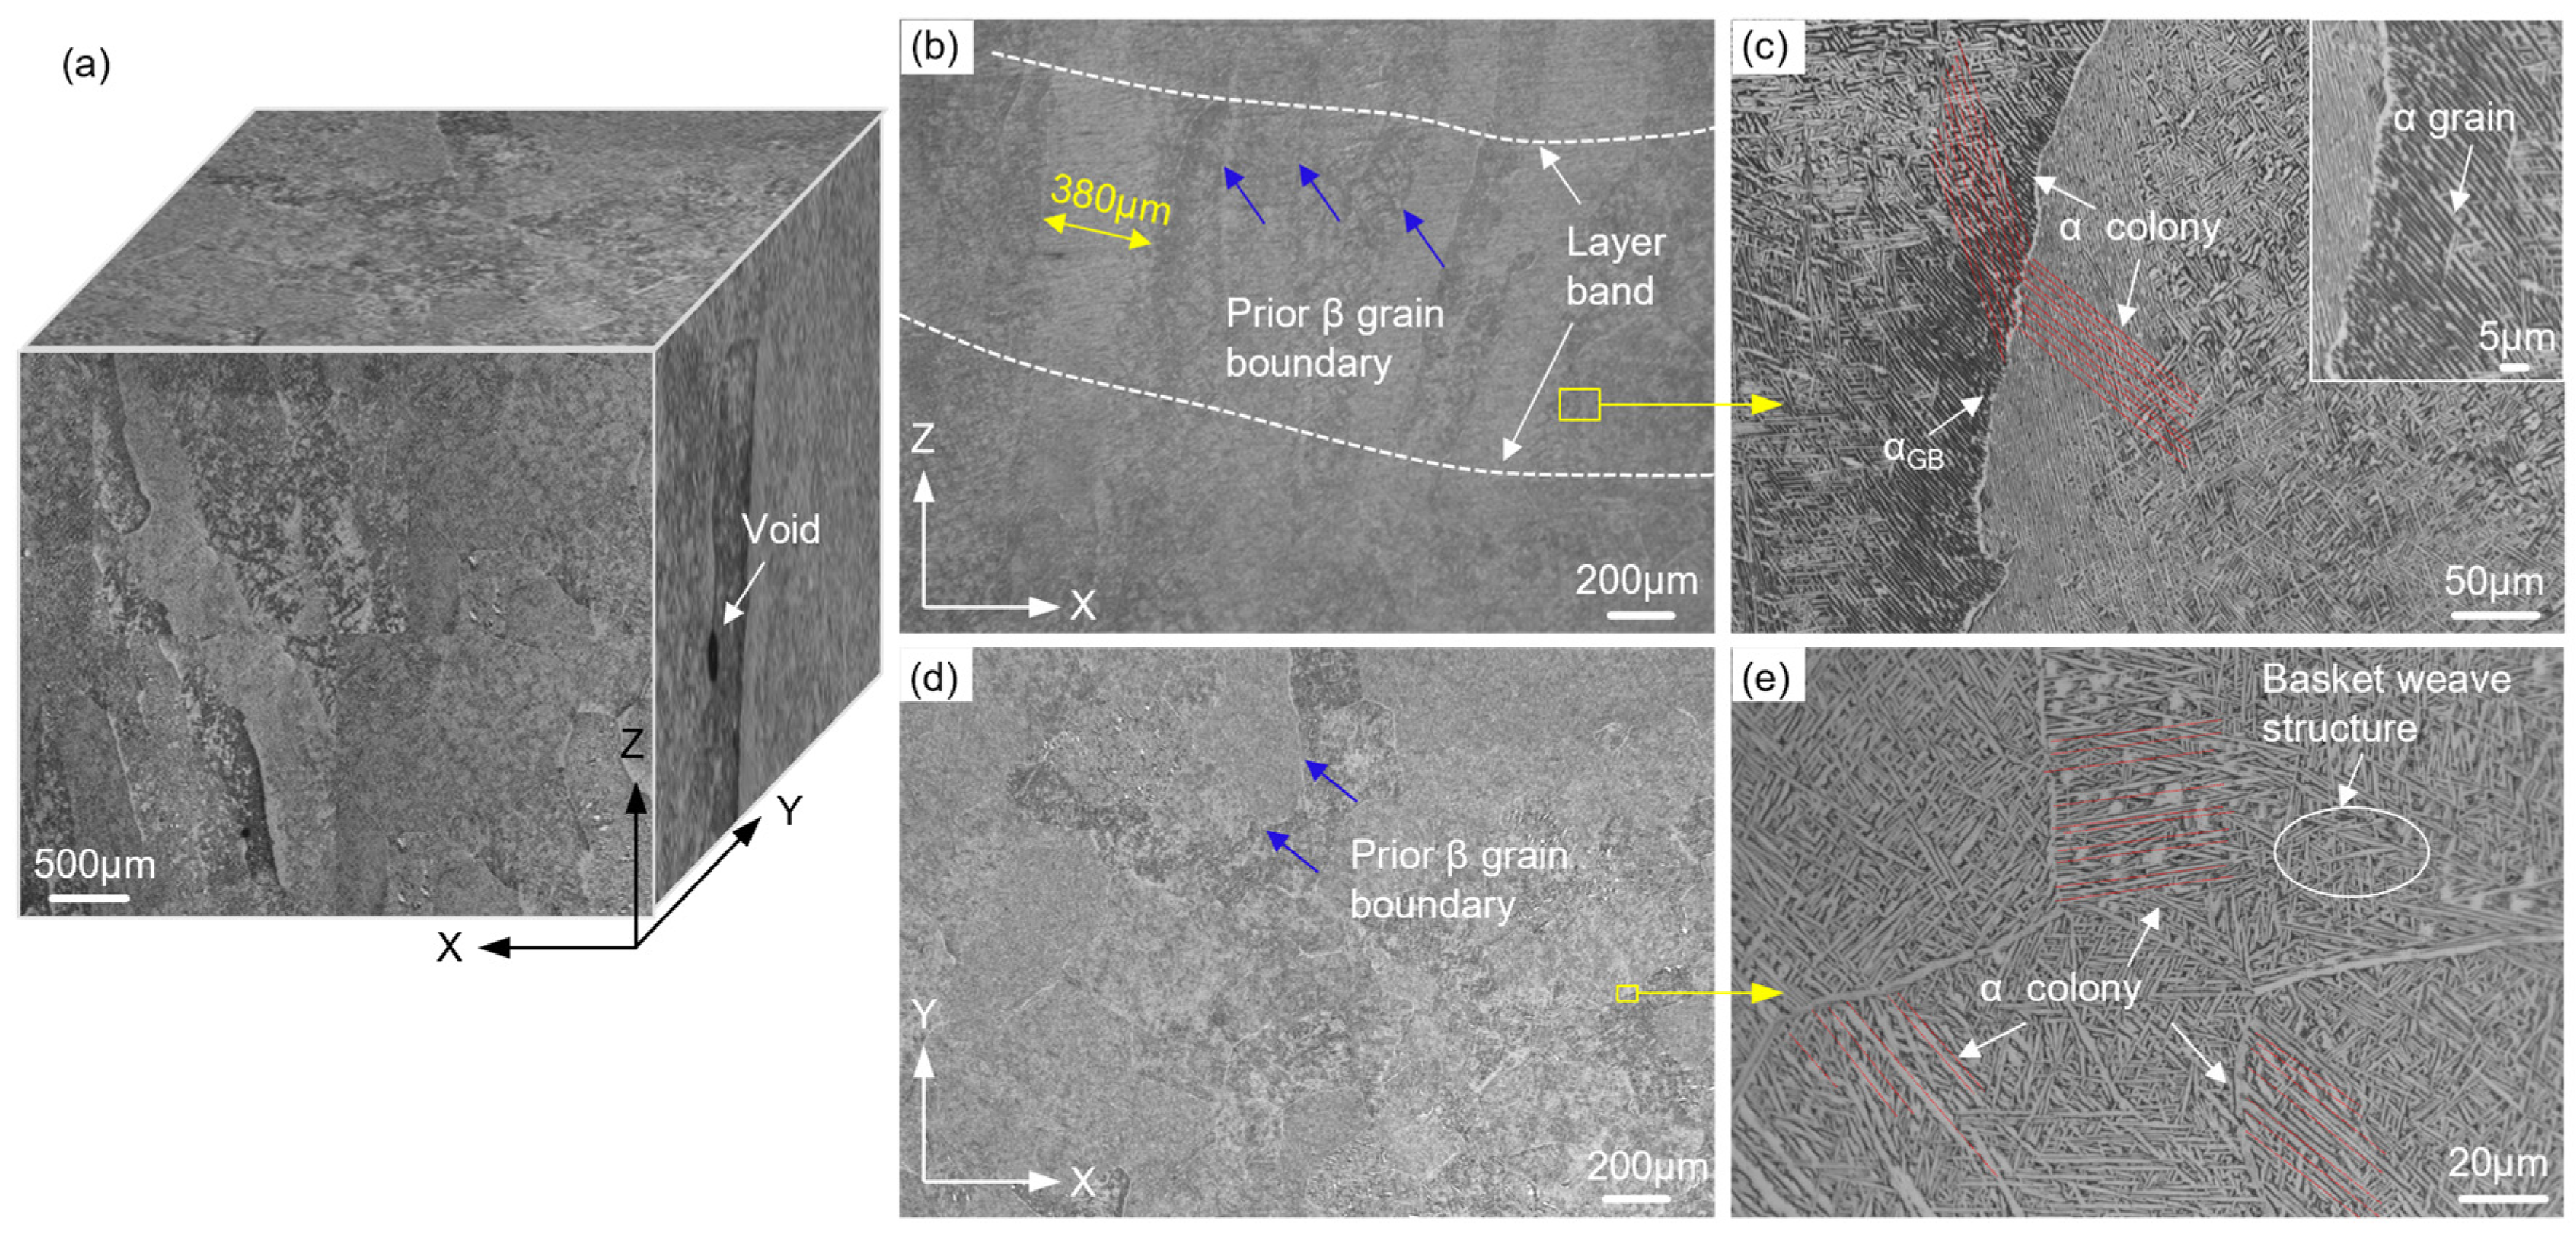
2O). The microstructure was then observed using optical microscopy (OM; OLYMPUS-GX71, Tokyo, Japan) and shown in
Figure 2. On X–Z plane, typical columnar β grains (390 ± 160 μm in width, several millimeters in length) grow epitaxially in deposition direction, and traverse several deposited layers. On X–Y plane, however, a nearly equiaxed β microstructure can be observed (
Figure 2d). The equiaxed grains were uniformly distributed, which can be attributed to the orthogonal scanning direction between consecutive layers (
Figure 2). Therefore, the microstructural differences between the two scanning directions can be considered negligible. At β grain boundaries (GBs), grain boundary α phase (1–3 μm in width) were clearly identified, as in
Figure 2c and 2e. On either side of the GBs parallel needle-like martensitic α grains constituted α colonies (60–90 μm in width). The colonies could extend up to a few hundred microns or even 1 mm along the deposition direction. However, along the scanning direction, the directional consistency of the colonies decreased due to the presence of equiaxed grains. The microstructure analysis reveals the presence of distinct columnar β grains in the deposition direction and equiaxed β grains in the orthogonal scanning direction. The presence of grain boundary α phases and martensitic α colonies further characterizes the microstructure of the LAM alloy.
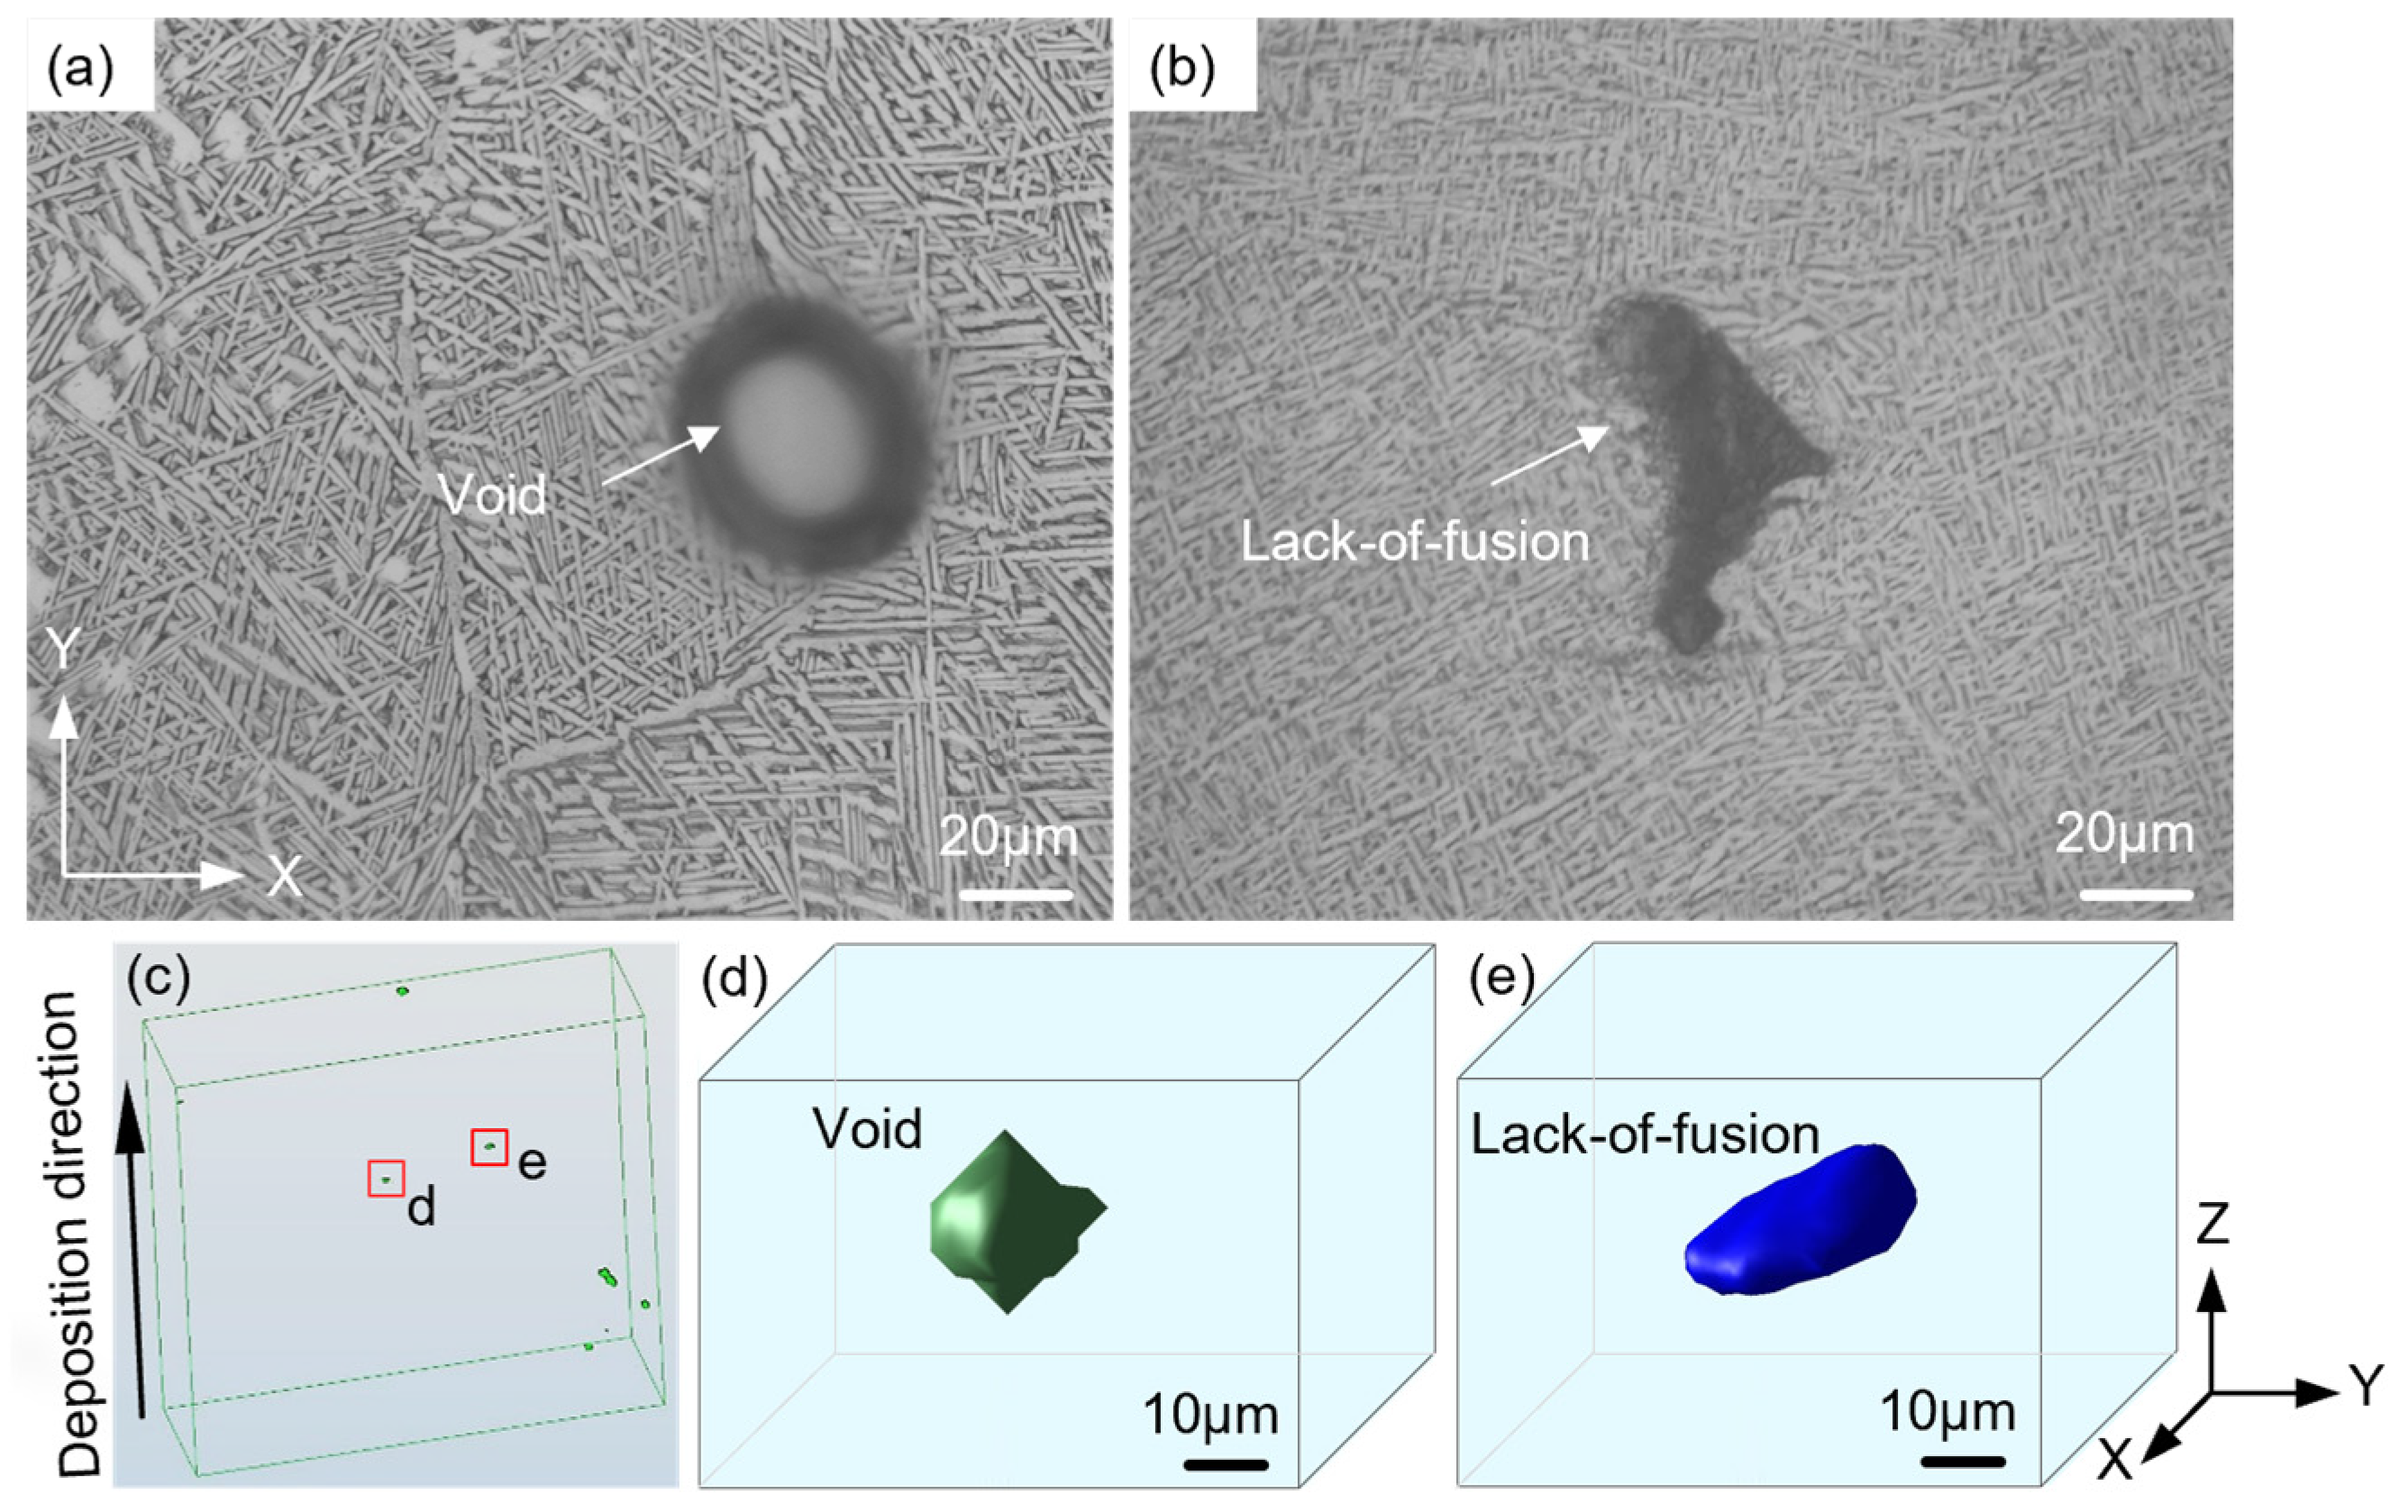
Inevitably process-induced defects are formed in the LAM Ti-6Al-4V alloy, as in
Figure 3. The defects can be classified into circular voids with smooth edges (
Figure 3a) and LoF defects exhibiting irregular geometrical morphologies with sharp corners (
Figure 3b). To visualize and quantify the porosity within the LAM alloy, a sample measuring 3 × 9 × 9 mm
3) was cut from the center of the alloy. X-rays computed tomography (XCT; YXLON MU2000-D, Germany) was employed, operating at a voltage of 205 kV and a current of 200 μA, with a resolution of 10 μm. The XCT scanning generated 2D radiographs, which were reconstructed into a 3D visualization of voids using Dragonfly software, as in
Figure 3c–e. The porosity was measured to be approximately 0.006% with random voids distribution. The 3D representation of the two types of defects correlated well with the observations made in the optical images.
2.3. Samples
To investigate the distinct fatigue behavior in TD and PD, two types of samples were machined by wire electrical discharge machining. These samples were categorized as TD samples and PD samples, as schematically in
Figure 4a.
The first step in vibration fatigue experiments was to determine the geometries of fatigue sample. As reported by George et al. [
27], a continuous system has an infinite number of vibration modes, each corresponding to a specific natural frequency. The first-order vibration mode is the commonly observed in moving parts of power engineering system, such as blades. Additionally, the first-order vibration mode is more feasible to replicate in fatigue experiments compared to the higher-order vibration modes [
28,
29,
30,
31,
32,
33,
34,
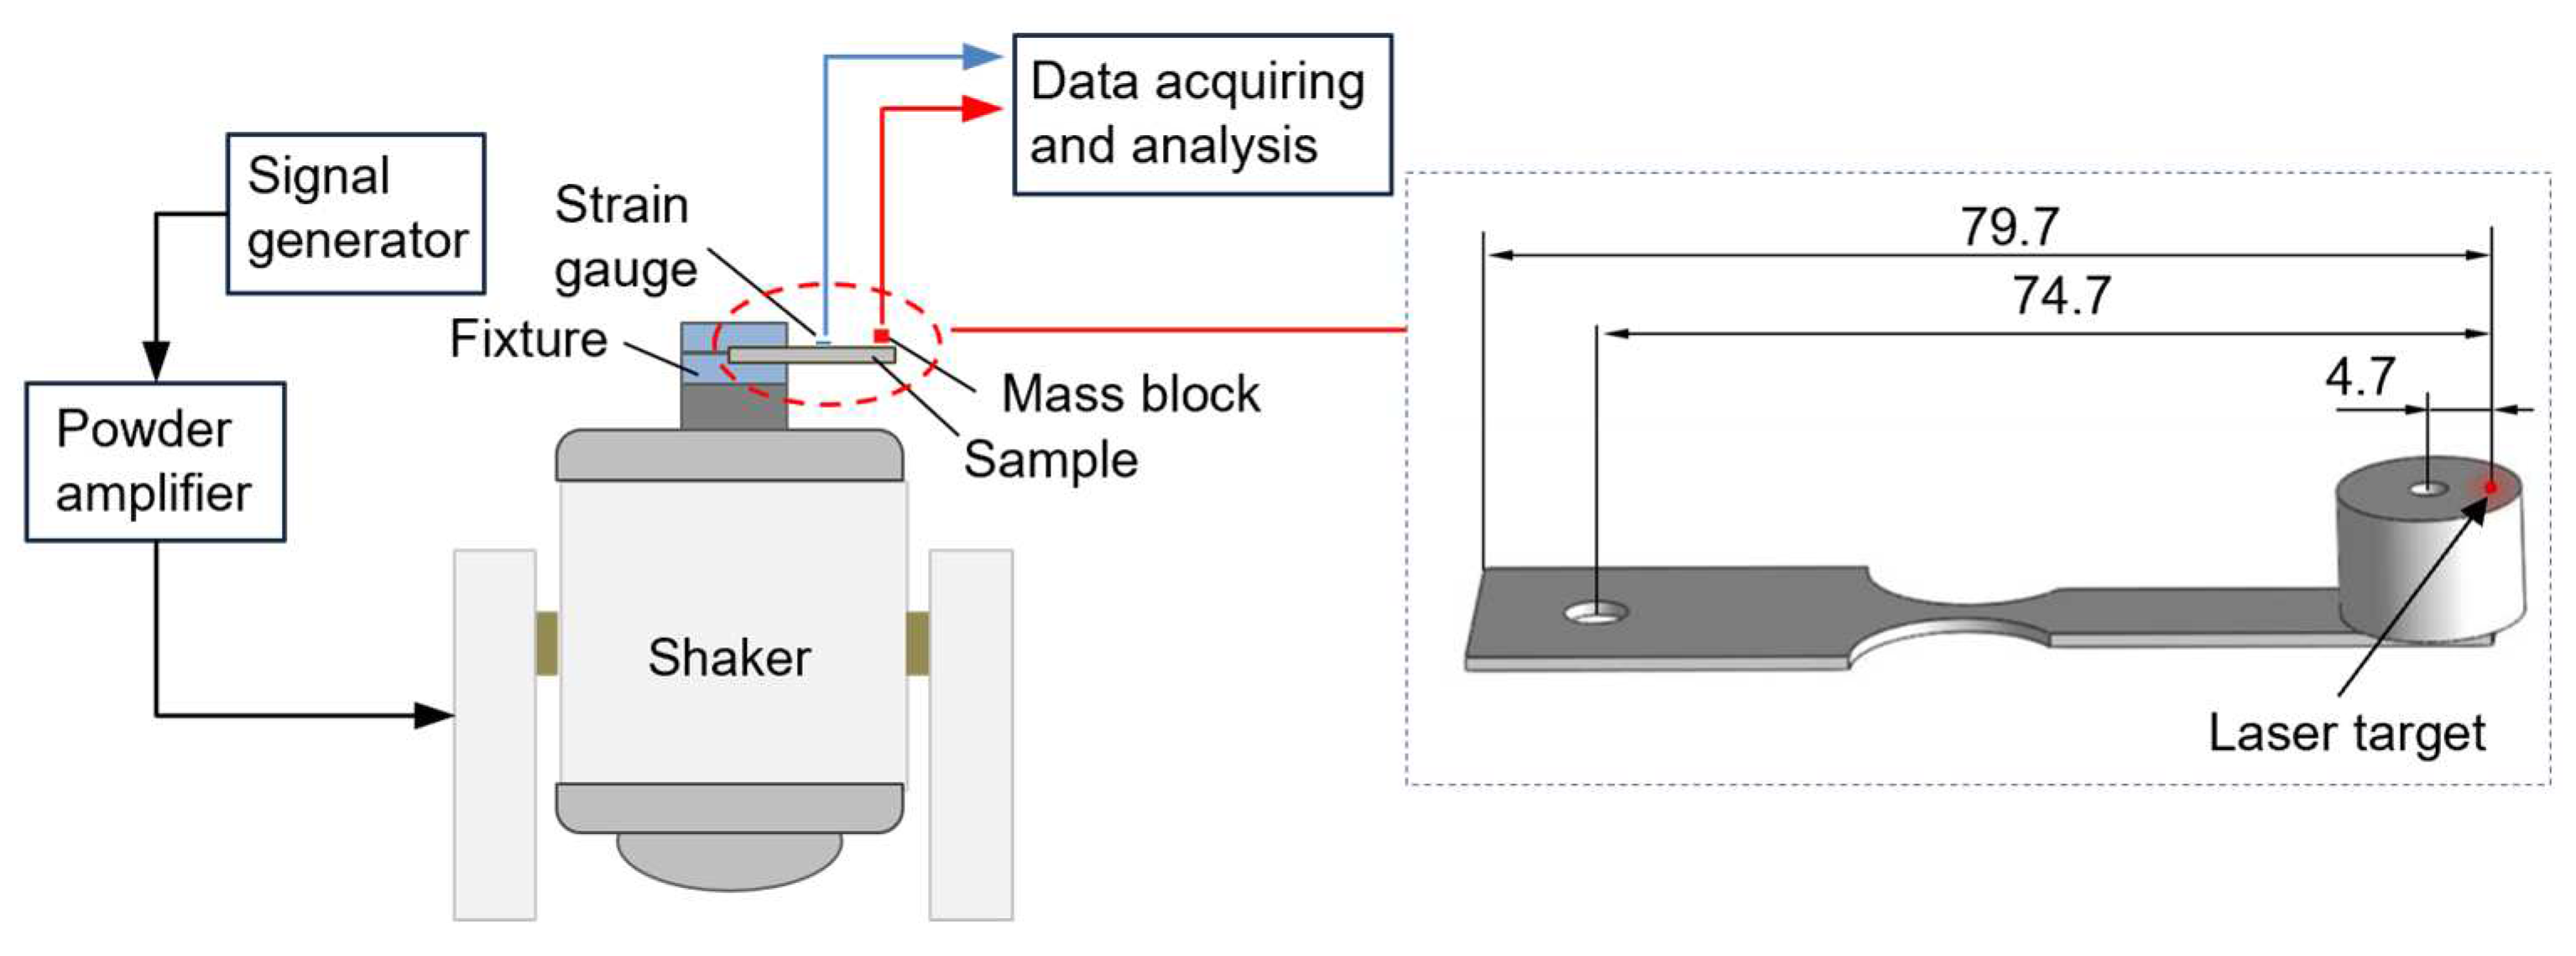
35]. Accordingly, the first-order vibration mode shape was chosen as the target mode. In this study, the geometries of the vibration fatigue sample were obtained through finite element simulation using an iterative method. To ensure that the fatigue crack initiates near the notch root, round notch with a radius of 8.5 mm were processed on both sides of the sample (
Figure 4b). A through-thickness hole with a diameter of 5 mm was designed to enable the cantilever sample to be connected to an electro–magnetic shaker. Another through-thickness hole with a diameter of 3 mm was utilized to attach a mass block (YG8, 14.44 × 9.2 mm, 21.2 g,
Figure 5). To minimize the influence of surface roughness on fatigue behavior, the gauge section surfaces of the samples were sanded with #180 – #5000 sandpaper and polished with diamond suspension. The measured Ra values ranged from 0.4 to 0.6 μm, indicating a relatively small variation in surface roughness. Therefore, the effect of surface roughness on the fatigue properties can be neglected in this study.
2.4. Vibration Fatigue Experiments
Vibration fatigue experiments were performed on a JZK-200 electro–magnetic shaker (
Figure 5). The parameters of the shaker are listed in
Table 3. The equipment used in the test system consisted of the shaker, a YE1311 signal generator and a YE5873A power amplifier. The instrumentation used in the measurement system is a LKGD500 displacement sensor, a SDY2301 strain gauge bridge box and BE120-03AA ultrasonic dynamic strain gauges. During experiments, the cantilever sample was clamped in a cylindrical fixture through the left through hole, ensuring consistent compression at the same position for each sample. The sample tip displacement was monitored by the displacement sensor. The laser target was positioned 4.7 mm away from the center of the mass block. The stress was monitored by the strain gauges glued longitudinally on the surface of the samples, exactly locating at the maximum stress position. All fatigue experiments were conducted under laboratory conditions, with the samples excited to vibrate at the first-order natural frequency in full reversed condition (stress ratio R = −1).
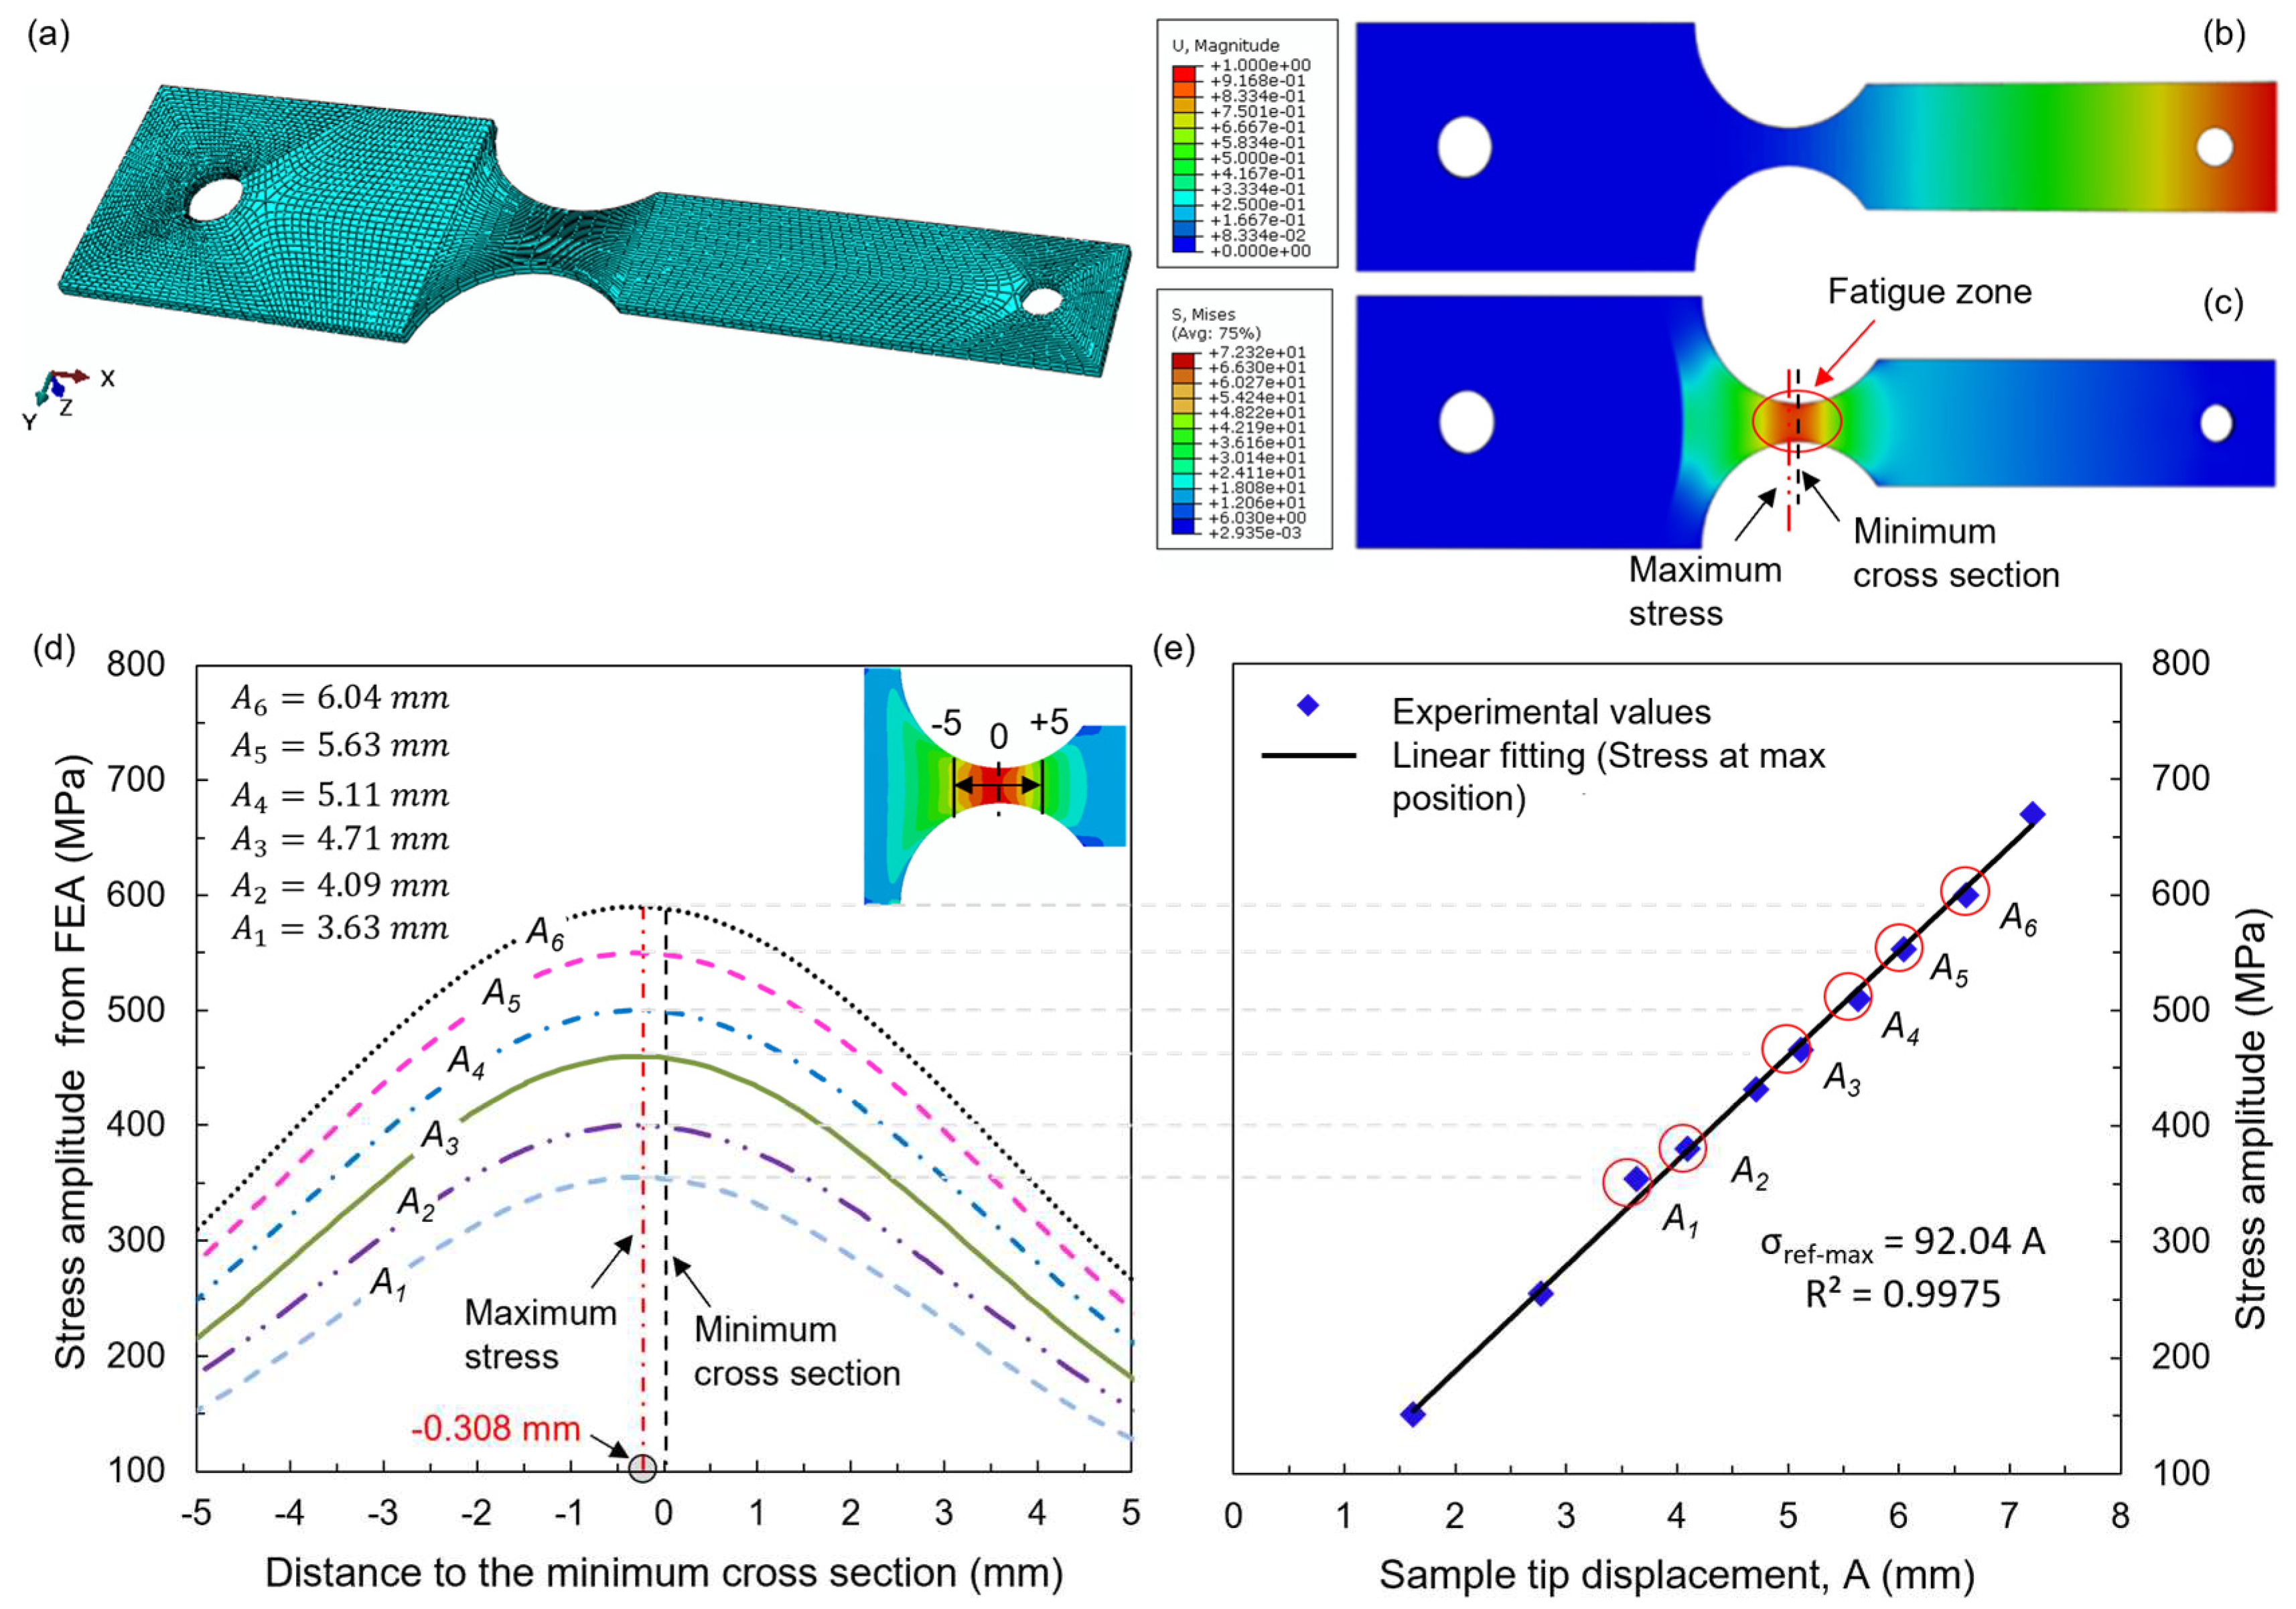
To assess the feasibility of the cantilever sample and provide reference data for frequency regulation and vibration stress calibration during experiments, a modal analysis was performed using ABAQUS software (Version 6.14). The modal shape, first-order natural frequency, and vibration nodal region were analyzed. The model consists of two parts, the cantilever sample and the mass block. Material parameters from traditional Ti-6Al-4V alloy were applied, as listed in
Table 4. The displacement and rotation of the clamped edge of the sample were completely constrained, which was the same as that adopted in the experiments. The meshing details of the modal analysis are shown in
Figure 6a, which comprised 124,676 elements and 198,376 nodes. The computed first-order natural frequency was 47.4 Hz, while the measured frequency ranged from 46 to 50 Hz during frequency sweeping for the tested LAM samples. This indicates that the error between the measured and simulated natural frequencies is less than 5%, affirming the accuracy of the model analysis.
Figure 6b shows the first-order modal displacement distribution on the sample surface. It can be observed that the displacement gradually decreases from the sample tip to the clamped edge, with the maximum vibration displacement occurring at the sample tip. The modal stress distribution is presented in
Figure 6c. The stress is significantly higher on the surface of the notch region compared to other regions, with the maximum vibration stress observed on this surface. The notch region is considered the fatigue region, representing the theoretical weak position and predicted fracture position. Additionally, a continuous stress distribution curve along the central path on the surface near the notch region is obtained (
Figure 6d). The origin is set at the minimum cross-section of the fatigue region. Notably, the stress distribution remains consistent at different tip displacements. The maximum stress was not found right at the minimum cross-section, it slightly drifted at the point -0.308 mm. To validate the simulated results, strain gauges were attached to the maximum stress position. The comparison of maximum stress from the simulated results and strain gauge measurements at different tip displacements is shown in
Figure 6d and 6e, revealing excellent consistency. Therefore, the ABAQUS results provide a reliable reference for determining the location of the fatigue region in the present sample.
Furthermore, it can be clearly observed that the maximum stress amplitude is linear with the sample tip displacement (
Figure 6e), which has also been reported in previous vibration fatigue experiments [
33,
34,
35]. This implies that the maximum stress amplitude can be controlled by adjusting the sample tip displacement. In this paper, stress-controlled fatigue experiments were conducted within a maximum stress amplitude range of 300–600 MPa, which corresponds to approximately 55% of the yield strength as mentioned in our previous study [
35]. During experiments, when a fatigue crack was initiated in the surface layer of the cantilever samples, the natural frequency of the samples would shift [
32,
33]. Once the natural frequency decreased by 2%, the excitation frequency was adjusted to match the real-time natural frequency, thereby accelerating the failure of the samples. A total of nineteen TD samples and sixteen PD samples were used for the fatigue experiments. The fracture surfaces after experiments were observed using scanning electron microscope (SEM; JEOL JSM-6390A, Tokyo, Japan).
3. Results and Analysis
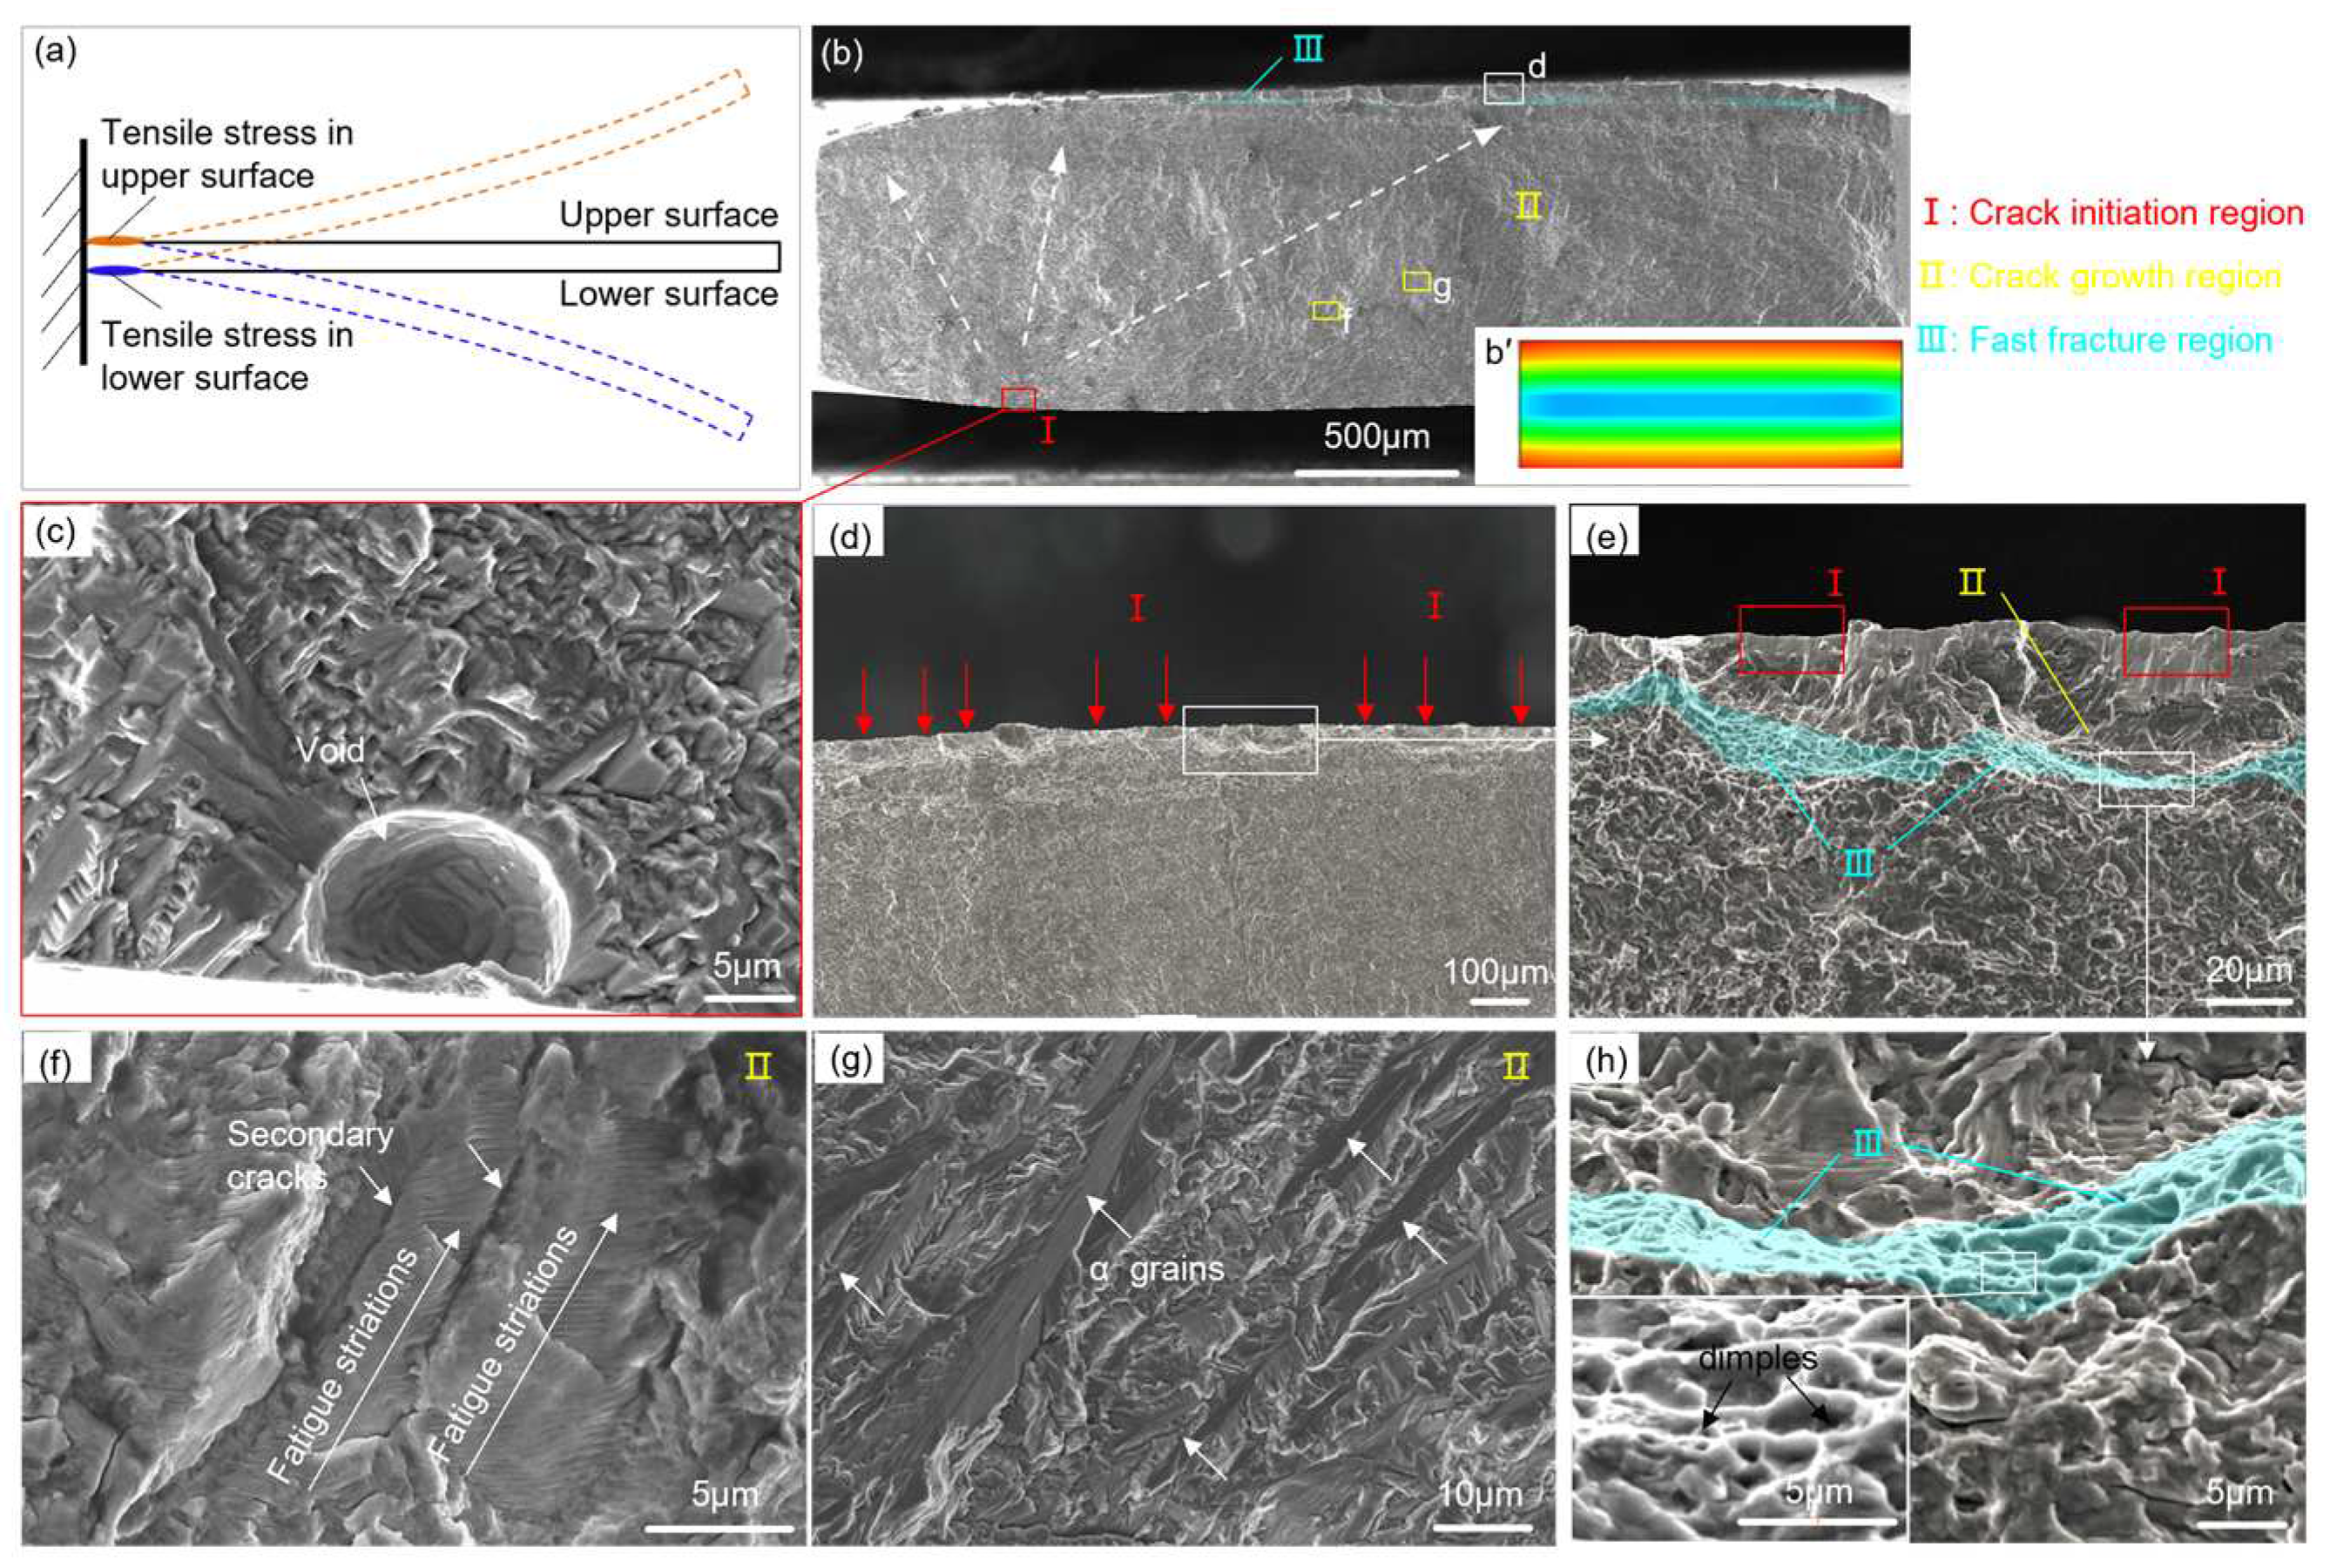
Figure 7 displays a representative fatigue fracture surface from the TD group at a maximum stress amplitude of 500 MPa (N
f = 32.88 ×10
4 cycle). The force analysis of the cantilever sample is shown in
Figure 7a. The sample was subjected to cyclic tensile or compressive stress under vibration loading. The maximum tensile stress occurs at the two side surfaces of the fatigue region (notch root), which is significantly higher than that within the interior of the sample. This observation is consistent with the stress distribution on the cross-section of the notch root, as in
Figure 7b´. The fracture surface can generally be distinguished into three main zones: the crack initiation zone, the crack propagation zone and the fast fracture zone (
Figure 7b).
Figure 7c–e shows the crack initiation sites. A spherical void is observed at initiation site in the lower surface (
Figure 7c), and several crack initiation sites caused by surface slip are arranged in the upper surface, as in
Figure 7d and 7e. These indicate that fatigue damage occurs at the two side surfaces of the notch region, leading to crack initiation. The crack then propagates further inward until the sample ultimately fails.
In
Figure 7b, the crack propagation zone area corresponding to the initiation zones in the upper and lower surfaces differs significantly. The area in the lower surface is larger, while that in the upper surface is extremely small. This discrepancy is attributed to the fact that the surface defects in the lower surface may preferentially generate local micro-stresses greater than the yield strength value under vibration loading. Accordingly, the crack propagation rate is higher in the lower surface due to the larger tensile stress. Consequently, the crack propagation area in the lower surface is larger than that in the upper surface. Thus, the void in the lower surface serves as the primary crack origin and the main controlling factor affecting fatigue life. Throughout this paper, only the failure features at the main initiation sites will be discussed. At higher magnification, typical fatigue striations and secondary cracks can be clearly observed in
Figure 7f. The fatigue striations were formed by the opening-closing actions of cracks due to the high stress at the crack tip [
36]. Trans-granular crack growth across the α grains can be seen in
Figure 7g.
Figure 7h shows the fast fracture zone located between the crack propagation zones. In this zone exist numerous small and shallow dimples, which was generated by the micro-pores and their tearing ridges.
All fatigue experimental results in the TD and PD are summarized in
Table 5. The reference maximum stress (σ
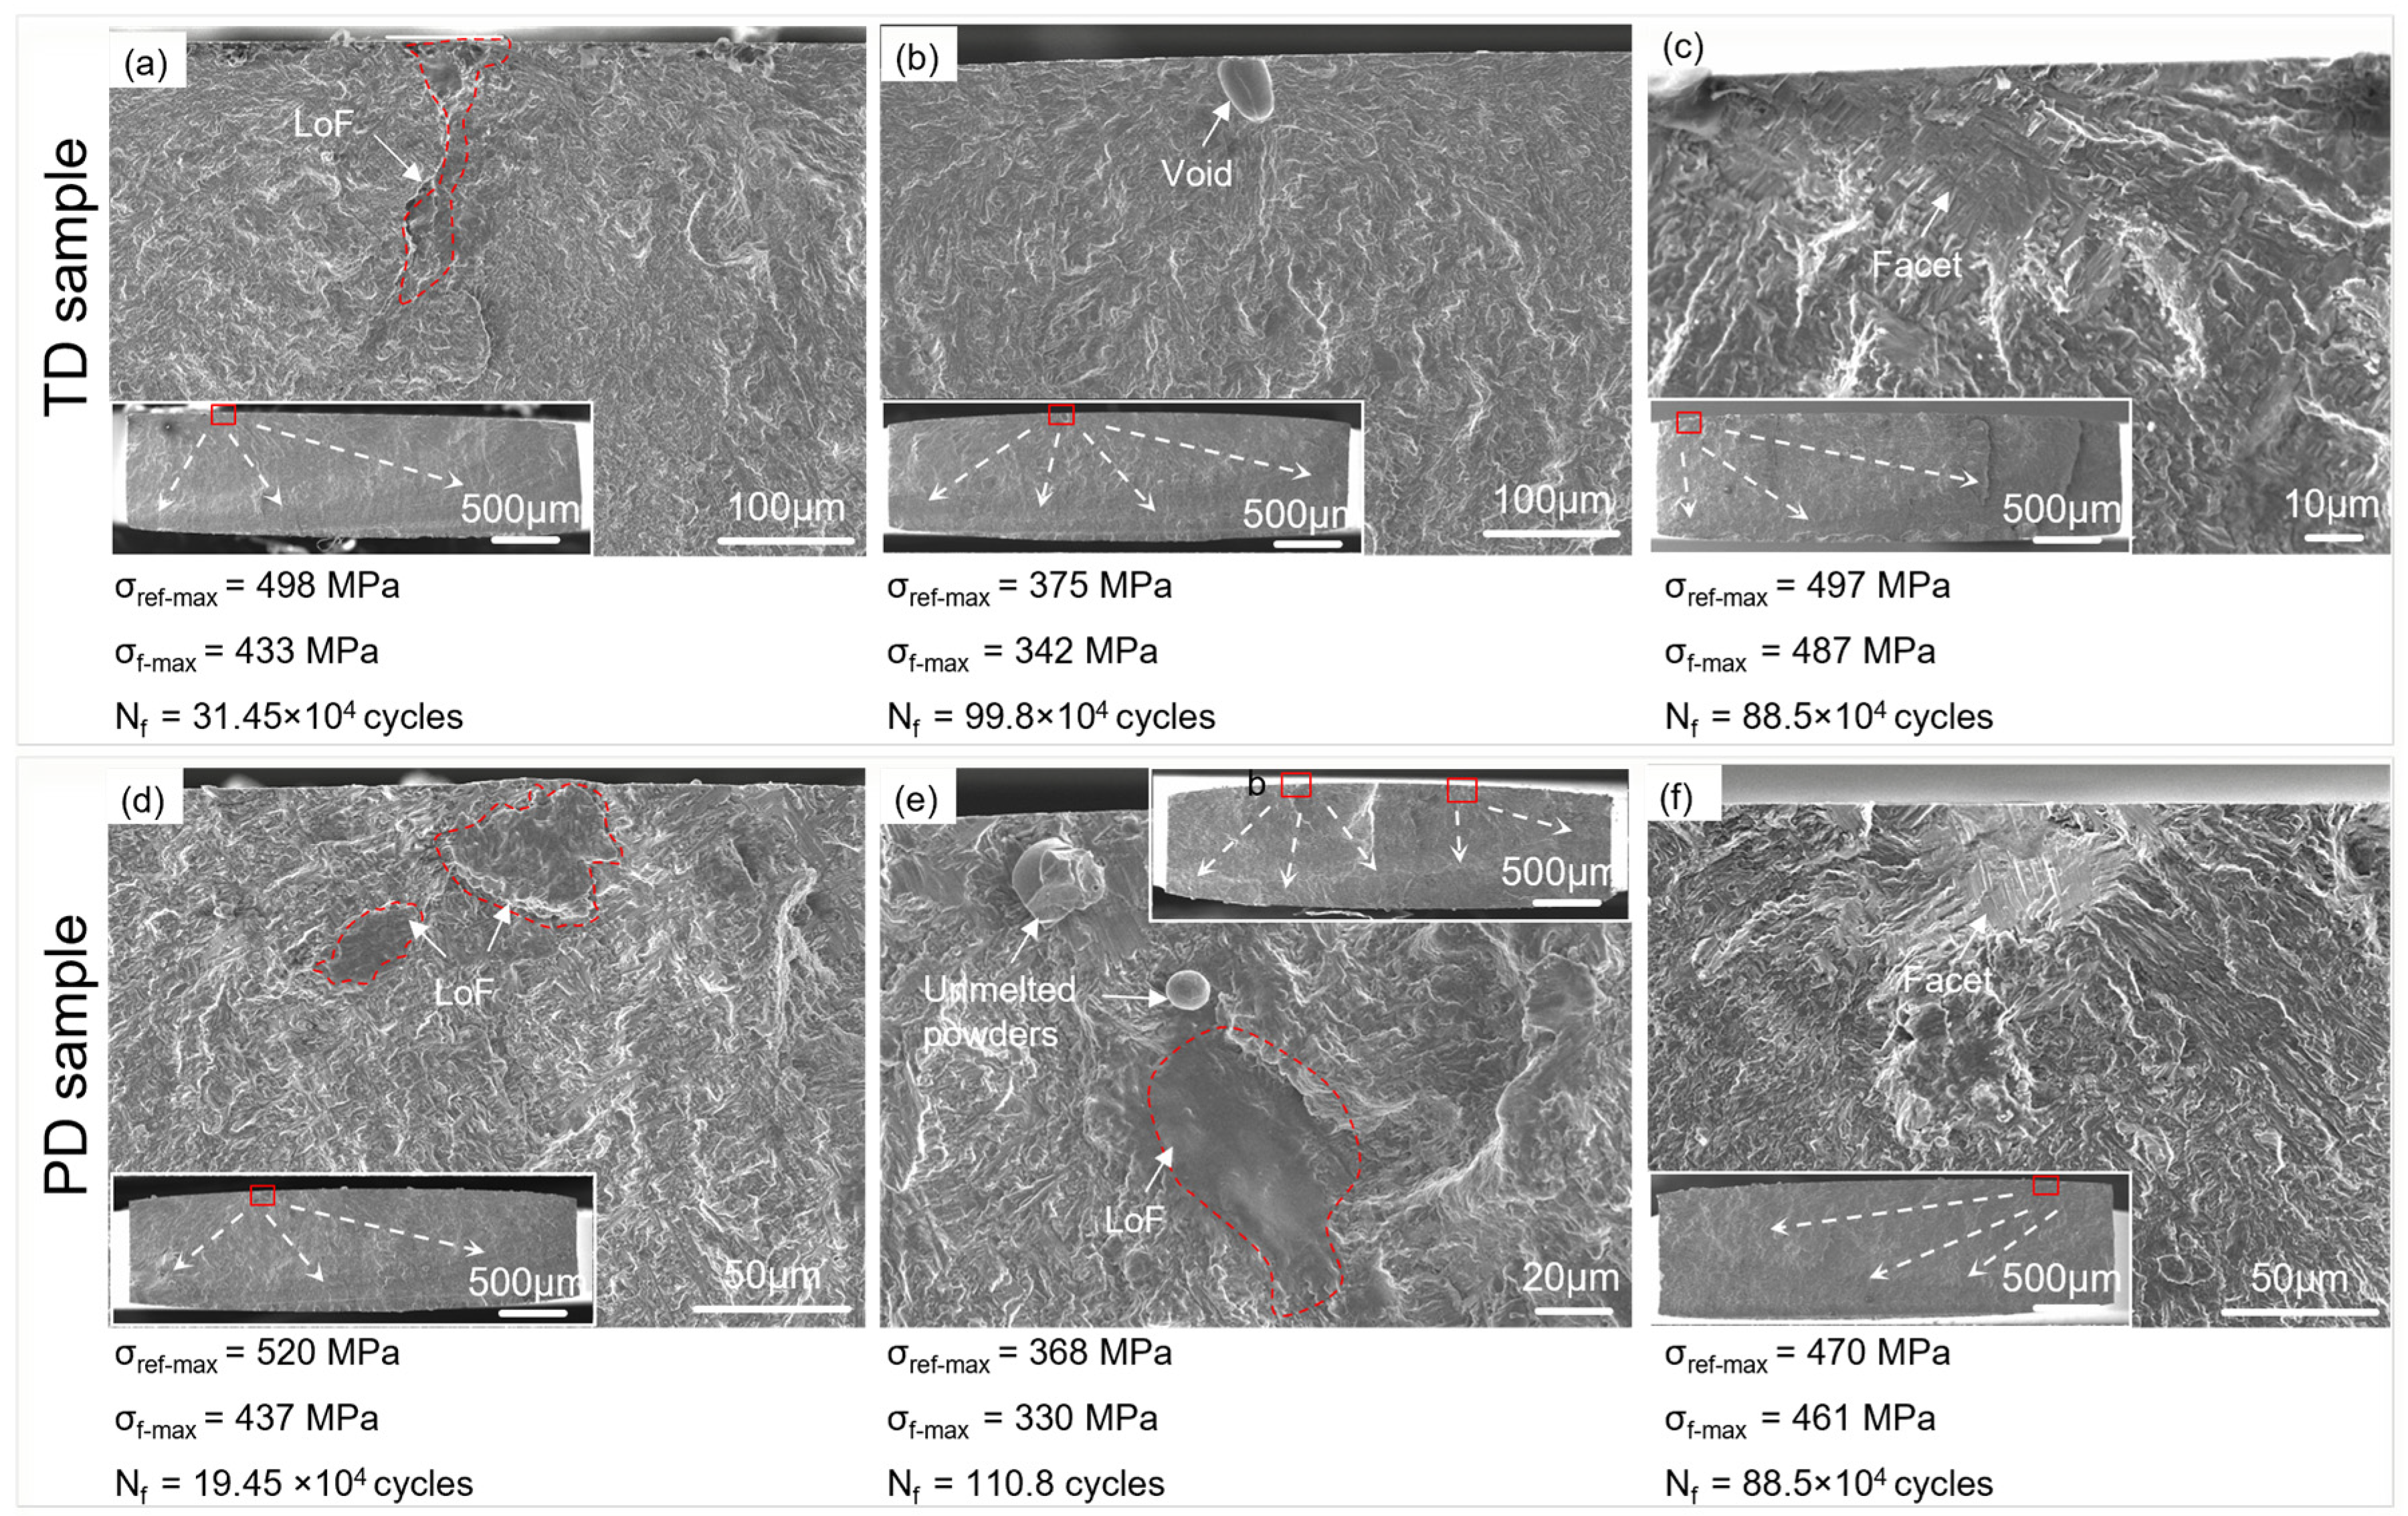
ref-max) was calculated by the linear relation between the maximum stress amplitude and sample tip displacement (A). Representative fatigue failure features at crack initiation sites are shown in
Figure 8. It can be seen that there are two kinds of fatigue failure features at initiation sites called defect-related failure (DRF) and defect-free failure (DFF). For the DRF group, process-induced voids or LoF defects were found at crack initiation sites, as in
Figure 8a, 8b, 8d and 8e. While for the DFF group, no defects were found at crack initiation sites, as in
Figure 8c and 8f, and microstructural facets were proved to be the typical failure features. This type of failure is commonly observed in fully lamellar α + β titanium alloys, such as Ti-6Al-4V alloy [
37,
38,
39]. In LAM Ti-6Al-4V alloy, α colonies are the most typical characteristic microstructure. Individual α grains within a single colony are aligned perfectly, enabling the sharing of the same slip system. This allows for relatively unimpeded slip propagate across an entire colony. Additionally, α colonies are considered to be the microstructural features presenting the longest slip length in the material [
13], resulting in a shorter crack initiation time. As such, the microstructural facets can be considered as sheared α colonies.
Previous studies have demonstrated that fatigue fracture position can vary on a microscopic scale [
35,
40]. In this paper, the fracture positions of the LAM samples in the TD and PD were summarized and shown in
Figure 9b and c. The data was further distinctively identified and grouped according to the observed failure features at crack initiation sites. The modal stress distribution on the fatigue region is also shown in
Figure 9a. The black dashed line represents the minimum cross-section, which is defined as the origin of the vertical axis. The positive axis is from the clamp edge to the sample tip edge. The red double dot dash line represents the position of the maximum stress, i.e., theoretical weak section. From
Figure 9b and 9c, it can be observed that for both orientated samples, the fracture position exhibits significant variation between the DRF and DFF group. Specifically, a large scatter in the fracture position is observed for the DRF group; most of the position is distributed between −2.4 and 2.6 mm in TD; and between −2.4 and 1.9 mm in PD. However, the scatter appears to decrease for the DFF group; most of the fracture position is distributed between −1 and 0.7 mm. These findings indicate that defects contribute to the local stress field, thereby influencing the fatigue failure and resulting in a drift in the fracture position.
Considering that a significant number of fracture position deviate from the maximum stress position, there may be large differences between true maximum stress (σf-max) at the fracture position and reference maximum stress (σref-max). The farther the fracture position is from the maximum stress position, the lower the stress at the fracture position. Therefore, a modification of σref-max is prerequisite to obtain σf-max. σf-max was calculated based on the relation between the continuous stress distribution curves and the fracture position.
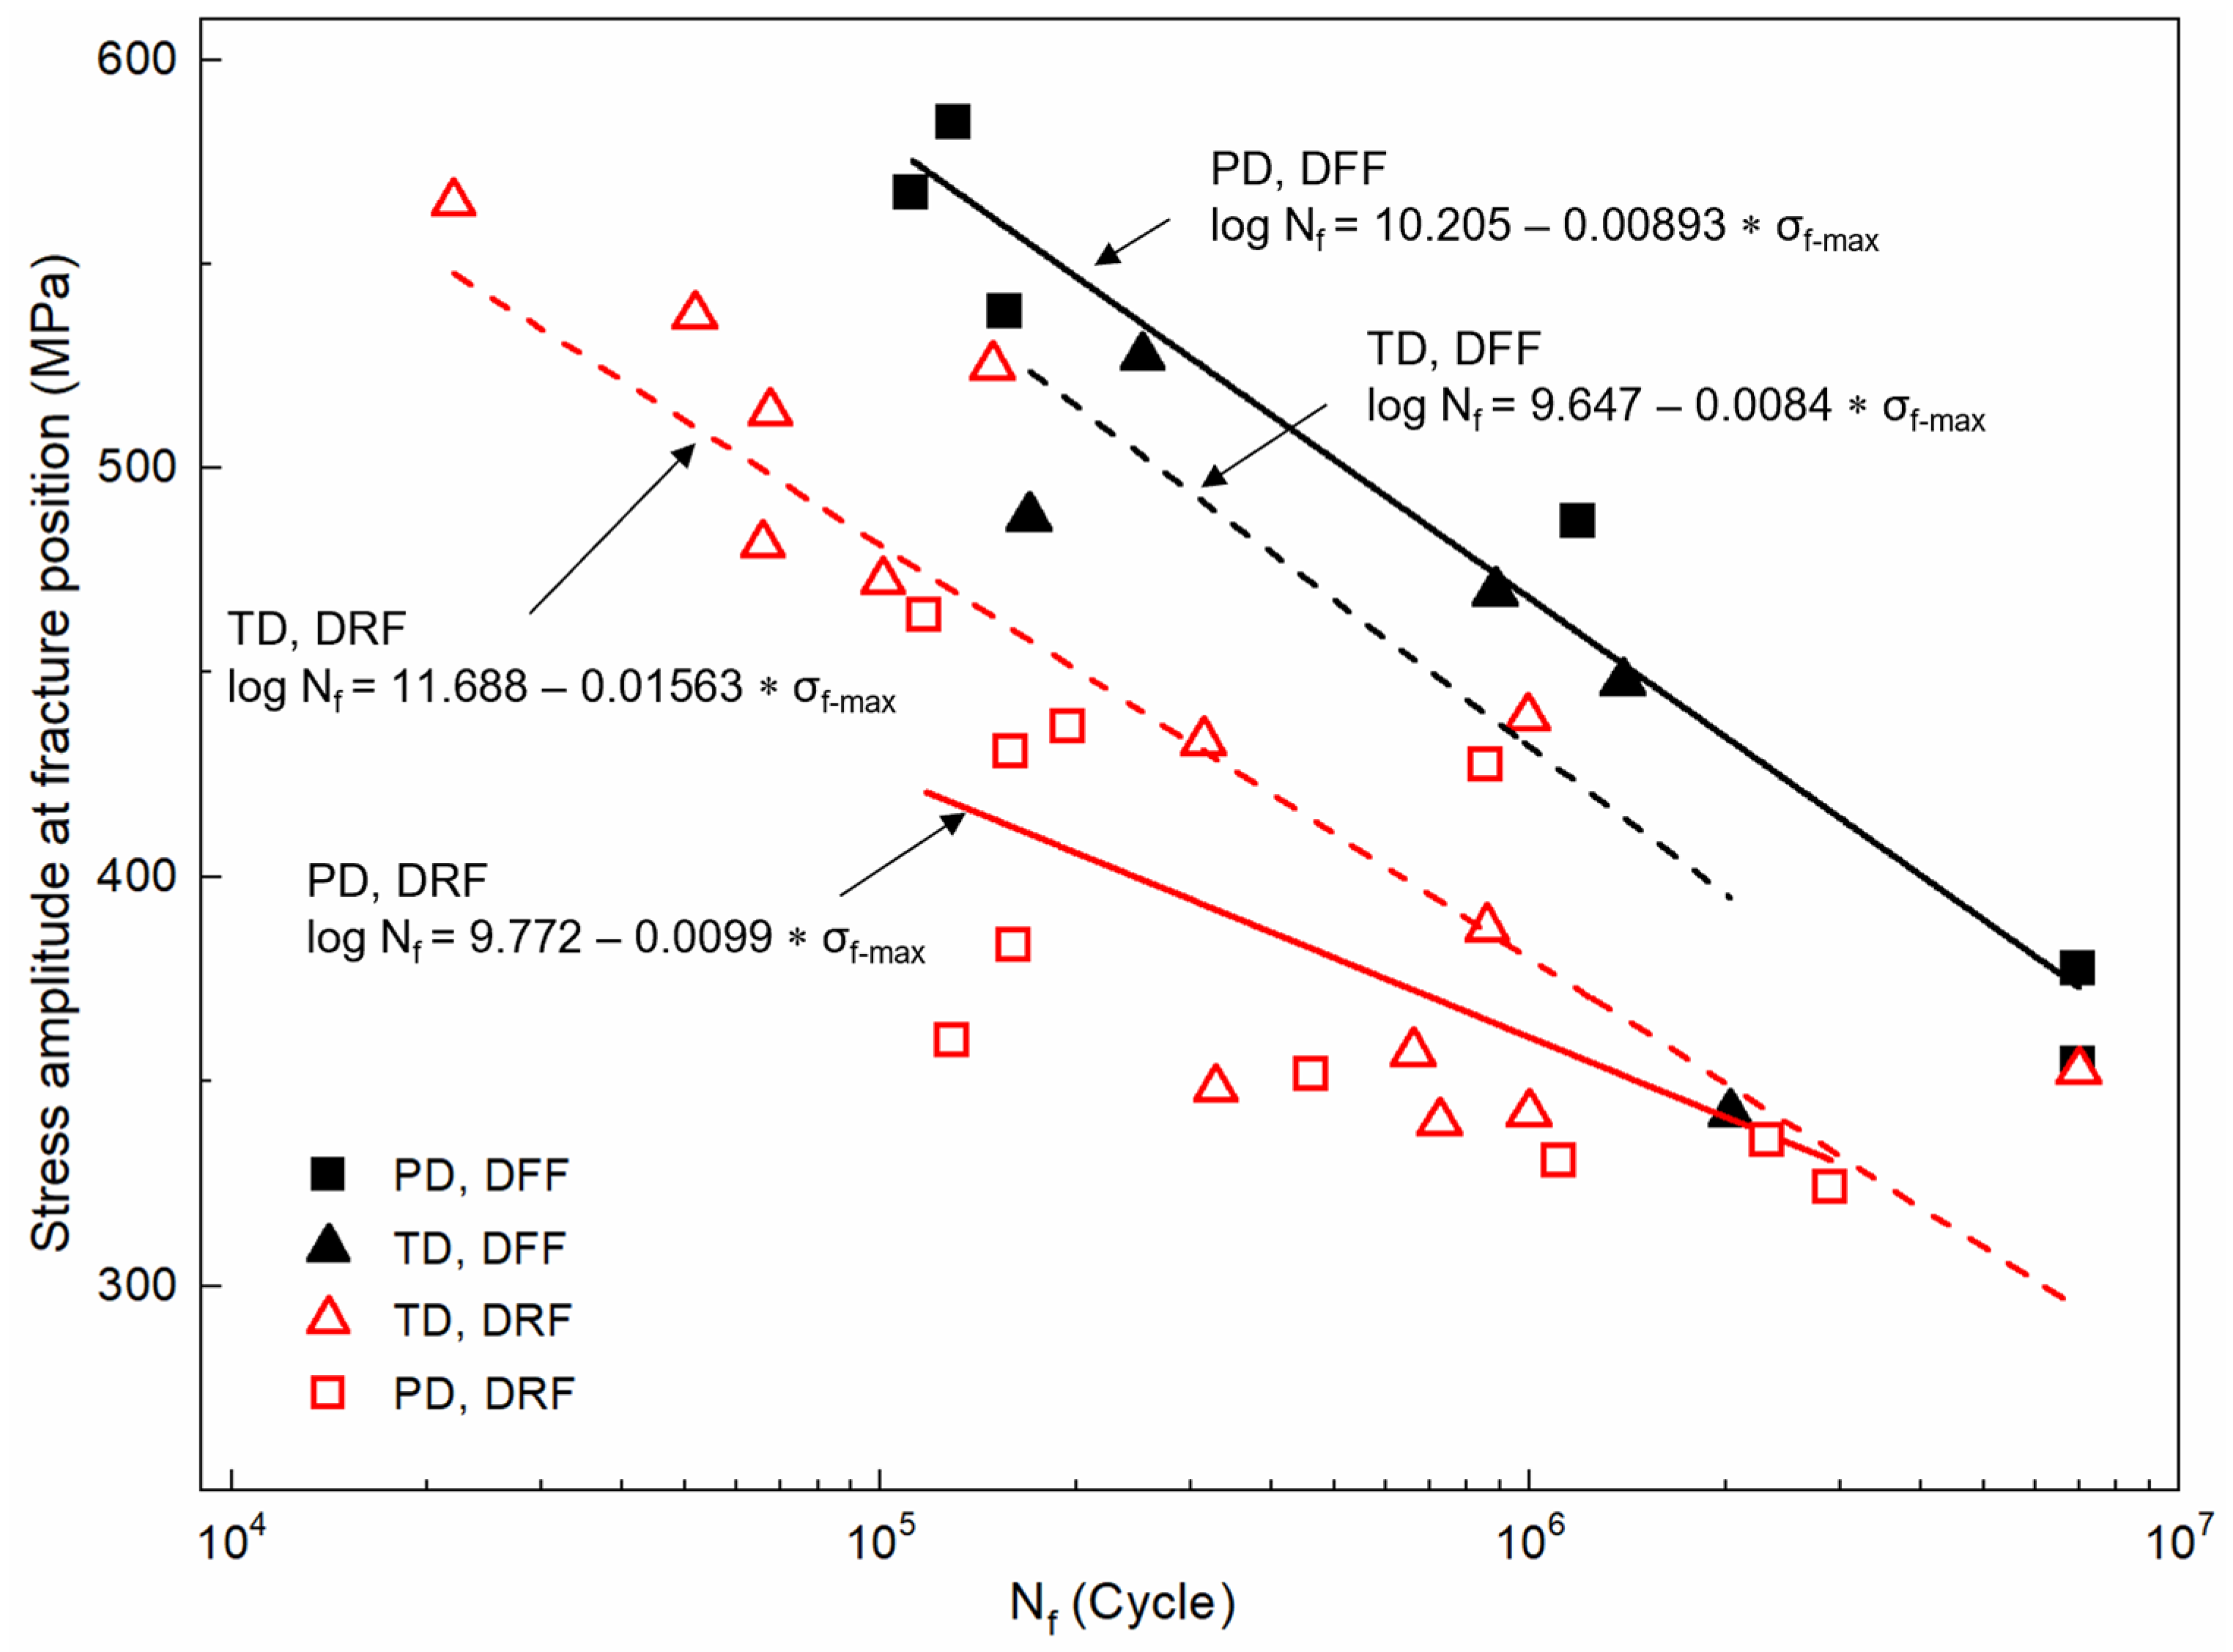
Figure 10 shows the fatigue S–N data in terms of the σ
f-max value versus N
f. The PD samples are denoted by square symbol, while the TD samples are denoted by triangle symbol. It is evident that the vibration fatigue lives exhibit significant dispersion, with the scatter of fatigue lives spanning two orders of magnitude, particularly at low-level stress. The PD samples demonstrate a more dispersed fatigue life compared to the TD samples. Linear fit was performed on the S–N data in the TD and PD, indicated by the blue solid and dashed lines in the figure. Clearly, the fatigue properties in the TD and PD are similar, indicating that the influence of sample orientation on fatigue lives is not easily distinguishable without considering the fatigue failure features.
The data for the DRF and DFF are distinguished by different-colored legends, as in
Figure 10. Four red and black lines were obtained by linear fit of the S–N data for each set data. It is evident that the fatigue lives of the DFF group, both in TD and PD, is generally higher than that of the DRF group under the same σ
f-max. This difference in fatigue lives can be attributed to the high sensitivity of fatigue performance to defects, as these defects reduce the crack resistance under vibration loading. Meanwhile, vibration fatigue behavior for both the DRF and DFF group exhibit apparent anisotropy. For the DFF group, the PD samples show better fatigue performance compared to the TD ones. However, for the DRF group, the TD samples exhibit higher fatigue lives than the PD ones under high-level stress. Notably, the fatigue lives of the TD and PD samples shows little difference when the applied stress is relatively low (less than 350 MPa).
4. Discussion
4.1. Effect of Columnar Grains Orientation on the Anisotropic Fatigue
It was previously found that there are three main factors affecting the anisotropic fatigue behavior of LAM materials: residual stress, process-induced defect, and directional microstructure. Considerable residual tensile stress is often present on the surface of deposited Ti-6Al-4V alloy along deposition direction [
41], and it can reduce the fatigue resistance of PD samples. However, in this paper, the residual stress has been eliminated through the subsequent solution and aging treatment, as mentioned in 2.1. Thus, residual stress is unlikely to be the primary cause of the observed anisotropic vibration fatigue properties.
As for the DFF group, fatigue performance of the PD samples is found to be superior to the TD ones, which is consistent with what is reported in [
26,
42,
43]. Since no significant defects were observed at crack initiation sites, defects are not considered to be the main cause of the anisotropy. Instead, the anisotropic fatigue performance is more likely related to the directional microstructure.
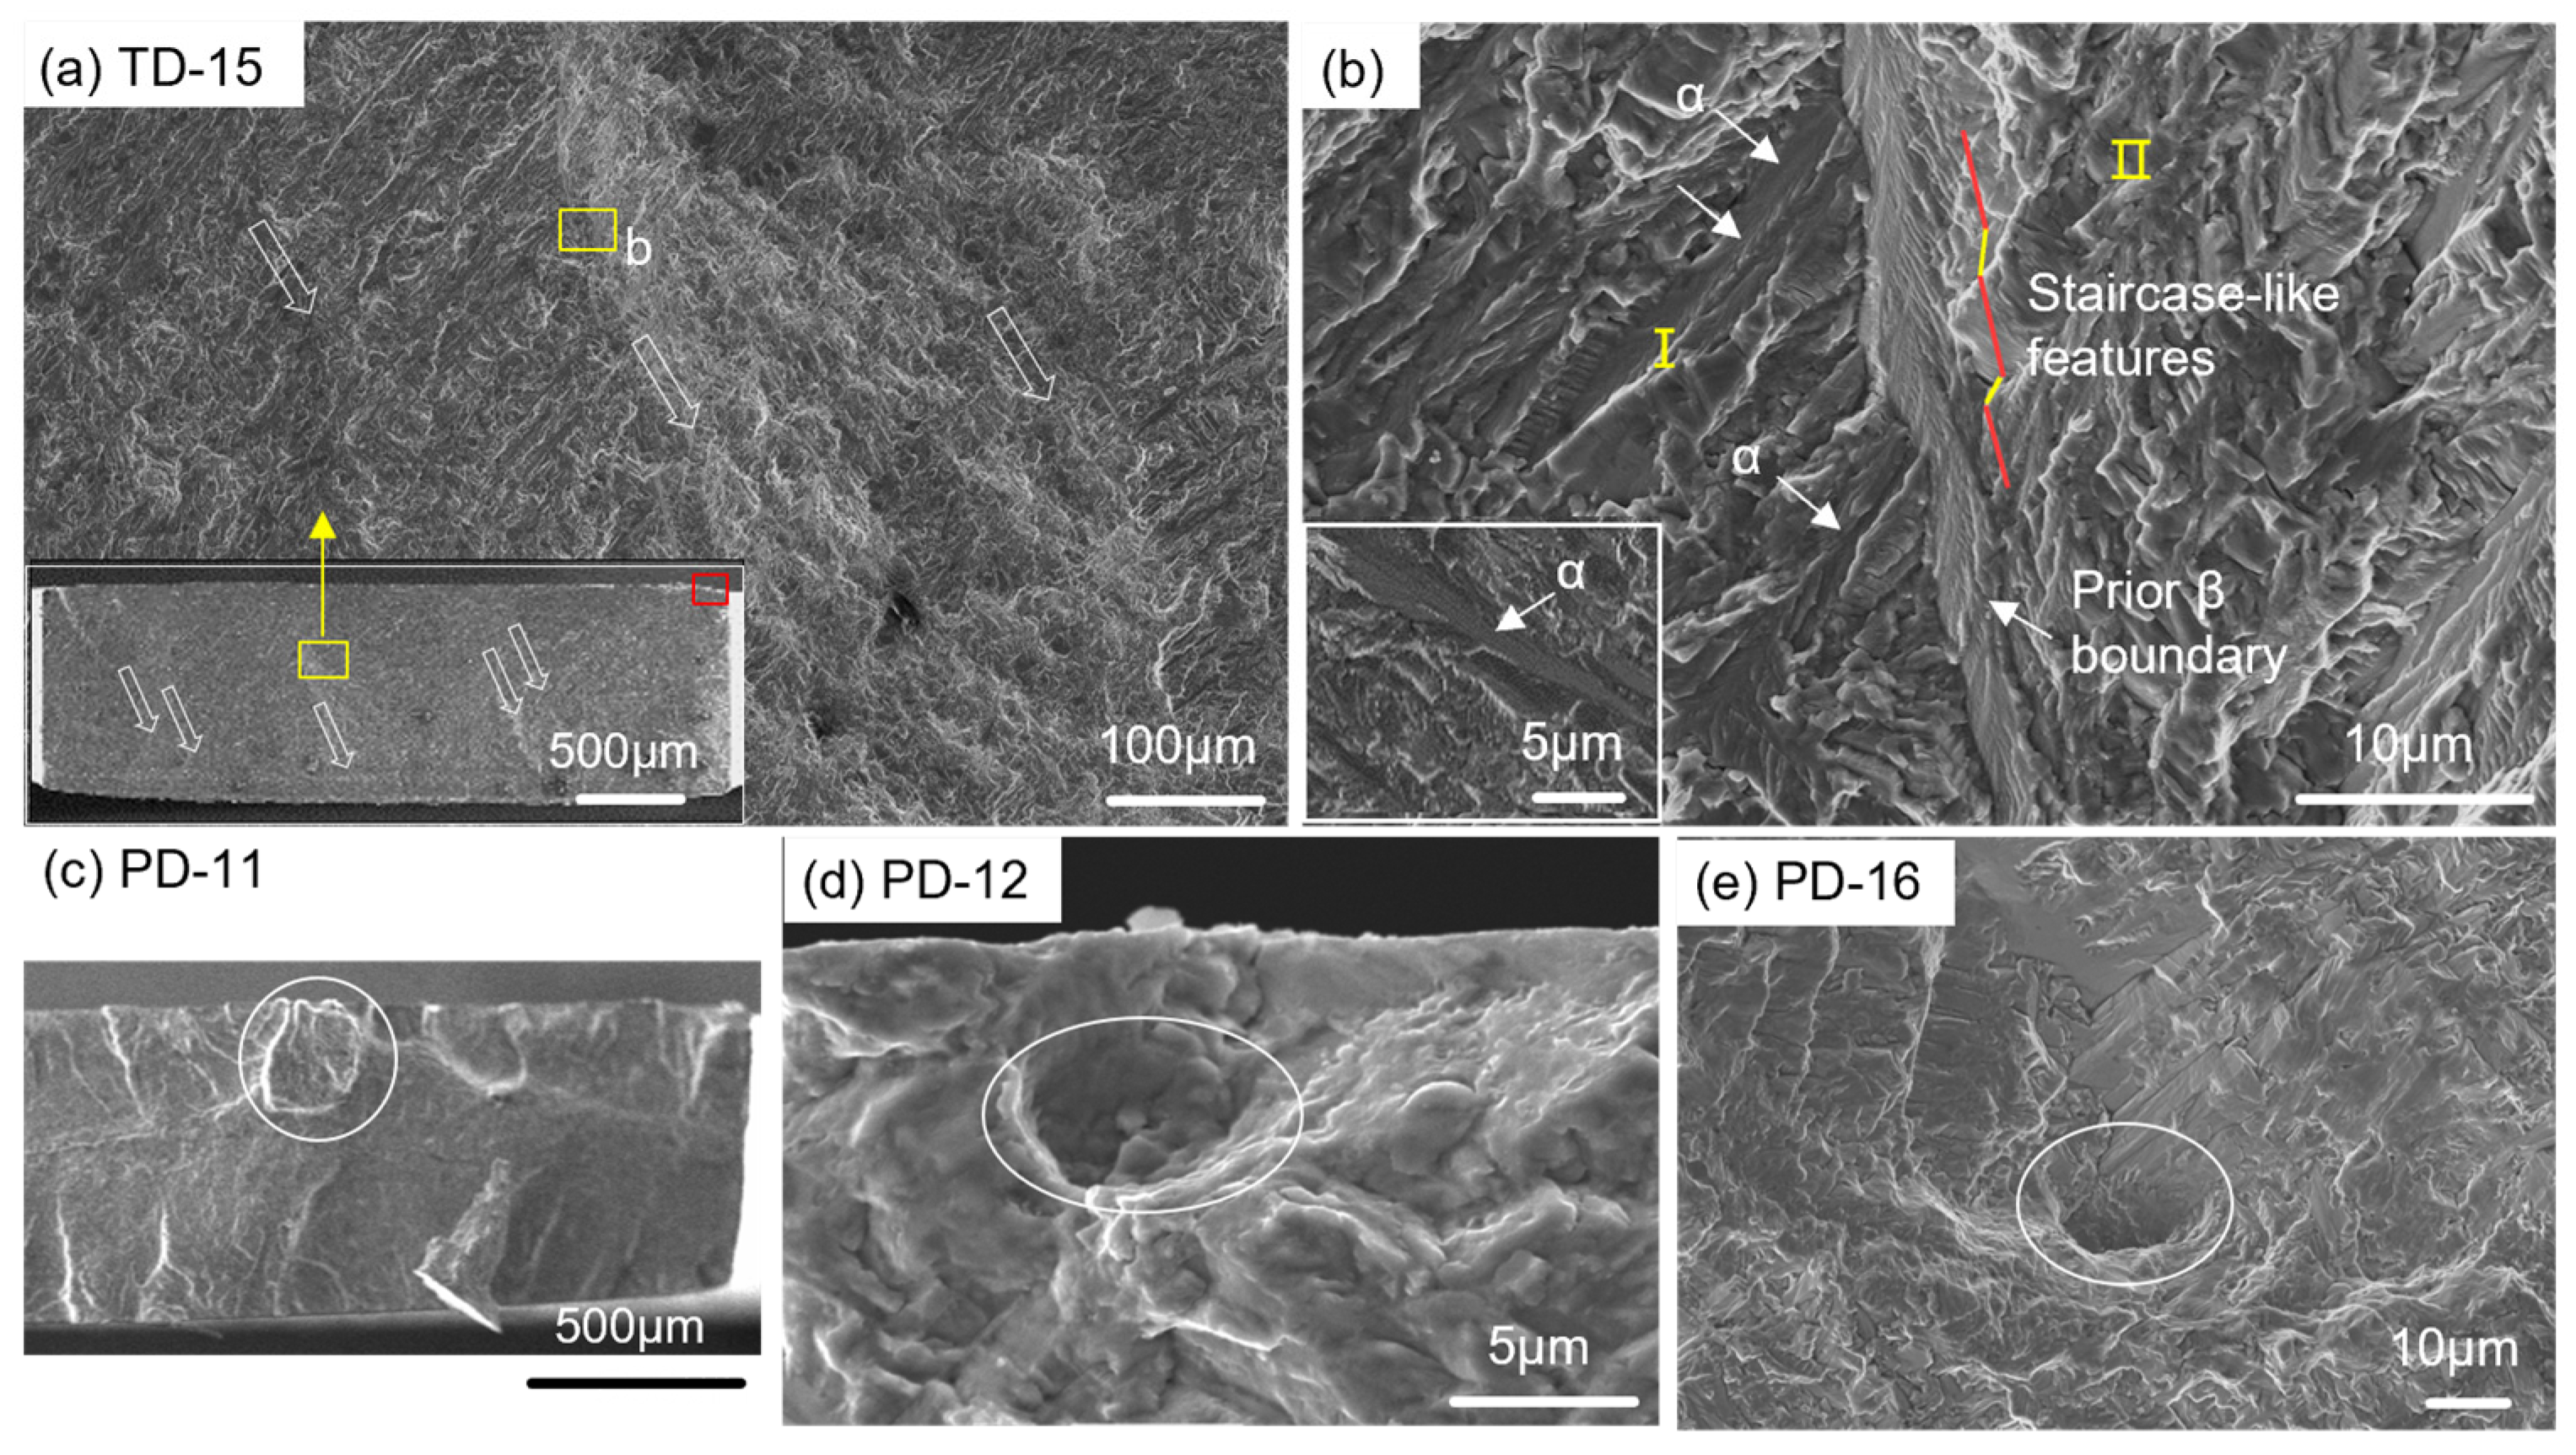
Figure 11 shows representative fracture surfaces from the DFF group in the two directions, exhibiting distinct characteristic features. In the TD sample, multiple small slopes alternate in fatigue crack propagation zone along the sample width direction, i.e., the scanning direction. The elongated features (parallel to the hollow arrows) resemble the shape of columnar grains,
Figure 11a. The width and the indicated orientation of these features agree well with the microstructural characterization presented in X–Z plane (
Figure 2). At higher magnification, different appearance of the fatigue crack propagation paths can be observed. Parallel α-laths are commonly found in region I, which appears smoother compared to region II. Additionally, a few staircase-like features are present along the fatigue crack propagation path in region II. The different appearance could be attributed to the different slip characteristics in different regions. This may be because both sides of the β boundaries belong to different β grains. In the PD samples, the fracture surfaces exhibit pronounced or concaves morphologies, as indicated by the ellipses (
Figure 11c–e). These features align with the equiaxed grains presented in X–Y plane (
Figure 2). These features may be related to the fact that the fracture surfaces of the PD samples belong to the X-Y plane.
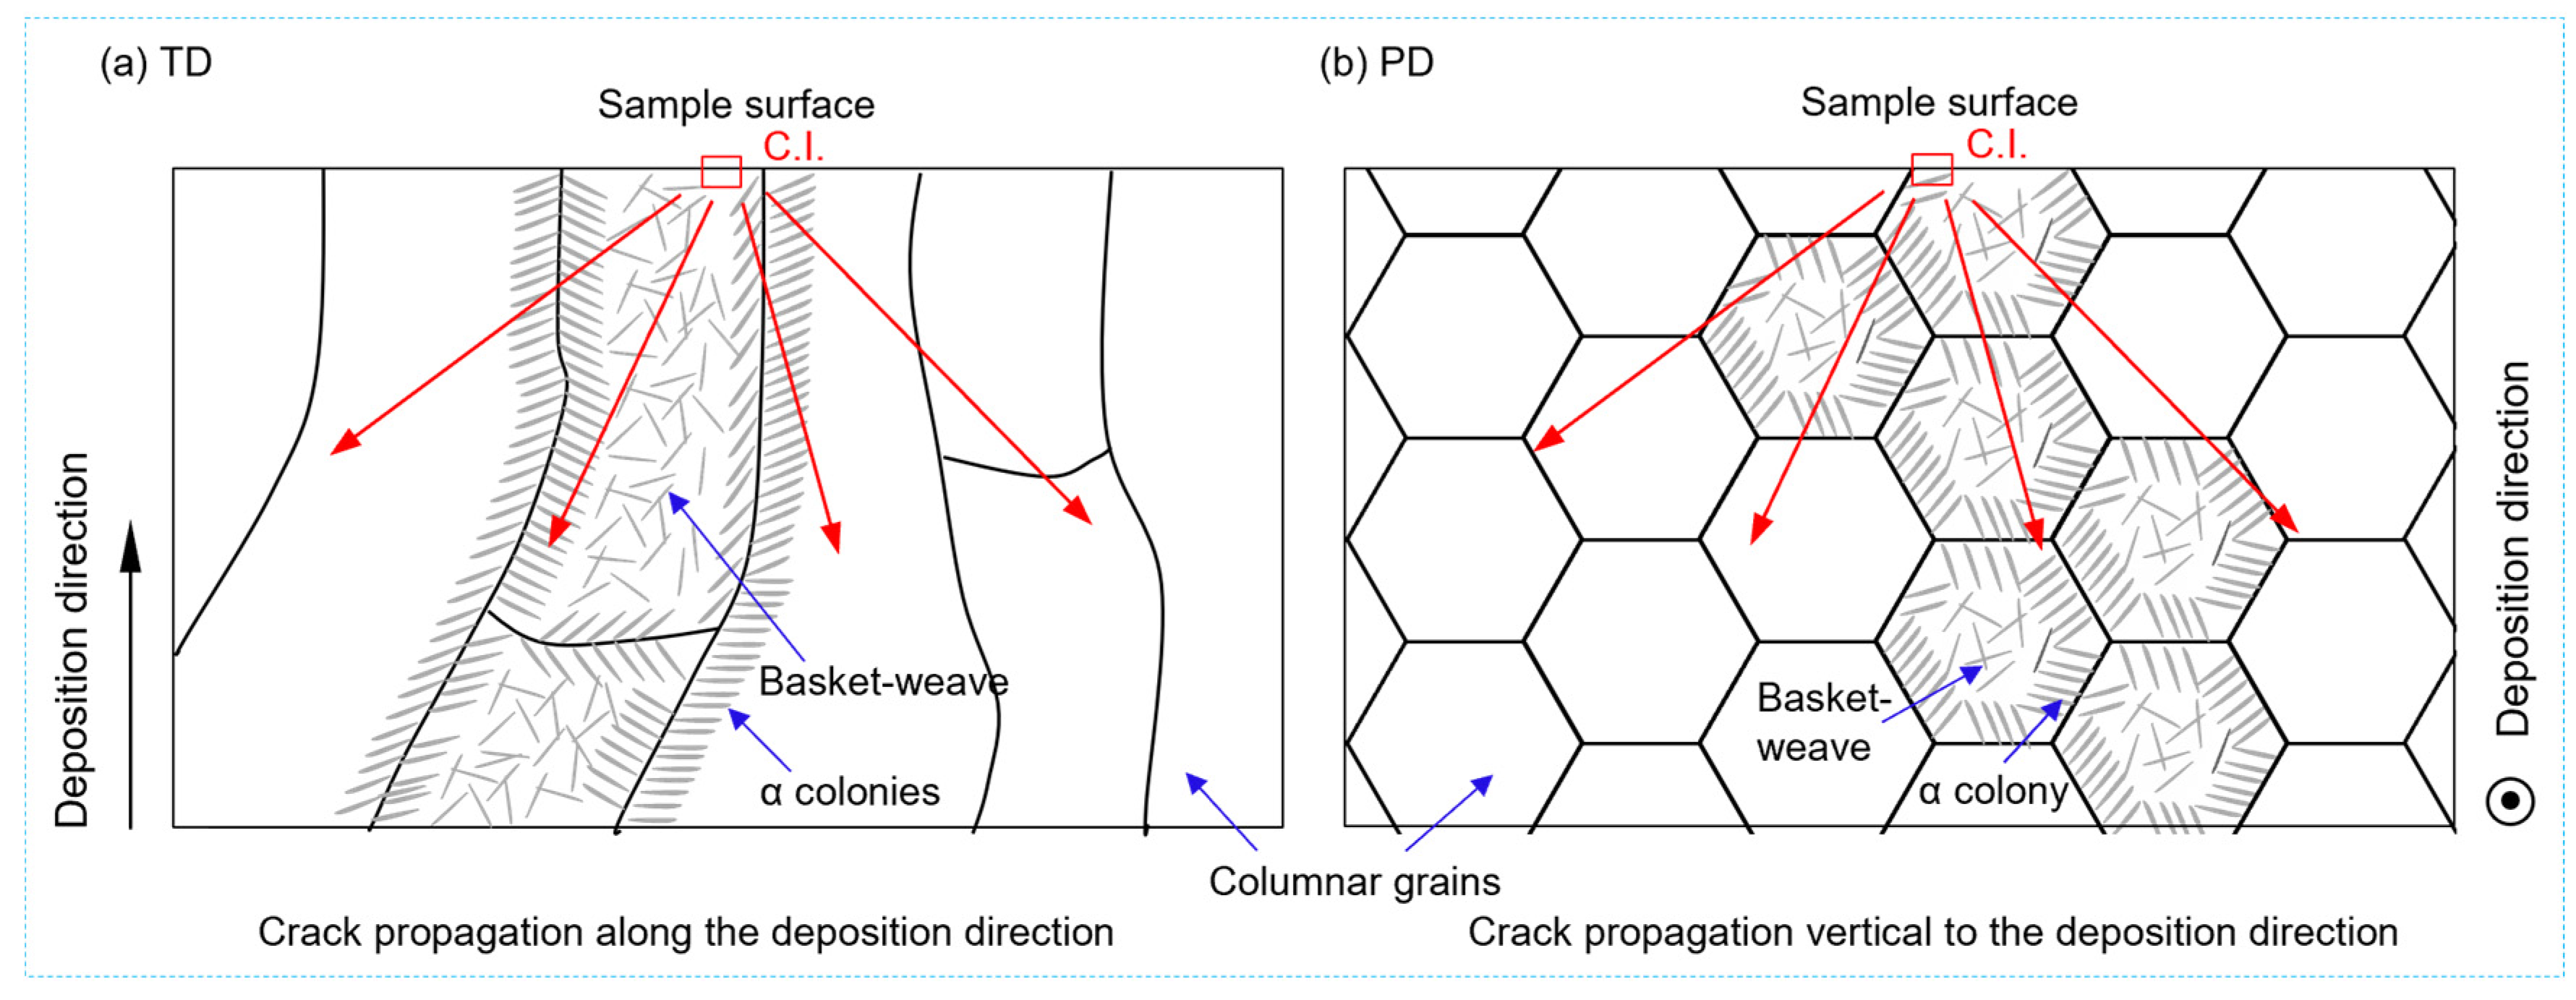
Figure 12 illustrates a schematic diagram indicating fatigue crack propagation direction with respect to the columnar grains or deposition direction. In LAM, columnar grains extend along the deposition direction and exhibit elongated features. The density of GBs along the scanning direction is significantly higher compared to along the deposition direction. For the TD sample, fatigue cracks typically propagate along the deposition direction, and encounter the lower density GBs. Conversely, for the PD sample, fatigue cracks propagate perpendicular to the deposition direction, and encounter the higher density GBs. The density of GBs is positively correlated with crack growth resistance. Therefore, less resistance occurs on the crack propagation path for the TD sample, and therefore, they experience less deflection in the path. However, a higher crack growth resistance can be expected for the PD sample,
Figure 12b. The obstruction of fatigue crack propagation due to the higher density GBs is the likely cause for the higher fatigue performance of the PD sample. Additionally, the presence of β grain boundary α colonies are also considered to contribute to the anisotropy of the material's fatigue property. When crack propagation encounters GBs, it interacts with the α colonies. Xie et al. [
44,
45] demonstrated that the colonies have higher fatigue crack propagation resistance compared to basket-weave structures. Therefore, the high density of grain boundary α colonies in the PD also contributes to the higher crack propagation resistance.
4.2. Effect of Process-induced Defects
As for the DRF group, at high-level stress (from 350 MPa to 600 MPa), the vibration fatigue performance of TD samples is superior to PD samples, consistent with previous reports [
25,
46]. However, at low-level stress (less than 350 MPa), the level of anisotropy in fatigue performance decreases with the rise of the number of cycles (
Figure 10). These indicate that both defects within the LAM material and applied stresses may affect the vibration fatigue lives of the DRF group. Representative fracture surfaces of the DRF group in the two directions fatigued at similar stress level of 500 MPa and 370 MPa are examined, as in
Figure 8. The defect failure features, especially the LoF defects with sharp angles, at crack initiation sites for the TD and PD samples are different. For the TD samples, besides a few voids which caused by entrapped gas during manufacturing, LoF defects can be observed with a narrow appearance on X–Z plane (
Figure 8a). However, for the PD samples, the LoF defects can cover a broad cross-sectional region on X–Y plane (
Figure 8d and 8e). This is just attributed to the fact that the loading direction is perpendicular to the elongated LoF defects for the PD samples, while along the LoF defects for the TD ones. The LoF defects, which cover a broad cross-sectional region on the X–Y plane, results in a larger reduction in load-bearing area. On the contrary, narrow LoF defects, which were generally obtained for the TD samples, exhibits a smaller reduction in load-bearing area. The larger reduction in load-bearing area for PD samples may result in an increase in the actual loading force. The sharp angles of the LoF defects could result in local stress concentrations and lead to early fracture [
47]. Hence, both the reduced load-bearing area and the increased level of stress concentration reduces the fatigue lives, particularly that of PD samples. Furthermore, after approximately ~ 10
5 cycles, the reduced loading force results in a decrease in stress concentration around the defects, reducing the difference in fatigue response between the two oriented samples.
5. Conclusions
In this paper, first-order bending vibration fatigue properties of LAM Ti-6Al-4V cantilever samples in different direction (PD & TD) was investigated. The vibration fracture morphology was observed, and the fracture position and fatigue lives were evaluated. The key findings can be summarized as follows:
(1) Process-induced defects (voids or lack-of-fusion defects) and α colonies located at or near the sample surfaces play a significant role in fatigue failure initiation. The samples with defect-related failure feature (DRF) at initiation sites exhibit inferior fatigue performance compared to the samples with defect-free failure feature (DFF).
(2) The fracture position varies depending on the failure features at crack initiation sites. For the DRF group, the fracture position shows a large dispersibility and is not necessarily localized at the maximum stress position. However, for the DFF group, the fracture position tends to be shifted towards the minimum cross-section.
(3) The vibration fatigue properties of both the DRF and DFF group show apparent anisotropy. For the DFF group, the PD samples exhibit better fatigue performance. This anisotropy is mainly controlled by the prior β columnar grains. The different obstruction of fatigue crack propagation due to the density of the grain boundaries in the two directions results in the anisotropic fatigue resistance, while the different fatigue crack resistance of the β grain boundary α colonies is believed to aggravate the anisotropy.
(4) In contrast, for the DRF group, the TD samples exhibit higher fatigue lives compared to the PD ones. This anisotropy is dominantly dependent on the LoF defects. The LoF defects present irregular shapes with the longest axis distributing predominantly vertical to the deposition direction. It leads to larger defects area and higher stress concentration in the PD samples than that in the TD samples, which significantly reduces the fatigue resistance. However, at low-level stress, the level of anisotropy in the fatigue performance decreases with the rise of the number of cycles.
Author Contributions
Conceptualization, Y.H., W.H and W.G.; formal analysis, Y.L.; funding acquisition, W.H and W.G.; investigation, Y.H. and S.Z.; methodology, Y.H., W.G., S.Z., and D.L.; project administration, W.H and W.G.; resources, W.G.; validation, W.H.; writing—original draft, Y.H. and W.H.; writing—review and editing, Y.H., W.H., S.Z., Y.L., and D.L. All authors have read and agreed to the published version of the manuscript. All authors have read and agreed to the published version of the manuscript.
Funding
This research was funded by the National Natural Science Foundation of China, grant number 12172292, 12072287 and 11872051, and the 111 Project, grant number BP0719007.
Institutional Review Board Statement
Not applicable.
Data Availability Statement
The data presented in this study are available on request from the corresponding author
Acknowledgments
The authors would like to thank State Key Laboratory of solidification Processing of Northwestern Polytechnical University for the material supply.
Conflicts of Interest
The authors declare no conflict of interest.
References
- Mohanavel, V.; Ali, K.S.A.; Ranganathan, K.; Jeffrey, J.A.; Rajkumar, S. The roles and applications of additive manufacturing in the aerospace and automobile sector. Proc. Mater. Today 2021, 47, 405–409. [Google Scholar] [CrossRef]
- Shamsaei, N.; Yadollahi, A.; Bian, L.; Thompson, S.M. An overview of Direct Laser Deposition for additive manufac-turing: Part II: Mechanical behavior, process parameter optimization and control. Addit. Manuf. 2015, 8, 12–35. [Google Scholar]
- Cersullo, N.; Mardaras, J.; Emile, P.; Nickel, K.; Holzinger, V.; Hühne, C. Effect of Internal Defects on the Fatigue Be-havior of Additive Manufactured Metal Components: A Comparison between Ti6Al4V and Inconel 718. Materials 2022, 15, 6882. [Google Scholar] [CrossRef]
- Sedlak, J.; Joska, Z.; Jansky, J.; Zouhar, J.; Kolomy, S.; Slany, M.; Svasta, A. Analysis of the Mechanical Properties of 3D-Printed Plastic Samples Subjected to Selected Degradation Effects. Materials 2023, 16, 3268. [Google Scholar] [CrossRef]
- Witek, L. Crack propagation analysis of mechanically damaged compressor blades subjected to high cycle fatigue. Eng. Fail. Anal. 2011, 18, 1223–1232. [Google Scholar] [CrossRef]
- Witek, L. Experimental crack propagation and failure analysis of the first stage compressor blade subjected to vibration. Eng. Fail. Anal. 2009, 16, 2163–2170. [Google Scholar] [CrossRef]
- Zhang, T.; Chen, W.; Guan, Y.; Gao, D. Study on titanium alloy TC4 ballistic penetration resistance Part I: Ballistic impact tests. Chinese J. Aeronaut 2012, 25, 388–395. [Google Scholar] [CrossRef]
- Zhang, T.; Chen, W.; Guan, Y.; Gao, D.; Li, S. Study on ballistic penetration resistance of titanium alloy TC4, Part II: Numerical analysis. Chinese J. Aeronaut 2013, 26, 606–613. [Google Scholar] [CrossRef]
- Masoomi, M.; Thompson, S.M.; Shamsaei, N.; Bian, L. Effects of Inter-Layer Time Interval on Temperature Gradients in Direct Laser Deposited Ti-6Al-4V. In Proceedings of the 27th Annual International Solid Freeform Fabrication Symposium–An Additive Manufacturing Conference, Austin, TX, USA, 8–10 August 2016; pp. 174–184. [Google Scholar]
- Pegues, J.W.; Shao, S.; Shamsaei, N.; Sanaei, N.; Fatemi, A.; Warner, D.H.; Li, P.; Phan, N. Fatigue of additive manufactured Ti-6Al-4V, Part I: The effects of powder feedstock, manufacturing, and post-process conditions on the resulting microstructure and defects. Int. J. Fatigue 2020, 132, 105358. [Google Scholar] [CrossRef]
- Azarniya, A.; Colera, X.G.; Mirzaali, M.J.; Sovizi, S.; Bartolomeu, F.; Weglowski, K.S. Additive manufacturing of Ti6Al4V parts through laser metal depositionn (LMD): Process, microstructure, and mechanical properties. J. Alloy Comp. 2019, 804, 163–191. [Google Scholar] [CrossRef]
- Kaletsch, A.; Qin, S.; Broeckmann, C. Influence of Different Build Orientations and Heat Treatments on the Creep Properties of Inconel 718 Produced by PBF-LB. Materials 2023, 16, 4087. [Google Scholar] [CrossRef]
- Li, P.; Guo, W.; Yuan, K.; Su, Y.; Wang, J.; Lin, X. Effects of processing defects on the dynamic tensile mechanical behavior of laser-solid-formed Ti-6Al-4V. Mater. Charact. 2018, 140, 15–29. [Google Scholar] [CrossRef]
- Zhang, Z.; Shen, J.; Bi, J.; Hu, S.; Zhen, Y.; Bu, X. Microstructure and Mechanical Properties of Weaving Wire and Arc Additive Manufactured AZ91 Magnesium Alloy Based on Cold Metal Transfer Technique. Materials 2023, 16, 4047. [Google Scholar] [CrossRef]
- Klimenov, V.; Kolubaev, E.; Anatoly, K.; Chumaevskii, A.; Ustinov, A.; Strelkova, A.; Rubtsov, V.; Gurianov, D.; Han, Z.; Nikonov, S.; Batranin, A.; Khimich, M. Influence of the Coarse Grain Structure of a Titanium Alloy Ti-4Al-3V Formed by Wire-Feed Electron Beam Additive Manufacturing on Strain Inhomogeneities and Fracture. Materials 2023, 16, 3901. [Google Scholar] [CrossRef]
- Zhang, Y.; Chen, Z.; Qu, S.; Feng, A.; Mi, G.; Shen, J. Multiple sub-variants and anisotropic mechanical properties of an additively-manufactured Ti-6Al-4V alloy. J. Mater. Sci. Technol. 2021, 70, 113–124. [Google Scholar] [CrossRef]
- Lu, J.; Chang, L.; Wang, J.; Sang, L.; Wu, S.; Zhang, Y. In-situ investigation of the anisotropic mechanical properties of laser direct metal deposition Ti6Al4V alloy. Mater. Sci. Eng. A 2018, 712, 199–205. [Google Scholar] [CrossRef]
- Raluca Condruz, J.; Matache, J.; Paraschiv, A.; Florian Frigioescu, T.; Badea, T. Microstructural and Tensile Properties Anisotropy of Selective Laser Melting Manufactured IN 625. Materials 2020, 13, 4829. [Google Scholar] [CrossRef]
- Kok, Y.; Tan, X.; Wang, P.; Nai, M.L.S.; Loh, N.H.; Liu, E. Anisotropy and heterogeneity of microstructure and mechanical properties in metal additive manufacturing: a critical review. Mater. Des. 2018, 139, 565–586. [Google Scholar] [CrossRef]
- Bandyopadhyay, A.; Upadhyayula, M.; Traxel, K.D.; Onuike, B. Influence of deposition orientation on fatigue response of LENS processed Ti6Al4V. Mater. Lett. 2019, 255, 126541. [Google Scholar] [CrossRef]
- Lv, H.; Zhang, Z.; Chen, Y.; Liu, Y.; Chen, H.; Chen, Y. The anisotropy of high cycle fatigue property and fatigue crack growth behavior of Ti–6Al–4V alloy fabricated by high-power laser metal deposition. Mater. Sci. Eng. A 2022, 853, 143745. [Google Scholar] [CrossRef]
- Fu, R.; Zheng, L.; Ling, C.; Zhong, Z.; Hong, Y. An experimental investigation of fatigue performance and crack initiation characteristics for an SLMed Ti-6Al-4V under different stress ratios up to very-high-cycle regime. Int. J. Fatigue 2022, 164, 107119. [Google Scholar] [CrossRef]
- Sterling, A.; Shamsaei, N.; Torries, B.; Thompson, S.M. Fatigue Behaviour of Additively Manufactured Ti-6Al-4V. In Proceedings of the 6th Fatigue Design Conference, Fatigue Design, Senlis, France 18–19 November 2015; pp. 576–589. [Google Scholar]
- Biswal, B.; Khadar Syed, A.; Zhang, X. Assessment of the effect of isolated porosity defects on the fatigue performance of additive manufactured titanium alloy. Addit. Manuf. 2018, 23, 433–442. [Google Scholar] [CrossRef]
- Masuo, H.; Tanaka, Y.; Morokoshi, S.; Yagura, H.; Uchida, T.; Yamamoto, Y. Influence of defects, surface roughness and HIP on the fatigue strength of Ti-6Al-4V manufactured by additive manufacturing. Int. J. Fatigue 2018, 117, 163–179. [Google Scholar] [CrossRef]
- Molaei, R.; Fatemi, A.; Sanaei, N.; Pegues, J.; Shamsaei, N.; Shao, S.; Li, P.; Warner, D.H.; Phan, N. Fatigue of additive manufactured Ti-6Al-4V, Part II: The relationship between microstructure, material cyclic properties, and component performance. Int. J. Fatigue 2020, 132, 105363. [Google Scholar] [CrossRef]
- George, T.J.; Seidt, J.; Herman Shen, M.H.; Nicholas, T.; Cross, C.J. Development of a novel vibration-based fatigue testing methodology. Int. J. Fatigue 2004, 26, 477–486. [Google Scholar] [CrossRef]
- Zou, S.; Wu, J.; Zhang, Y.; Gong, S.; Sun, G.; Ni, Z. Surface integrity and fatigue lives of Ti17 compressor blades subjected to laser shock peening with square spots. Surf. Coat Technol. 2018, 347, 398–406. [Google Scholar] [CrossRef]
- Angeli, A.; Cornelis, B.; Troncossi, M. Synthesis of Sine-on-Random vibration profiles for accelerated life tests based on fatigue damage spectrum equivalence. Mech. Syst. Signal. Process 2018, 103, 340–351. [Google Scholar] [CrossRef]
- Wang, L.; Zhou, L.; Liu, L.; He, W.; Pan, X.; Nie, X. Fatigue strength improvement in Ti-6Al-4V subjected to foreign object damage by combined treatment of laser shock peening and shot peening. Int. J. Fatigue 2022, 155, 106581. [Google Scholar] [CrossRef]
- Xu, W.; Zhao, Y.; Chen, X.; Zhong, B.; Yu, H.; He, Y. An Ultra-High Frequency Vibration-Based Fatigue Test and Its Comparative Study of a Titanium Alloy in the VHCF Regime. Metals 2020, 10, 1414. [Google Scholar] [CrossRef]
- Wanjara, P.; Gholipour, J.; Watanabe, E.; Watanabe, K.; Sugino, T.; Patnaik, P. High Frequency Vibration Fatigue Behavior of Ti6Al4V Fabricated by Wire-Fed Electron Beam Additive Manufacturing Technology. Adv. Mater. Sci. Eng. 2020, 1902567. [Google Scholar] [CrossRef]
- Ellyson, B.; Brochu, M.; Brochu, M. Characterization of bending vibration fatigue of SLM fabricated Ti-6Al-4V. Int. J. Fatigue 2017, 99, 25–34. [Google Scholar] [CrossRef]
- Ellyson, B.; Chekir, N.; Brochu, M.; Brochu, M. Characterization of bending vibration fatigue of WBD fabricated Ti-6Al-4V. Int. J. Fatigue 2017, 101, 36–44. [Google Scholar] [CrossRef]
- Zhao, S.; Yuan, K.; Guo, W.; He, Y.; Xu, Y.; Lin, X. A comparative study of laser metal deposited and forged Ti-6Al-4V alloy: Uniaxial mechanical response and vibration fatigue properties. Int. J. Fatigue 2019, 136, 105629. [Google Scholar] [CrossRef]
- Sheng, J.; Huang, S.; Zhou, J. Effect of laser peening with different energies on fatigue fracture evolution of 6061-T6 aluminum alloy. Opt. Laser Technol. 2016, 77, 169–176. [Google Scholar] [CrossRef]
- Dunstan, M. K.; Paramore, J. D.; Fang, Z. The effects of microstructure and porosity on the competing fatigue failure mechanisms in powder metallurgy Ti-6Al-4V. Int. J. Fatigue 2018, 116, 584. [Google Scholar] [CrossRef]
- Pilchak, A.L; Williams, R.E.A.; Williams, J.C. Crystallography of fatigue crack initiation and growth in fully lamellar Ti-6Al-4V. Metall. Mater. Trans. A 2010, 41, 106–124. [Google Scholar] [CrossRef]
- Nalla, R.K.; Boyce, B.L.; Campbell, J.P.; Peters, J.O.; Ritchie, R.O. Influence of microstructure on high-cycle fatigue of Ti-6Al-4V: bimodal vs. lamellar structures. Metall. Mater. Trans. A 2002, 33, 899–918. [Google Scholar] [CrossRef]
- Solberg, K.; Berto, F. The effect of defects and notches in quasi-static and fatigue loading of Inconel 718 specimens produced by selective laser melting. Int. J. Fatigue 2020, 137, 105637. [Google Scholar] [CrossRef]
- Sun, W.; Ma, Y.; Li, P.; Wang, Z. Residual stress and long fatigue crack growth behaviour of laser powder bed fused Ti6Al4V: Role of build direction. Int. J. Fatigue 2022, 160, 106850. [Google Scholar] [CrossRef]
- Sun, W.; Ma, Y.; Huang, W.; Zhang, W.; Qian, X. Effects of build direction on tensile and fatigue performance of selective laser melting Ti6Al4V titanium alloy. Int. J. Fatigue 2020, 130, 105260. [Google Scholar] [CrossRef]
- Chang, K.; Liang, E.; Huang, W.; Zhang, X.; Chen, Y.; Dong, J. Microstructural feature and mechanical property in different building directions of additive manufactured Ti6Al4V alloy. Mater. Lett. 2020, 267, 127516. [Google Scholar] [CrossRef]
- Xie, Y.; Gao, M.; Wang, F.; Zhang, C.; Hao, K.; Wang, H.; Zeng, X. Anisotropy of fatigue crack growth in wire arc additive manufactured Ti-6Al-4V. Mater. Sci. Eng. A 2018, 709, 265–269. [Google Scholar] [CrossRef]
- Vaezi, M.; Chianrabutra, S.; Mellor, B.; Yang, S. Multiple material additive manufacturing – Part 1: a review. Virt. Phys. Prototyp. 2013, 8, 19–50. [Google Scholar] [CrossRef]
- Bian, L.; Thompson, S.M.; Shamsaei, N. Mechanical Properties and Microstructural Features of Direct Laser-Deposited Ti-6Al-4V. JOM 2015, 67, 629–638. [Google Scholar] [CrossRef]
- Åkerfeldt, P.; Pederson, R.; Antti, M.L. A fractographic study exploring the relationship between the low cycle fatigue and metallurgical properties of laser metal wire deposited Ti–6Al–4V. Int. J. Fatigue 2016, 87, 245–256. [Google Scholar] [CrossRef]
Figure 1.
Schematic of LAM process.
Figure 1.
Schematic of LAM process.
Figure 2.
(a) Three-dimensional metallography of the LAM Ti-6Al-4V. Microstructure in (b, c) deposition direction and (d, e) scanning direction.
Figure 2.
(a) Three-dimensional metallography of the LAM Ti-6Al-4V. Microstructure in (b, c) deposition direction and (d, e) scanning direction.
Figure 3.
Representative defects in LAM Ti-6Al-4V: (a) circular void, (b) irregular LoF defect. (c–e) X-ray computed tomography scan results.
Figure 3.
Representative defects in LAM Ti-6Al-4V: (a) circular void, (b) irregular LoF defect. (c–e) X-ray computed tomography scan results.
Figure 4.
(a) Schematic of the tested samples in different orientations. Geometries (unit: mm) of (b) vibration fatigue sample.
Figure 4.
(a) Schematic of the tested samples in different orientations. Geometries (unit: mm) of (b) vibration fatigue sample.
Figure 5.
Vibration fatigue experimental setup.
Figure 5.
Vibration fatigue experimental setup.
Figure 6.
Modal analysis of Ti-6Al-4V sample by ABAQUS: (a) detail of the meshing, (b) displacement distribution, (c) stress distribution, and (d) stress distribution curve along the central path at different tip displacement. (e) Fitting curve for the maximum stress amplitude and sample tip displacement.
Figure 7.
(a) Force analysis of cantilever sample. Representative fatigue fracture surfaces: (b) the macroscopic fracture, (b´) stress distribution on the cross-section of the notch root, (c–e) the crack initiation site, (f, g) the crack propagation zone, and (h) the fast fracture zone.
Figure 7.
(a) Force analysis of cantilever sample. Representative fatigue fracture surfaces: (b) the macroscopic fracture, (b´) stress distribution on the cross-section of the notch root, (c–e) the crack initiation site, (f, g) the crack propagation zone, and (h) the fast fracture zone.
Figure 8.
Comparison of fatigue failure features at crack initiation sites in TD and PD: (a, b, d, e) DRF, and (c, f) DFF. Note: σref-max-reference maximum stress, σf-max-true maximum stress at fracture position.
Figure 8.
Comparison of fatigue failure features at crack initiation sites in TD and PD: (a, b, d, e) DRF, and (c, f) DFF. Note: σref-max-reference maximum stress, σf-max-true maximum stress at fracture position.
Figure 9.
(a) Local stress distribution from ABAQUS. Fracture position of (b) DRF group, and (c) DFF group.
Figure 9.
(a) Local stress distribution from ABAQUS. Fracture position of (b) DRF group, and (c) DFF group.
Figure 10.
S–N data of LAM samples. The stress values were presented by the true stress at fracture position.
Figure 10.
S–N data of LAM samples. The stress values were presented by the true stress at fracture position.
Figure 11.
Representative fracture surfaces of the DFF group from (a, b) TD and (c–e) PD samples. The hollow arrows in (a) indicate β grain orientation.
Figure 11.
Representative fracture surfaces of the DFF group from (a, b) TD and (c–e) PD samples. The hollow arrows in (a) indicate β grain orientation.
Figure 12.
Schematics indicating crack propagation along and vertical to the columnar grains: (a) TD sample, (b) PD sample. C.I. represents the crack initiation site.
Figure 12.
Schematics indicating crack propagation along and vertical to the columnar grains: (a) TD sample, (b) PD sample. C.I. represents the crack initiation site.
Table 1.
Chemical compositions of the Ti-6Al-4V powders (wt%).
Table 1.
Chemical compositions of the Ti-6Al-4V powders (wt%).
| Element |
Al |
V |
Fe |
Si |
C |
N |
H |
O |
Ti |
| Mass fraction |
6.02 |
4.00 |
0.098 |
0.033 |
0.025 |
0.04 |
0.008 |
0.16 |
Bal. |
Table 2.
LAM processing parameters.
Table 2.
LAM processing parameters.
| Laser power, kW |
Scanning velocity, mm/min |
Powder feeding rate, g/min |
Overlap ratio, % |
| 7 |
600–900 |
40–60 |
30–50 |
Table 3.
Parameters of the shaker.
Table 3.
Parameters of the shaker.
| Frequency |
Maximum
excitation force |
Maximum
acceleration |
Excitation
power |
Maximum peak to
peak displacement |
| 10-500 Hz |
2 kN |
45 g 1
|
2.2 kW |
± 20 mm |
Table 4.
The material and model parameters in ABAQUS analysis.
Table 4.
The material and model parameters in ABAQUS analysis.
| Young modulus |
Poisson ratio |
Density |
Element type |
Number of elements |
Number of nodes |
| 116 GPa |
0.27 |
2730 kg/m3
|
C3D8R |
124,676 |
198,376 |
Table 5.
Information about fatigue experiments results and observed failure features at crack initiation sites.
Table 5.
Information about fatigue experiments results and observed failure features at crack initiation sites.
| Sample |
A,
mm |
σref-max,
MPa |
σf-max,
MPa |
Nf,
×104
|
Failure
Feature |
Sample |
A,
mm |
σref-max, MPa |
σf-max,
MPa |
Nf,
×104
|
Failure
Feature |
| TD-1 |
5.78 |
580 |
565 |
2.20 |
DRF 1
|
PD-1 |
4.75 |
504 |
464 |
11.70 |
DRF |
| TD-2 |
5.50 |
580 |
537 |
5.17 |
DRF |
PD-2 |
4.47 |
450 |
427 |
19.45 |
DRF |
| TD-3 |
5.25 |
550 |
514 |
6.77 |
DRF |
PD-3 |
4.40 |
500 |
430 |
15.90 |
DRF |
| TD-4 |
4.92 |
500 |
481 |
6.59 |
DRF |
PD-4 |
4.37 |
450 |
427 |
85.45 |
DRF |
| TD-5 |
4.83 |
500 |
472 |
10.09 |
DRF |
PD-5 |
3.92 |
400 |
383 |
16.05 |
DRF |
| TD-6 |
4.80 |
550 |
525 |
14.86 |
DRF |
PD-6 |
3.68 |
368 |
360 |
12.88 |
DRF |
| TD-7 |
4.49 |
450 |
433 |
99.28 |
DRF |
PD-7 |
3.60 |
400 |
352 |
46.05 |
DRF |
| TD-8 |
4.43 |
450 |
439 |
31.45 |
DRF |
PD-8 |
3.43 |
350 |
336 |
231.88 |
DRF |
| TD-9 |
3.97 |
400 |
388 |
86.05 |
DRF |
PD-9 |
3.38 |
368 |
330 |
110.80 |
DRF |
| TD-10 |
3.65 |
365 |
357 |
66.05 |
DRF |
PD-10 |
3.32 |
350 |
324 |
290.88 |
DRF |
| TD-11 |
3.61 |
365 |
348 |
697.00 |
DRF |
PD-11 |
5.98 |
600 |
584 |
13.00 |
DFF |
| TD-12 |
3.56 |
365 |
353 |
32.88 |
DRF |
PD-12 |
5.80 |
580 |
567 |
11.17 |
DFF |
| TD-13 |
3.50 |
350 |
342 |
99.82 |
DRF |
PD-13 |
5.50 |
550 |
538 |
15.57 |
DFF |
| TD-14 |
3.48 |
350 |
340 |
72.62 |
DRF |
PD-14 |
4.98 |
498 |
487 |
118.60 |
DFF |
| TD-15 |
5.39 |
550 |
527 |
25.33 |
DFF 2
|
PD-15 |
3.86 |
400 |
378 |
698.00 |
DFF |
| TD-16 |
5.37 |
480 |
470 |
88.5 |
DFF |
PD-16 |
3.62 |
368 |
354 |
690.00 |
DFF |
| TD-17 |
4.99 |
500 |
488 |
16.95 |
DFF |
|
|
|
|
|
|
| TD-18 |
4.58 |
480 |
448 |
139.00 |
DFF |
|
|
|
|
|
|
| |
TD-19 |
3.50 |
350 |
342 |
203.62 |
DFF |
|
|
|
|
|
|
|
Disclaimer/Publisher’s Note: The statements, opinions and data contained in all publications are solely those of the individual author(s) and contributor(s) and not of MDPI and/or the editor(s). MDPI and/or the editor(s) disclaim responsibility for any injury to people or property resulting from any ideas, methods, instructions or products referred to in the content. |
© 2023 by the authors. Licensee MDPI, Basel, Switzerland. This article is an open access article distributed under the terms and conditions of the Creative Commons Attribution (CC BY) license (https://creativecommons.org/licenses/by/4.0/).
