Submitted:
21 June 2023
Posted:
26 June 2023
You are already at the latest version
Abstract
The integration of transportation systems with land use through the Transit-Oriented Development (TOD) model can effectively promote sustainable development in cities. By increasing the intensive use of land within the supply capacity of urban public transportation, this model can comprehensively improve the efficiency of urban transportation and land use, while also addressing problems such as traffic congestion and environmental pollution. To implement this model, a "Node-Place-Function" (NPF) framework is proposed based on the coordination degree between rail transit and land use in Qingdao. A comprehensive evaluation system is constructed to quantitatively assess the TOD level and comprehensive development level of land use around rail transit stations from three dimensions. By applying the NSGA-II genetic algorithm, a land use allocation optimization model is developed to maximize rail transit station accessibility, land economic benefits, and environmental comfort. The research results guide other cities in China to implement TOD in land use planning and promote coordinated development between urban rail transit and land use.
Keywords:
TOD
; urban rail transit
; land use
; Node-Place-Function model
; NSGA-II algorithm
1. Introduction
Selecting a reasonable urban form and matching transportation systems is one of the core issues facing today's urban development [1,2,3]. As of the end of 2021, China's urban population reached 914.25 million, with an urbanization rate of as high as 64.72%. Urban problems such as traffic congestion, low land utilization, and environmental deterioration are increasingly prominent [4,5]. There has been significant interest from academic and professional communities in planning strategies aimed at mitigating urban transportation pressure, fostering coordinated urban land use and transportation development, and promoting overall urban development [6,7]. In the process of promoting the coordinated development of urban transportation, TOD is undoubtedly the most successful model that previous researchers have worked on [8,9,10]. The TOD model was proposed by the famous American urban planning and design expert Peter Calthorpe in 1993 [11], As a comprehensive solution that combines urban land use planning, transportation engineering planning, and design, the TOD model has gradually evolved into a public transportation-oriented urban development model and has been widely recognized and applied worldwide [12]. In recent years, successful TOD projects have been established around subway stations in various parts of the world, such as the United States [13], Japan[14,15], Europe, and Singapore. In China, cities such as Beijing[16,17], Shanghai [18,19], Shenzhen, and Chengdu have also accelerated the development pace of TOD cities. In this context, optimizing the land use around urban rail transit stations based on the TOD concept can provide urban planners with more practical and effective land planning solutions for the areas surrounding rail transit stations.
Over the past few years, scholars both domestically and internationally have primarily concentrated their research efforts on two main aspects of the TOD model. The development of TOD planning tools and the evaluation of the implementation effects of TOD projects [3]. Common TOD planning tools mainly include land use planning [20] and transportation planning. Establishing a sustainable and efficient public transportation system that meets the commuting needs of urban residents is the primary objective of urban transportation planning, with the ultimate goal of promoting the sustainable development of cities [21]. Developing a high-capacity, fast, and high-quality rail transit system can meet the enormous demand for transportation within the city, and the travel preferences of people within the influence range of rail transit stations are directly affected by land use around the stations. From the perspective of TOD, reasonable land development intensity and diversity of land use can improve the accessibility within the city, reduce passengers' transfer costs, and increase the utilization rate of rail transit systems [22,23]. Therefore, the land use planning problem around urban rail transit stations can be transformed into a multi-objective optimization problem [24]. Planners can use mathematical programming models to rationally coordinate multiple conflicting objectives by changing the proportions and spatial distribution of different land use types. According to the TOD theory, the impact range of rail transit stations on the surrounding land is usually within 400 to 800 meters [25,26], Especially in urban commercial centers, the impact range of multiple rail transit stations may partially overlap, and passengers will choose one of the stations based on a comprehensive consideration of factors such as walking distance and land use type [27,28]. Therefore, scholars prefer to set the coverage range of rail transit stations by defining the service radius of public transportation as 600 meters (a 5-10 minute walking distance) [29,30].
In terms of evaluating the implementation effects of TOD projects, researchers often use Multi-Criteria Decision Analysis (MCDA) models to comprehensively evaluate the effects of TOD projects based on different indicators and classify rail transit stations into different TOD types. Based on existing literature, the classification of TOD types can be mainly divided into quantitative and qualitative methods [3,31]. Qualitative classification methods divide TOD areas into different types based on factors such as urban form and function, land use zoning, and service level [32], Quantitative classification methods determine the types of TOD areas based on certain indicators and data analysis and calculations [33,34,35,36]. Since its proposal by Bertolini [37], the “node-place” model has proven to be a useful approach for assessing the integrated development of urban rail transit and land use. Despite its effectiveness, the “node-place” model has some limitations as it does not fully account for the interplay between land use and transportation systems. Therefore, from the perspective of TOD theory, introducing different evaluation indicators and establishing a comprehensive evaluation system that incorporates functional dimensions representing the relationship between the two can effectively identify the degree of coordination between land use and transportation in rail transit station areas, comprehensively assess the development potential of the land around the stations, and promote the sustainable development of cities [36,38].
In summary, current research tends to treat land evaluation and optimization around rail transit stations as two separate systems, with few studies combining the two. Therefore, this paper focuses on the study of urban TOD classification, using the Qingdao Metro as an example to investigate the degree of land development around rail transit stations. Furthermore, previous research has mainly focused on the “node-place” model for rail transit stations and land use, which is relatively one-sided. This paper extends the classic “node-place” model to include the “function” dimension and classifies stations based on TOD levels. Ultimately, a multi-objective optimization model for land use is constructed using the NSGA-II optimization algorithm, specifically designed to optimize various types of stations.
The remainder of this paper is structured as follows: Section 2 provides a literature review of TOD classification and methodology, Section 3 outlines the study area and methodology, Section 4 presents the main results and the model solution, and finally, Section 5 concludes the research with a discussion of the findings.
2. Literature Review
2.1. TOD Classification
There are various forms of TOD classification, and the “node-place” (NP) model is the most common TOD description method in academia. It was first transitioned from theoretical research to empirical applications and then further refined into a measurement indicator to evaluate the spatial structure of station areas based on the NP model [39,40]. Node indicators mainly measure the accessibility of rail transit stations [41], Place indicators can measure the diversity of land use and the degree of development within the station area [42], The NP model can explore the potential relationship between the two from an overall perspective, evaluate the economic benefits and development potential of the station area [43,44,45]. Calculating the node value and place value in the NP model can reasonably rank and classify the stations in the study area, further enriching and expanding the NP model [46]. The traditional NP model divides station areas into five types to evaluate the degree of integration between rail transit systems and land use, as shown in Figure 1a.
As the NP model is increasingly applied, some scholars have recognized its limitations [1,3], the original theory did not consider the functional connection between transportation and land, which cannot fully reflect the diversity of TOD in practical planning. Moreover, it cannot fundamentally distinguish between TOD and pseudo-TOD [46]. Some scholars have improved the applicability of the model by adding a third dimension, such as pedestrian friendliness [12], design variables [38,47], guidance indicators [6], and correlated variables [18]. Related research results have shown that the quality of the third dimension, such as accessibility, connectivity, and practicality, has a decisive impact on local real estate construction, land use development, and residents' commuting choices. Its characteristics are in line with the TOD concept advocated for mixed-use, high-density, and bike-friendly urban design. Therefore, this paper constructs a three-dimensional node-place-function (NPF) model, as shown in Figure 1b, which incorporates the functional dimension into the complex, dynamic, and comprehensive transportation-land use system.
The improved NPF model has a similar principle to the classic NP model. It uses quantitative measurement to project the node, place, and function dimensions into a three-dimensional coordinate system based on the strength of each indicator, dividing them into high, medium, and low levels. As shown in Figure 1b, the spindle shape represents the coordinated state of the node, place, and function values, and the combination of the three produces 27 small cubes, each representing a specific TOD type. The “function” dimension determines the balance potential of the station area, and each small cube is labeled according to the classic NP model. For example, the green cone in the figure represents that the land use development around the station is not coordinated with transportation, and the balance potential is low. In addition, cluster analysis or principal component analysis can be used to divide the subway station areas into different TOD types, which have a set of a common node or place characteristics, to achieve a more precise and comprehensive classification evaluation of the stations.
2.2. Methodology
The allocation of land resources in rail transit station areas is essentially a multi-objective optimization problem, which needs to fully consider various factors such as economic benefits [21,28], transportation [1], and the ecological environment [48,49]. In recent years, researchers have tended to apply intelligent algorithms to the spatial optimization of land resources. The common optimization algorithms include genetic algorithm[20,50], particle swarm optimization [21,49], simulated annealing algorithm [51], and so on. Building on this foundation, some scholars have extended the use of multiple algorithms and related theories to optimize land allocation. Liu et al. combined a genetic algorithm with game theory to optimize the land structure and obtain the final land allocation plan [49]. Feng et al. established three heuristic algorithm models, namely the simulated annealing algorithm, genetic algorithm, and logistic regression, and compared them to improve the accuracy of the solution [52]. Li and Ma designed a new land resource spatial optimization (LRSA) model based on economic and ecological benefits and applied a simulated annealing algorithm to optimize the model [28].
Ma et al. established a multi-objective optimization model that integrates transportation and land use design, with the objectives of rail transit passenger flow, compactness, accessibility, conflict, and environmental impact [20]. Ding et al. first used gradient-boosting decision trees to study the impact of building environmental variables on rail transit station passenger flow. The study found that land compactness, development intensity, the number of bus stops, and car ownership have a decisive impact on passenger flow [53]. Mirghaed et al. incorporated ecosystem services into the land use allocation optimization process. From the perspective of spatial land use variability and land use fragmentation, this approach can improve land use patterns and planning[54]. Zeng et al. took into account factors such as topography, climate, and social population, and used Bayesian networks to obtain the optimal land use plan [9,55]. Rahman and Szabó found in their research review that the most common objectives in urban land use optimization are maximizing spatial compactness, land use compatibility, and land use suitability [56]. Currently, there is no universal method for measuring the economic and social benefits of land use planning. In this regard, this study aims to maximize rail transit station accessibility, land economic benefits, and environmental comfort and constructs a land use allocation optimization model for rail transit station areas.
3. Data and Methods
3.1. Study Area
Qingdao is an important coastal center city and international port city in Shandong Province, China, covering an area of 11,293 square kilometers with a resident population of 10.26 million. Its GDP reached 1.4136 trillion yuan as of the end of 2021, ranking first in Shandong Province. Qingdao was selected as the case study city because it was the first city in Shandong Province to open a subway system in 2015, with a rapidly developing rail transit network. Currently, there are 11 lines under construction and 6 lines in operation, totaling 315.55 kilometers and 128 stations. Qingdao's subway system has a daily passenger flow of 775,800 people, with the highest single-day passenger volume reaching 2.2443 million people. Qingdao has a rapidly developing subway network, with 9 regular lines and 10 express lines planned for a total length of 872 kilometers. The city is divided by Jiaozhou Bay into relatively independent areas, making transportation between urban areas inconvenient. The subway has shortened commuting times and facilitated the spread of commercial districts throughout the city. The TOD concept has been introduced into land use planning, making it an important strategy for sustainable development. Qingdao is transforming into a “rail transit city”, providing references for urban planning and design in other cities.
3.2. TOD Definition and Methodological Framework
The TOD model is defined as the planning and design of rail transit station areas. Based on the traditional NP model, the expanded “Node-Place-Function” (NPF) model is applied to the case of Qingdao. Referring to the planning and theoretical models of Qingdao, the TOD is dividing the subway stations and their surrounding areas. To reduce the overlapping area of the influence range of rail transit stations, we set the service radius of rail transit stations to 600 meters (5-10 minutes walking distance). The following analysis is mainly divided into five steps. (1) Based on the TOD design concept, evaluation indicators of the NPF model are established. (2) The entropy weighting method is used to integrate various indicators into a comprehensive TOD index. (3) The hierarchical clustering algorithm is applied to divide the TOD areas into different clusters. (4) A land use allocation optimization model is constructed for the rail transit station areas. (5) The NSGA-II genetic algorithm is used to obtain the optimal land development plan. (6) The implications for urban planning are discussed. The overall methodological framework is shown in Figure 3.
3.3. Selection of Indicator Variables and Data Description
This study focuses on 128 subway stations within a 600-meter radius of the 6 subway lines in Qingdao. The data mainly includes two types: spatial vector data and quantitative data. The building outline and elevation data for Qingdao in 2020 were obtained through a map catcher. Point of interest (POI) data was obtained by calling the API of the Baidu Maps web service. Land use data came from the third national land survey, and transportation and water network maps of Qingdao can be obtained from the OpenStreetMap (OSM) website. The operation data of each station were obtained from relevant websites such as the Qingdao Subway, while economic, social, and industrial development data for Qingdao can be obtained from the Qingdao Statistical Information Network. The Spearman correlation coefficient and significance were calculated for each indicator in the NPF model, and it was found that 25 indicators were positively correlated with the NPF model logic, while 6 indicators were negatively correlated.
The selection of indicators should take into account the specific characteristics of TOD in Chinese cities, adhere to the theoretical logic of the classic NP model, and choose indicators that are practical and have low data redundancy. Drawing on previous studies [19,46], node value reflects the comprehensive transportation capacity of the station, mainly evaluating the service level of rail transit stations from aspects such as the station's carrying capacity Bi (such as the number of entrances and exits of subway stations, the number of transferable lines, and the maximum one-way capacity of trains), service capacity Si (such as the frequency of trains, operating hours, average station distance, and the number of stations that can be reached within 20 minutes), and the topological connectivity Ci (such as degree centrality, betweenness centrality, and closeness centrality) of the transportation network. Incorporating the topological connectivity of the transportation network can better describe the topological connectivity of the rail transit network and evaluate the importance of subway nodes in the rail transit network[57]. The higher the node value, the better the accessibility and service capacity of the station.
Place value is mainly based on two perspectives: land use and land value. It studies the diversity of land use Di (such as the proportion of residential land, commercial land, public service land, and public facilities land), the balance of land use mix Hi (such as land use mix, land use entropy, building density, and functional density), and the land premium benefit index Pi (such as land benchmark land price, land price changes, and plot ratio). The diversity of land use includes the proportion of different land use types within the station area; building density and functional density can evaluate the distribution of urban spatial structure and facilities, with the latter emphasizing the concentration and balance of different types of facilities; land use entropy is often used to measure the distribution of different land use types in the city, to evaluate the diversity and balance of land use; while functional mix emphasizes the degree of mixing and interaction of different types of facilities, achieving sustainable development and socio-economic benefits. The land premium benefit index includes three indicators: land benchmark land price, land price changes with distance, and plot ratio.
Functional value reflects the satisfaction of residents' daily needs. It evaluates the functional value of the TOD station area by considering the residents' walkability Vi, transportation convenience Ti, and environmental friendliness Ei. Walkability represents the average walking distance for residents to reach their destinations from the subway station; transportation convenience is represented by three indicators: road area, intersection density, and the number of nearby bus stops; environmental friendliness represents the proportion of green space, such as parks and squares, in the subway station research area.
The entropy weighting method is a common multi-objective decision-making method that is driven by objective data, can handle uncertainties in the decision-making process, and ensures the accuracy of the decision-making results. Compared with the traditional Analytic Hierarchy Process (AHP) and Principal Component Analysis (PCA), the entropy weighting method does not require subjective determination of the hierarchical structure and weight values in advance. It can automatically calculate the weight and entropy values of each indicator and has a certain tolerance for data changes and uncertainties. The selected indicators are aggregated through the entropy weighting method to form the comprehensive node index (CNI), comprehensive place index (CPI), and comprehensive function index (CFI). Finally, the three sub-indices are given equal weights to establish the comprehensive TOD index. The explanatory notes, relevant descriptive statistics, and weight values of each indicator are shown in Appendix B.
3.4. Cluster Analysis
To better analyze the degree of TOD at each station, we further differentiate TOD clusters based on the relative contributions of the comprehensive TOD index factors. Cluster analysis is a method for studying the relationships between multidimensional spatial points. Hierarchical clustering is an important clustering method, including “top-down” divisive hierarchical clustering and “bottom-up” agglomerative hierarchical clustering, as shown in Figure 4. The basic idea of agglomerative hierarchical clustering is to first treat each object as an initial class, then merge these classes into a relatively rough partition, and then repeat the merging process until larger partitions are obtained. The combination of the entropy weighting method and the hierarchical clustering method can overcome their respective shortcomings and achieve complementary advantages, which can more comprehensively, intuitively, and accurately evaluate data features and classification.
3.5. Land Use Optimization Model Based on NSGA-II
The solution to multi-objective optimization problems is non-dominated. NSGA-II (Non-dominated Sorting Genetic Algorithm II) is a non-dominated sorting genetic algorithm widely used to solve multi-objective optimization problems. In land use optimization problems, NSGA-II can consider multiple objectives, such as land use efficiency, ecological protection, and economic benefits. In this study, we designed a genetic algorithm based on NSGA-II to solve the land use optimization model. The design process is shown in Figure 5a.
3.5.1. Selection of decision variables
Taking the land parcel within the research area as the smallest variable unit, a coding string is formed by combining the land use type, plot ratio, plot area, and station number of different land parcels in different geographical locations. The land use types are divided into eight categories: residential land, commercial land, industrial land, public service land, public facilities land, road and transportation land, park and square green space, and existing land, which are represented by numbers 1 to 8, respectively. The plot coding is easy to map the information of a single plot to a one-dimensional individual, ensuring their equivalence. The genetic coding format is shown in Figure 5b.
3.5.2. Objective function
Starting from the 3D concept of TOD, the relationship between urban public transportation, land, and the environment is comprehensively considered, and the land use optimization objectives in the TOD station area are determined based on the principle of sustainable development. Three quantitative indicators are proposed: TOD station accessibility, land use diversity, and environmental comfort.
1) TOD station accessibility
Transport accessibility refers to the convenience of reaching other nodes in the transportation network from a certain node, which helps to strengthen the radiation effect of core stations. Walkability is a key indicator for evaluating the quality of work and life of residents in the TOD station area, and subway accessibility reflect the convenience of residents' subway travel, which is an important indicator for measuring the concentration degree of nodes. The TOD station accessibility should comprehensively consider the relationship between urban residents' travel behavior and rail transit, so a comprehensive accessibility model based on residents' walking and subway travel should be established.
①Resident accessibility
Where Oi is the generated traffic volume for the starting unit parcel i; Di is the attractiveness of work and services; tijr is the travel time between the starting parcel i and the target parcel j; r is the impedance coefficient.
②Subway accessibility
Where Ci is the rail transit line that the unit parcel i can transfer to; N is the total number of stations; dij is the operating distance between the starting parcel i and the target parcel j.
③Comprehensive accessibility
Z1 is the first planning objective. In the formula, Accessi is the comprehensive accessibility of the TOD area. The higher the value, the more convenient it is for residents to reach work and service places within the station area. λ1 and λ2 are the coefficients of resident accessibility and subway accessibility in comprehensive accessibility, respectively. They are assumed to have equal importance, so λ1 = λ2 = 0.5.
2)Land economic benefits indicators
The development of urban rail transit systems can to some extent improve the economic vitality of the areas around stations, promote the development of the real estate industry, and generate premium effects on surrounding land. Therefore, improving the land’s economic benefits is an important indicator for measuring the degree of TOD in land use around stations. The land economic benefits indicators in the TOD station area include land premium benefits and land use mix. The land premium benefits are calculated using the basic land price correction method, considering the price changes caused by the distance from different parcels to the station. The land use mix reflects the diversity of land functions, which can be reflected by the information entropy of land use structure to measure the orderliness of urban land use. The higher the value, the more balanced the proportion of various types of land use.
①Land premium benefits
Where Premiumi represents land value, and the higher the value, the greater the impact of rail transit on land around the station; Varik represents the price change of the kth type of land in the unit parcel i; datumik represents the benchmark land price of each type of land k; Areaik represents the area of the parcel i.
②Land use mix
Where Hi is the entropy of land use functions, and the higher the value, the smaller the difference in the area of various land uses in the station area, and the more orderly the land use; σik is the proportion of the area of the kth type of land use in the unit parcel i.
③Land economic benefits indicators
Z2 is the second planning objective. The formula, Benefiti represents the land economic benefits, and the higher the value, the more reasonable the configuration of various types of land use in the station area, promoting the mutual coordination and sustainable development of rail transit and land use.
3) Environmental comfort
Urban environmental comfort is an important indicator for measuring residents' happiness, reflecting the quality level of urban economic development, living standards, and social progress. Residents living standards mainly reflect their pursuit of material life and spiritual culture, which can be broadly summarized into four aspects: housing conditions, public services, transportation conditions, and leisure and entertainment. High-intensity development can cause problems such as traffic congestion and a decline in residents' quality of life in the station area. Therefore, the station area needs to ensure a good level of service and open space. The objective function is constructed as follows:
Z3 is the third planning objective. In the formula, Environmenti represents environmental comfort, and the higher the value, the better the environmental quality; DS is the area of public service facilities; DT is the area of roads and transportation facilities; DF is the area of public facilities; DG is the area of green space and squares; Dmr is the area of residential land; Dmc is the area of commercial land; Xmr is the plot ratio of residential land; Xmc is the plot ratio of commercial land; m represents the residential type, m=6; n represents the commercial type, n=12; r represents residential land; c represents commercial land.
3.5.3. Constraint conditions
1) Land plot ratio
The setting of the land plot ratio should comply with the concept of urban sustainable development. Setting it too high will increase urban pressure while setting it too low will lead to resource waste. Therefore, the range of land plot ratio should be limited, and the current maximum regulated plot ratio should be taken as the upper limit of the study, as shown in the following formula:
In the formula, fi is the upper limit value of the current regulated plot ratio, and Xi is the current land plot ratio.
2) Land development area
Residential and commercial land are the main components of urban land, and their development areas should comply with the regulations on land use management. The constraint conditions can be found in the following formula:
The formula, r represents the lower limit of the proportion of developed residential land area within the station area, r’ represents the upper limit of the proportion of developed residential land area within the station area; c represents the lower limit of the proportion of developed commercial land area within the station area, and c’ represents the upper limit of the proportion of developed commercial land area within the station area. S represents the total developed area within the station area.
4. Results
4.1. Analysis of differences in TOD structure factors
Figure 6 shows the spatial layout of Qingdao's rail transit stations in the NPF model based on “nodes”, “places”, “functions”, and the comprehensive TOD index. Figure 6a represents the node value of Qingdao's subway stations. As can be seen from the figure, stations with high node values are mainly distributed in transfer stations and adjacent stations, with a typical example being Qingdao North Station, which has a high node value of 0.768. Figure 6b represents the place value, showing a trend of decreasing gradient from the core areas of Taidong Business District, Hong Kong Middle Road Business District, and Licang Business District to the surrounding areas. Figure 6c represents the function value, with a generally low overall index. High-function stations are distributed relatively discretely with significant spatial differences, with the maximum value being 0.694. Figure 6d represents the comprehensive TOD index, showing that stations with a high level of comprehensive TOD development in Qingdao's rail transit system are mainly located along Line 2. Generally speaking, the four indicators in the NPF model are generally higher in the central urban area of Qingdao, and stations with lower indicator values appear more frequently at the end of each subway line. This suggests that the level of TOD development is closely related to local economic vitality.
Using the entropy weight method-hierarchical clustering method, the 128 rail transit stations in Qingdao are divided into 6 types, and the specific TOD types are shown in Figure 7a, and the corresponding spatial distribution pattern is shown in Figure 7b. Cluster 1 is the low-level horizontal type, with a total of 20 stations. The various indicators of this type of station in the NPF model are very low. They are mainly distributed on the outskirts of the urban rail transit network, away from the core areas of high economic development level commercial districts, with low development levels and incomplete transportation facilities. Typical representatives include Langya, Gongkouwan, Anshun Road, and so on. Stations such as Huiquan Square and Ocean University belong to the second type of TOD cluster, which is characterized by low node value and place value, relatively high function value, and mainly residential land use, with more surrounding green space and square land use and higher quality of life for residents. Cluster 3 is the high node, low place & function type. Qingdao North Station is listed as the third cluster, which is a first-level hub station where three subway lines 1, 3, and 8 converge, with high accessibility, but its land development level is low, with few land use types and a lack of basic living facilities for residents. Cluster 4 is the medium balance type, with a total of 41 stations. Representative stations include Miaoling Road, People's Hall, and so on, which are often located near the city center, mainly for residential land use, with high land plasticity. Stations such as Fushan Station and Yan'erdao Road belong to Cluster 5, which is characterized by overall high values in the three factors, but the function value is significantly lower than the node-place value, indicating that the green facilities around this type of station cannot meet the development of its transportation and land benefits. Cluster 6 consists of highly balanced stations, mainly concentrated at the intersection of multiple rail lines, which are transportation transfer stations with relatively well-developed land use around them and a high proportion of commercial and residential land. There are a total of 5 stations, namely Qingdao Station, May Fourth Square, Taidong, Jinggangshan Road, and Licun. The three indicators in the NPF model for these stations tend to saturate, and excessive development should be avoided.
4.2. Model solving
Based on the hierarchical clustering results, typical stations were selected from each category as research objects, including Qingdao North Station, Anshun Road, Huiquan Plaza, Miaoling Road, Fushan Station, and Taidong Subway Station. The NSGA-II algorithm was used for optimization with the following basic parameters: initial population size of 100, maximum iteration of 300, crossover probability of 0.9, and mutation probability of 0.1. The Pareto solution set was obtained using the PlatEMO 4.1 platform in Matlab R2022b, as shown in Figure 8.
After solving the land use optimization model using NSGA-II, land use plans for typical stations were obtained under different objective functions. Taking Miaoling Road as an example, Plans A to C in Table 1 correspond to the optimal solution for each fitness function value in the non-dominated solution. Plan A is the most suitable choice to maximize rail transit accessibility. If the key to land use optimization is to improve land economic benefits, Plan B can be selected from the Pareto optimal solution set. If the goal is to improve the environmental comfort around the station, Plan C is the most effective approach. In comparison, Plan D is a balanced solution that can simultaneously consider and balance multiple objective functions. Table 2 shows the best land planning schemes for typical stations under different objective functions.
4.3. Land use optimization adjustment
The best land planning scheme D for typical stations under each objective function was selected, and the planning results were visualized in space using CAD conversion tools to obtain the land use optimization map. Figure 9 shows the land use status map of typical stations, and Figure 10 shows the land use optimization map of typical stations. The area proportion of different land use types before and after optimization was presented in the form of a bar chart, as shown in Figure 11.
Combining Figure 9 and Figure 10, it can be observed that the original land use around Qingdao North Station was mostly comprised of other land types, while the optimized land use plan significantly increased the number of land types, enhancing the degree of land use mix around the station. Other land types were mainly converted into commercial and public service land, effectively utilizing the land around the station and strengthening the commercial attractiveness of Qingdao North Station. The place value increased from the original value of 0.1189 to 0.5983, and the comprehensive TOD index reached 0.6484.
Anshun Road is a typical low-lying horizontal station, with residential areas and educational research facilities such as kindergartens around the original station, but a relatively inadequate supply of supporting facilities such as shopping malls, restaurants, and banks that meet the basic needs of residents. In the optimized land use plan (Figure 10), the original industrial land was converted into commercial and residential land, and the residential land area was expanded, with greenery laid out on both sides of the road, improving the comfort of residents' lives. In the optimized NPF model, the node-place-function three indicators remained relatively stable, and the comprehensive TOD index increased from the original 0.0303 to 0.2862.
Huiquan Plaza is a high-function, low-node-place station, with a relatively high proportion of park squares and green spaces around the station, resulting in an excess of functional value and insufficient use of other land. To address this issue, another land around the station and a small amount of park green space were converted, and the proportion of commercial and residential land and public service land in the optimized plan reached 61%, while the proportion of park green space reached 35%. The algorithm was able to improve the node and place value while maintaining a stable functional value, with a comprehensive TOD index of 0.50.
Fushan Station has a large area of commercial and residential land, a developed commercial sector, and a high place value, making it a high-place, low-function station. To ensure the residential environment around the station, the original social parking land was planned as park green space, while a small area of commercial and residential land was added to increase passenger flow at the station. After calculation, the park green space area increased by 4%, the functional value was 0.7053, and the comprehensive TOD index reached 0.6837.
5. Discussion and Conclusion
5.1. Analysis of Qingdao's TOD level and optimization results
This article proposes an NPF model from the perspective of coordinated development of rail transit and land use around stations in Qingdao. The study focuses on the area within 600 meters of the rail transit stations in Qingdao. The model is used to evaluate the degree of coordinated development between rail transit and land use around stations. The study found that stations with a high comprehensive TOD index are mainly distributed in the central urban area, and the TOD level of subway stations from the central urban area to the suburbs decreases in concentric circles. Therefore, it can be seen that the TOD construction achievements in the central urban area of Qingdao are significant. The node index of transfer stations is significantly higher than that of ordinary stations, such as Qingdao North Station and Qingdao Station. The reason is that these stations have good capacity and complete service facilities. Stations with h high place and function indices are mainly distributed on Line 2 of the subway system. The reason is that Line 2 was opened earlier than Line 1, and its geographic location is mainly in the central urban area, surrounded by Bohai Bay with abundant commercial facilities, diverse land use, and complete public service facilities, making the environment pleasant. Areas such as Chengyang District, Jiaozhou, and Huangdao District are far from the main urban area of Qingdao, and the surrounding supporting public facilities are relatively inadequate, resulting in lower attractiveness for residents' travel. This indicates that these stations have greater room for improvement and are highly malleable.
We divided the TOD into six clusters and found that the closer the cluster is to the central urban area, the greater the potential for TOD balance. The low-lying horizontal TOD cluster is mainly distributed in the suburbs and at the end of subway lines. To avoid the risk of excess rail transit resources and excessive land use development, we used the NSGA-II algorithm to obtain the Pareto optimal solution set and selected the best planning scheme to optimize typical stations based on the existing problems of different clusters. The planning scheme improves the TOD level of stations by adjusting the land use types and areas around the stations. Finally, the changes in the values of the three indicators in the NPF model after optimization were calculated to verify the rationality of the optimization. The results show that the values of the three indicators in the optimized NPF model were improved to varying degrees, indicating that the algorithm design provides a better and more realistic land use planning scheme. This provides a certain reference for the construction practice of rail transit station areas in Qingdao in the future.
5.2. Advantages, Limitations, and Prospects
This paper extends the original “node-place” model by adding functional features and constructing the “node-place-function” (NPF) model, which better expresses the relationship between the rail transit system and land use, making their relationship more closely and the model system more complete. Based on the TOD clustering results and using the NSGA-II algorithm, three optimal solutions of fitness functions and the best optimization plan are obtained, and the optimization results meet the basic requirements of traffic convenience, land intensification, and environmental comfort under TOD mode. The use of the NSGA-II algorithm can effectively solve the optimization problem of land use around rail transit stations under the TOD mode, avoid subjective evaluation of station optimization, provide more optimal and realistic land planning schemes, and provide a reference for the construction practice of rail transit station areas in Qingdao in the future. However, there are still some shortcomings in this paper: the division of indicators in the NPF model has subjective components, and its scientificity and accuracy still have certain problems. Secondly, the NSGA-II algorithm is relatively lacking in convergence speed and computational complexity. To improve the computational efficiency and solution quality of multi-objective optimization, it can be improved by combining it with other optimization algorithms. The rail transit system in Qingdao is becoming more and more perfect. The newly opened Line 4 on December 26, 2022, is not within the scope of this study. In future explorations, the dynamic evolution process of land use around rail transit stations in Qingdao can be included.
Author Contributions
Conceptualization, Mingxing Li and Jinbao Zhao; methodology, Mingxing Li and Wenjing Liu; validation, Mingxing Li; data curation, Mingxing Li, Jiawei Jiang, Yuejuan Xu; writing—original draft preparation, Mingxing Li; writing—review and editing, Mingxing Li and JinBao Zhao; visualization, Wenjing Liu, Jiawei Jiang, Yuejuan Xu; supervision, Mingxing Li, Jinbao Zhao; project administration, Jinbao Zhao; funding acquisition, Jinbao Zhao. All authors have read and agreed to the published version of the manuscript.
Funding
This work was supported by the National Natural Science Foundation of China (Grant No. 51608313), the Natural Science Foundation of Shandong Province (Grant No. ZR2021MF109), and the Shandong Provincial Communications Planning and Design Institute Group Co., Ltd. (Grant No. 2020-SDHS-GSJT-02).
Data Availability Statement
Restrictions apply to the availability of these data. POI data was obtained from Gaode Map (https://lbs.amap.com/, accessed on 1 June 2022). OpenStreetMap (OSM) data was obtained from https://www.openstreetmap.org/ (accessed on 1 June 2022).
Conflicts of Interest
The authors declare no conflict of interest.
Appendix A
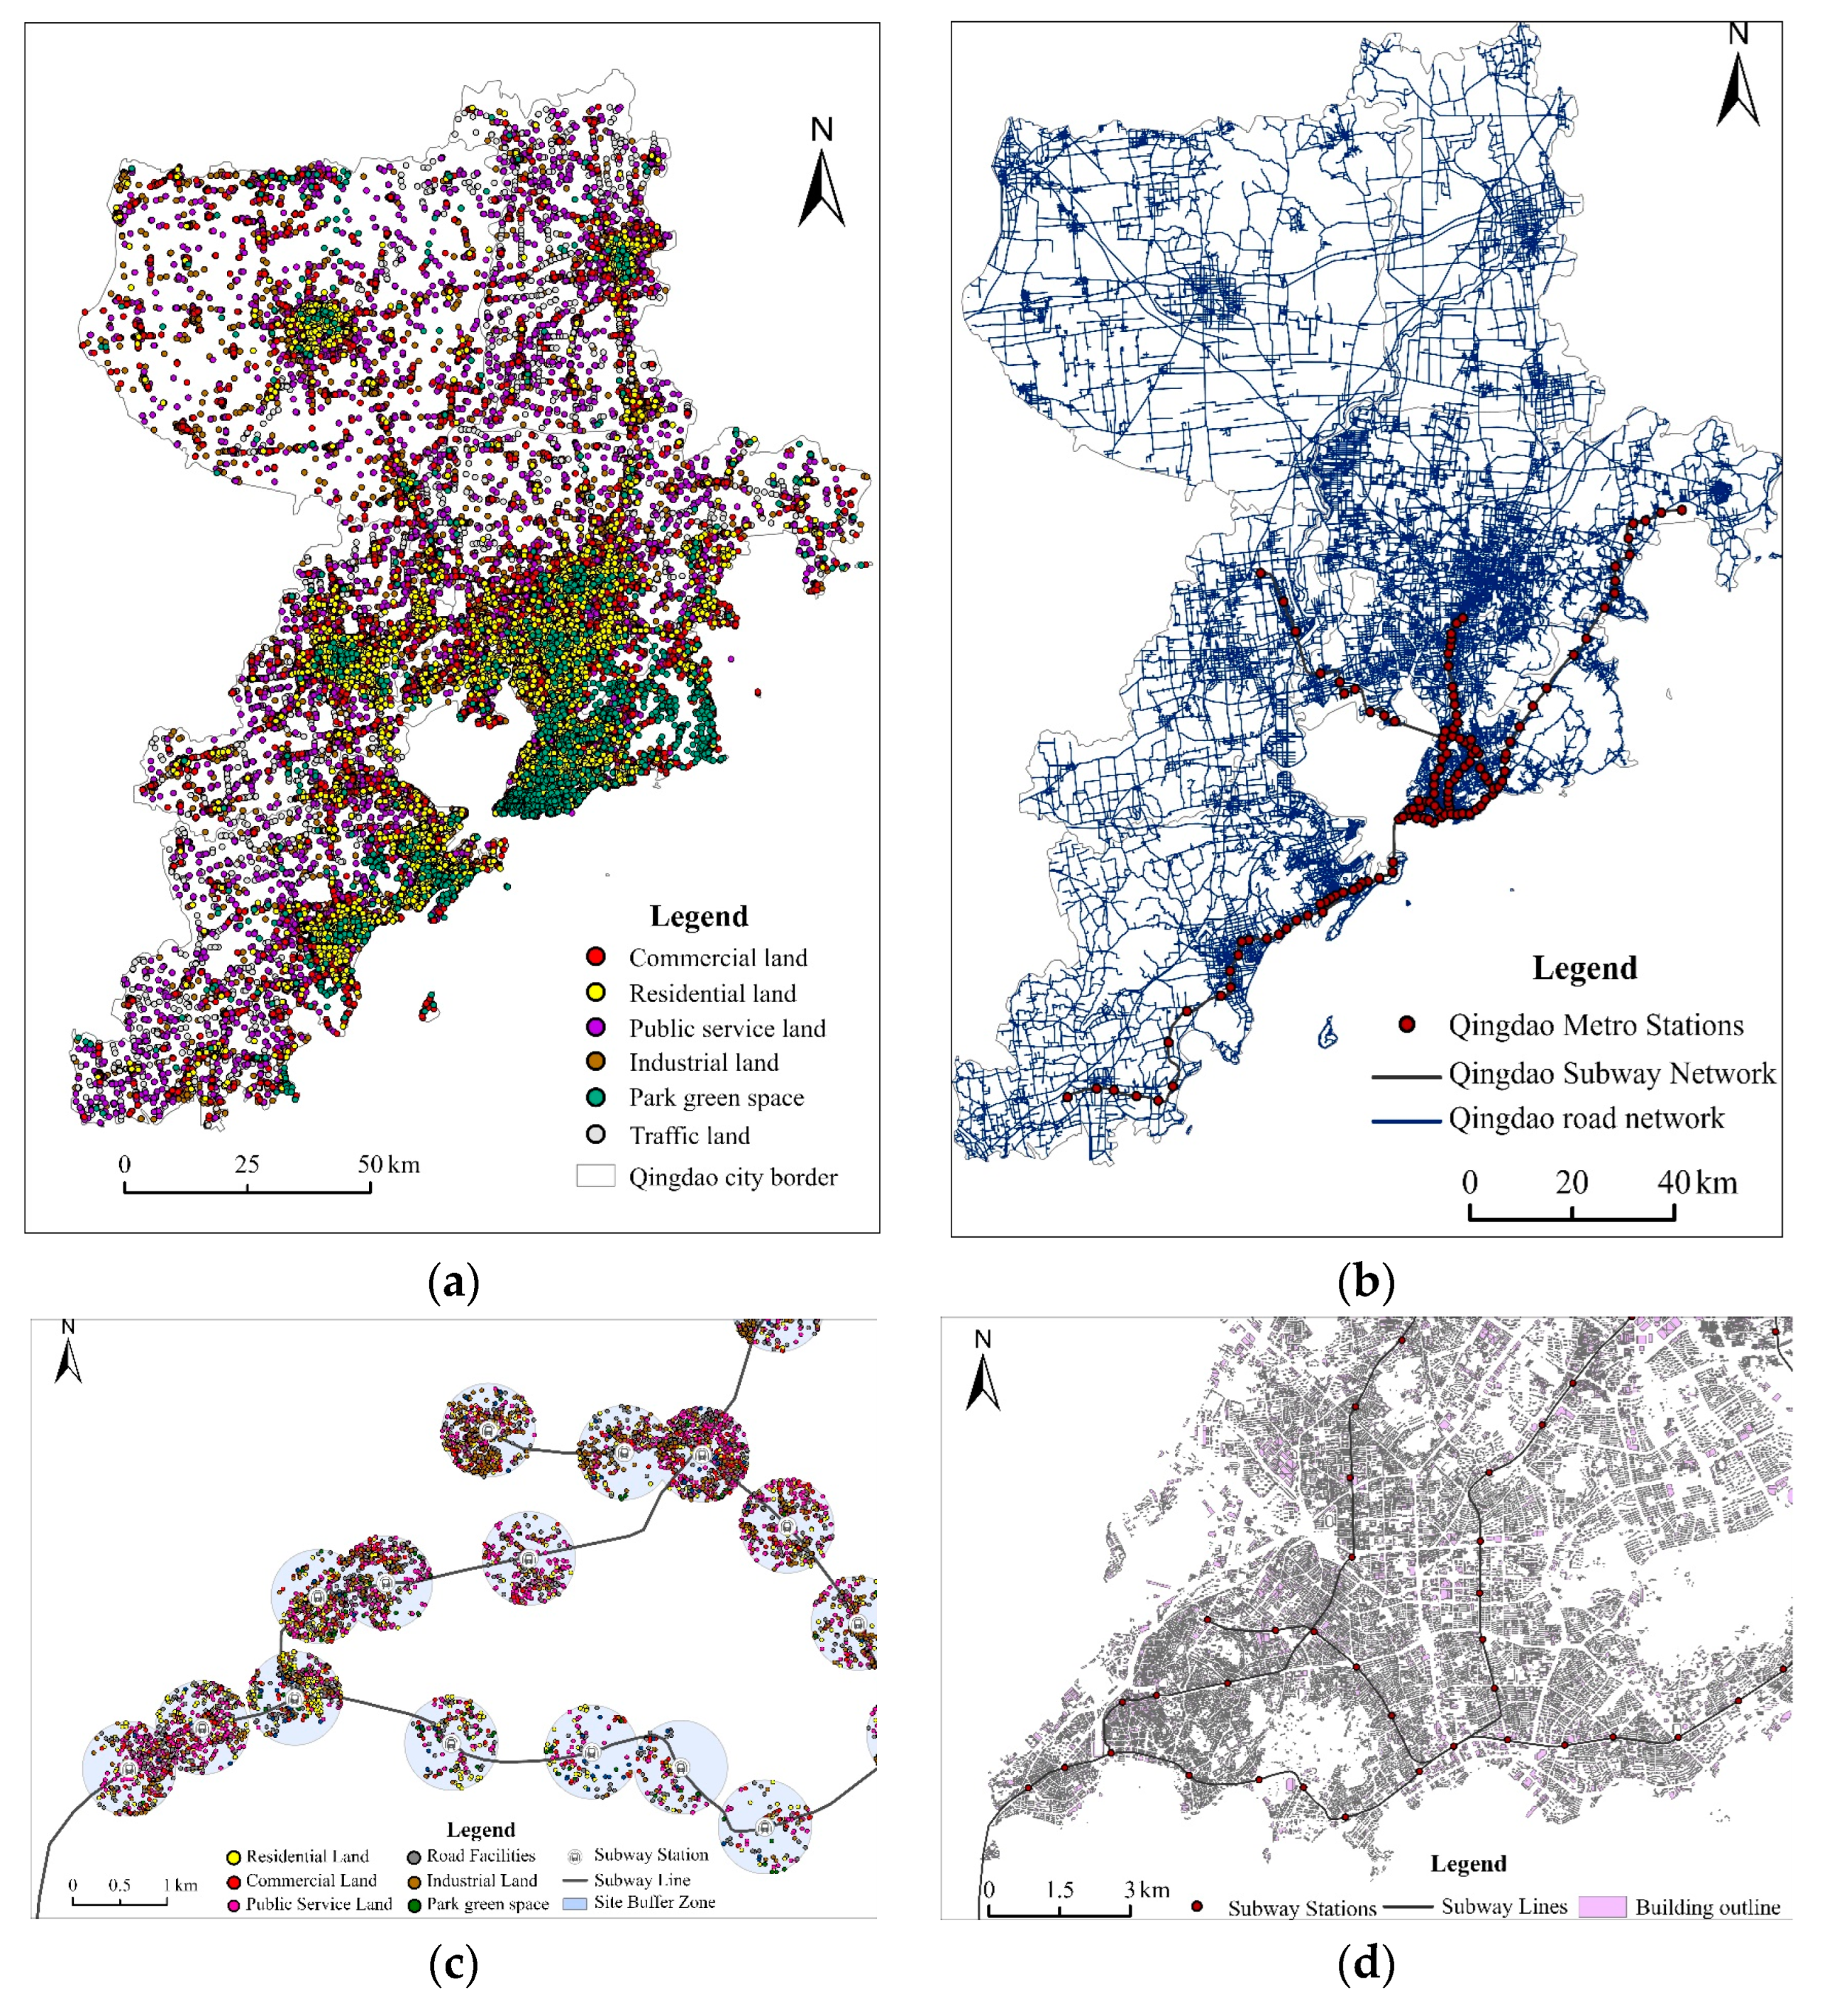
The statement describes the process of obtaining and reclassifying point of interest (POI) data for the urban area of Qingdao city, with the help of the Gaode Map (https://www.amap.com). The dataset includes approximately 500,000 POIs, with detailed information such as names, types, geographic locations, and spatial coordinates. The POIs were reclassified according to the standards of urban and rural land classification and planning and some less well-known POIs such as geographical addresses, public toilets, and logistics storage were removed. The reclassified POIs were grouped into six major categories, including residential land, public management and public service facilities, commercial service facilities, industrial land, road and transportation facilities, and green space and squares, as shown in Figure A1(a). The proportions of POIs in each category are illustrated in Table A1.
The statement describes a study conducted using ArcGIS 10.8 software, where a buffer zone was created around subway stations to analyze POI data within a 600-meter radius. The visualization of this data can be seen in Figure A1(c). Road network information was obtained from the OpenStreetMap (OSM) website, and information such as intersection density and walkability was calculated, as shown in Figure A1(b). Additionally, building footprint data is available and presented in Figure A1(d).

Table A1.
The results of reclassification POI.
| Code | Category | Number | Percentage |
|---|---|---|---|
| 1 | Commercial | 61616 | 27.08% |
| 2 | Residential | 48036 | 21.11% |
| 3 | Public service | 9567 | 4.2% |
| 4 | Industrial | 1790 | 0.79% |
| 5 | Park green | 83912 | 36.88% |
| 6 | Traffic | 22608 | 9.94% |
Figure A1.
(a) POI data; (b) Road network data. (c) POI data in the radiation area of the site; (d) Building outline data.
Figure A1.
(a) POI data; (b) Road network data. (c) POI data in the radiation area of the site; (d) Building outline data.
Appendix B. Indicator Description and Descriptive Statistics
| Category | Dimension | Index | Indicator description | MAX | MIN | MEAN | STD | Weight |
| Node | Bearing capacity of subway station Bi | Number of entrances and exits B1 | Calculate the number of entrances and exits at each subway station. | 11 | 1 | 2.712 | 1.27 | 0.0632 |
| Number of transferable subway lines B2 | For each station, the initial value of the direction is 2, and for each additional line that can be transferred, the direction is increased by 2. | 6 | 2 | 2.259 | 0.793 | 0.5031 | ||
| Train type ( maximum one-way capacity ) B3 | A: 5-7 million person/hour, B: 3-50,000 person/hour | 5 | 5 | 5 | 0 | 0 | ||
| Subway station service capacity Si | Departure interval S1 | The interval between two subway trains passing through the station is (min). | 17.05 | 1 | 3.155 | 2.398 | 0.0937 | |
| Service time S2 | Subway station operation time (min). | 1071 | 969 | 1017.993 | 27.345 | 0.0452 | ||
| Average station spacing S3 | The average distance from the station to the adjacent station (km). | 39.923 | 6.534 | 17.68 | 7.645 | 0.0645 | ||
| Number of subway stations reachable S4 | The number of subway stations that can be reached within 20 minutes. | 18 | 4 | 11.338 | 3.322 | 0.029 | ||
| Topological connectivity of subway network Ci | Degree centrality C1 | Judging the importance or influence of nodes in the network, the greater the degree of nodes, the more important the node is. | 1 | 0 | 0.408 | 0.201 | 0.0277 | |
| Betweenness centrality C2 | Represents the number of shortest paths through the node in a network. | 1 | 0 | 0.208 | 0.209 | 0.0979 | ||
| Closeness centrality C3 | Evaluate the closeness of node i to all other nodes. | 1 | 0 | 0.348 | 0.283 | 0.0757 | ||
| Place | Land-use diversity index Di | The proportion of residential category D1 | The proportion of residential area to the total station area. | 1 | 0 | 0.128 | 0.129 | 0.1114 |
| The proportion of commercial category D2 | The proportion of commercial area to the total station area. | 1 | 0 | 0.537 | 0.198 | 0.1431 | ||
| The proportion of public services D3 | The proportion of public service area to the total station area. | 1 | 0 | 0.296 | 0.176 | 0.1338 | ||
| The proportion of public facilities D4 | The proportion of public facilities area to the total station area. | 0.402 | 0 | 0.031 | 0.046 | 0.12 | ||
| Land use mixing balance index Hi | A mixture of land functions F | , a = max(D1,D2,D3,D4), b = min(D1,D2,D3,D4), c = max(D1 + D2 + D3 + D4)/5, d = (D1 + D2 + D3 + D4) | 0.984 | 0.95 | 0.958 | 0.009 | 0.1463 | |
| Land use entropy H | , Di is the proportion of land use type i, and k is the number of land types. | 1 | 0 | 0.481 | 0.343 | 0.066 | ||
| Building Density BD | The proportion of the area occupied by buildings within the influence area of the subway station. | 0.648 | 0 | 0.231 | 0.168 | 0.0687 | ||
| Functional Density FD | The extent to which different functional facilities are concentrated within the influence area of a subway station. | 0.395 | 0 | 0.186 | 0.113 | 0.0444 | ||
| Land premium benefit index Pi | Standard land price P1 | The benchmark land price refers to the basic standard price of urban state-owned land. It is the average price (yuan) of commercial, industrial, residential, and other types of land evaluated and measured by different land levels and different sections. | 5.9 | 0.672 | 1.942 | 1.158 | 0.0691 | |
| Changes in land prices P2 | Denotes the change in land prices due to the distance from the site. | 0.589 | -0.728 | -0.193 | 0.223 | 0.0172 | ||
| Land plot ratio P3 | The ratio of the total construction area to the net land area of a residential area. | 3.153 | 0 | 1.027 | 0.849 | 0.08 | ||
| Function | Walking accessibility Vi | The average route distance from the subway station to residential land V1 | Calculate the average walking distance (m) from the subway station to the residential area. | 600 | 180.249 | 501.339 | 55.039 | 0.0185 |
| The average route distance from the subway station to commercial land V2 | Calculate the average walking distance (m) from the subway station to the business district. | 600 | 173.722 | 490.082 | 53.824 | 0.0197 | ||
| The average route distance from the subway station to public service land V3 | Calculate the average walking distance (m) from the subway station to the public service area. | 600 | 183.466 | 486.679 | 50.189 | 0.021 | ||
| The average route distance from the subway station to public facilities land V4 | Calculate the average walking distance (m) from the subway station to the public facility area. | 596 | 72.913 | 487.615 | 76.442 | 0.0123 | ||
| Traffic convenience Ti | Road density T1 | The proportion of road area to the total station area. | 1 | 0 | 0.106 | 0.151 | 0.1325 | |
| Intersection index T2 | The proportion of road intersection area to the total station area. | 1 | 0 | 0.089 | 0.169 | 0.1858 | ||
| Number of bus stops around the station T3 | A number of bus stations around the station. | 31 | 0 | 11.51 | 7.631 | 0.0449 | ||
| Environmental friendliness Ei | Park greenbelt E1 | Relatively independent, open, recreational green space (m2). | 367225.5 | 0 | 42491.412 | 76630.422 | 0.1883 | |
| Protective green area E2 | Green space with sanitation, isolation, and safety protection functions (m2) | 91806.375 | 0 | 10615.094 | 19157.824 | 0.1884 | ||
| Square land area E3 | Urban public activity venues based on the hard pavement (m2) | 45903.188 | 0 | 5307.547 | 9578.912 | 0.1886 |
References
- Kumar, P.P.; Sekhar, C.R.; Parida, M.J.J.o.t.g. Residential dissonance in TOD neighborhoods. 2018, 72, 166-177.
- Wei, L.; Luo, Y.; Wang, M.; Cai, Y.; Su, S.; Li, B.; Ji, H.J.H.I. Multiscale identification of urban functional polycentricity for planning implications: An integrated approach using geo-big transport data and complex network modeling. 2020, 97, 102134.
- Ibraeva, A.; de Almeida Correia, G.H.; Silva, C.; Antunes, A.P.J.T.R.P.A.P. Practice. Transit-oriented development: A review of research achievements and challenges. 2020, 132, 110–130. [Google Scholar]
- Wang, S.; Hao, J.J.J.o.E.S. Air quality management in China: Issues, challenges, and options. 2012, 24, 2-13.
- Matus, K.; Nam, K.-M.; Selin, N.E.; Lamsal, L.N.; Reilly, J.M.; Paltsev, S.J.G.e.c. Health damages from air pollution in China. 2012, 22, 55-66.
- Lyu, G.; Bertolini, L.; Pfeffer, K.J.J.o.T.G. Developing a TOD typology for Beijing metro station areas. 2016, 55, 40-50.
- Wey, W.-M.; Zhang, H.; Chang, Y.-J.J.H.I. Alternative transit-oriented development evaluation in sustainable built environment planning. 2016, 55, 109-123.
- Cervero, R. The transit metropolis: a global inquiry; Island press: 1998.
- Schlossberg, M.; Brown, N.J.T.r.r. Comparing transit-oriented development sites by walkability indicators. 2004, 1887, 34-42.
- Nasri, A.; Zhang, L.J.T.p. The analysis of transit-oriented development (TOD) in Washington, DC and Baltimore metropolitan areas. 2014, 32, 172-179.
- Calthorpe, P. The next American metropolis: Ecology, community, and the American dream; Princeton architectural press: 1993.
- Vale, D.S.J.J.o.t.g. Transit-oriented development, integration of land use and transport, and pedestrian accessibility: Combining node-place model with pedestrian shed ratio to evaluate and classify station areas in Lisbon. 2015, 45, 70-80.
- Singh, Y.J.; Fard, P.; Zuidgeest, M.; Brussel, M.; van Maarseveen, M.J.J.o.T.G. Measuring transit oriented development: a spatial multi criteria assessment approach for the City Region Arnhem and Nijmegen. 2014, 35, 130-143.
- Cao, Z.J.U.R.T. Integrating Station-Area Development with Rail Transit Networks: Lessons from Japan Railway in Tokyo. 2022, 8, 167-174.
- Guo, J.; Nakamura, F.; Li, Q.; Zhou, Y.J.J.o.A.T. Efficiency assessment of transit-oriented development by data envelopment analysis: Case study on the Den-en Toshi line in Japan. 2018, 2018.
- Xia, X.; Li, H.; Kuang, X.; Strauss, J.J.I.j.o.e.r.; health, p. Spatial–Temporal Features of Coordination Relationship between Regional Urbanization and Rail Transit—A Case Study of Beijing. 2022, 19, 212.
- Li, D.; Zang, H.; Yu, D.; He, Q.; Huang, X.J.I.J.o.E.R.; Health, P. Study on the Influence Mechanism and Space Distribution Characteristics of Rail Transit Station Area Accessibility Based on MGWR. 2023, 20, 1535.
- Li, Z.; Han, Z.; Xin, J.; Luo, X.; Su, S.; Weng, M.J.L.u.p. Transit oriented development among metro station areas in Shanghai, China: Variations, typology, optimization and implications for land use planning. 2019, 82, 269-282.
- Su, S.; Wang, Z.; Li, B.; Kang, M.J.J.o.T.G. Deciphering the influence of TOD on metro ridership: An integrated approach of extended node-place model and interpretable machine learning with planning implications. 2022, 104, 103455.
- Ma, X.; Zhang, J.; Ding, C.; Wang, Y.J.C., Environment; Systems, U. A geographically and temporally weighted regression model to explore the spatiotemporal influence of built environment on transit ridership. 2018, 70, 113-124.
- Zhang, X.; Zhang, Q.; Sun, T.; Zou, Y.; Chen, H.J.S.c. society. Evaluation of urban public transport priority performance based on the improved TOPSIS method: A case study of Wuhan. 2018, 43, 357–365. [Google Scholar]
- Cervero, R.; Kockelman, K.J.T.r.p.D.T. Environment. Travel demand and the 3Ds: Density, diversity, and design. 1997, 2, 199–219. [Google Scholar]
- Curtis, C.J.T.p. Planning for sustainable accessibility: The implementation challenge. 2008, 15, 104-112.
- Tong, D.; Murray, A.T.J.A.o.t.A.o.A.G. Spatial optimization in geography. 2012, 102, 1290-1309.
- Cervero, R.; Day, J.J.T.p. Suburbanization and transit-oriented development in China. 2008, 15, 315-323.
- Wang, Y.; de Almeida Correia, G.H.; de Romph, E.; Timmermans, H.J.J.o.T.G. Using metro smart card data to model location choice of after-work activities: An application to Shanghai. 2017, 63, 40-47.
- Ding, C.; Wang, D.; Ma, X.; Li, H.J.S. Predicting short-term subway ridership and prioritizing its influential factors using gradient boosting decision trees. 2016, 8, 1100.
- Iseki, H.; Liu, C.; Knaap, G.J.T.R.P.A.P. Practice. The determinants of travel demand between rail stations: A direct transit demand model using multilevel analysis for the Washington DC Metrorail system. 2018, 116, 635–649. [Google Scholar]
- Pan, H.; Li, J.; Shen, Q.; Shi, C.J.T.R.P.D.T. Environment. What determines rail transit passenger volume? Implications for transit oriented development planning. 2017, 57, 52–63. [Google Scholar]
- Jun, M.-J.; Choi, K.; Jeong, J.-E.; Kwon, K.-H.; Kim, H.-J.J.J.o.t.g. Land use characteristics of subway catchment areas and their influence on subway ridership in Seoul. 2015, 48, 30-40.
- Higgins, C.D.; Kanaroglou, P.S.J.J.o.t.g. A latent class method for classifying and evaluating the performance of station area transit-oriented development in the Toronto region. 2016, 52, 61-72.
- Austin, M.; Belzer, D.; Benedict, A.; Esling, P.; Haas, P.; Miknaitis, G.; Wampler, E.; Wood, J.; Young, L.; Zimbabwe, S. Performance-based transit-oriented development typology guidebook. 2010.
- Papagiannakis, A.; Vitopoulou, A.; Yiannakou, A.J.E.P.S. Transit-oriented development in the southern European city of Thessaloniki introducing urban railway: typology and implementation issues. 2021, 29, 117-141.
- Kamruzzaman, M.; Baker, D.; Washington, S.; Turrell, G.J.J.o.t.g. Advance transit oriented development typology: case study in Brisbane, Australia. 2014, 34, 54-70.
- Kumar, P.P.; Sekhar, C.R.; Parida, M.J.T.R.P.D.T. Environment. Identification of neighborhood typology for potential transit-oriented development. 2020, 78, 102186. [Google Scholar]
- Voulgaris, C.T.; Taylor, B.D.; Blumenberg, E.; Brown, A.; Ralph, K.J.J.o.T.; Use, L. Synergistic neighborhood relationships with travel behavior: An analysis of travel in 30,000 US neighborhoods. 2017, 10, 437-461.
- Bertolini, L.J.P.p. research. Spatial development patterns and public transport: the application of an analytical model in the Netherlands. 1999, 14, 199–210. [Google Scholar]
- Zhang, Y.; Marshall, S.; Manley, E.J.J.o.t.g. Network criticality and the node-place-design model: Classifying metro station areas in Greater London. 2019, 79, 102485.
- Serlie, Z. Stationslocaties in vergelijkend perspectief; 1998.
- Zweedijk, A.; Serlie, Z.J.G. Een “knoop-plaats”-model voor stationslocaties. 1998, 7, 35-37.
- Chorus, P.; Bertolini, L.J.J.o.t.; use, l. An application of the node place model to explore the spatial development dynamics of station areas in Tokyo. 2011, 4, 45-58.
- Chen, X.; Lin, L.J.H.I. The node-place analysis on the “hubtropolis” urban form: The case of Shanghai Hongqiao air-rail hub. 2015, 49, 445-453.
- Babb, C.; Duckworth-Smith, A.; Falconer, R.; Isted, R.; Olaru, D.; Biermann, S. The performance and potential of rail stations in and outside freeway medians: the application of a node/place model to Perth. In Proceedings of the Australasian Transport Research Forum (ATRF), 37th, 2015, Sydney, New South Wales, Australia, 2015. [Google Scholar]
- Duckworth-Smith, A.; Babb, C. Indicating quality of place for station precinct development: enhancing'place'in the place/node model. 2015.
- Kim, H.; Sultana, S.; Weber, J.J.T.P. A geographic assessment of the economic development impact of Korean high-speed rail stations. 2018, 66, 127-137.
- Su, S.; Zhang, H.; Wang, M.; Weng, M.; Kang, M.J.J.o.t.g. Transit-oriented development (TOD) typologies around metro station areas in urban China: A comparative analysis of five typical megacities for planning implications. 2021, 90, 102939.
- Vale, D.S.; Viana, C.M.; Pereira, M.J.J.o.T.G. The extended node-place model at the local scale: Evaluating the integration of land use and transport for Lisbon's subway network. 2018, 69, 282-293.
- Cao, K.; Huang, B.; Wang, S.; Lin, H.J.C., Environment; Systems, U. Sustainable land use optimization using Boundary-based Fast Genetic Algorithm. 2012, 36, 257-269.
- Liu, D.; Tang, W.; Liu, Y.; Zhao, X.; He, J.J.A.G. Optimal rural land use allocation in central China: Linking the effect of spatiotemporal patterns and policy interventions. 2017, 86, 165-182.
- Liu, X.; Ou, J.; Li, X.; Ai, B.J.E.M. Combining system dynamics and hybrid particle swarm optimization for land use allocation. 2013, 257, 11-24.
- Mohammadi, M.; Nastaran, M.; Sahebgharani, A.J.C., Environment; Systems, U. Development, application, and comparison of hybrid meta-heuristics for urban land-use allocation optimization: Tabu search, genetic, GRASP, and simulated annealing algorithms. 2016, 60, 23-36.
- Feng, Y.; Liu, Y.; Tong, X.J.C., Environment; Systems, U. Comparison of metaheuristic cellular automata models: A case study of dynamic land use simulation in the Yangtze River Delta. 2018, 70, 138-150.
- Ding, C.; Cao, X.; Liu, C.J.J.o.T.G. How does the station-area built environment influence Metrorail ridership? Using gradient boosting decision trees to identify non-linear thresholds. 2019, 77, 70–78. [Google Scholar]
- Mirghaed, F.A.; Mohammadzadeh, M.; Salmanmahiny, A.; Mirkarimi, S.H.J.E.I. Decision scenarios using ecosystem services for land allocation optimization across Gharehsoo watershed in northern Iran. 2020, 117, 106645.
- Zeng, L.; Li, J.; Zhou, Z.; Yu, Y.J.E.I. Optimizing land use patterns for the grain for Green Project based on the efficiency of ecosystem services under different objectives. 2020, 114, 106347.
- Rahman, M.M.; Szabó, G.J.S.C. Society. Multi-objective urban land use optimization using spatial data: A systematic review. 2021, 74, 103214. [Google Scholar]
- Sun, G.; Wallace, D.; Webster, C.J.L.u.p. Unravelling the impact of street network structure and gated community layout in development-oriented transit design. 2020, 90, 104328.
Figure 1.
Model theory. (a) Classical NP model; (b) Improved NPF model.
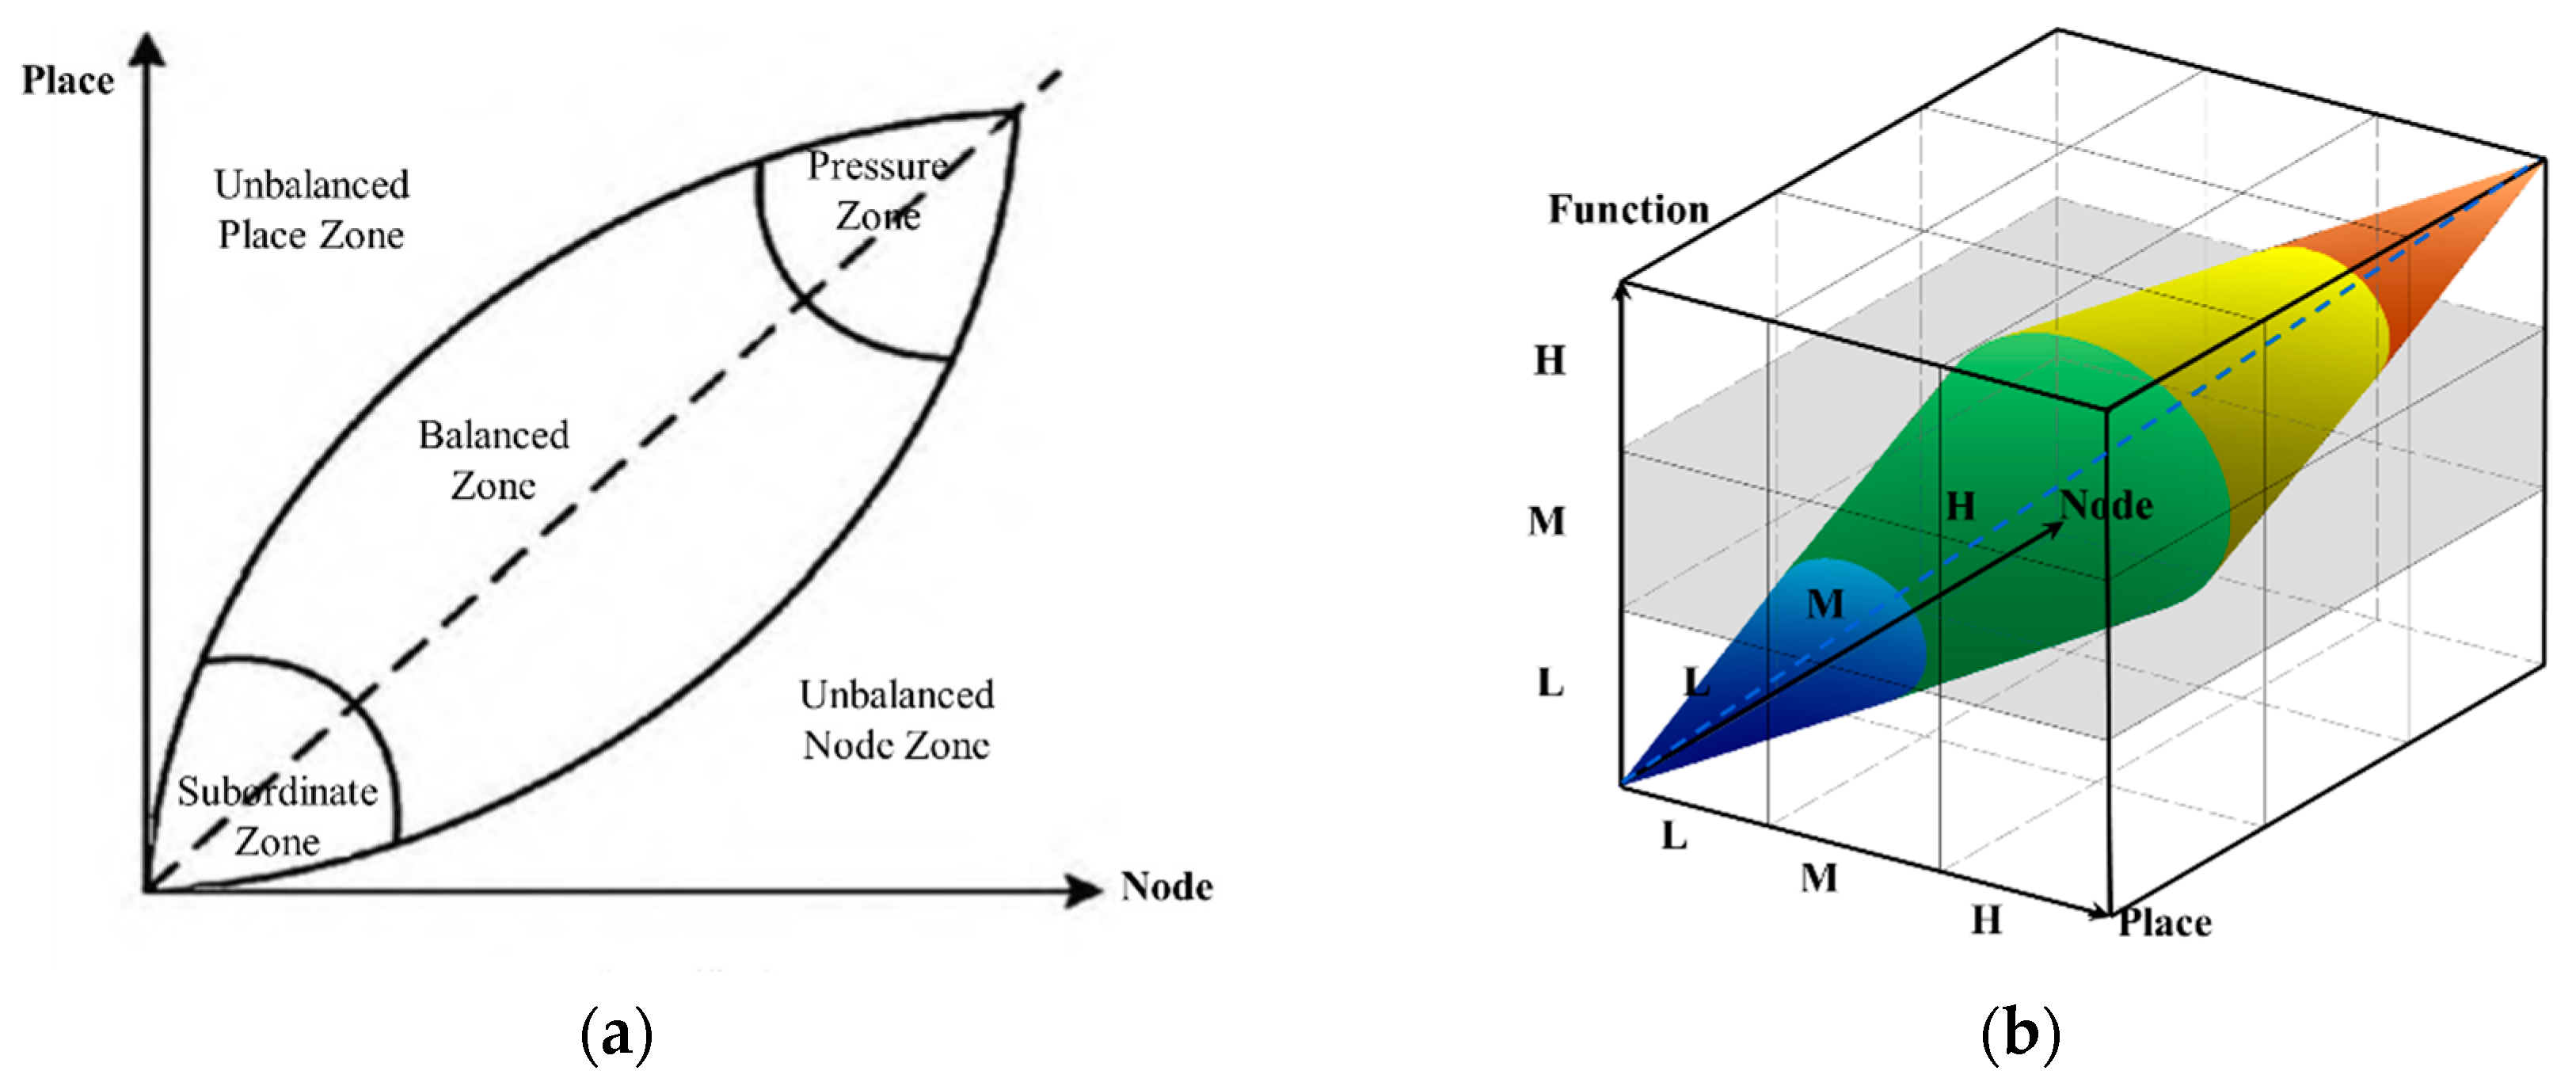
Figure 2.
The location and subway stations and routes of Qingdao City (China).
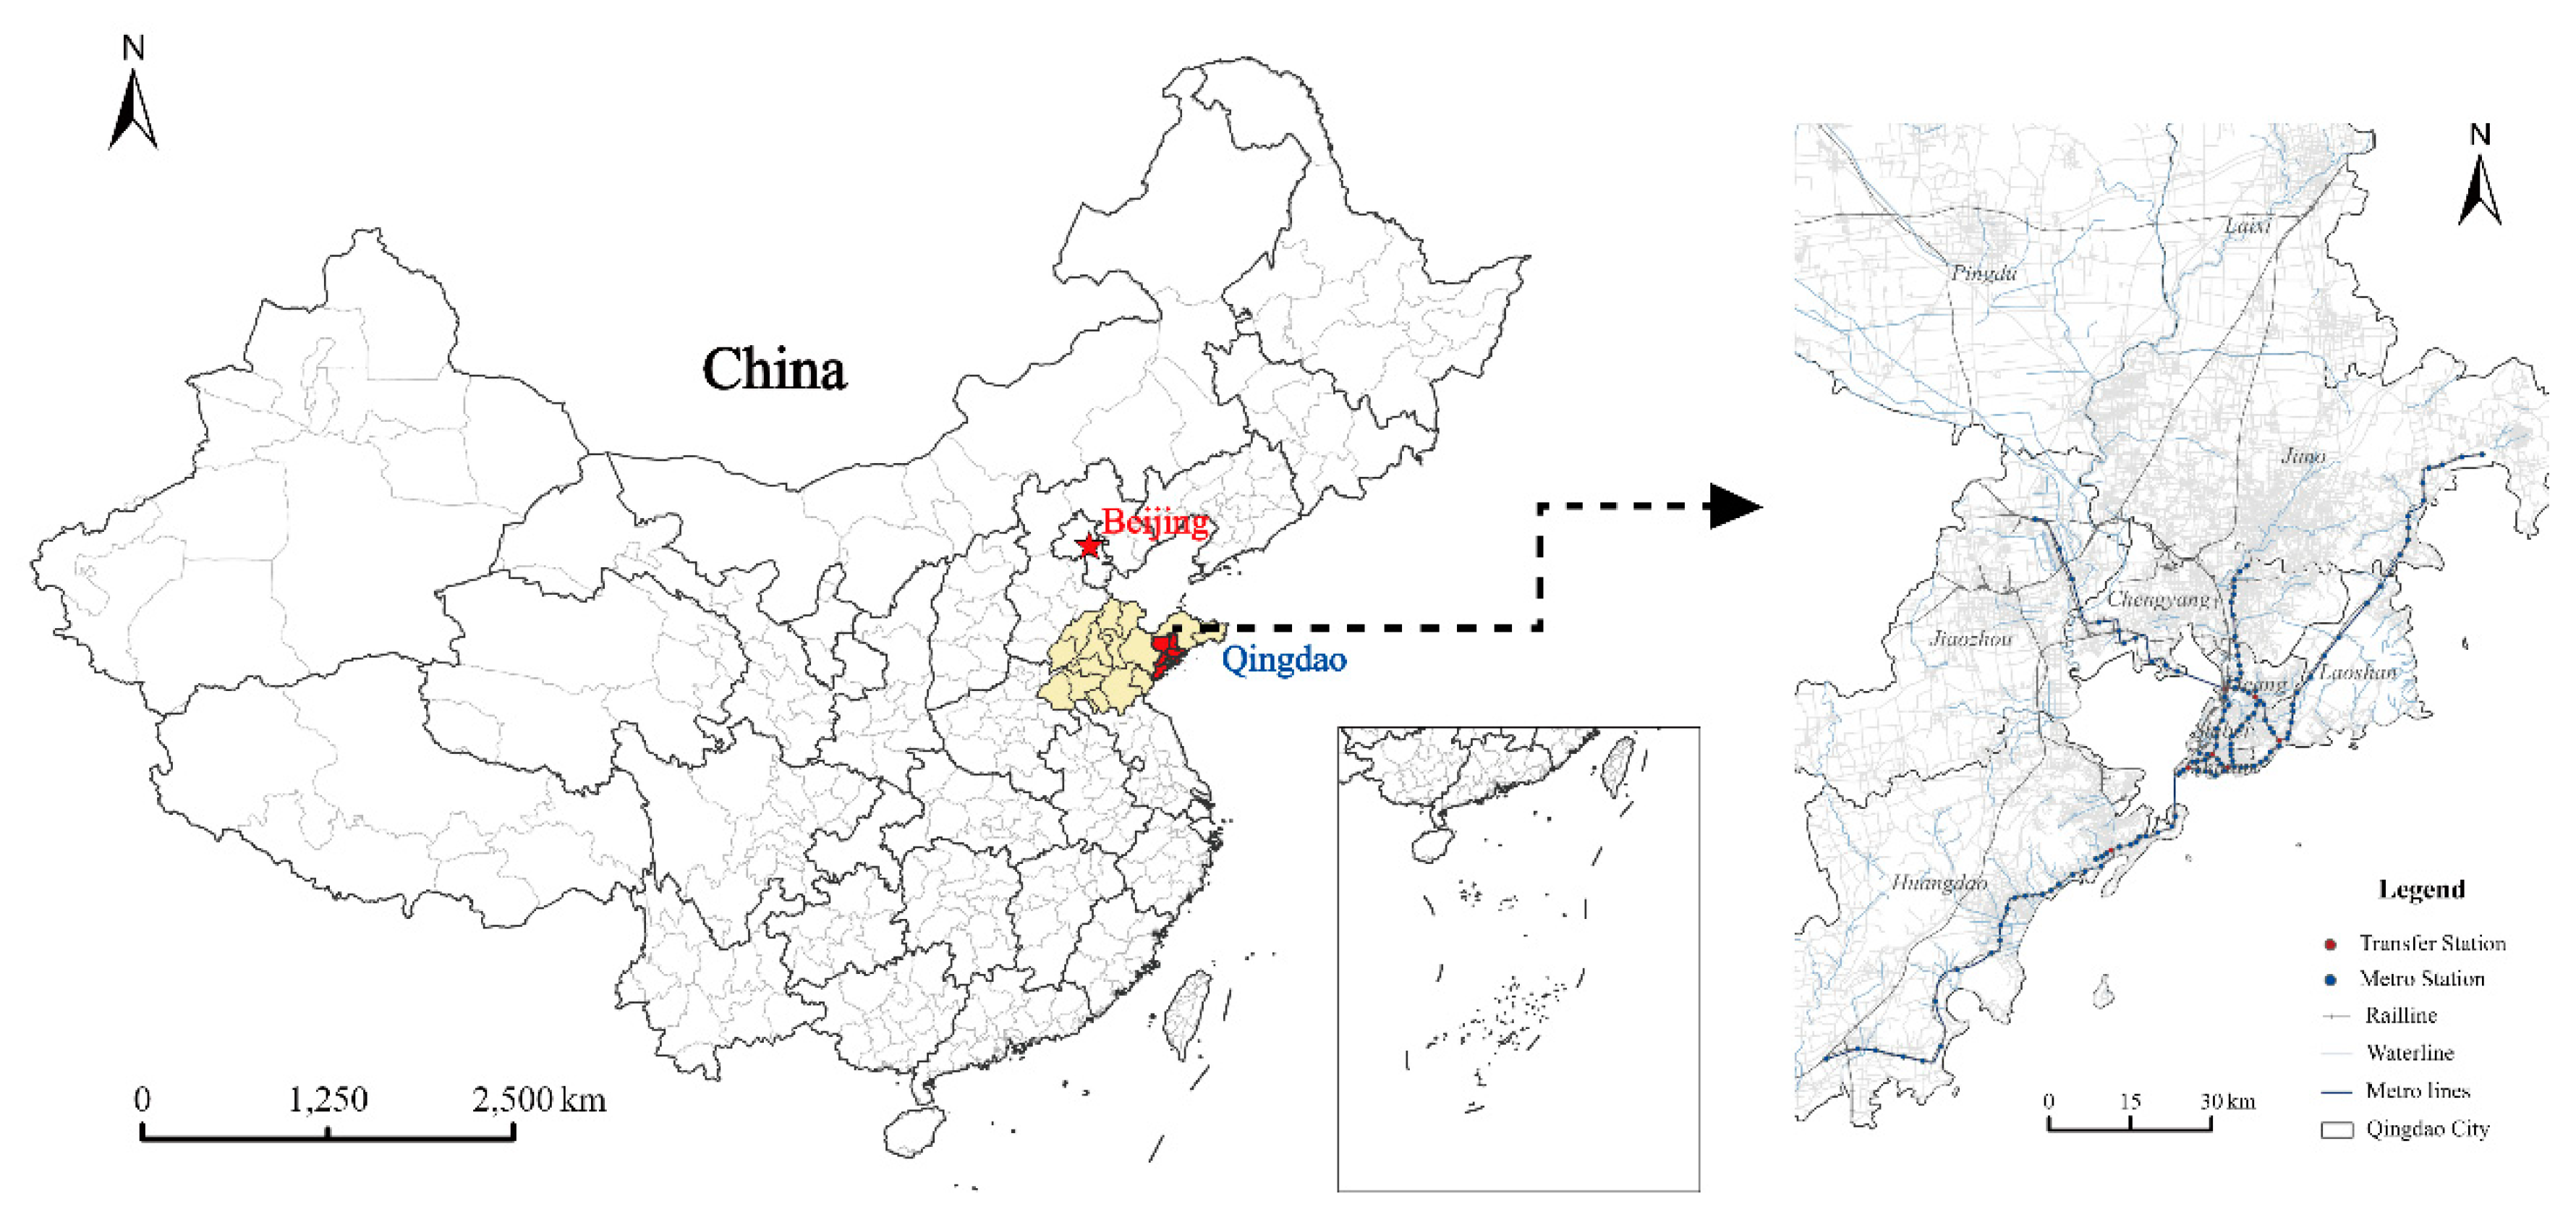
Figure 3.
Methodological framework.
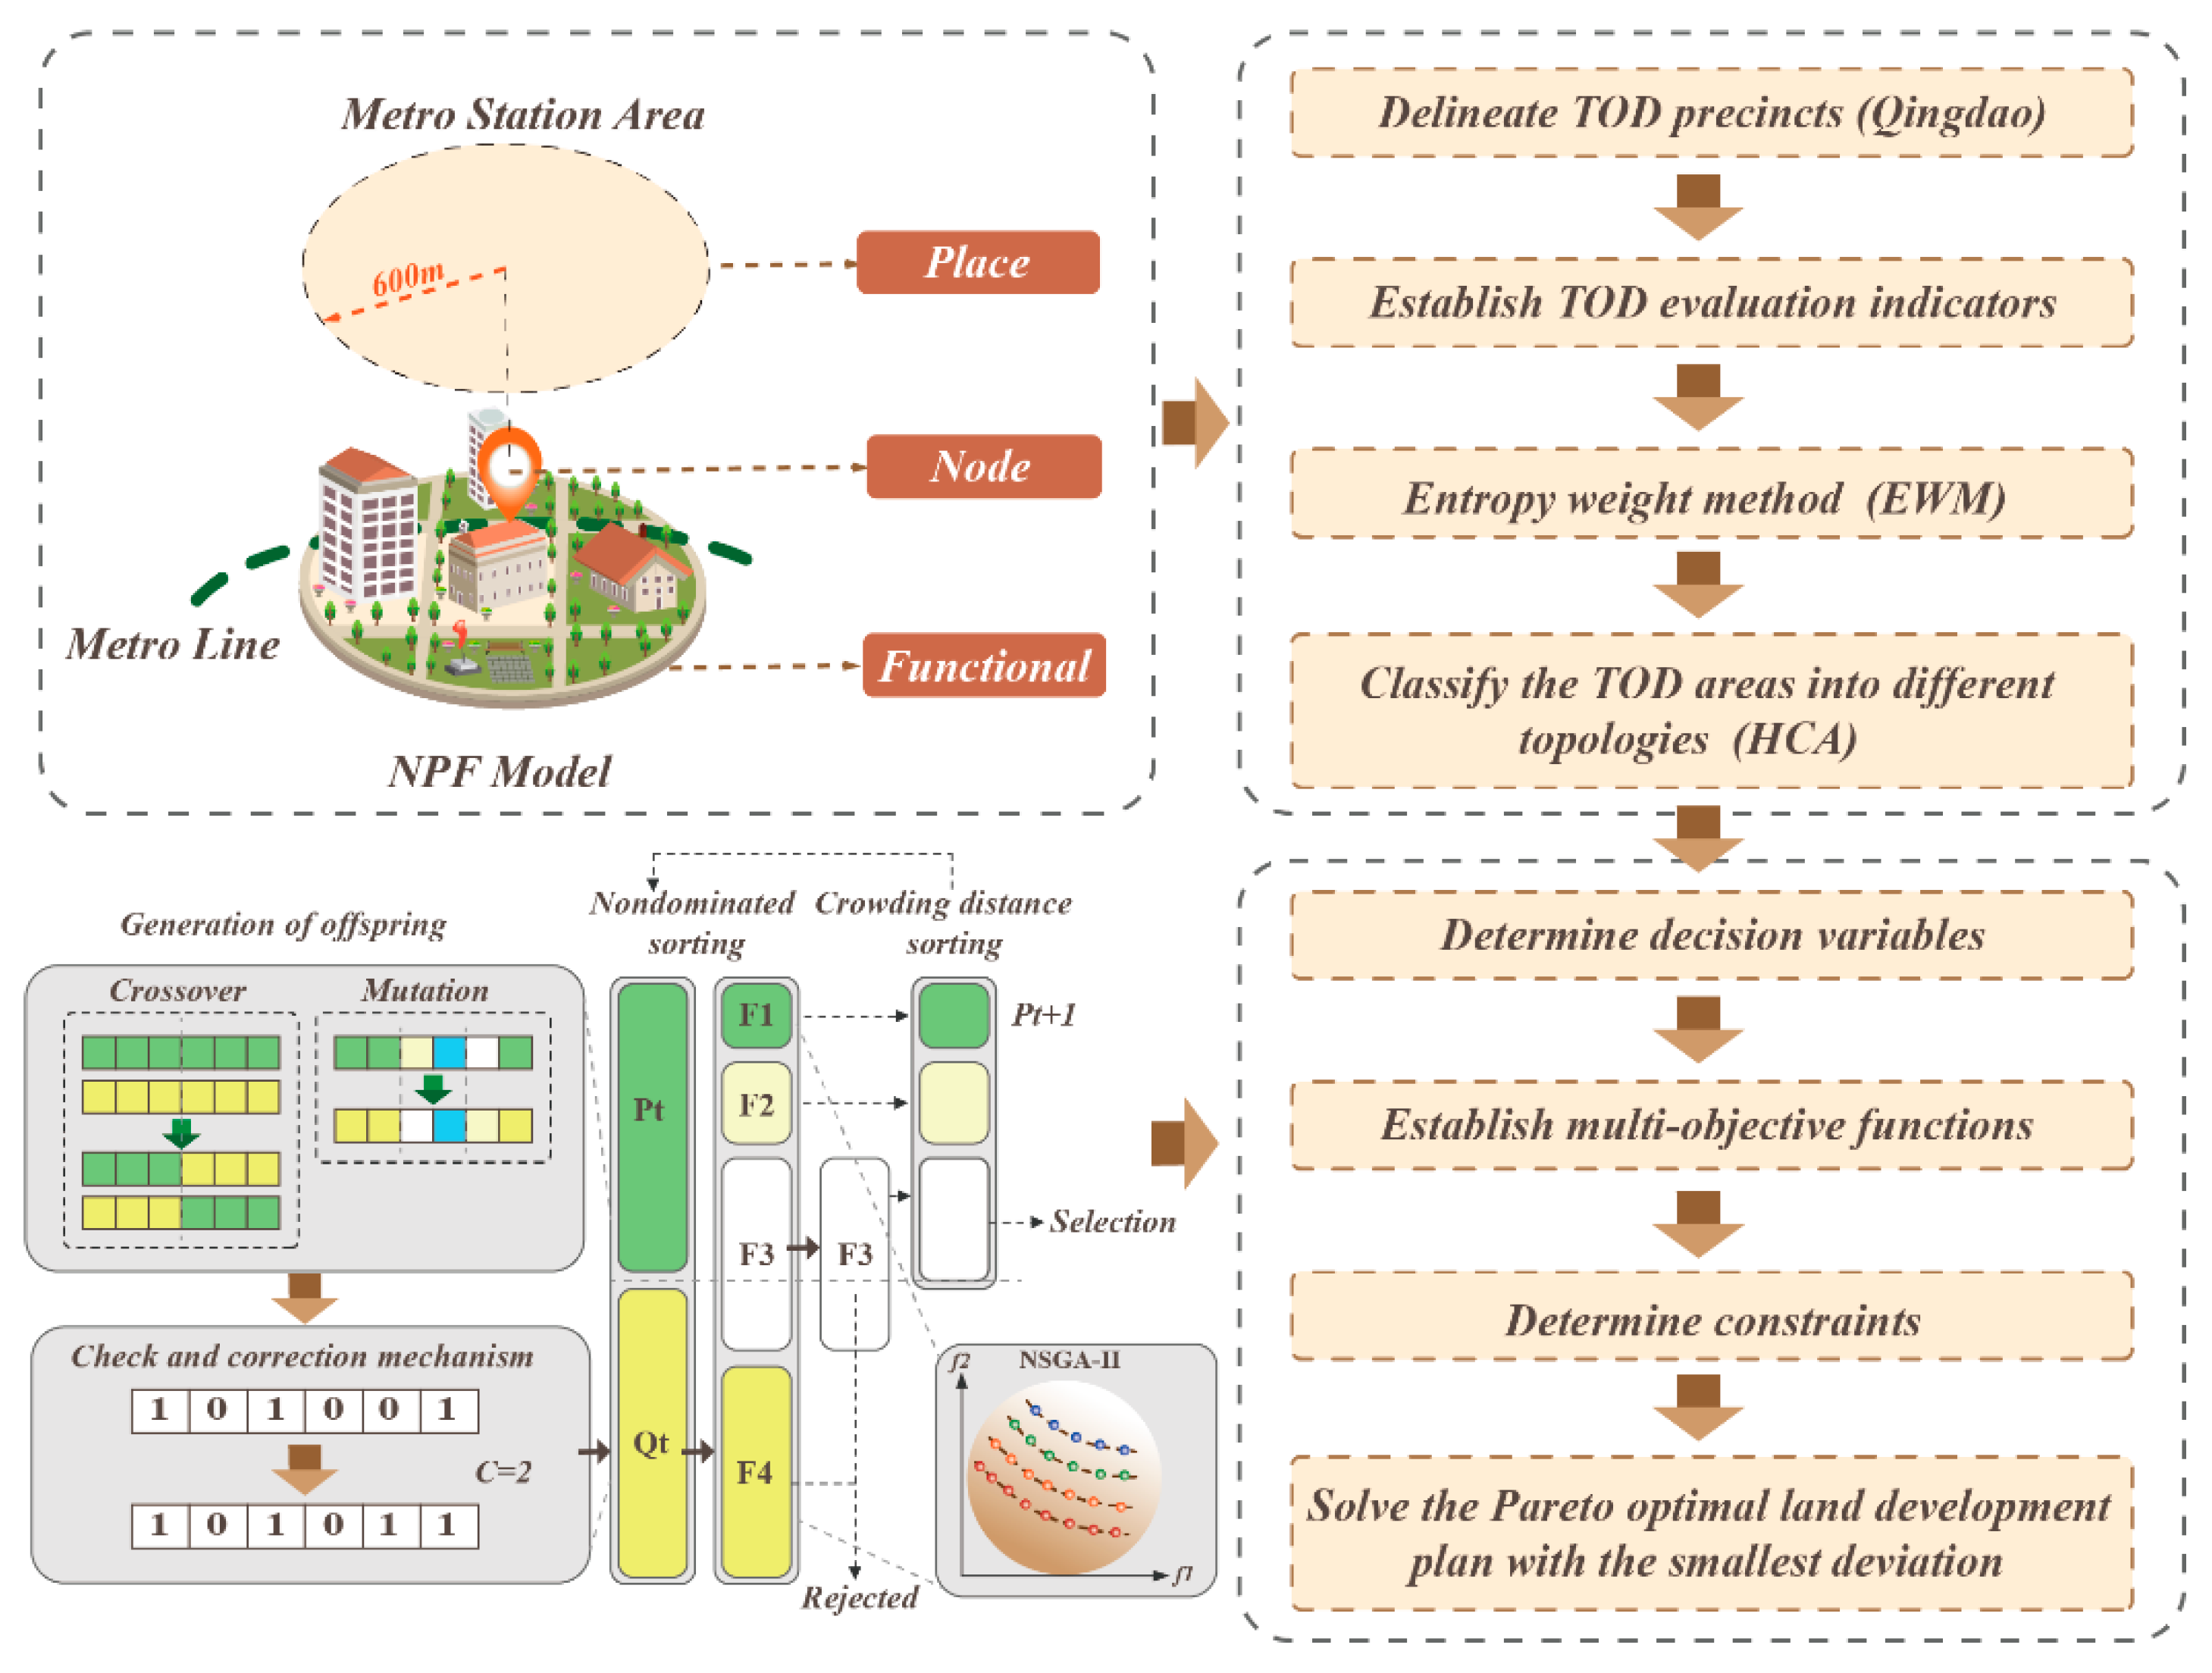
Figure 4.
Schematic diagram of the hierarchical clustering method.
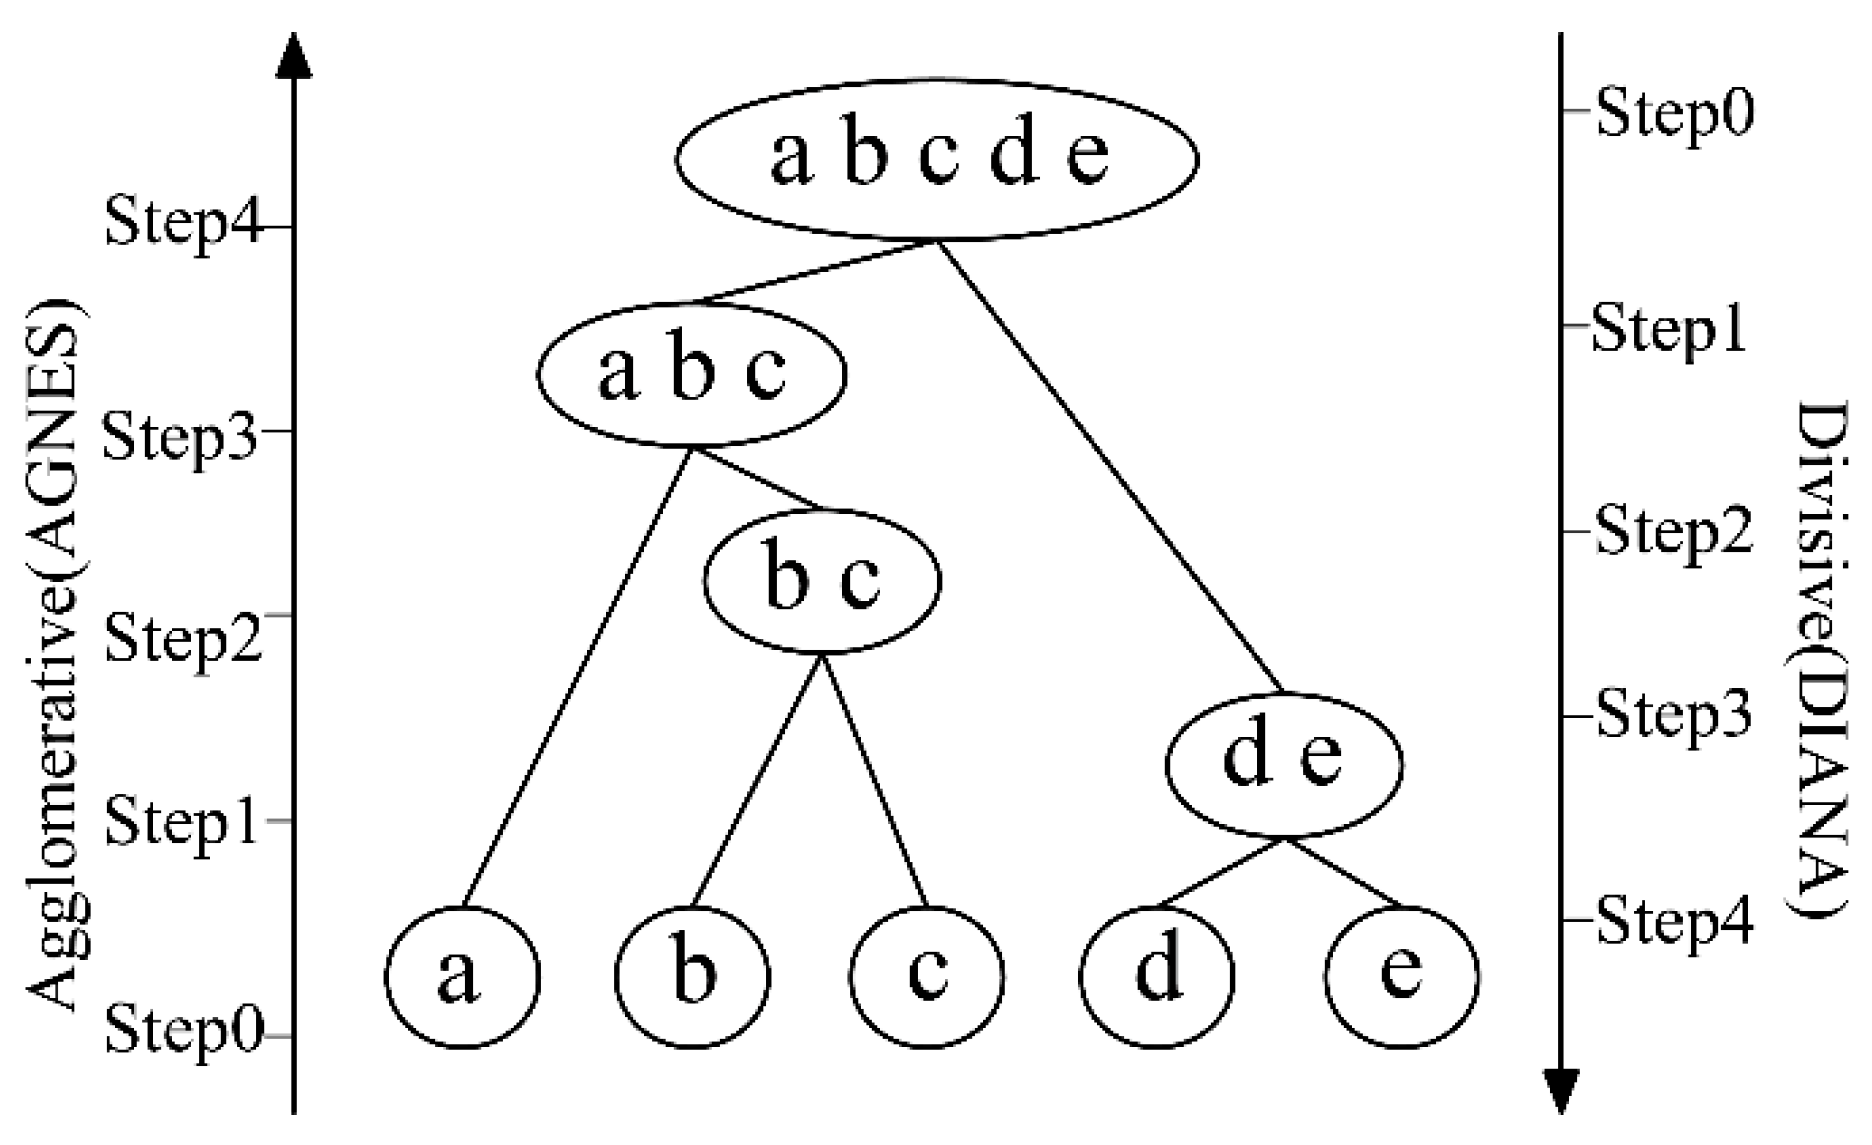
Figure 5.
NSGA-II algorithm. (a) Algorithm process; (b) Encoding form.
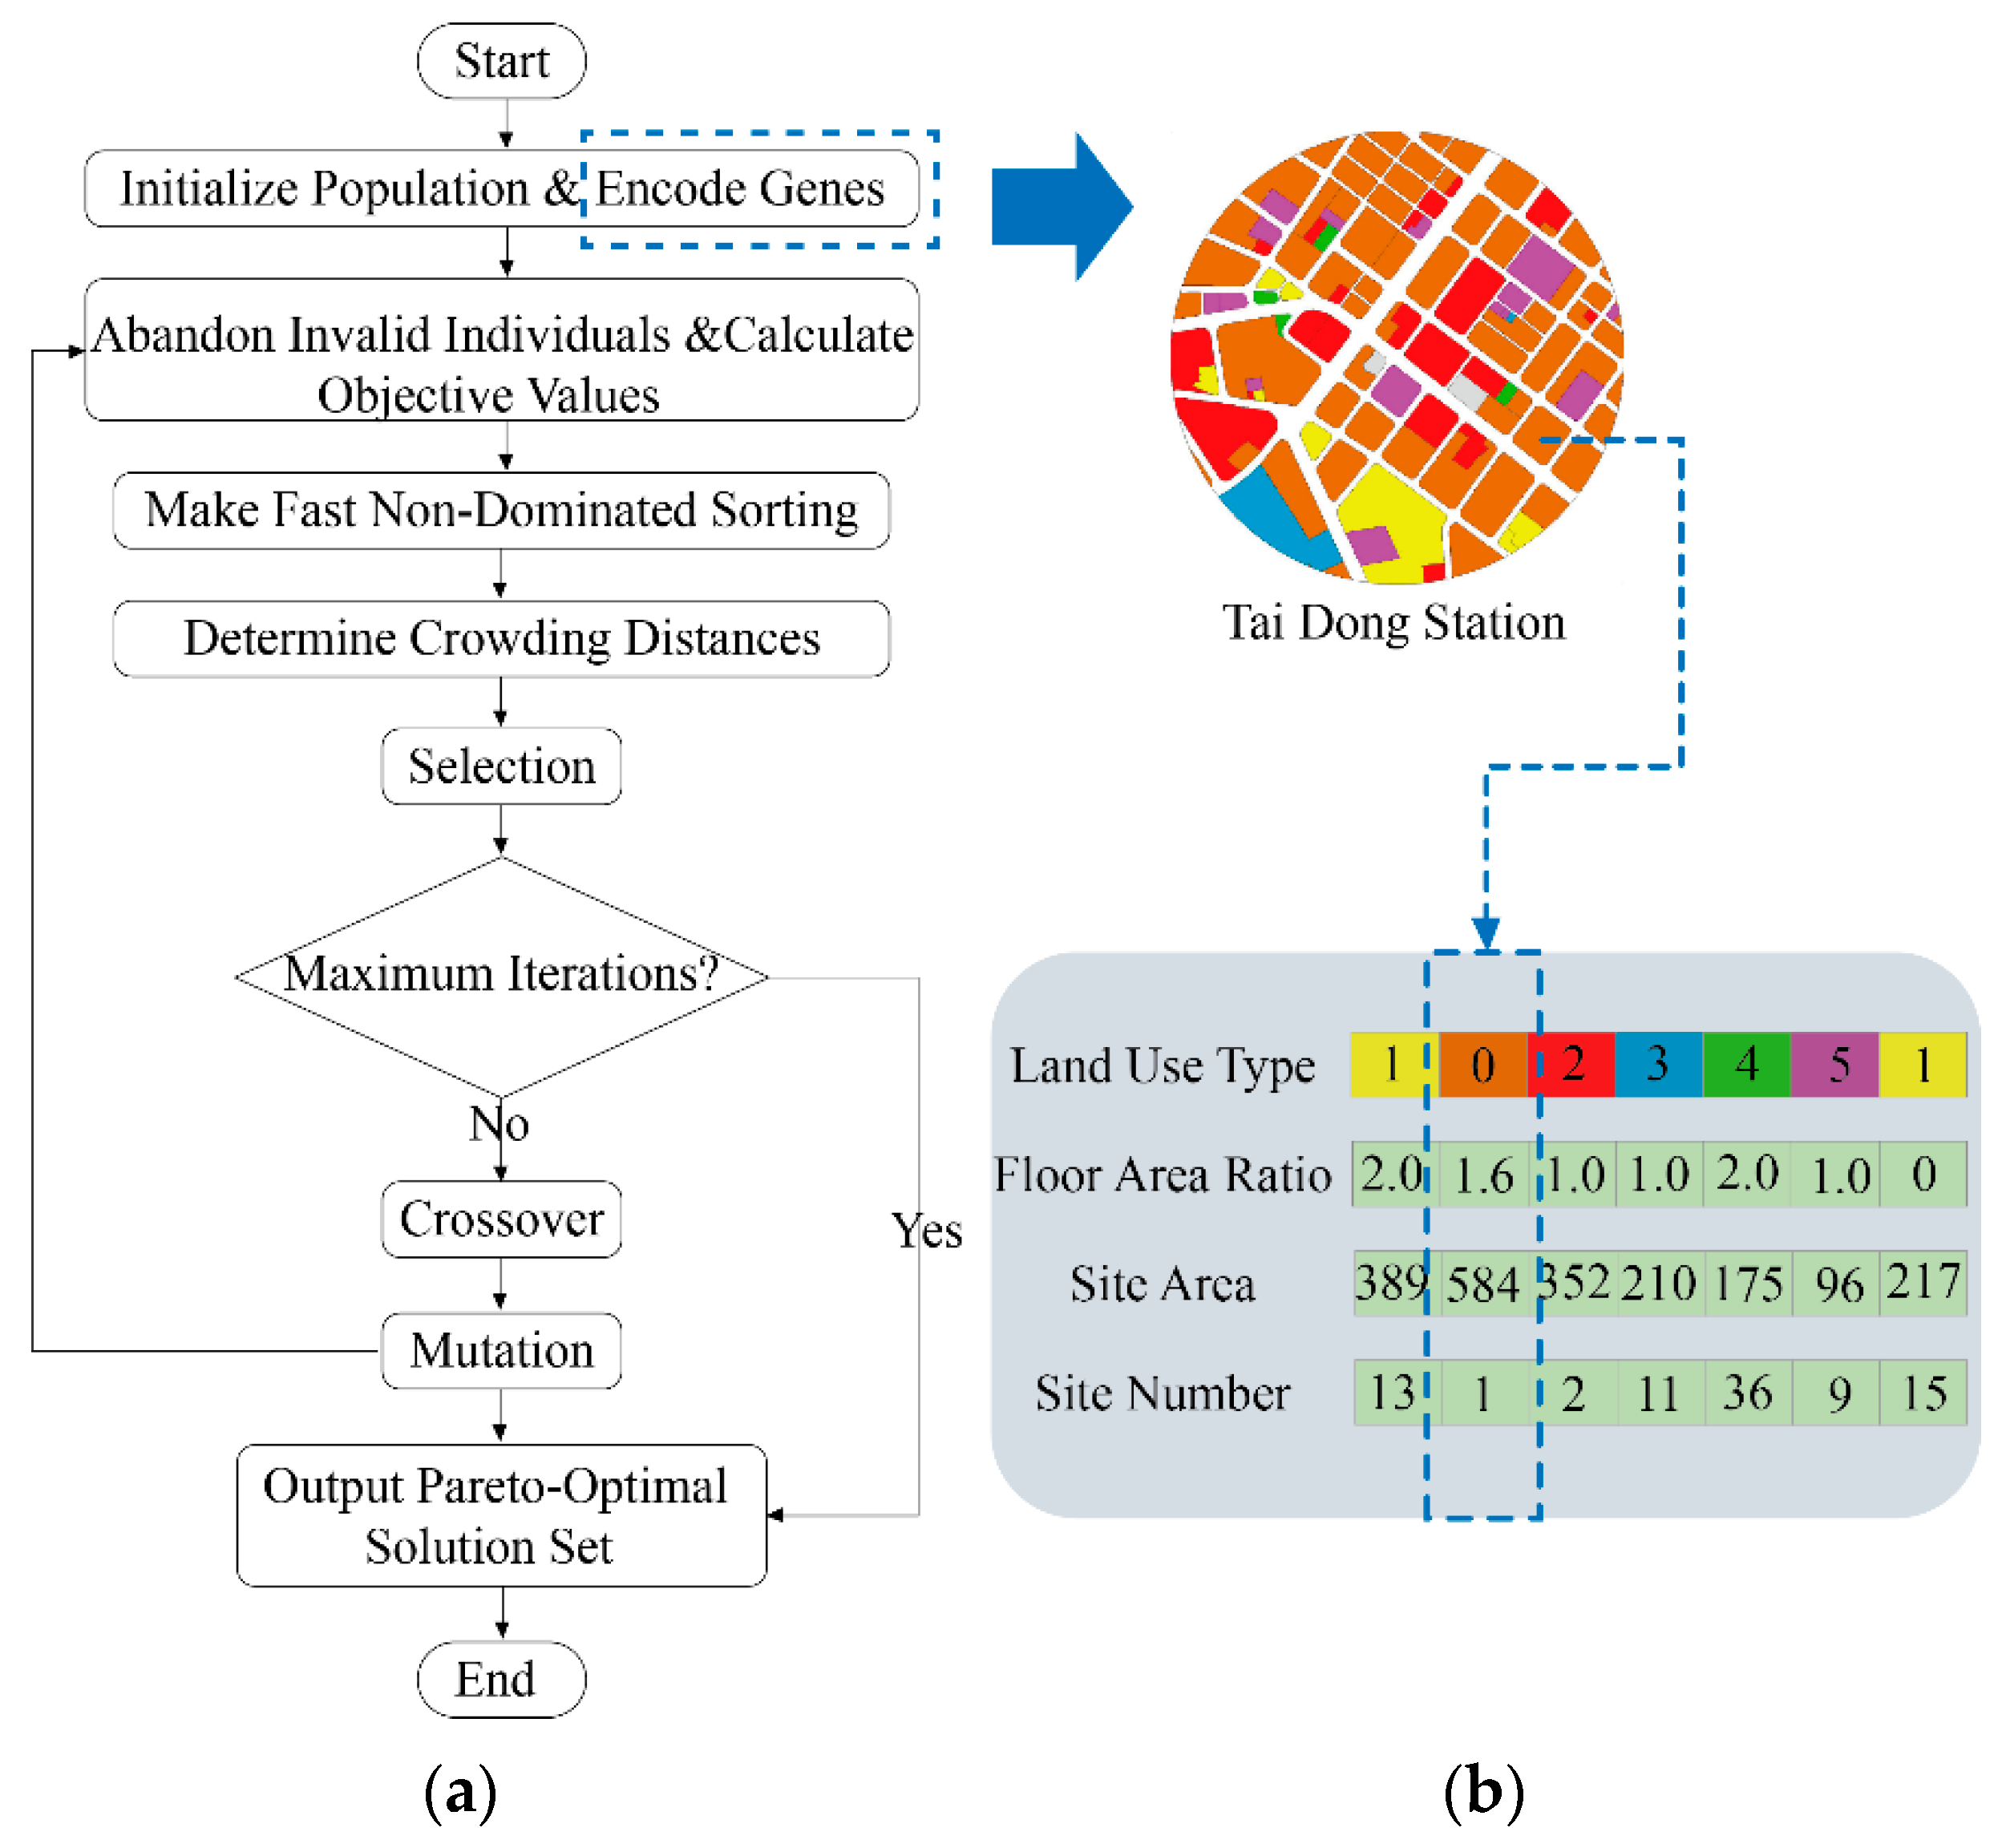
Figure 6.
TOD score of a rail transit station. (a) Node indicators; (b) Place indicators; (c) Functional indicators; (d) Comprehensive TOD indicators.
Figure 6.
TOD score of a rail transit station. (a) Node indicators; (b) Place indicators; (c) Functional indicators; (d) Comprehensive TOD indicators.
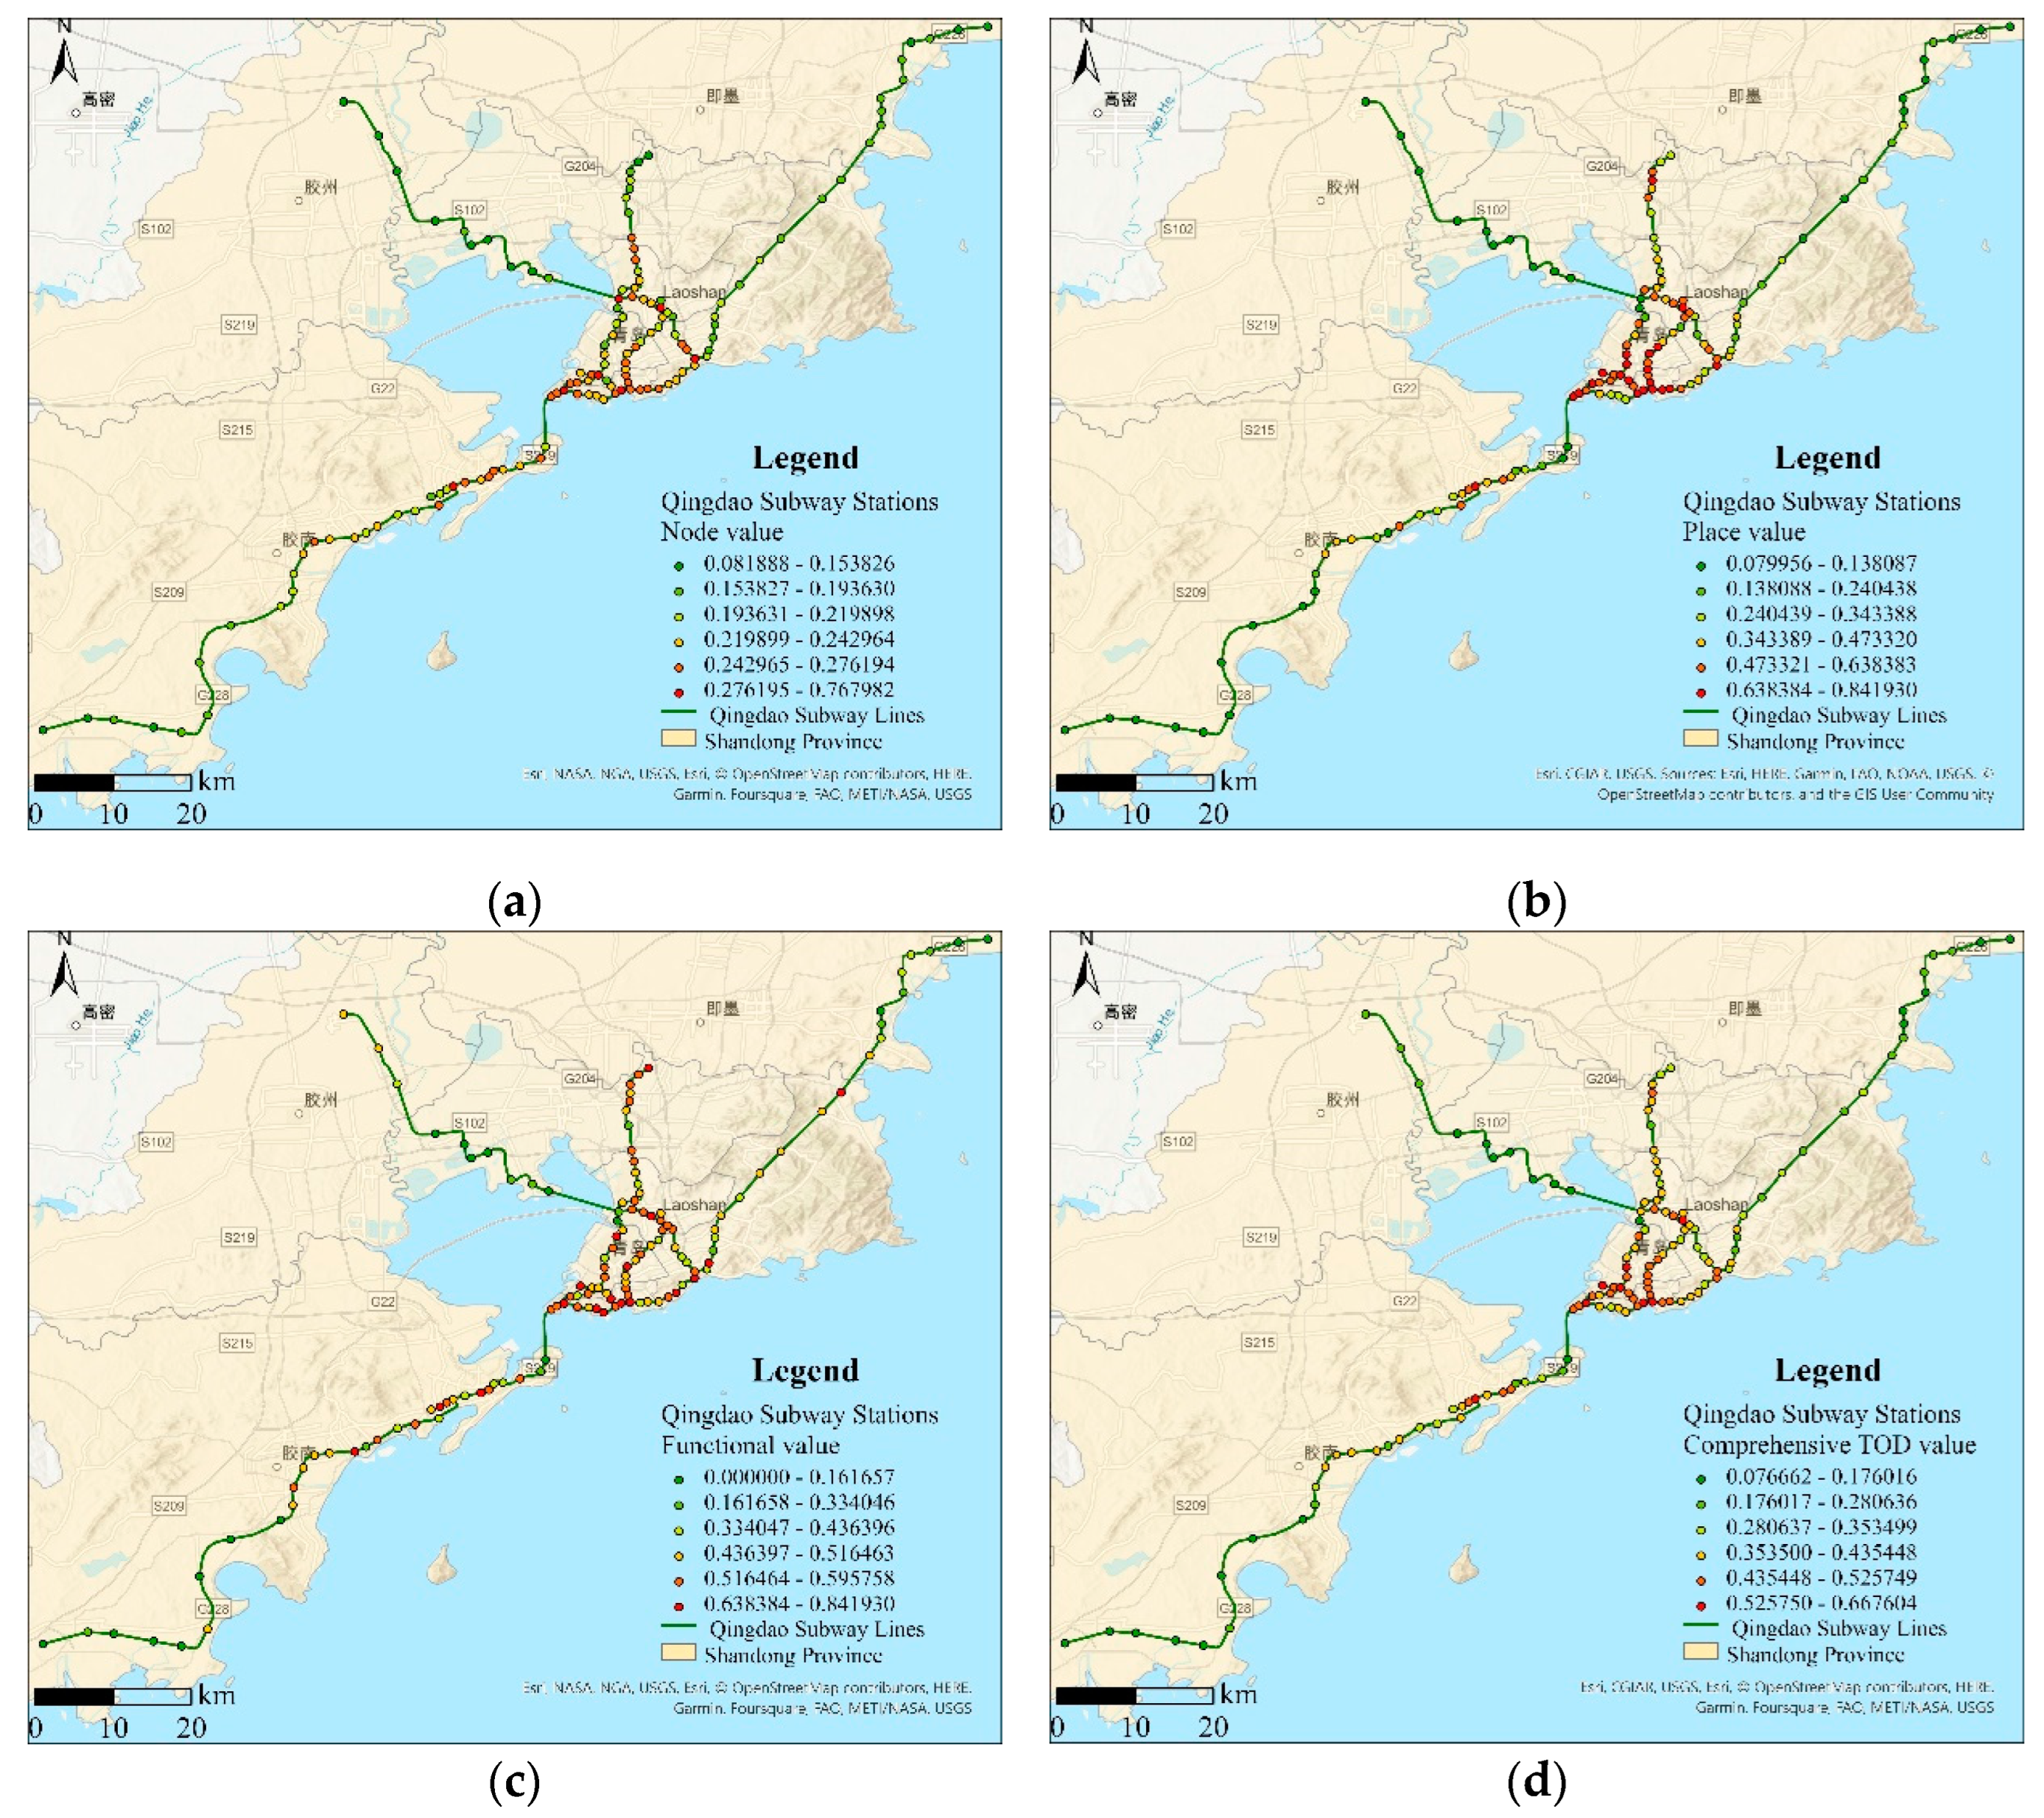
Figure 7.
Rail transit station clustering result. (a) TOD clustering results; (b) Comprehensive TOD index.
Figure 7.
Rail transit station clustering result. (a) TOD clustering results; (b) Comprehensive TOD index.
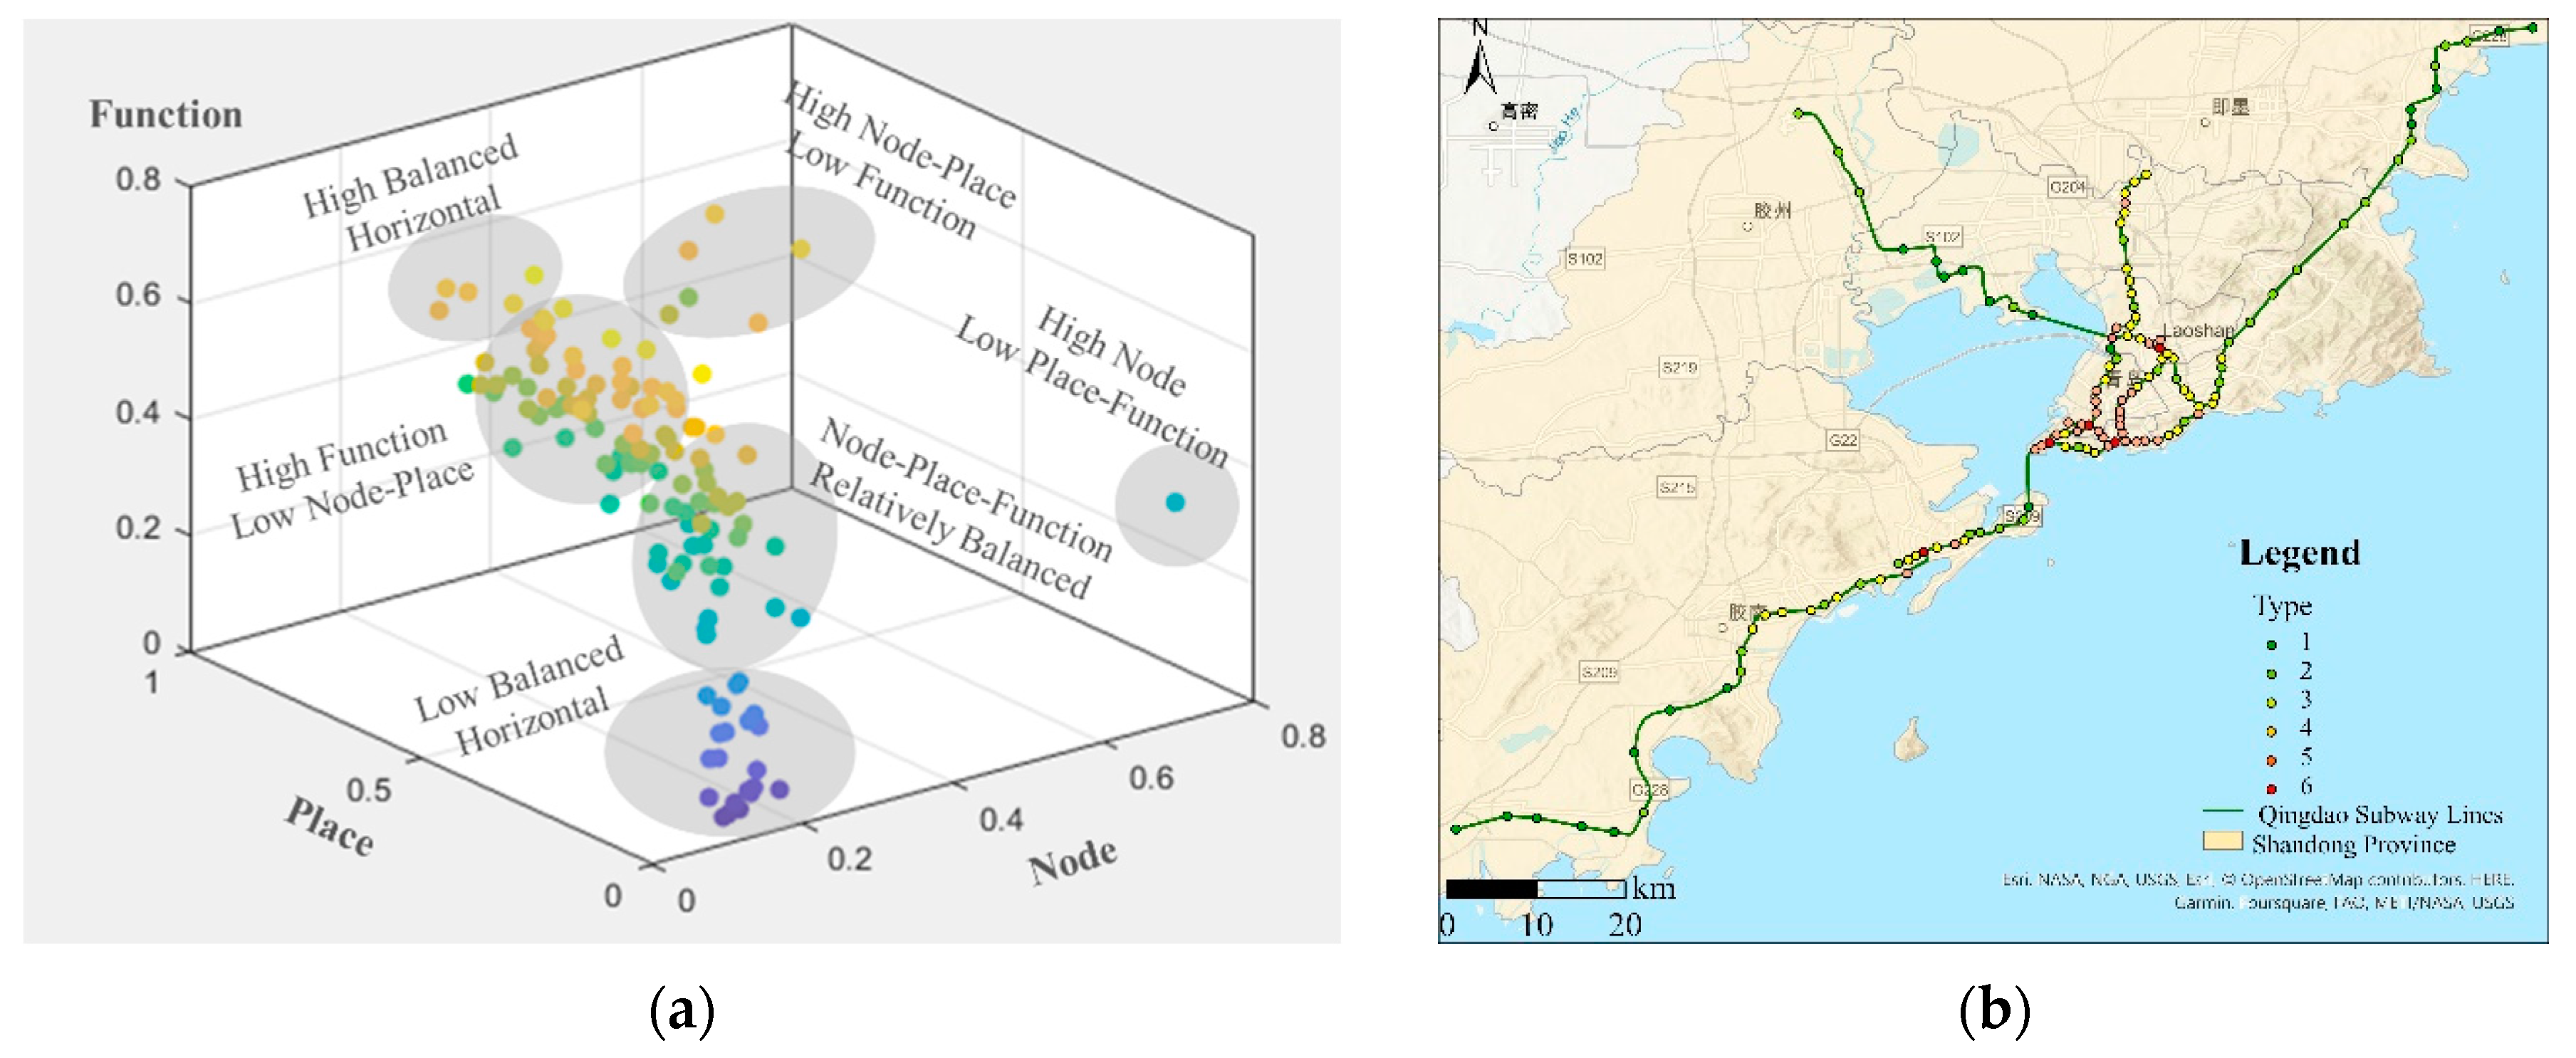
Figure 8.
Pareto frontier graph. (a) Optimal solution set between Z1 and Z3; (b) Optimal solution set between Z2 and Z3; (c) Optimal solution set between Z1 and Z2.
Figure 8.
Pareto frontier graph. (a) Optimal solution set between Z1 and Z3; (b) Optimal solution set between Z2 and Z3; (c) Optimal solution set between Z1 and Z2.
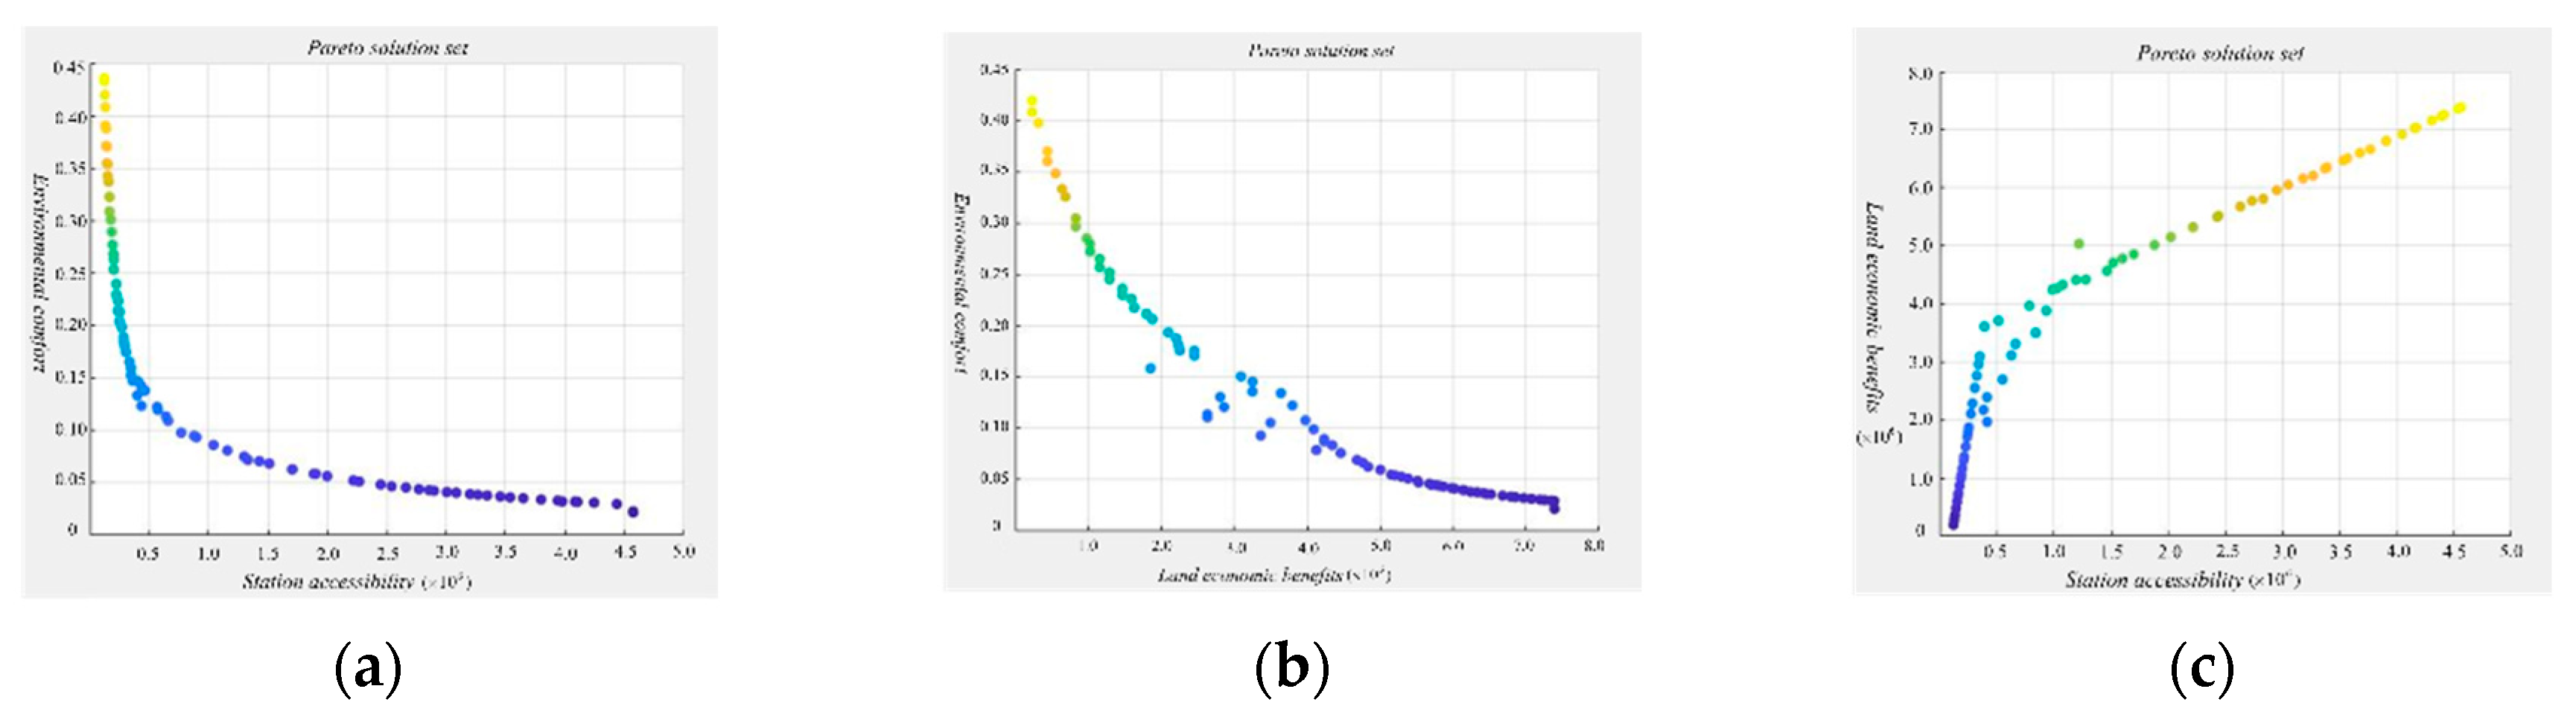
Figure 9.
Land use status map.
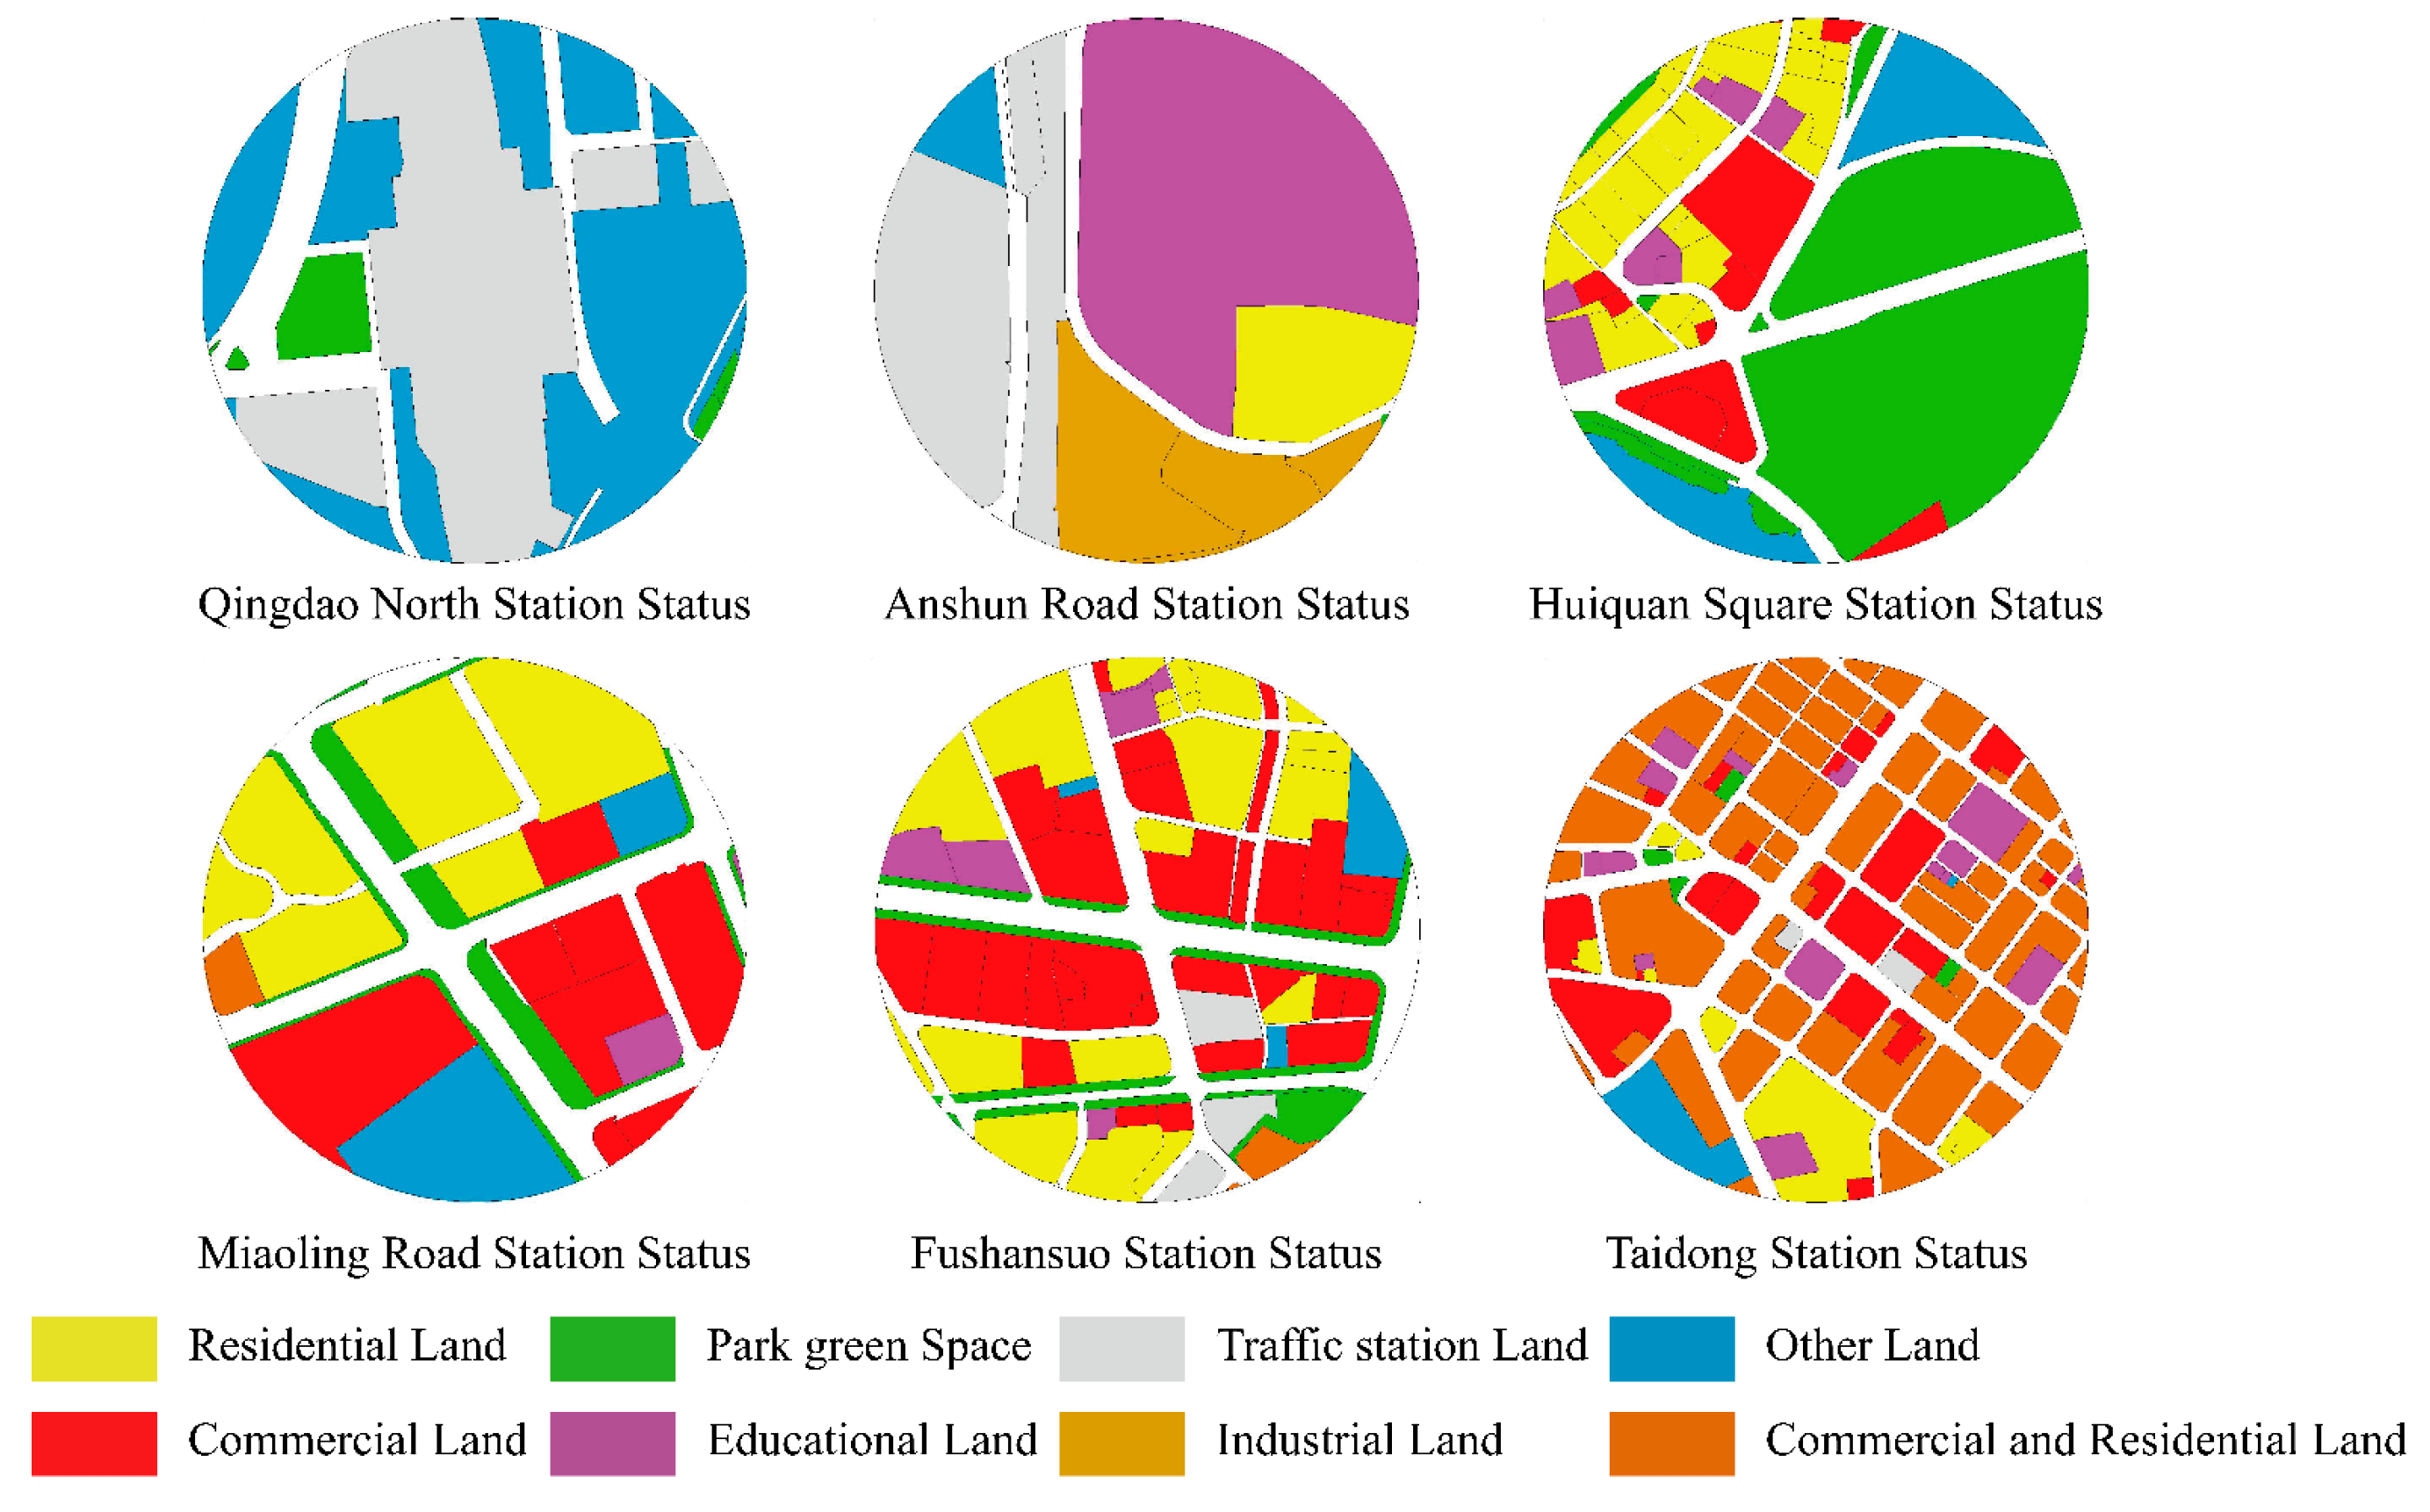
Figure 10.
Land use optimization map.
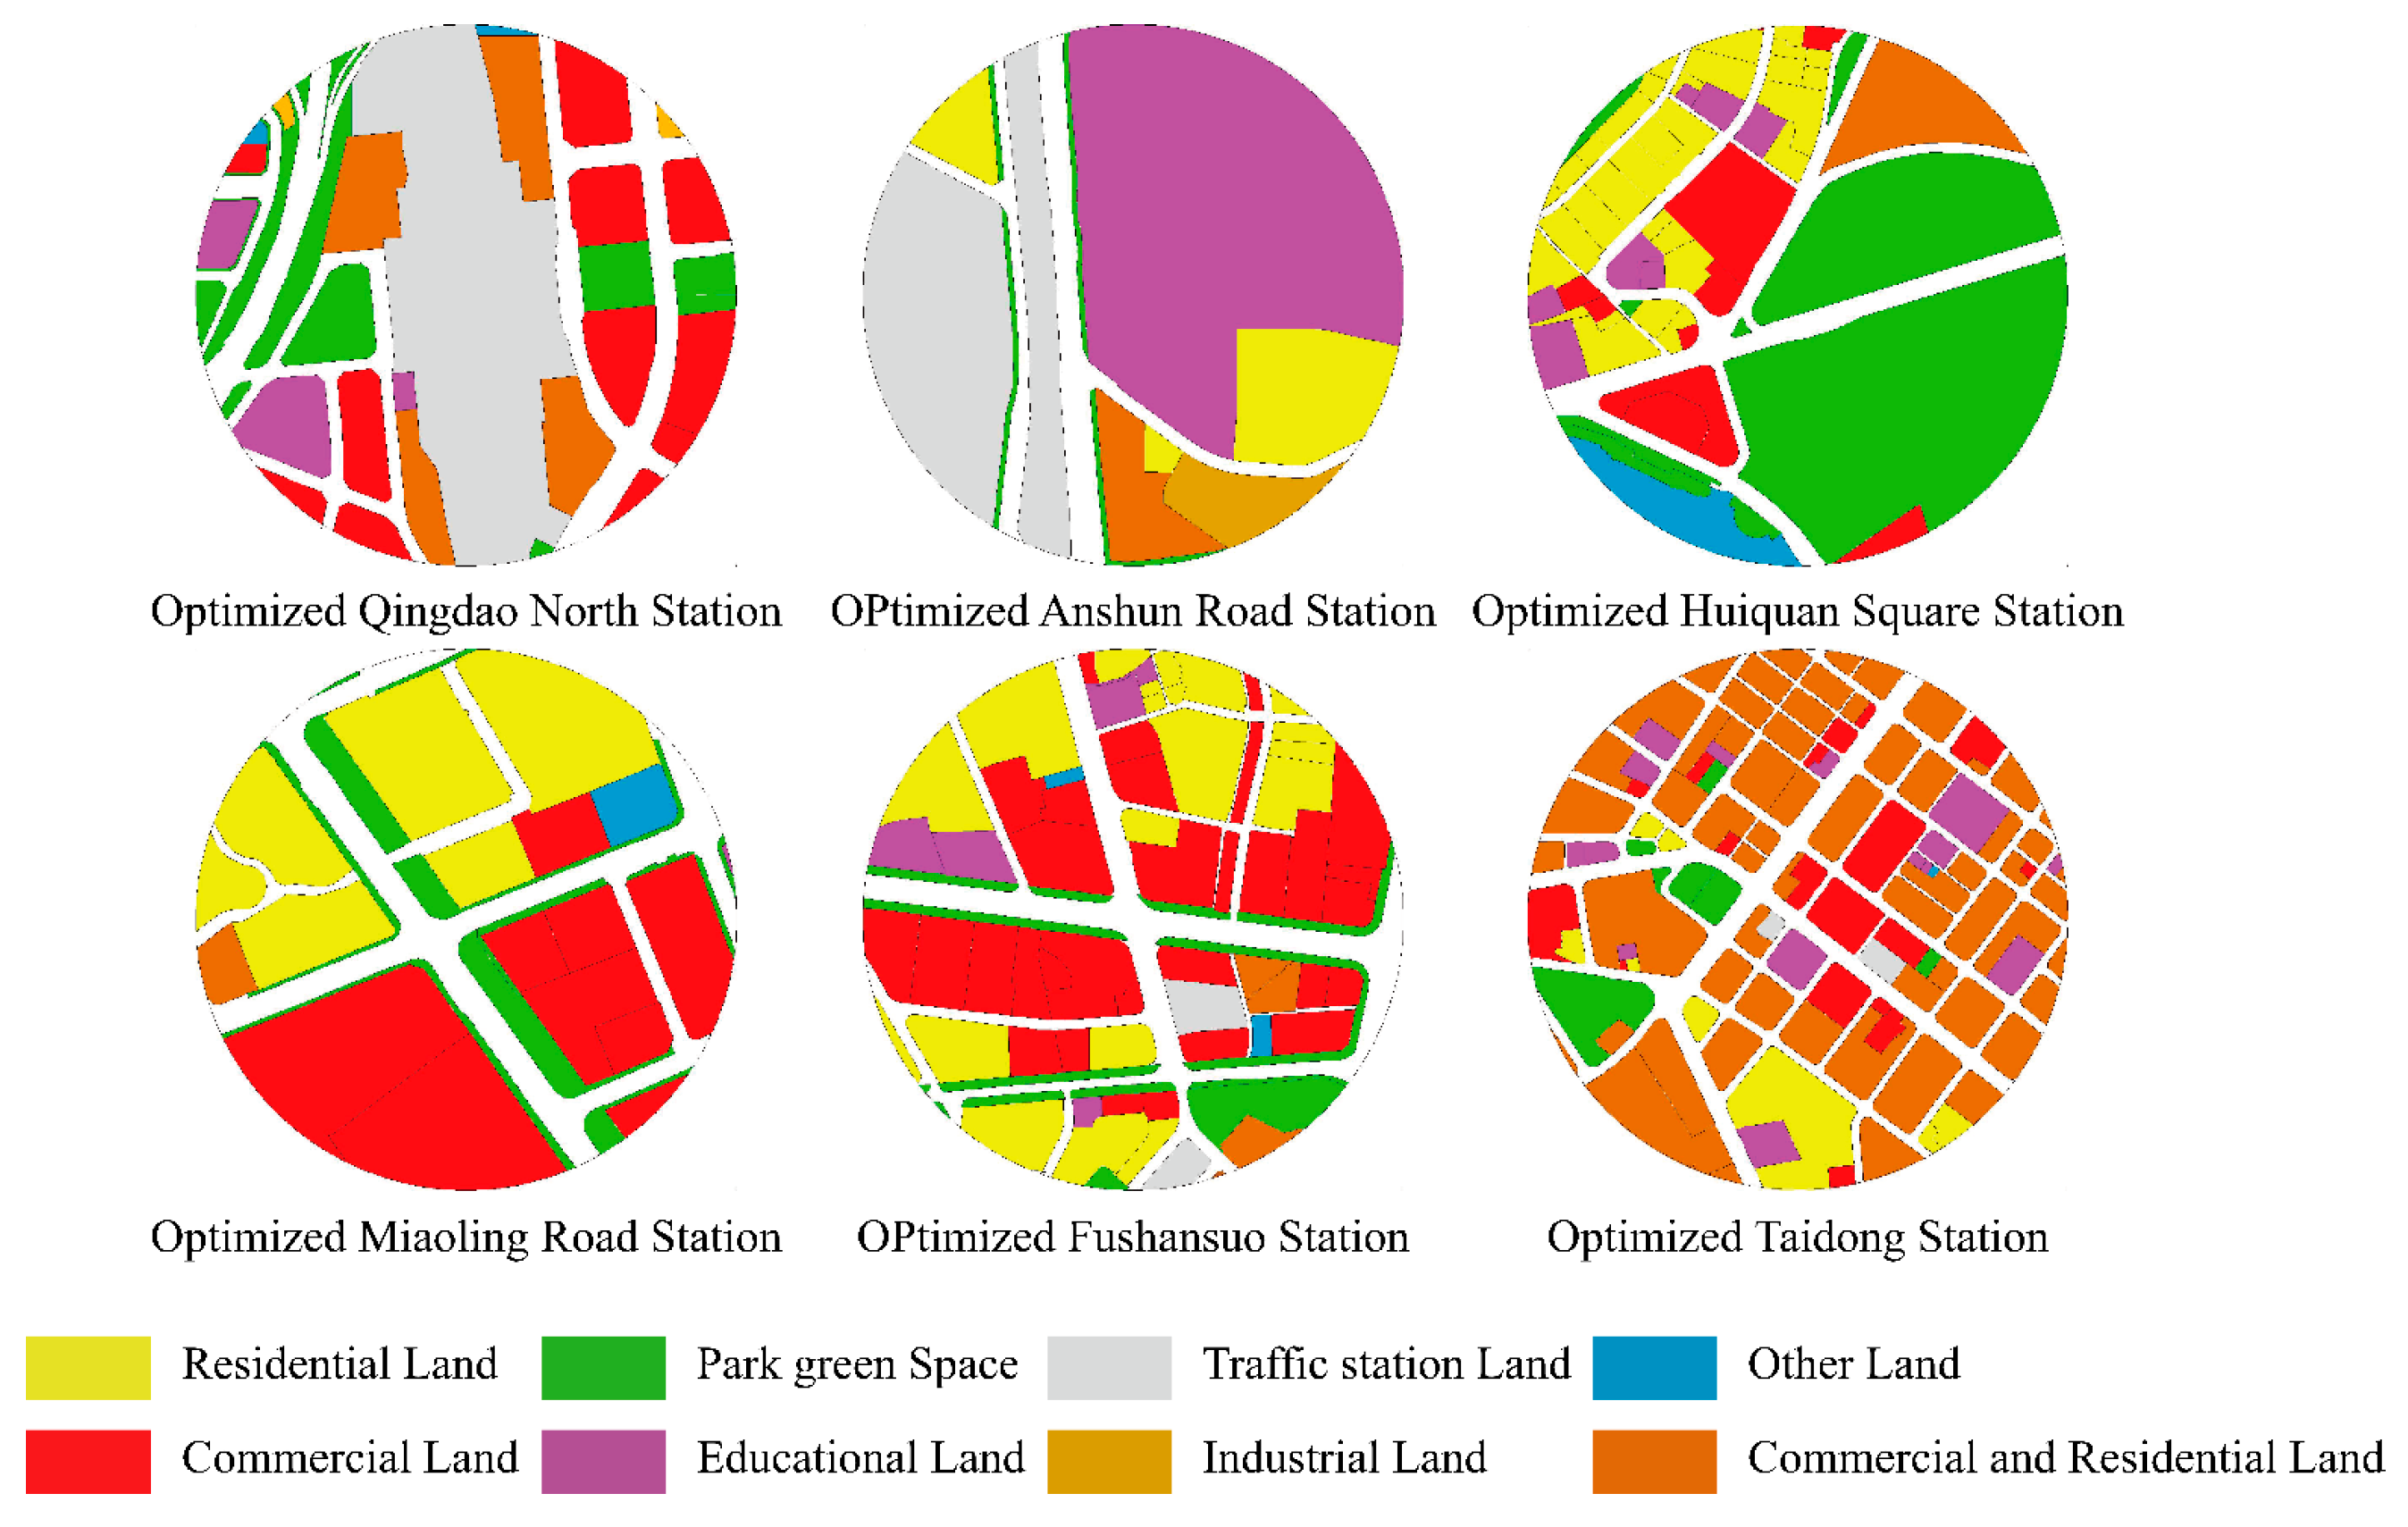
Figure 11.
Land use optimization map.
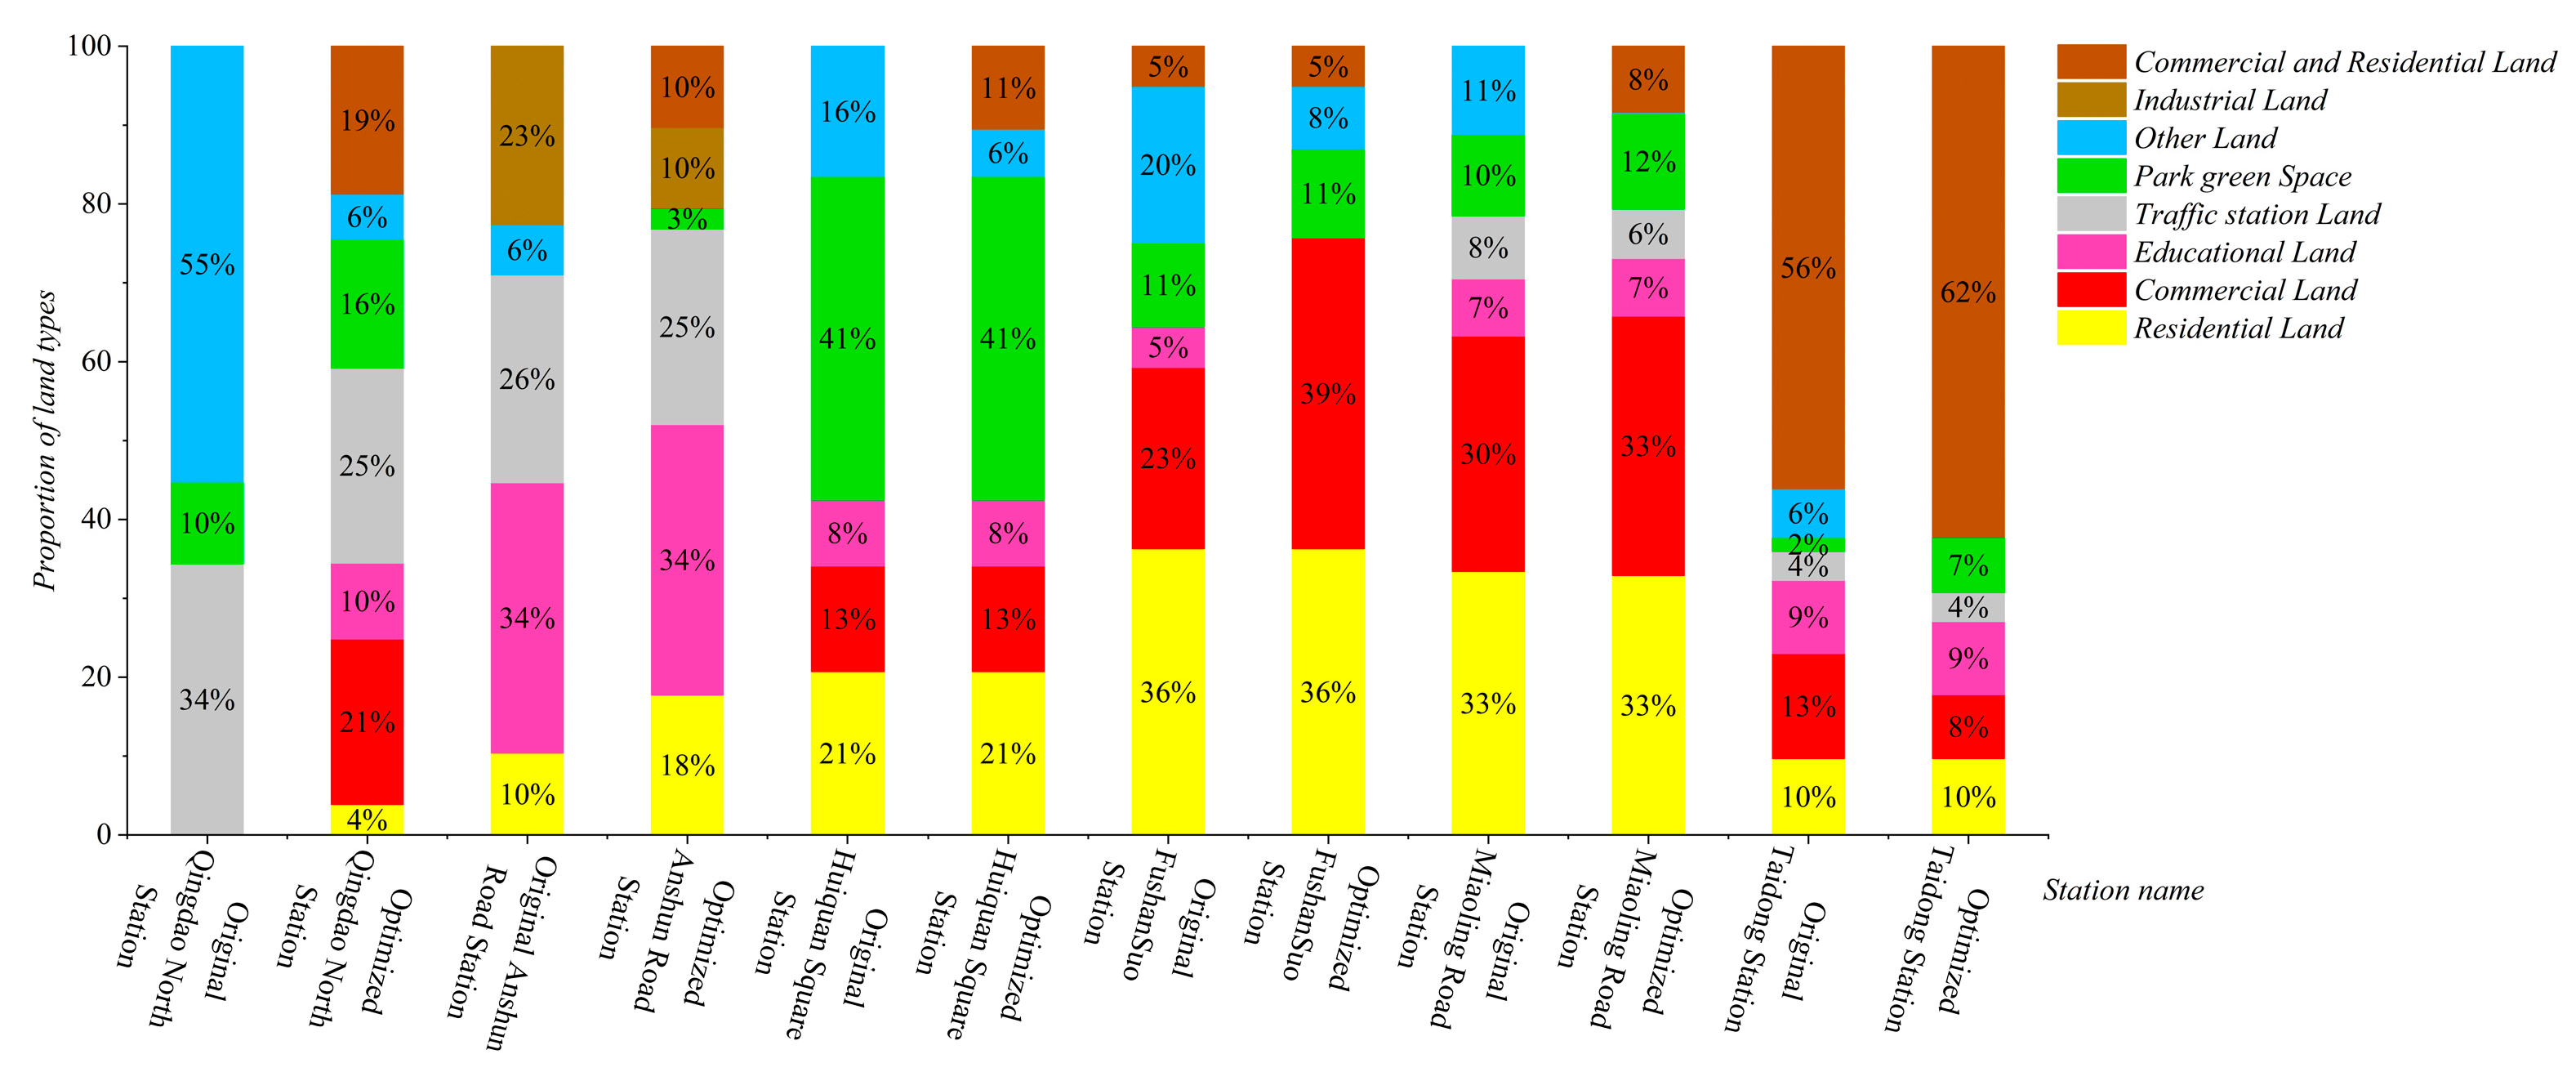
Table 1.
The fitness function value.
| Optimization scheme Miaoling Road Station |
Objective function | ||
|---|---|---|---|
| Rail transit accessibility | Land economic benefit | Environmental comfort | |
| A | 3.25×10⁶ | 2.96×10⁶ | 0.1033 |
| B | 2.44×10⁶ | 3.85×10⁶ | 0.1440 |
| C | 2.40×10⁶ | 2.85×10⁶ | 0.1848 |
| D | 2.70×10⁶ | 3.22×10⁶ | 0.1440 |
Table 2.
The fitness function value of each site.
| Subway station | Rail transit accessibility | Land economic benefit | Environmental comfort |
|---|---|---|---|
| Anshun Road station | 1.36×10⁶ | 1.94×10⁶ | 0.1160 |
| Huiquan Square station | 2.37×10⁶ | 5.28×10⁶ | 0.2864 |
| Qingdao north railway station | 3.26×10⁶ | 2.23×10⁶ | 0.1244 |
| Miaoling road station | 2.70×10⁶ | 3.22×10⁶ | 0.1440 |
| Fushansuo station | 2.50×10⁶ | 5.73×10⁶ | 0.2613 |
| Taidong station | 3.00×10⁶ | 2.47×10⁶ | 0.2841 |
Disclaimer/Publisher’s Note: The statements, opinions and data contained in all publications are solely those of the individual author(s) and contributor(s) and not of MDPI and/or the editor(s). MDPI and/or the editor(s) disclaim responsibility for any injury to people or property resulting from any ideas, methods, instructions or products referred to in the content. |
© 2023 by the authors. Licensee MDPI, Basel, Switzerland. This article is an open access article distributed under the terms and conditions of the Creative Commons Attribution (CC BY) license (http://creativecommons.org/licenses/by/4.0/).
Copyright: This open access article is published under a Creative Commons CC BY 4.0 license, which permit the free download, distribution, and reuse, provided that the author and preprint are cited in any reuse.


