Submitted:
26 June 2023
Posted:
27 June 2023
You are already at the latest version
Abstract
Keywords:
Introduction
Material and Methods
Patient population
Pathologic assessment of H&E-stained tumor slides and RNA extraction
RNA sequencing
Bioinformatic analysis
Results
Patient and tumor characteristics
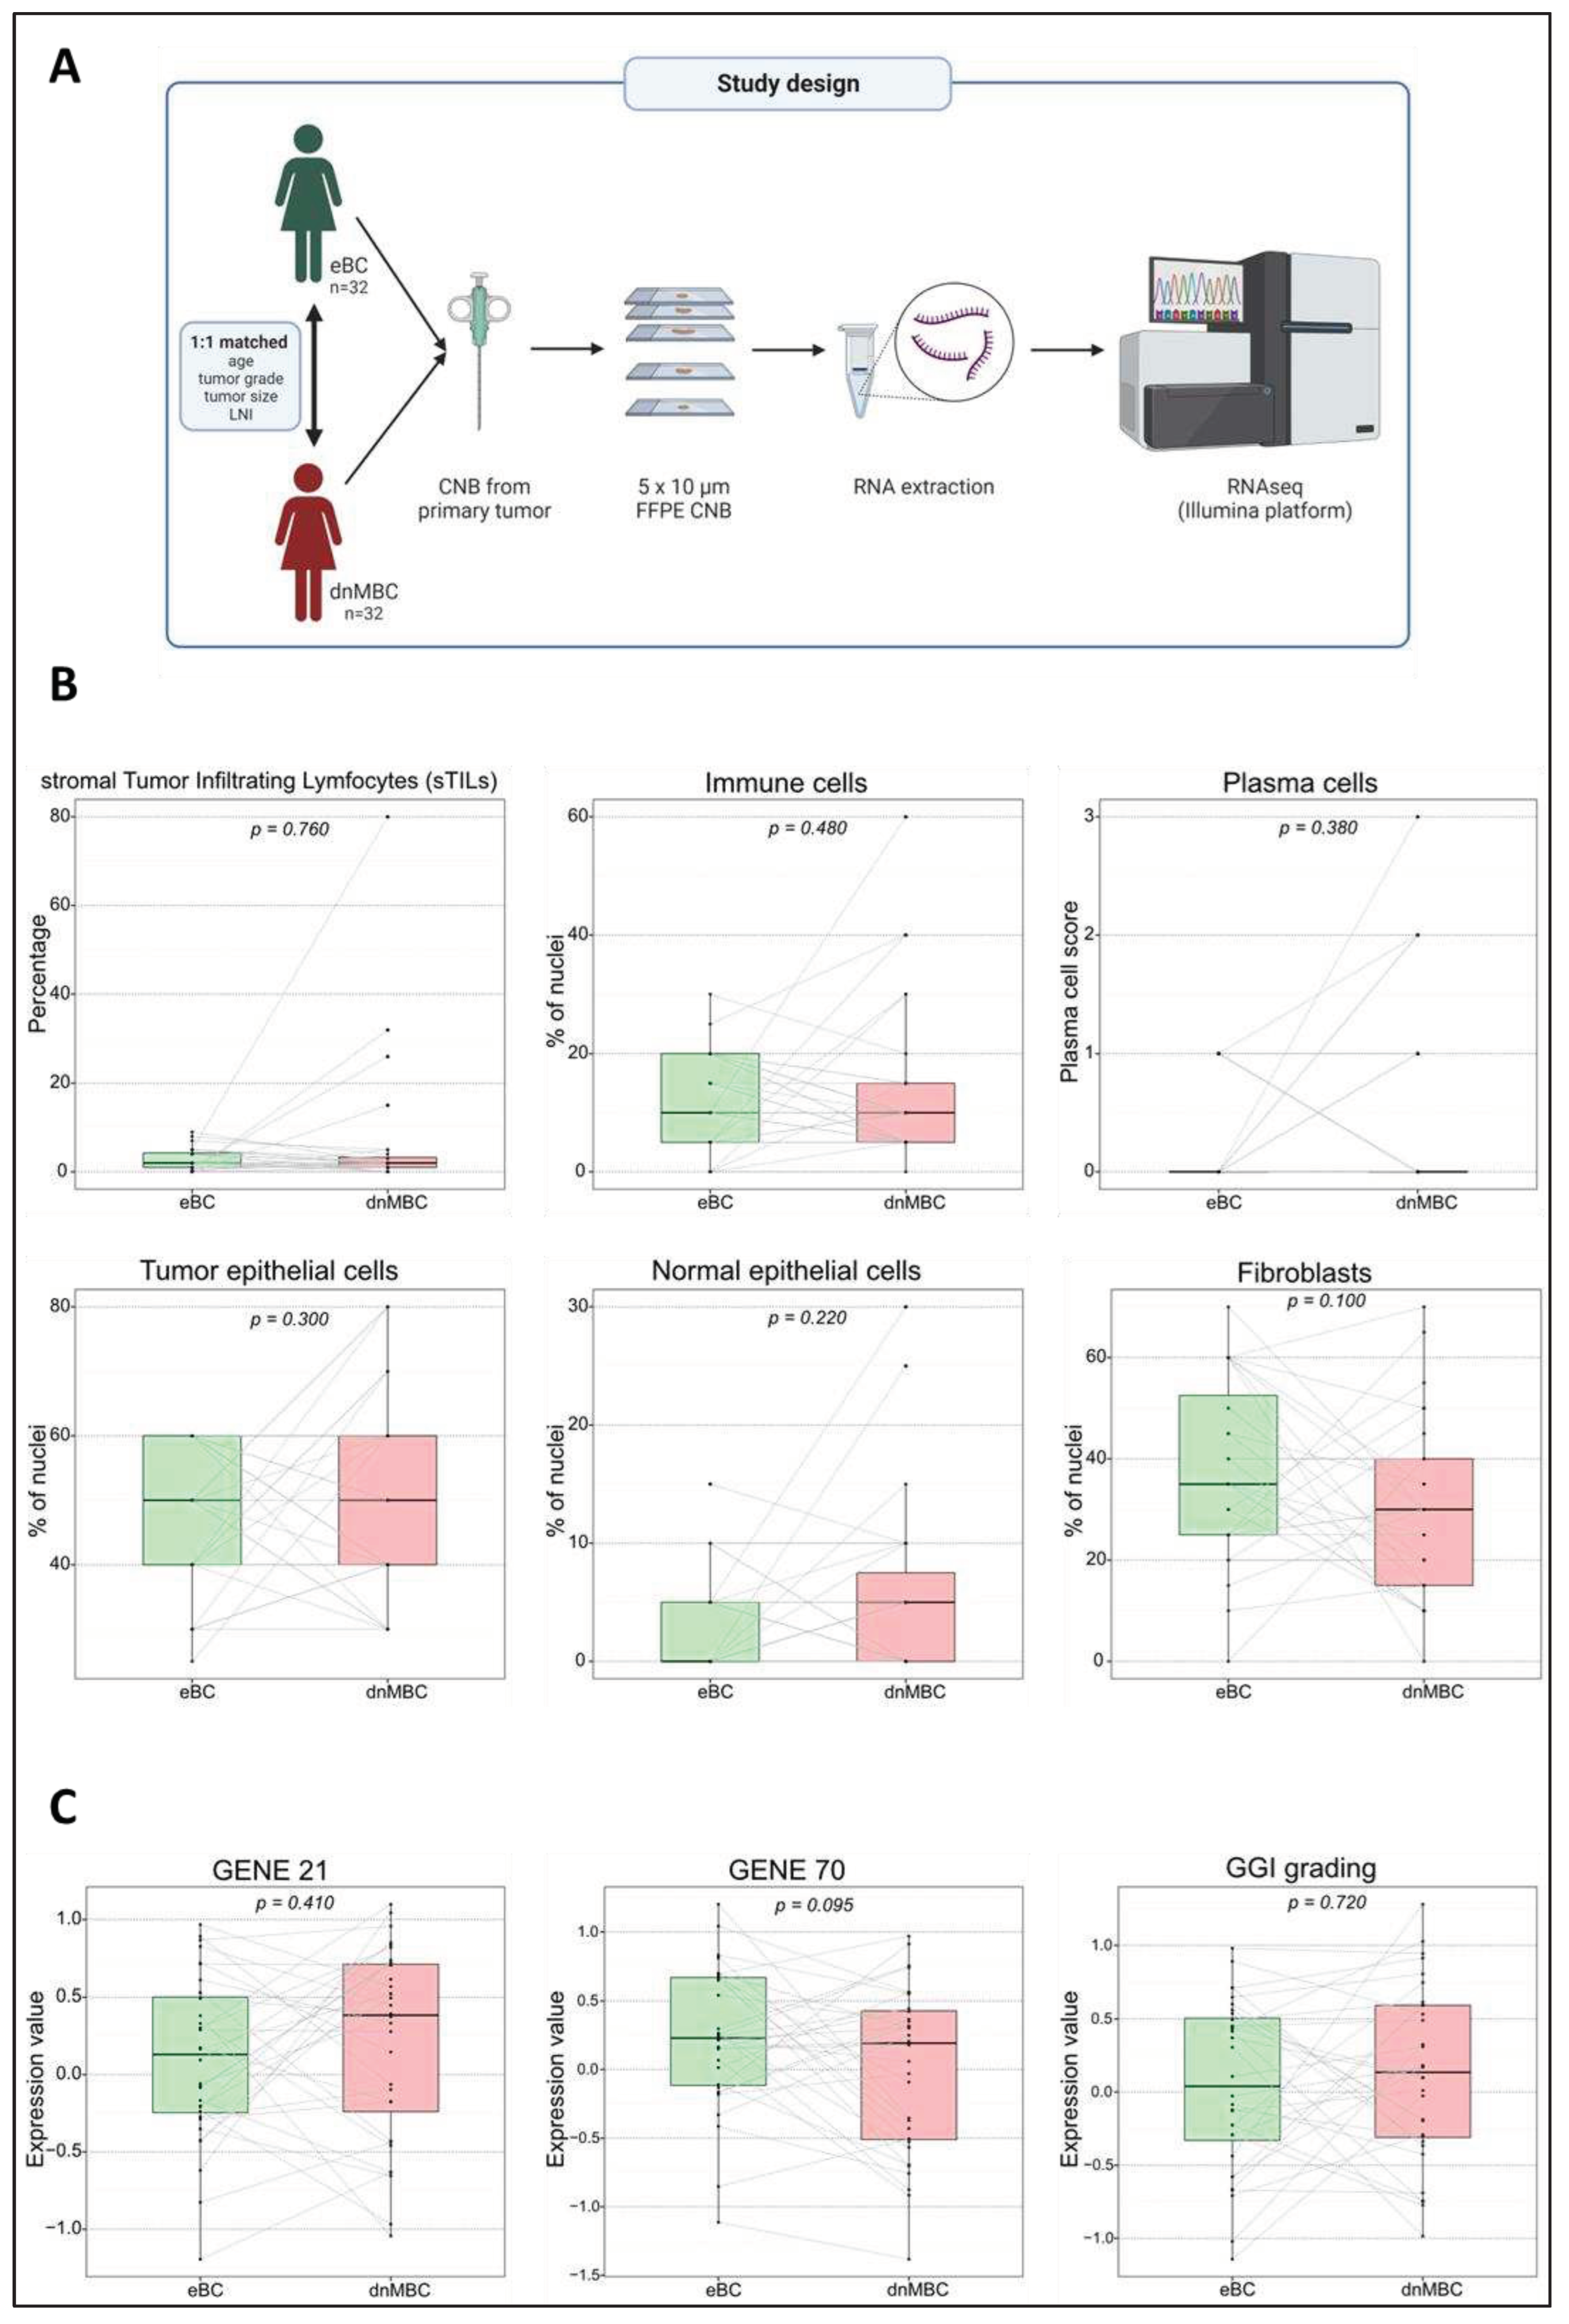
De novo metastasized (dnMBC) and non-metastasized breast tumors (eBC) exhibit comparable cellular composition
Gene expression profiles did not differ between de novo versus non-metastasized tumors
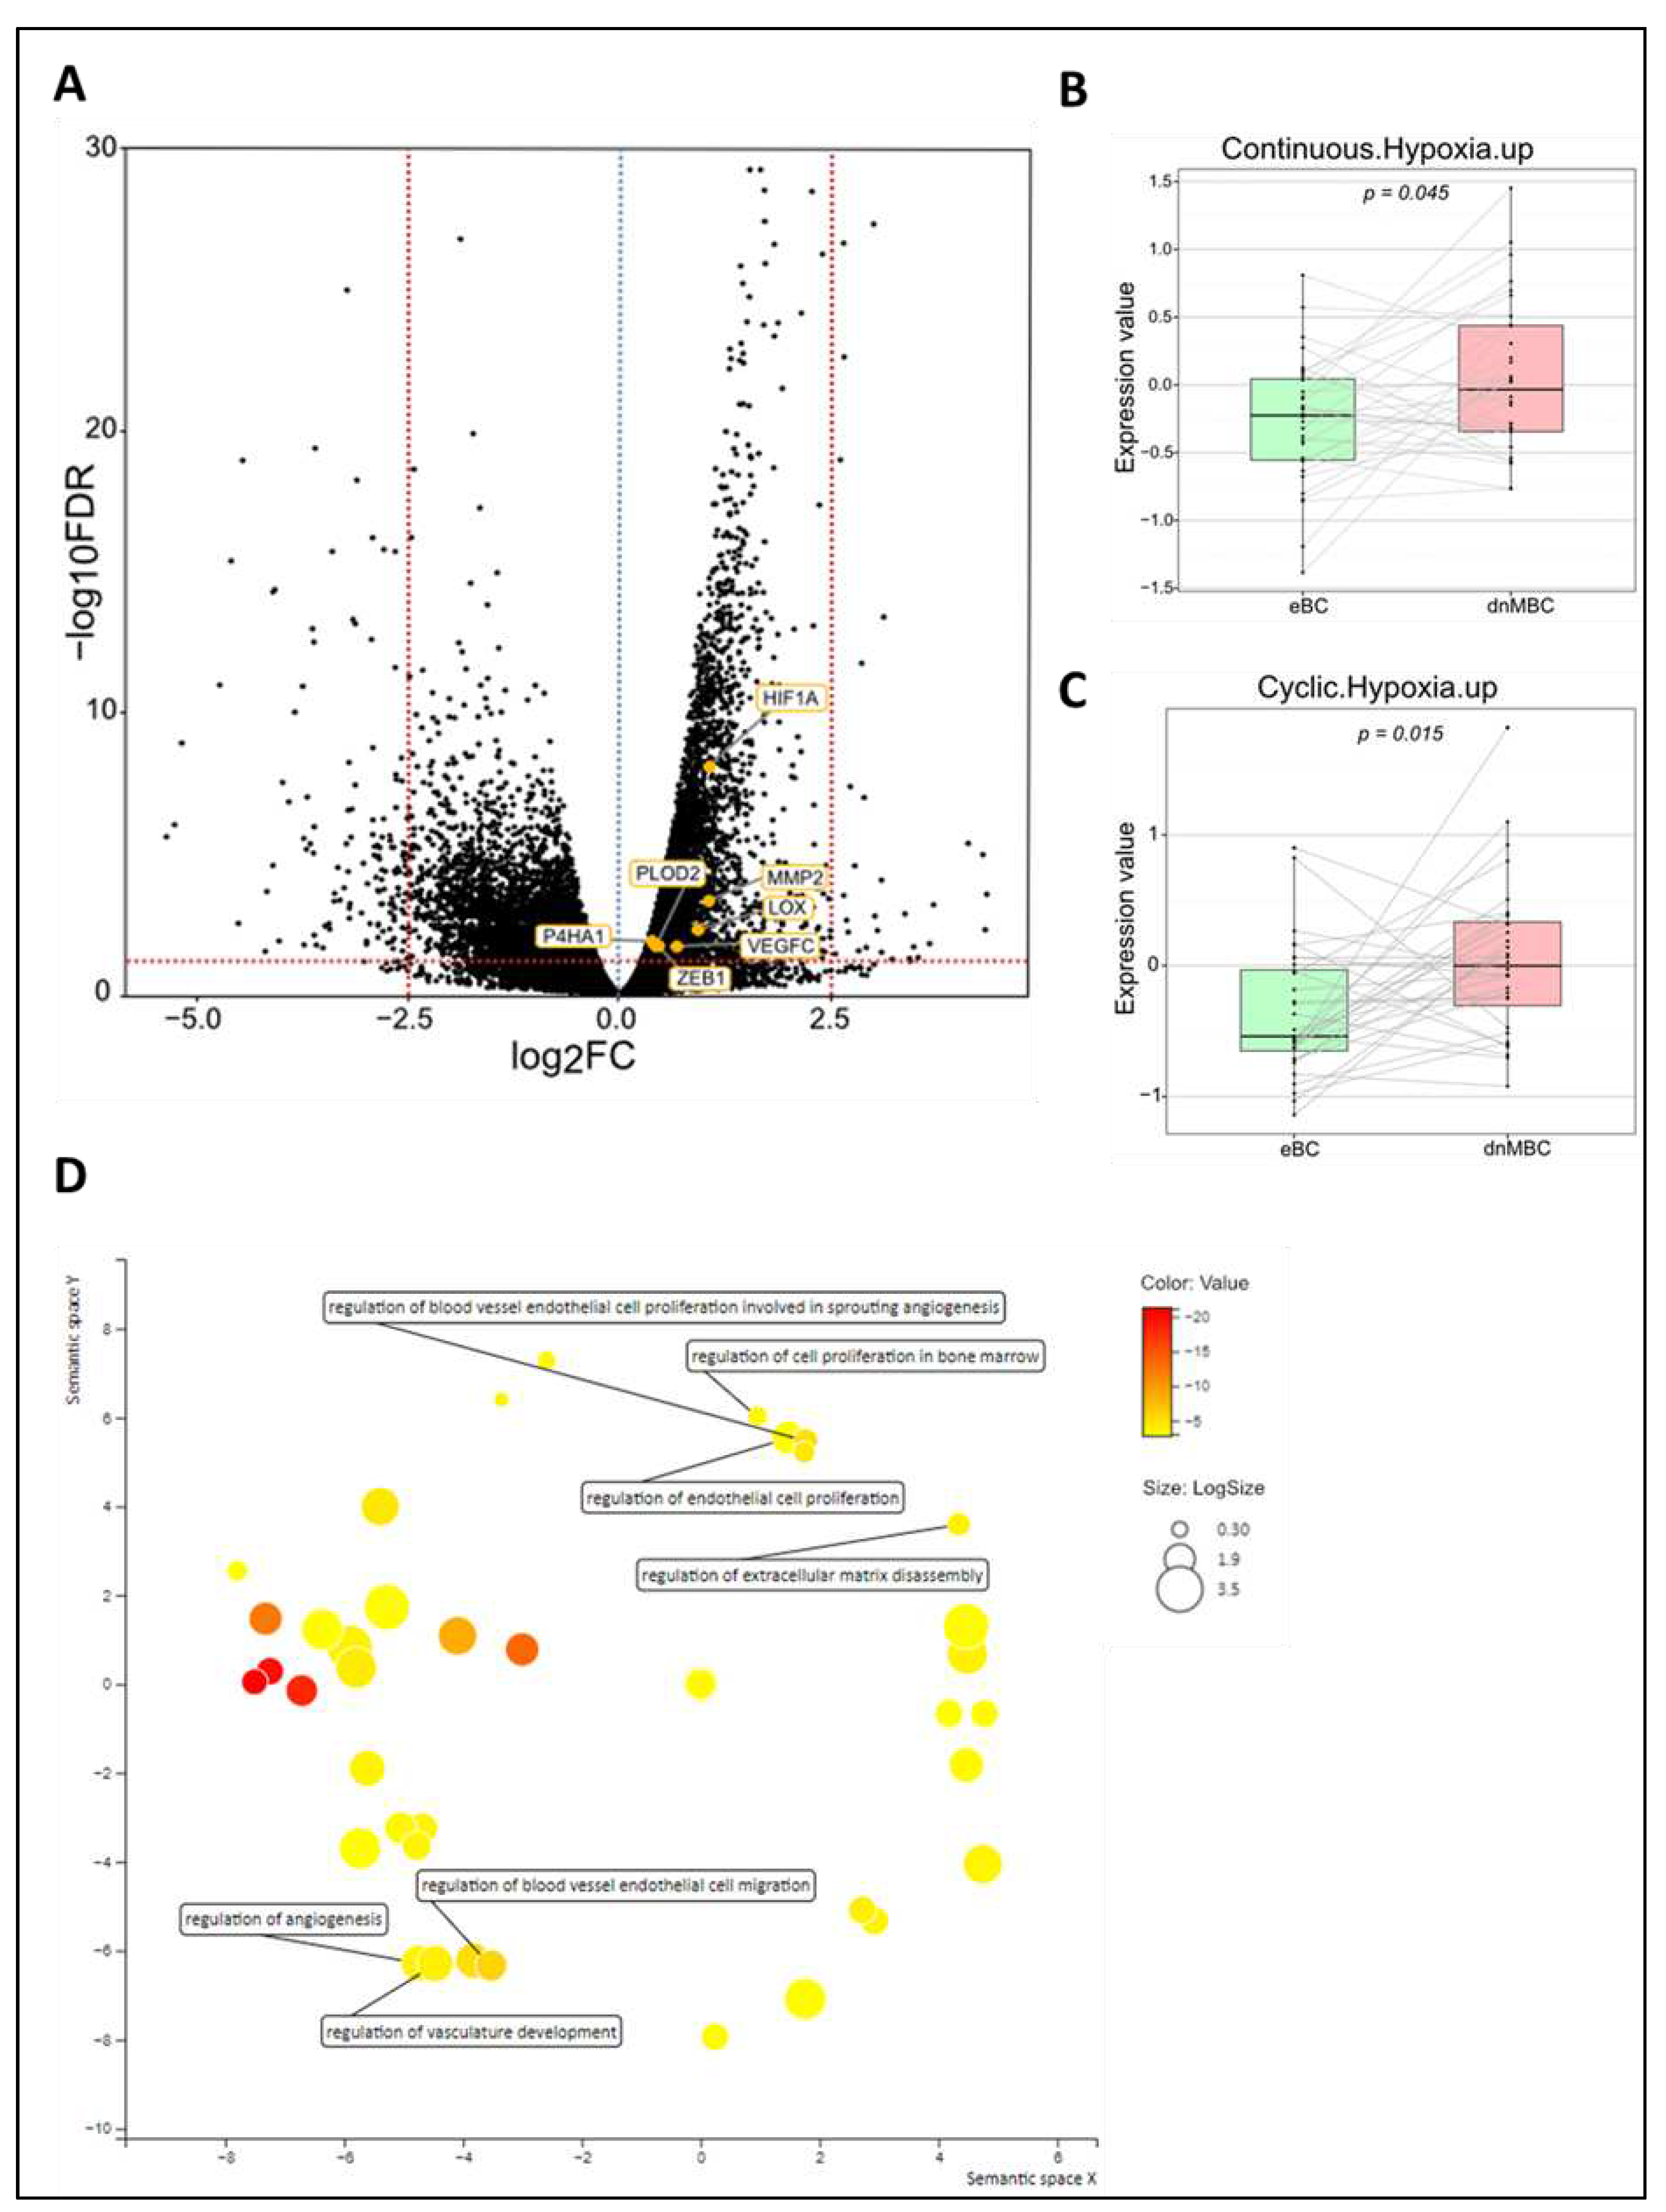
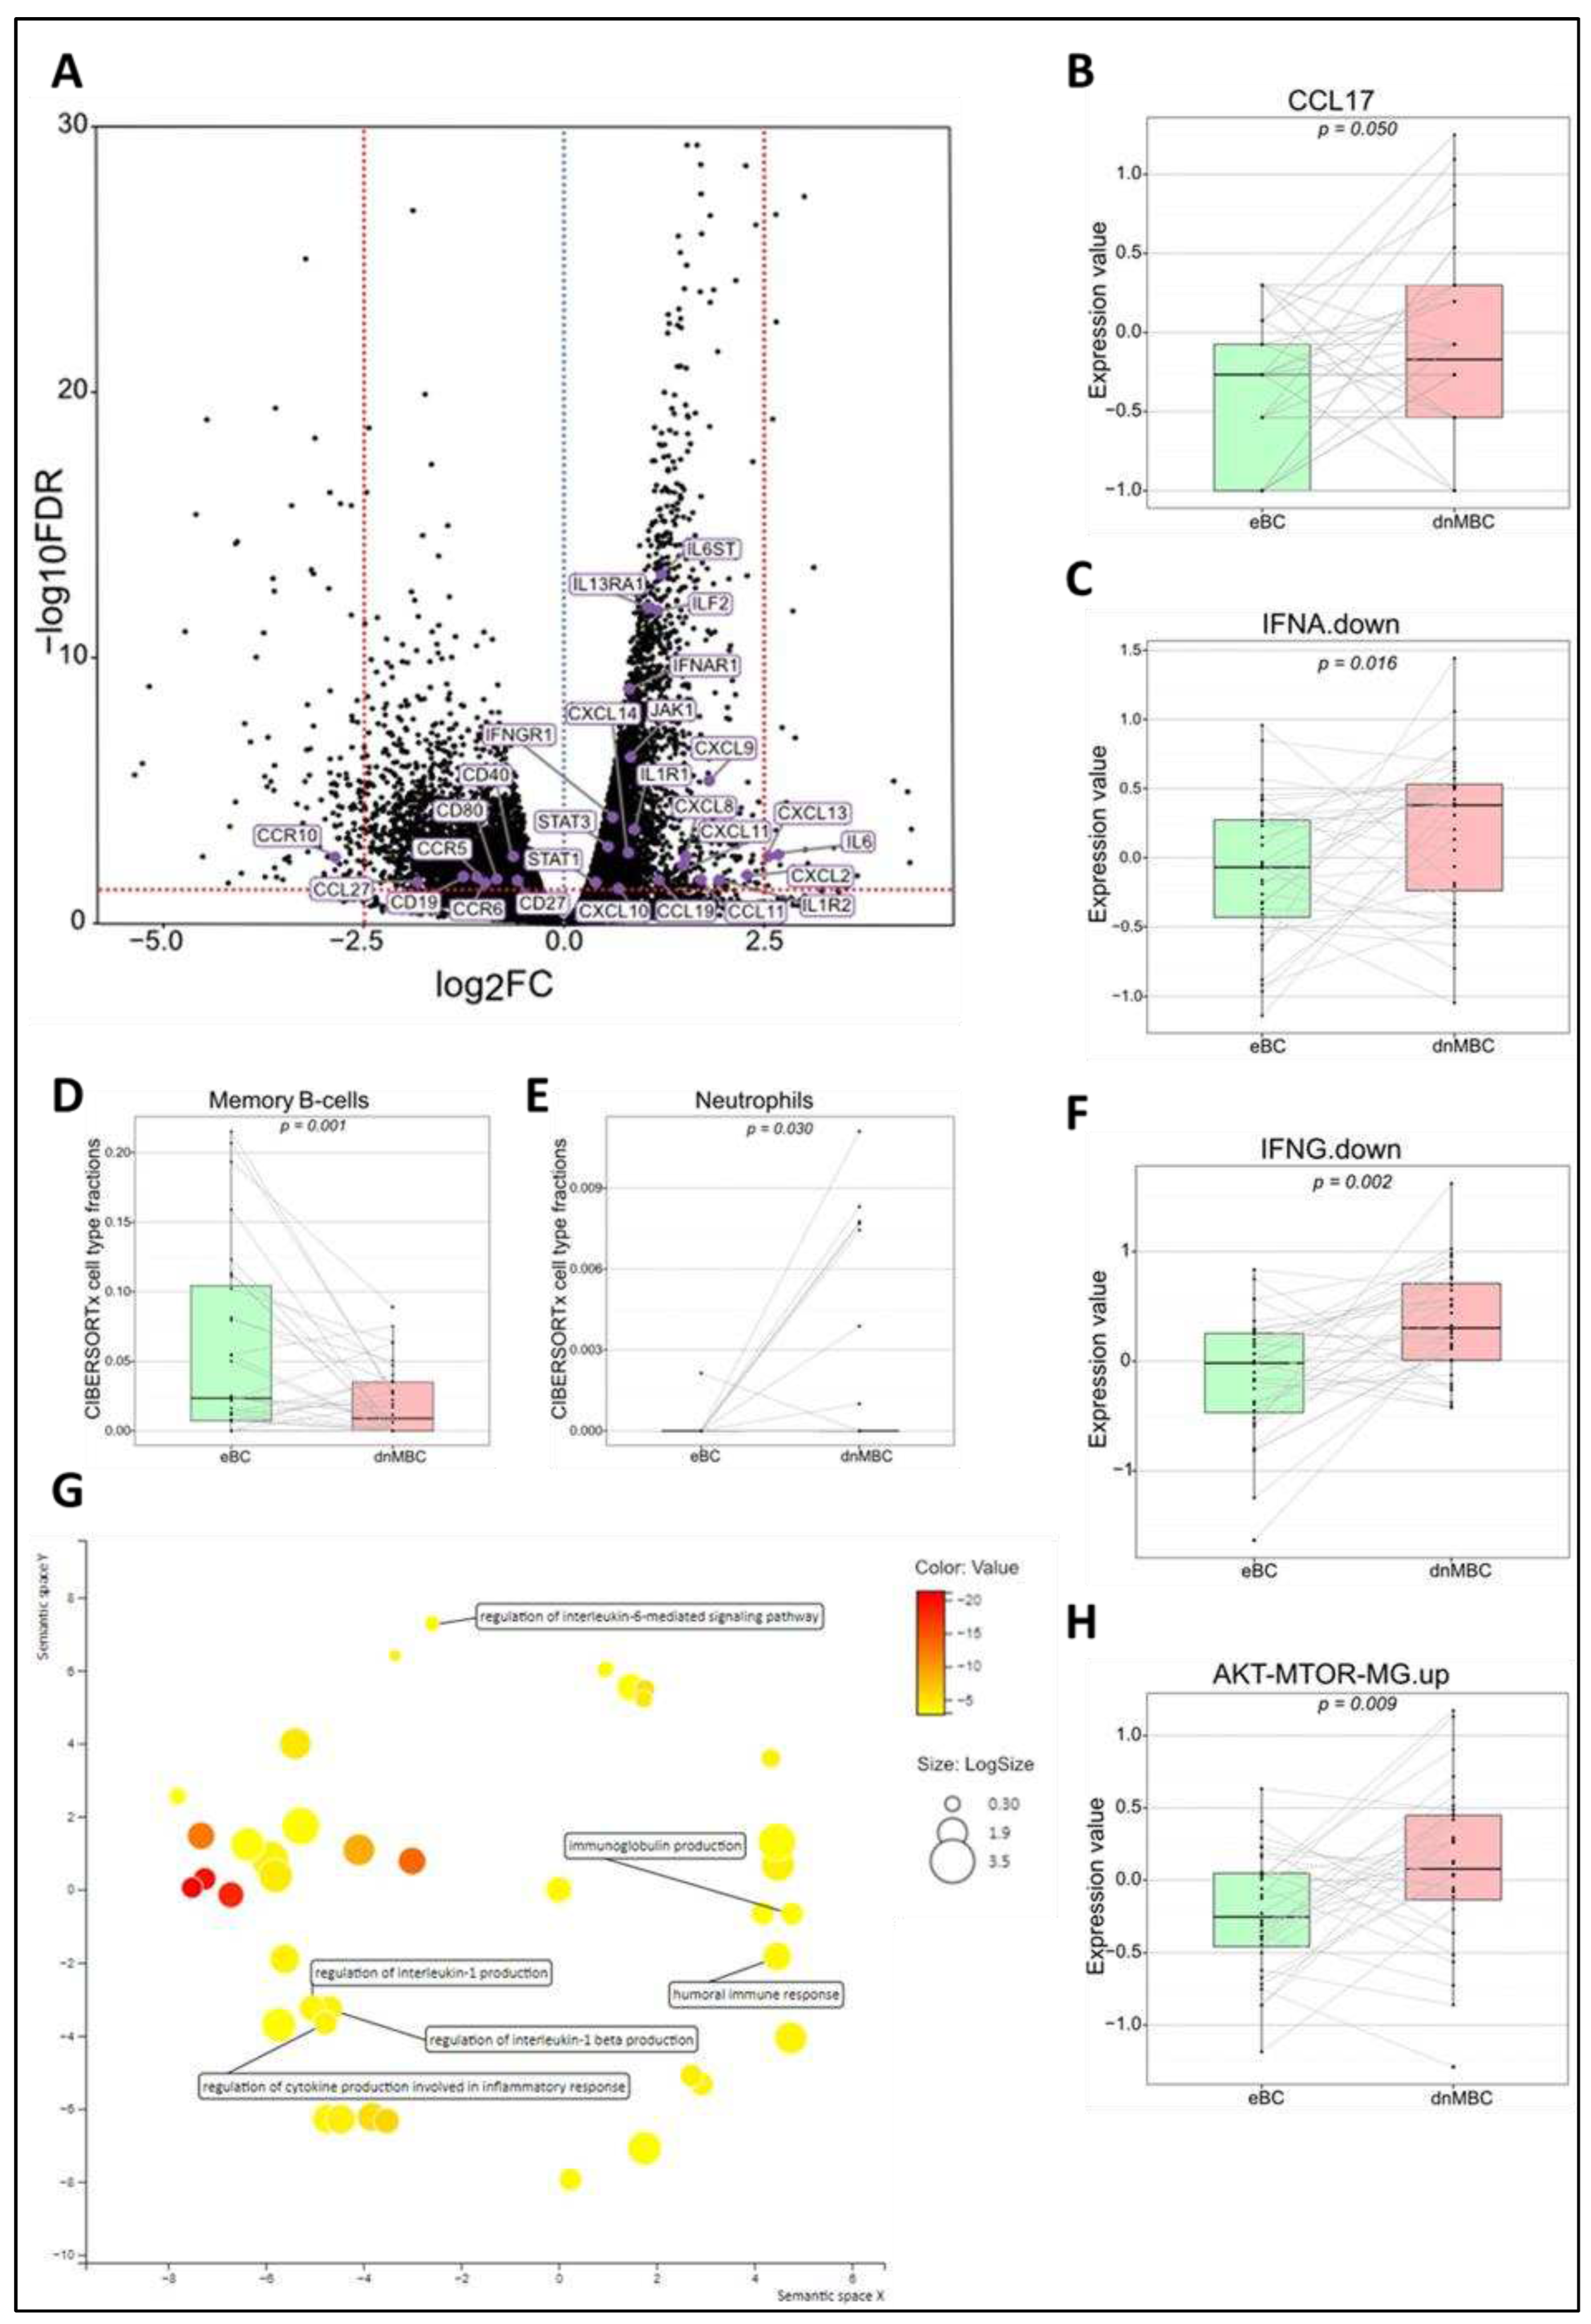
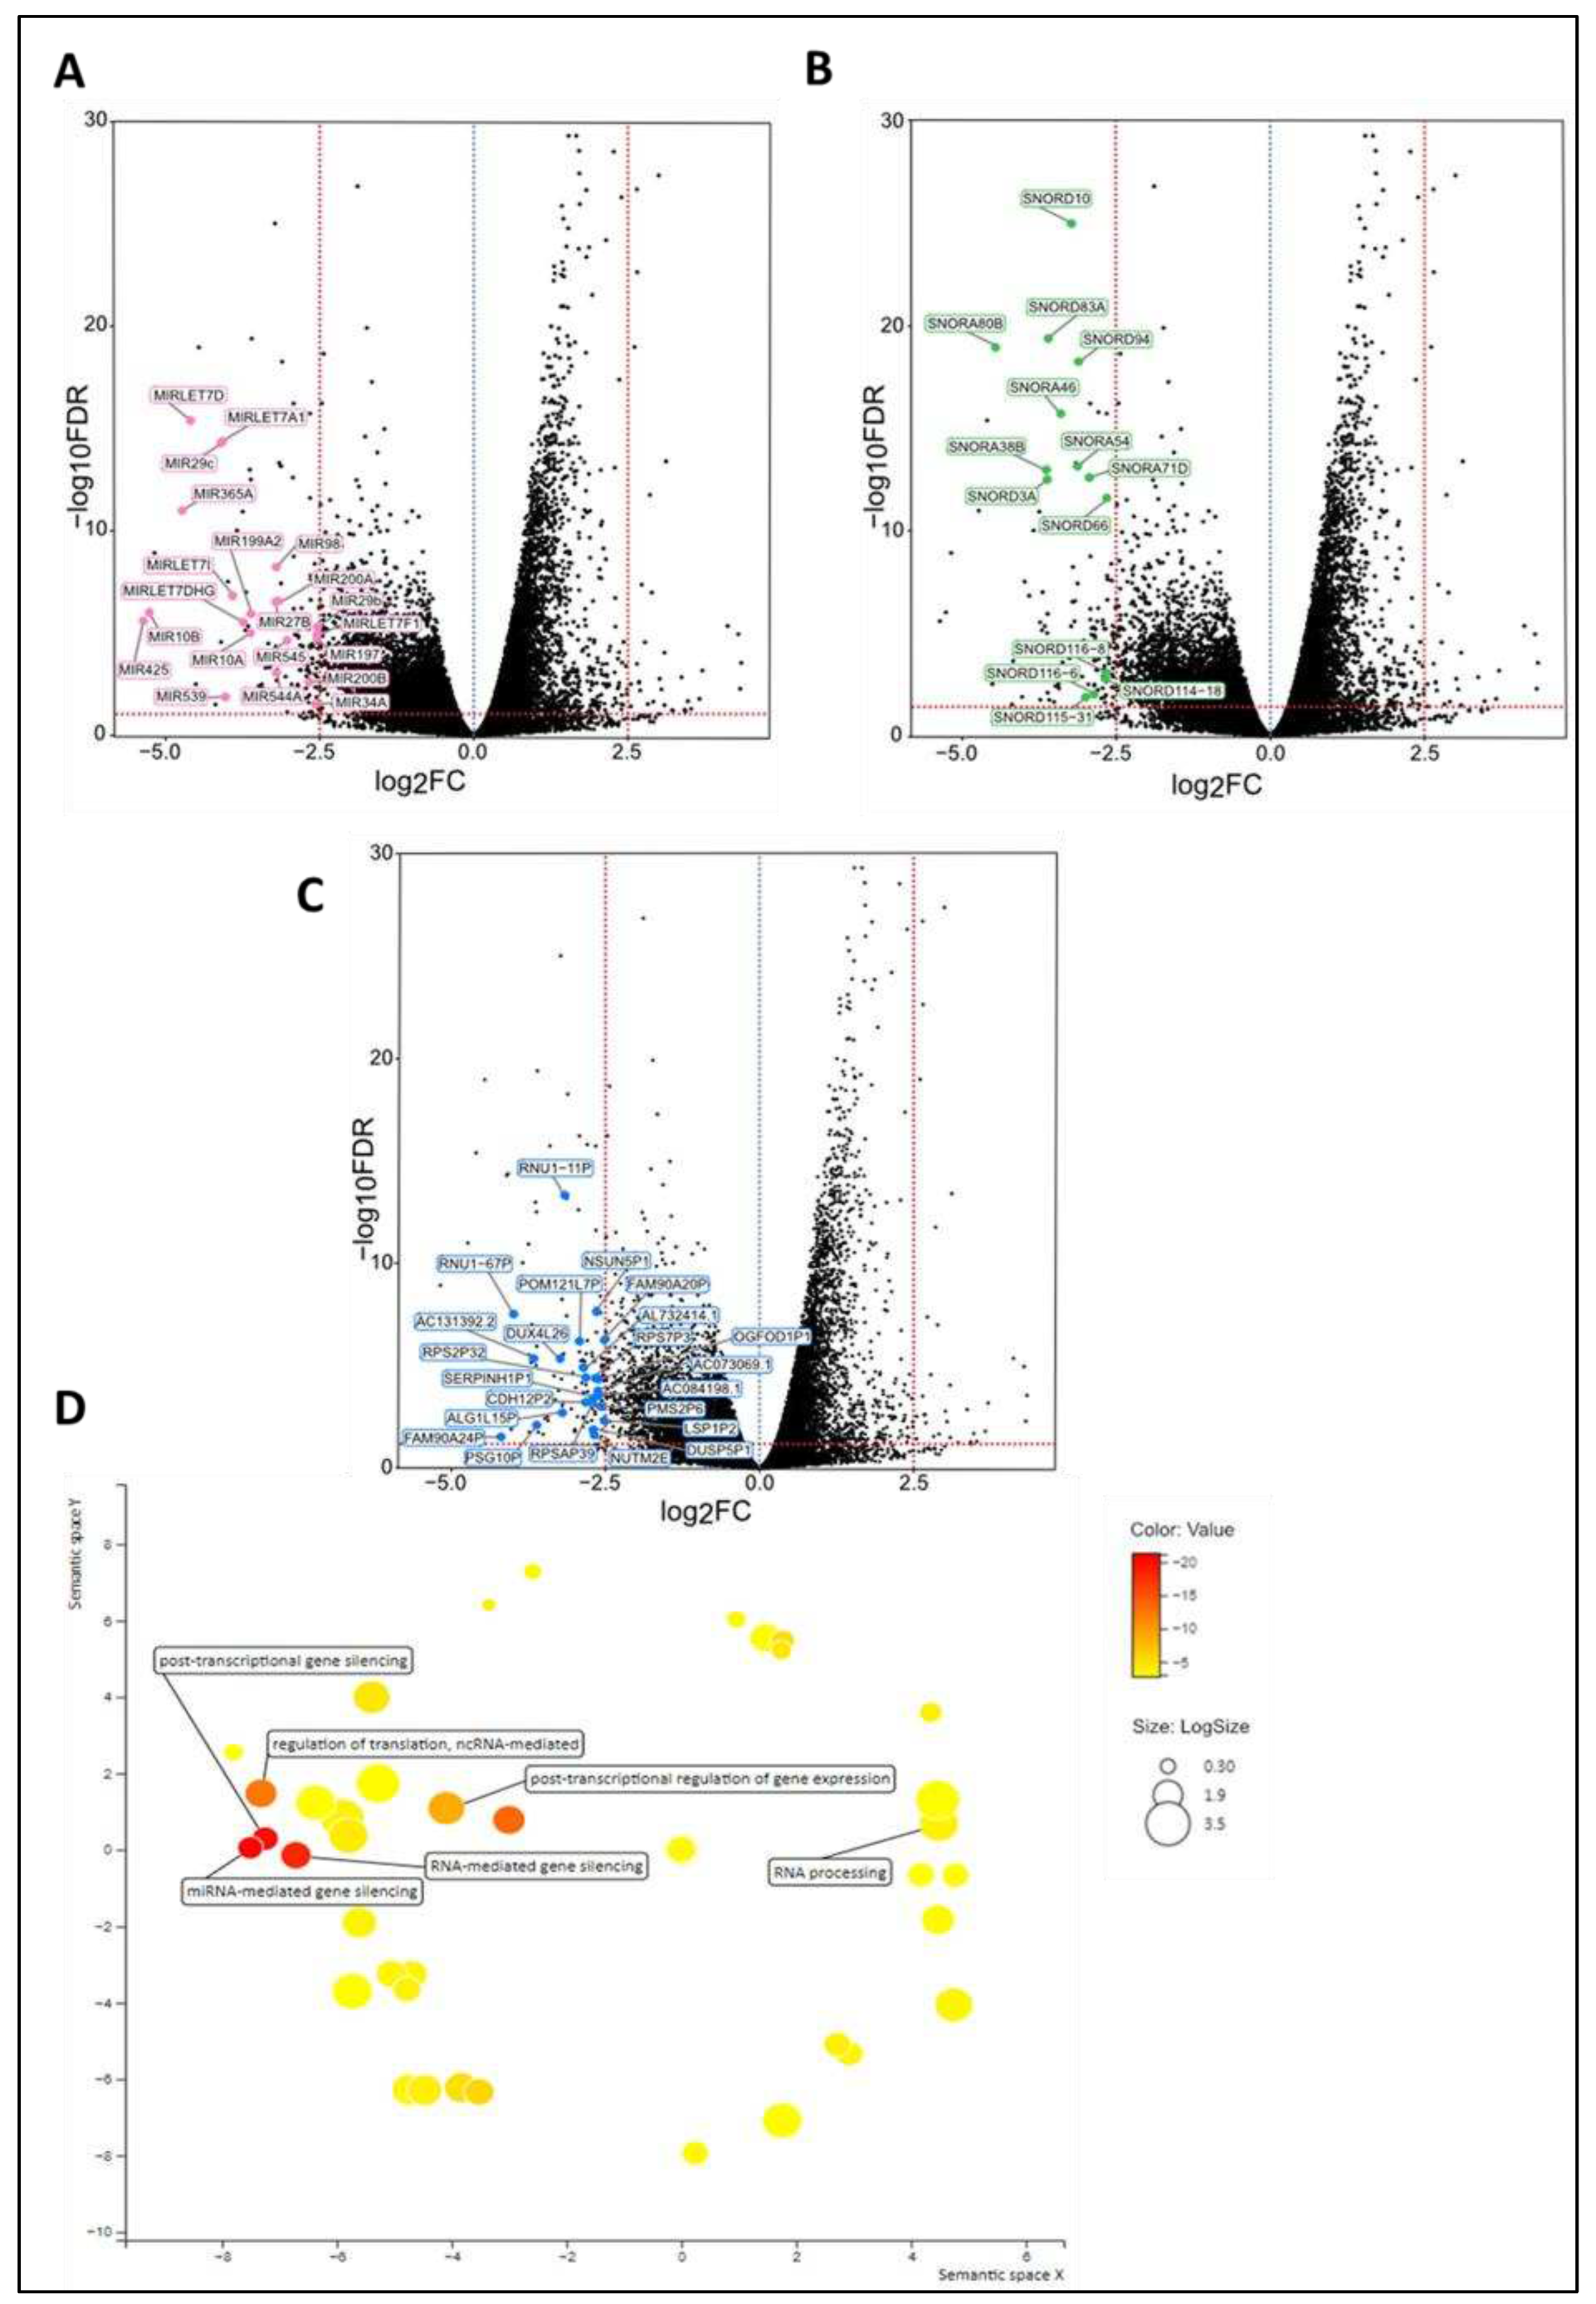
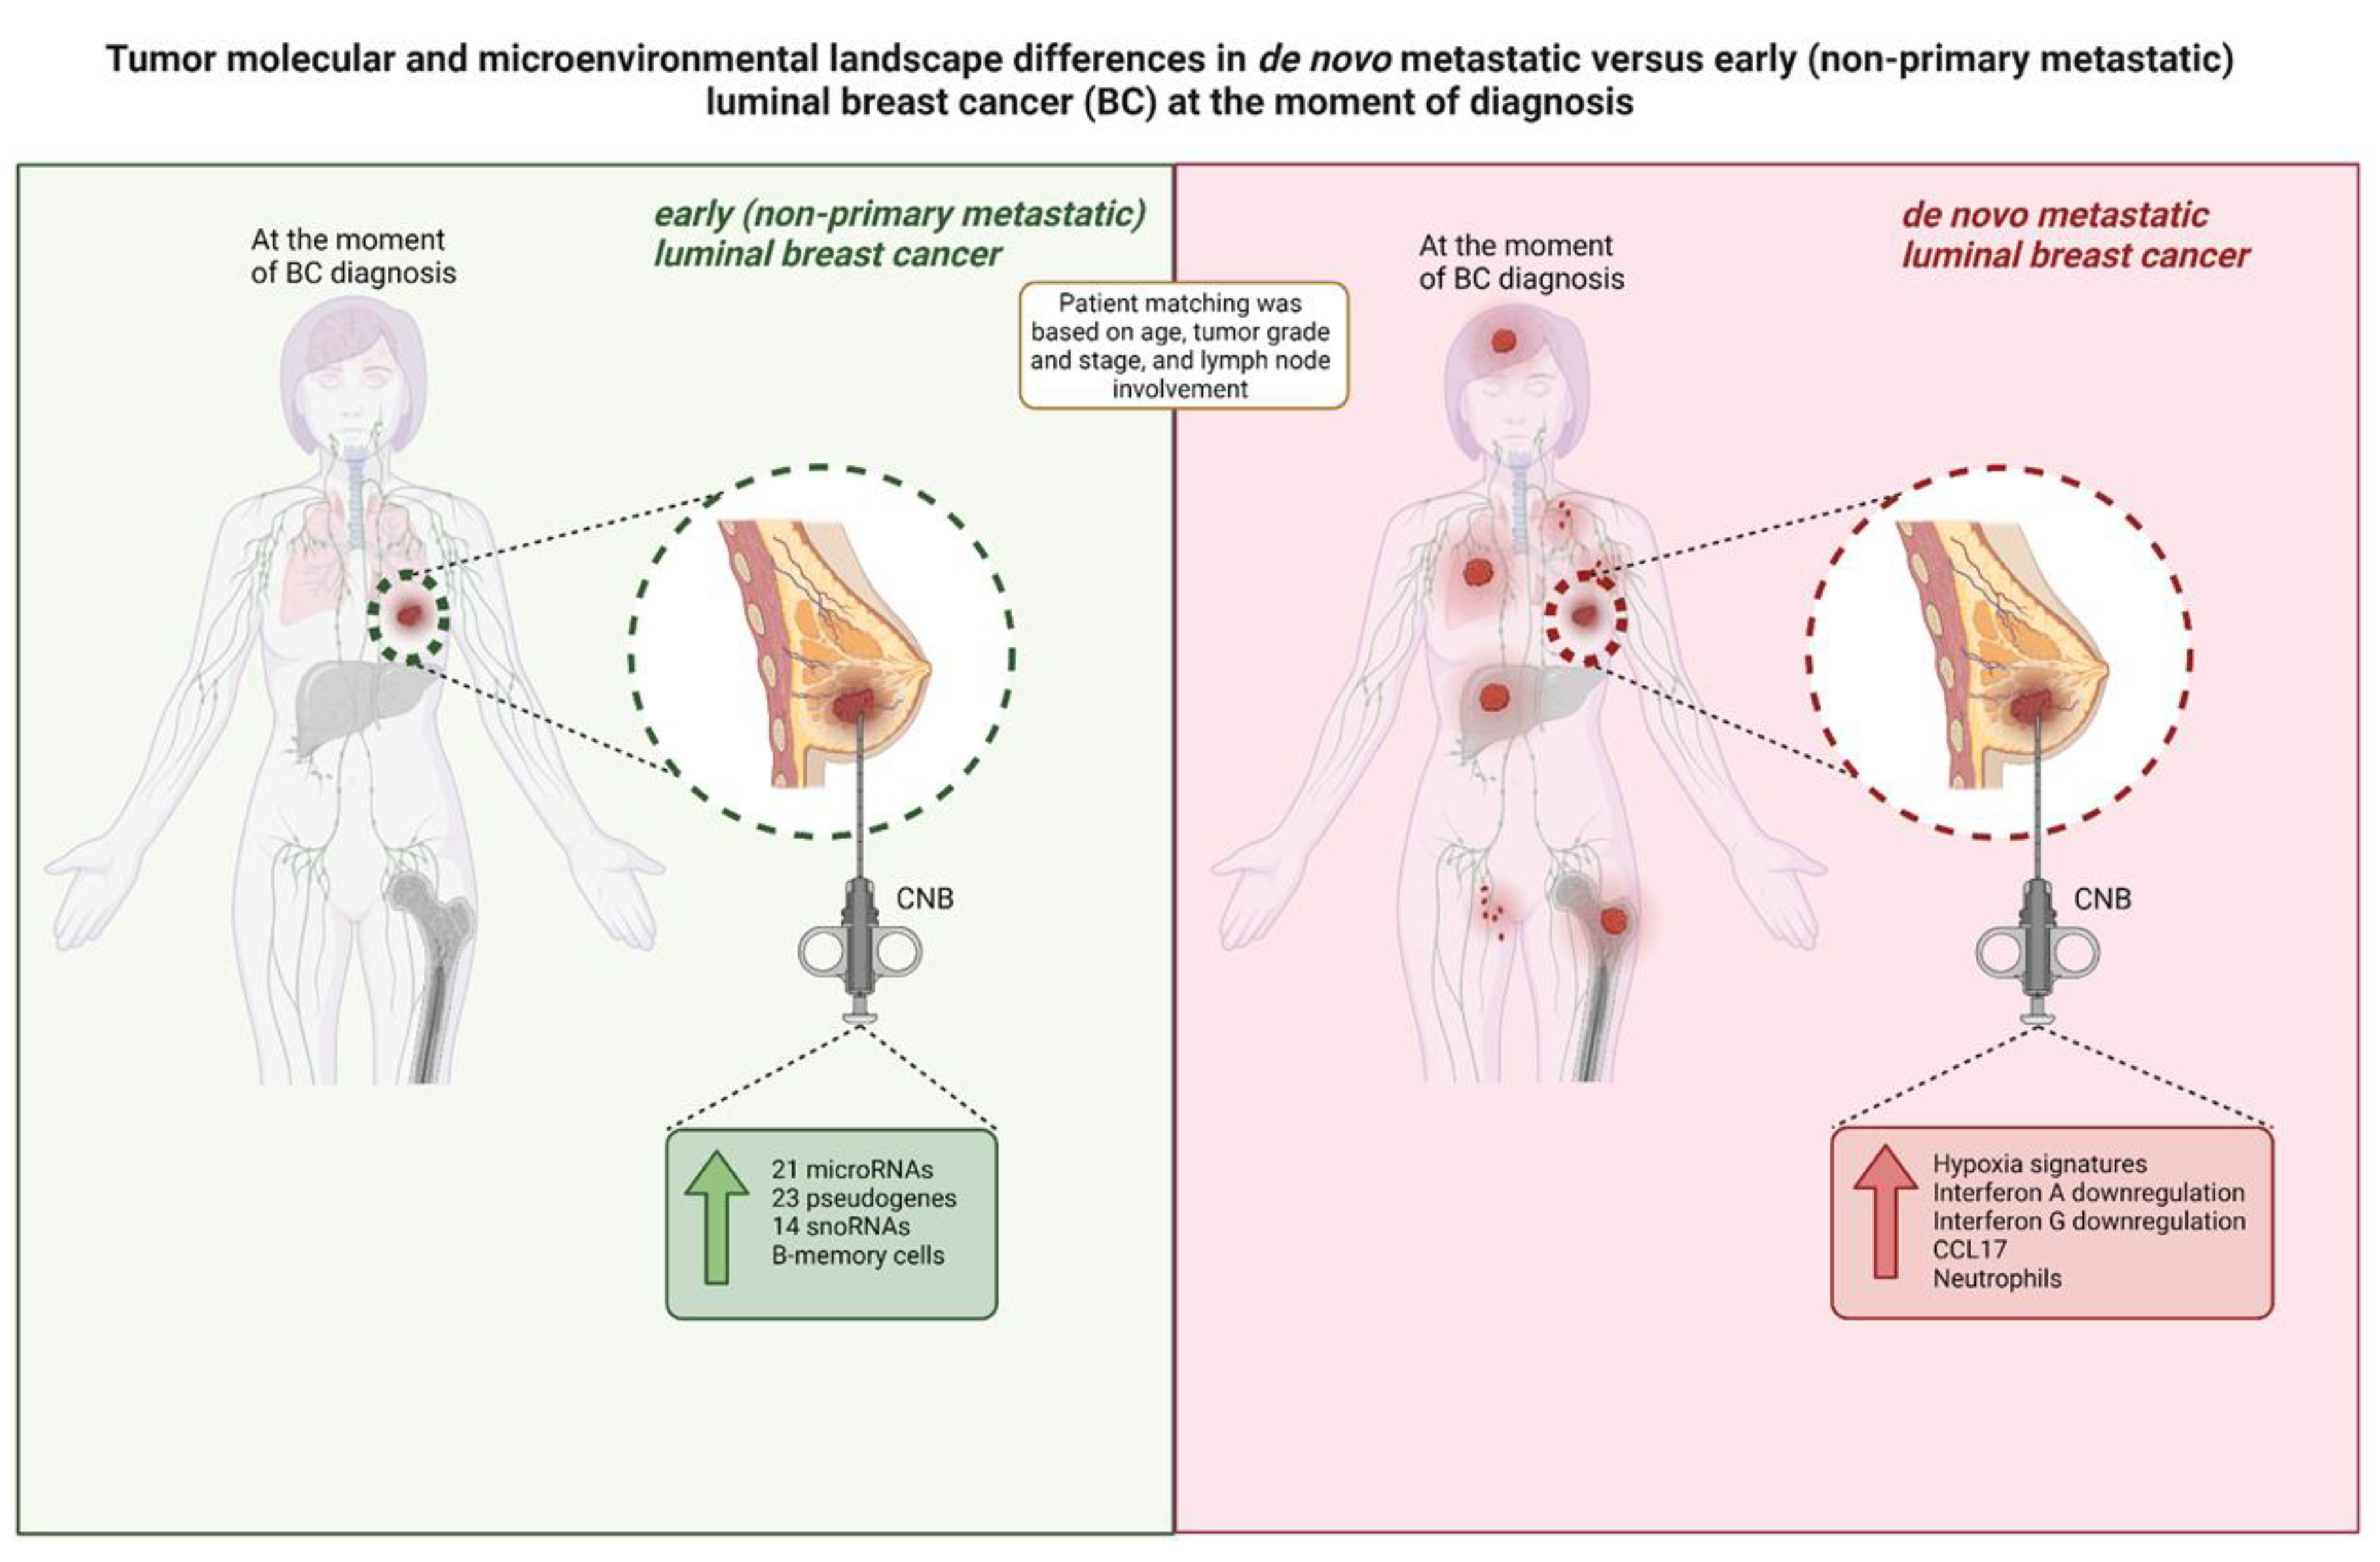
Tumor microenvironment differs at the time of diagnosis
Discussion
Conclusions
Supplementary Materials
Author Contributions
Funding
Institutional Review Board Statement
Informed Consent Statement
Data Availability Statement
Acknowledgments
Conflicts of Interest
References
- Islami, F.; Ward, E.M.; Sung, H.; Cronin, K.A.; Tangka, F.K.L.; Sherman, R.L.; Zhao, J.; Anderson, R.N.; Henley, S.J.; Yabroff, K.R.; et al. Annual Report to the Nation on the Status of Cancer, Part 1: National Cancer Statistics. J Natl Cancer Inst 2021. [Google Scholar] [CrossRef] [PubMed]
- Globocan 2020 Breast cancer fact sheet.
- Bediaga, N.G.; Beristain, E.; Calvo, B.; Viguri, M.A.; Gutierrez-Corres, B.; Rezola, R.; Ruiz-Diaz, I.; Guerra, I.; de Pancorbo, M.M. Luminal B breast cancer subtype displays a dicotomic epigenetic pattern. Springerplus 2016, 5, 623. [Google Scholar] [CrossRef] [PubMed]
- Ades, F.; Zardavas, D.; Bozovic-Spasojevic, I.; Pugliano, L.; Fumagalli, D.; de Azambuja, E.; Viale, G.; Sotiriou, C.; Piccart, M. Luminal B breast cancer: molecular characterization, clinical management, and future perspectives. J Clin Oncol 2014, 32, 2794–2803. [Google Scholar] [CrossRef] [PubMed]
- Li, Z.H.; Hu, P.H.; Tu, J.H.; Yu, N.S. Luminal B breast cancer: patterns of recurrence and clinical outcome. Oncotarget 2016, 7, 65024–65033. [Google Scholar] [CrossRef] [PubMed]
- Audeh, W.; Blumencranz, L.; Kling, H.; Trivedi, H.; Srkalovic, G. Prospective Validation of a Genomic Assay in Breast Cancer: The 70-gene MammaPrint Assay and the MINDACT Trial. Acta Med Acad 2019, 48, 18–34. [Google Scholar] [CrossRef]
- Piccart, M.; van ‘t Veer, L.J.; Poncet, C.; Lopes Cardozo, J.M.N.; Delaloge, S.; Pierga, J.Y.; Vuylsteke, P.; Brain, E.; Vrijaldenhoven, S.; Neijenhuis, P.A.; et al. 70-gene signature as an aid for treatment decisions in early breast cancer: updated results of the phase 3 randomised MINDACT trial with an exploratory analysis by age. Lancet Oncol 2021, 22, 476–488. [Google Scholar] [CrossRef]
- Gennari, A.; Andre, F.; Barrios, C.H.; Cortes, J.; de Azambuja, E.; DeMichele, A.; Dent, R.; Fenlon, D.; Gligorov, J.; Hurvitz, S.A.; et al. ESMO Clinical Practice Guideline for the diagnosis, staging and treatment of patients with metastatic breast cancer. Ann Oncol 2021, 32, 1475–1495. [Google Scholar] [CrossRef]
- McKenzie, H.S.; Maishman, T.; Simmonds, P.; Durcan, L.; Group, P.S.; Eccles, D.; Copson, E. Survival and disease characteristics of de novo versus recurrent metastatic breast cancer in a cohort of young patients. Br J Cancer 2020, 122, 1618–1629. [Google Scholar] [CrossRef]
- Yamamura, J.; Kamigaki, S.; Fujita, J.; Osato, H.; Komoike, Y. The Difference in Prognostic Outcomes Between De Novo Stage IV and Recurrent Metastatic Patients with Hormone Receptor-positive, HER2-negative Breast Cancer. In Vivo 2018, 32, 353–358. [Google Scholar] [CrossRef]
- Malmgren, J.A.; Mayer, M.; Atwood, M.K.; Kaplan, H.G. Differential presentation and survival of de novo and recurrent metastatic breast cancer over time: 1990-2010. Breast Cancer Res Treat 2018, 167, 579–590. [Google Scholar] [CrossRef]
- Lord, S.J.; Bahlmann, K.; O’Connell, D.L.; Kiely, B.E.; Daniels, B.; Pearson, S.A.; Beith, J.; Bulsara, M.K.; Houssami, N. De novo and recurrent metastatic breast cancer - A systematic review of population-level changes in survival since 1995. EClinicalMedicine 2022, 44, 101282. [Google Scholar] [CrossRef] [PubMed]
- Seltzer, S.; Corrigan, M.; O’Reilly, S. The clinicomolecular landscape of de novo versus relapsed stage IV metastatic breast cancer. Exp Mol Pathol 2020, 114, 104404. [Google Scholar] [CrossRef] [PubMed]
- Fares, J.; Fares, M.Y.; Khachfe, H.H.; Salhab, H.A.; Fares, Y. Molecular principles of metastasis: a hallmark of cancer revisited. Signal Transduct Target Ther 2020, 5, 28. [Google Scholar] [CrossRef] [PubMed]
- Petri, B.J.; Klinge, C.M. Regulation of breast cancer metastasis signaling by miRNAs. Cancer Metastasis Rev 2020, 39, 837–886. [Google Scholar] [CrossRef] [PubMed]
- Marcuzzi, E.; Angioni, R.; Molon, B.; Cali, B. Chemokines and Chemokine Receptors: Orchestrating Tumor Metastasization. Int J Mol Sci 2018, 20. [Google Scholar] [CrossRef]
- Allison, K.H.; Hammond, M.E.H.; Dowsett, M.; McKernin, S.E.; Carey, L.A.; Fitzgibbons, P.L.; Hayes, D.F.; Lakhani, S.R.; Chavez-MacGregor, M.; Perlmutter, J.; et al. Estrogen and Progesterone Receptor Testing in Breast Cancer: American Society of Clinical Oncology/College of American Pathologists Guideline Update. Arch Pathol Lab Med 2020, 144, 545–563. [Google Scholar] [CrossRef]
- Wolff, A.C.; Hammond, M.E.H.; Allison, K.H.; Harvey, B.E.; Mangu, P.B.; Bartlett, J.M.S.; Bilous, M.; Ellis, I.O.; Fitzgibbons, P.; Hanna, W.; et al. Human Epidermal Growth Factor Receptor 2 Testing in Breast Cancer: American Society of Clinical Oncology/College of American Pathologists Clinical Practice Guideline Focused Update. J Clin Oncol 2018, 36, 2105–2122. [Google Scholar] [CrossRef]
- Hendry, S.; Salgado, R.; Gevaert, T.; Russell, P.A.; John, T.; Thapa, B.; Christie, M.; van de Vijver, K.; Estrada, M.V.; Gonzalez-Ericsson, P.I.; et al. Assessing Tumor-infiltrating Lymphocytes in Solid Tumors: A Practical Review for Pathologists and Proposal for a Standardized Method From the International Immunooncology Biomarkers Working Group: Part 1: Assessing the Host Immune Response, TILs in Invasive Breast Carcinoma and Ductal Carcinoma In Situ, Metastatic Tumor Deposits and Areas for Further Research. Adv Anat Pathol 2017, 24, 235–251. [Google Scholar] [CrossRef]
- Deman, F.; Punie, K.; Laenen, A.; Neven, P.; Oldenburger, E.; Smeets, A.; Nevelsteen, I.; Van Ongeval, C.; Baten, A.; Faes, T.; et al. Assessment of stromal tumor infiltrating lymphocytes and immunohistochemical features in invasive micropapillary breast carcinoma with long-term outcomes. Breast Cancer Res Treat 2020, 184, 985–998. [Google Scholar] [CrossRef]
- Risso, D.; Schwartz, K.; Sherlock, G.; Dudoit, S. GC-content normalization for RNA-Seq data. BMC Bioinformatics 2011, 12, 480. [Google Scholar] [CrossRef]
- Chen, Y.; Lun, A.T.; Smyth, G.K. From reads to genes to pathways: differential expression analysis of RNA-Seq experiments using Rsubread and the edgeR quasi-likelihood pipeline. F1000Res 2016, 5, 1438. [Google Scholar] [CrossRef] [PubMed]
- Subramanian, A.; Tamayo, P.; Mootha, V.K.; Mukherjee, S.; Ebert, B.L.; Gillette, M.A.; Paulovich, A.; Pomeroy, S.L.; Golub, T.R.; Lander, E.S.; et al. Gene set enrichment analysis: a knowledge-based approach for interpreting genome-wide expression profiles. Proc Natl Acad Sci U S A 2005, 102, 15545–15550. [Google Scholar] [CrossRef]
- Paik, S.; Shak, S.; Tang, G.; Kim, C.; Baker, J.; Cronin, M.; Baehner, F.L.; Walker, M.G.; Watson, D.; Park, T.; et al. A multigene assay to predict recurrence of tamoxifen-treated, node-negative breast cancer. N Engl J Med 2004, 351, 2817–2826. [Google Scholar] [CrossRef] [PubMed]
- van ‘t Veer, L.J.; Dai, H.; van de Vijver, M.J.; He, Y.D.; Hart, A.A.; Mao, M.; Peterse, H.L.; van der Kooy, K.; Marton, M.J.; Witteveen, A.T.; et al. Gene expression profiling predicts clinical outcome of breast cancer. Nature 2002, 415, 530–536. [Google Scholar] [CrossRef] [PubMed]
- Sotiriou, C.; Wirapati, P.; Loi, S.; Harris, A.; Fox, S.; Smeds, J.; Nordgren, H.; Farmer, P.; Praz, V.; Haibe-Kains, B.; et al. Gene expression profiling in breast cancer: understanding the molecular basis of histologic grade to improve prognosis. J Natl Cancer Inst 2006, 98, 262–272. [Google Scholar] [CrossRef]
- Boidot, R.; Branders, S.; Helleputte, T.; Rubio, L.I.; Dupont, P.; Feron, O. A generic cycling hypoxia-derived prognostic gene signature: application to breast cancer profiling. Oncotarget 2014, 5, 6947–6963. [Google Scholar] [CrossRef]
- Der, S.D.; Zhou, A.; Williams, B.R.; Silverman, R.H. Identification of genes differentially regulated by interferon alpha, beta, or gamma using oligonucleotide arrays. Proc Natl Acad Sci U S A 1998, 95, 15623–15628. [Google Scholar] [CrossRef]
- Majumder, P.K.; Febbo, P.G.; Bikoff, R.; Berger, R.; Xue, Q.; McMahon, L.M.; Manola, J.; Brugarolas, J.; McDonnell, T.J.; Golub, T.R.; et al. mTOR inhibition reverses Akt-dependent prostate intraepithelial neoplasia through regulation of apoptotic and HIF-1-dependent pathways. Nat Med 2004, 10, 594–601. [Google Scholar] [CrossRef]
- Newman, A.M.; Steen, C.B.; Liu, C.L.; Gentles, A.J.; Chaudhuri, A.A.; Scherer, F.; Khodadoust, M.S.; Esfahani, M.S.; Luca, B.A.; Steiner, D.; et al. Determining cell type abundance and expression from bulk tissues with digital cytometry. Nat Biotechnol 2019, 37, 773–782. [Google Scholar] [CrossRef]
- Eden, E.; Navon, R.; Steinfeld, I.; Lipson, D.; Yakhini, Z. GOrilla: a tool for discovery and visualization of enriched GO terms in ranked gene lists. BMC Bioinformatics 2009, 10, 48. [Google Scholar] [CrossRef]
- Supek, F.; Bosnjak, M.; Skunca, N.; Smuc, T. REVIGO summarizes and visualizes long lists of gene ontology terms. PLoS One 2011, 6, e21800. [Google Scholar] [CrossRef] [PubMed]
- Gilkes, D.M. Implications of Hypoxia in Breast Cancer Metastasis to Bone. Int J Mol Sci 2016, 17. [Google Scholar] [CrossRef] [PubMed]
- Gilkes, D.M.; Semenza, G.L. Role of hypoxia-inducible factors in breast cancer metastasis. Future Oncol 2013, 9, 1623–1636. [Google Scholar] [CrossRef] [PubMed]
- Gilkes, D.M.; Bajpai, S.; Chaturvedi, P.; Wirtz, D.; Semenza, G.L. Hypoxia-inducible factor 1 (HIF-1) promotes extracellular matrix remodeling under hypoxic conditions by inducing P4HA1, P4HA2, and PLOD2 expression in fibroblasts. J Biol Chem 2013, 288, 10819–10829. [Google Scholar] [CrossRef]
- Chow, M.T.; Luster, A.D. Chemokines in cancer. Cancer Immunol Res 2014, 2, 1125–1131. [Google Scholar] [CrossRef]
- Balkwill, F. Cancer and the chemokine network. Nat Rev Cancer 2004, 4, 540–550. [Google Scholar] [CrossRef]
- Nagarsheth, N.; Wicha, M.S.; Zou, W. Chemokines in the cancer microenvironment and their relevance in cancer immunotherapy. Nat Rev Immunol 2017, 17, 559–572. [Google Scholar] [CrossRef]
- Panse, J.; Friedrichs, K.; Marx, A.; Hildebrandt, Y.; Luetkens, T.; Barrels, K.; Horn, C.; Stahl, T.; Cao, Y.; Milde-Langosch, K.; et al. Chemokine CXCL13 is overexpressed in the tumour tissue and in the peripheral blood of breast cancer patients. Br J Cancer 2008, 99, 930–938. [Google Scholar] [CrossRef]
- Jiang, L.; Wang, D.; Sheng, M.; Tong, D.; Liu, H.; Dong, L.; Ma, J. CXCL13/CXCR5 are potential biomarkers for diagnosis and prognosis for breast cancer. J BUON 2020, 25, 2552–2561. [Google Scholar]
- Downs-Canner, S.M.; Meier, J.; Vincent, B.G.; Serody, J.S. B Cell Function in the Tumor Microenvironment. Annu Rev Immunol 2022, 40, 169–193. [Google Scholar] [CrossRef]
- Asokan, S.; Bandapalli, O.R. CXCL8 Signaling in the Tumor Microenvironment. Adv Exp Med Biol 2021, 1302, 25–39. [Google Scholar] [CrossRef] [PubMed]
- Howard, R.; Kanetsky, P.A.; Egan, K.M. Exploring the prognostic value of the neutrophil-to-lymphocyte ratio in cancer. Sci Rep 2019, 9, 19673. [Google Scholar] [CrossRef] [PubMed]
- Forget, P.; Khalifa, C.; Defour, J.P.; Latinne, D.; Van Pel, M.C.; De Kock, M. What is the normal value of the neutrophil-to-lymphocyte ratio? BMC Res Notes 2017, 10, 12. [Google Scholar] [CrossRef]
- Wei, B.; Yao, M.; Xing, C.; Wang, W.; Yao, J.; Hong, Y.; Liu, Y.; Fu, P. The neutrophil lymphocyte ratio is associated with breast cancer prognosis: an updated systematic review and meta-analysis. Onco Targets Ther 2016, 9, 5567–5575. [Google Scholar] [CrossRef] [PubMed]
- Zhou, S.L.; Zhou, Z.J.; Hu, Z.Q.; Huang, X.W.; Wang, Z.; Chen, E.B.; Fan, J.; Cao, Y.; Dai, Z.; Zhou, J. Tumor-Associated Neutrophils Recruit Macrophages and T-Regulatory Cells to Promote Progression of Hepatocellular Carcinoma and Resistance to Sorafenib. Gastroenterology 2016, 150, 1646–1658. [Google Scholar] [CrossRef]
- Mishalian, I.; Bayuh, R.; Eruslanov, E.; Michaeli, J.; Levy, L.; Zolotarov, L.; Singhal, S.; Albelda, S.M.; Granot, Z.; Fridlender, Z.G. Neutrophils recruit regulatory T-cells into tumors via secretion of CCL17--a new mechanism of impaired antitumor immunity. Int J Cancer 2014, 135, 1178–1186. [Google Scholar] [CrossRef]
- Song, X.; Wei, C.; Li, X. The Signaling Pathways Associated With Breast Cancer Bone Metastasis. Front Oncol 2022, 12, 855609. [Google Scholar] [CrossRef]
- Yang, S.; Li, Y.; Gao, J.; Zhang, T.; Li, S.; Luo, A.; Chen, H.; Ding, F.; Wang, X.; Liu, Z. MicroRNA-34 suppresses breast cancer invasion and metastasis by directly targeting Fra-1. Oncogene 2013, 32, 4294–4303. [Google Scholar] [CrossRef]
- Gregory, P.A.; Bert, A.G.; Paterson, E.L.; Barry, S.C.; Tsykin, A.; Farshid, G.; Vadas, M.A.; Khew-Goodall, Y.; Goodall, G.J. The miR-200 family and miR-205 regulate epithelial to mesenchymal transition by targeting ZEB1 and SIP1. Nat Cell Biol 2008, 10, 593–601. [Google Scholar] [CrossRef]
- Lin, X.; Chen, L.; Yao, Y.; Zhao, R.; Cui, X.; Chen, J.; Hou, K.; Zhang, M.; Su, F.; Chen, J.; et al. CCL18-mediated down-regulation of miR98 and miR27b promotes breast cancer metastasis. Oncotarget 2015, 6, 20485–20499. [Google Scholar] [CrossRef]
- Liu, Y.; Chen, J. miR-425 suppresses EMT and the development of TNBC (triple-negative breast cancer) by targeting the TGF-beta 1/SMAD 3 signaling pathway. RSC Adv 2018, 9, 151–165. [Google Scholar] [CrossRef] [PubMed]
- Wang, Y.; Zhang, X.; Li, H.; Yu, J.; Ren, X. The role of miRNA-29 family in cancer. Eur J Cell Biol 2013, 92, 123–128. [Google Scholar] [CrossRef] [PubMed]
- Ke, K.; Lou, T. MicroRNA-10a suppresses breast cancer progression via PI3K/Akt/mTOR pathway. Oncol Lett 2017, 14, 5994–6000. [Google Scholar] [CrossRef] [PubMed]
- Zhuo, Y.; Li, S.; Hu, W.; Zhang, Y.; Shi, Y.; Zhang, F.; Zhang, J.; Wang, J.; Liao, M.; Chen, J.; et al. Targeting SNORA38B attenuates tumorigenesis and sensitizes immune checkpoint blockade in non-small cell lung cancer by remodeling the tumor microenvironment via regulation of GAB2/AKT/mTOR signaling pathway. J Immunother Cancer 2022, 10. [Google Scholar] [CrossRef] [PubMed]
- Adams, S.J.; Aydin, I.T.; Celebi, J.T. GAB2--a scaffolding protein in cancer. Mol Cancer Res 2012, 10, 1265–1270. [Google Scholar] [CrossRef]
- Luo, L.; Zhang, J.; Tang, H.; Zhai, D.; Huang, D.; Ling, L.; Wang, X.; Liu, T.; Zhang, Q.; Zhang, Z.; et al. LncRNA SNORD3A specifically sensitizes breast cancer cells to 5-FU by sponging miR-185-5p to enhance UMPS expression. Cell Death Dis 2020, 11, 329. [Google Scholar] [CrossRef]
- Sisu, C. Pseudogenes as Biomarkers and Therapeutic Targets in Human Cancers. Methods Mol Biol 2021, 2324, 319–337. [Google Scholar] [CrossRef]
- Salmena, L. Pseudogenes: Four Decades of Discovery. Methods Mol Biol 2021, 2324, 3–18. [Google Scholar] [CrossRef]
- Wang, X.; Zhang, L.; Liang, Q.; Wong, C.C.; Chen, H.; Gou, H.; Dong, Y.; Liu, W.; Li, Z.; Ji, J.; et al. DUSP5P1 promotes gastric cancer metastasis and platinum drug resistance. Oncogenesis 2022, 11, 66. [Google Scholar] [CrossRef]
- Zhou, L.Y.; Yin, J.Y.; Tang, Q.; Zhai, L.L.; Zhang, T.J.; Wang, Y.X.; Yang, D.Q.; Qian, J.; Lin, J.; Deng, Z.Q. High expression of dual-specificity phosphatase 5 pseudogene 1 (DUSP5P1) is associated with poor prognosis in acute myeloid leukemia. Int J Clin Exp Pathol 2015, 8, 16073–16080. [Google Scholar]
- Staege, M.S.; Muller, K.; Kewitz, S.; Volkmer, I.; Mauz-Korholz, C.; Bernig, T.; Korholz, D. Expression of dual-specificity phosphatase 5 pseudogene 1 (DUSP5P1) in tumor cells. PLoS One 2014, 9, e89577. [Google Scholar] [CrossRef] [PubMed]
| Variables | Statistics | De novo metastasized BC group (dnMBC) | Non-primary metastasized BC group (eBC) |
|---|---|---|---|
| Age patients | |||
| N | 32 | 32 | |
| Median | 62 | 61 | |
| Average | 61.69 | 60.84 | |
| Range | [32.0; 88.0] | [36.0; 83.0] | |
| Grade of tumor | |||
| Grade 2 | n/N (%) | 14/32 (44%) | 15/32 (47%) |
| Grade 3 | n/N (%) | 18/32 (56%) | 17/32 (53%) |
| Progesterone receptor status | |||
| Positive | n/N (%) | 28/32 (87%) | 30/32 (94%) |
| Negative | n/N (%) | 4/32 (13%) | 2/32 (6%) |
| Clinical staging (cT) | |||
| cT1 | n/N (%) | 1/32 (3%) | 6/32 (19%) |
| cT2 | n/N (%) | 17/32 (53%) | 23/32 (72%) |
| cT3 | n/N (%) | 4/32 (13%) | 3/32 (9%) |
| cT4 | n/N (%) | 10/32 (31%) | 0/32 (0%) |
| cT4b | n/N (%) | 3/32 (9%) | 0/32 (0%) |
| cT4c | n/N (%) | 1/32 (3%) | 0/32 (0%) |
| cT4d | n/N (%) | 5/32 (16%) | 0/32 (0%) |
| Lymph node involvement (cN) | |||
| cN0 | n/N (%) | 6/32 (19%) | 21/32 (66%) |
| cN1 | n/N (%) | 11/32 (34%) | 11/32 (34%) |
| cN2 | n/N (%) | 3/32 (9%) | 0/32 (0%) |
| cN3 | n/N (%) | 12/32 (38%) | 0/32 (0%) |
| Tumor size (mm) | |||
| Median | 37 | 27 | |
| Average | 43.68 | 28.47 | |
| Range | [16.0; 140.0] | [15.0; 55.0] | |
| Location of metastasis | |||
| Brain | n/N (%) | 0/32 (0%) | - |
| AbdominalNonLiver | n/N (%) | 3/32 (9%) | - |
| Liver | n/N (%) | 13/32 (41%) | - |
| Cutaneous | n/N (%) | 3/32 (9%) | - |
| Lung | n/N (%) | 11/32 (34%) | - |
| Bone | n/N (%) | 21/32 (66%) | - |
| Lymph nodes | n/N (%) | 12/32 (38%) | - |
| Others | n/N (%) | 1/32 (3%) | - |
Disclaimer/Publisher’s Note: The statements, opinions and data contained in all publications are solely those of the individual author(s) and contributor(s) and not of MDPI and/or the editor(s). MDPI and/or the editor(s) disclaim responsibility for any injury to people or property resulting from any ideas, methods, instructions or products referred to in the content. |
© 2023 by the authors. Licensee MDPI, Basel, Switzerland. This article is an open access article distributed under the terms and conditions of the Creative Commons Attribution (CC BY) license (http://creativecommons.org/licenses/by/4.0/).


