Submitted:
26 June 2023
Posted:
27 June 2023
You are already at the latest version
Abstract
Keywords:
1. Introduction
2. Results
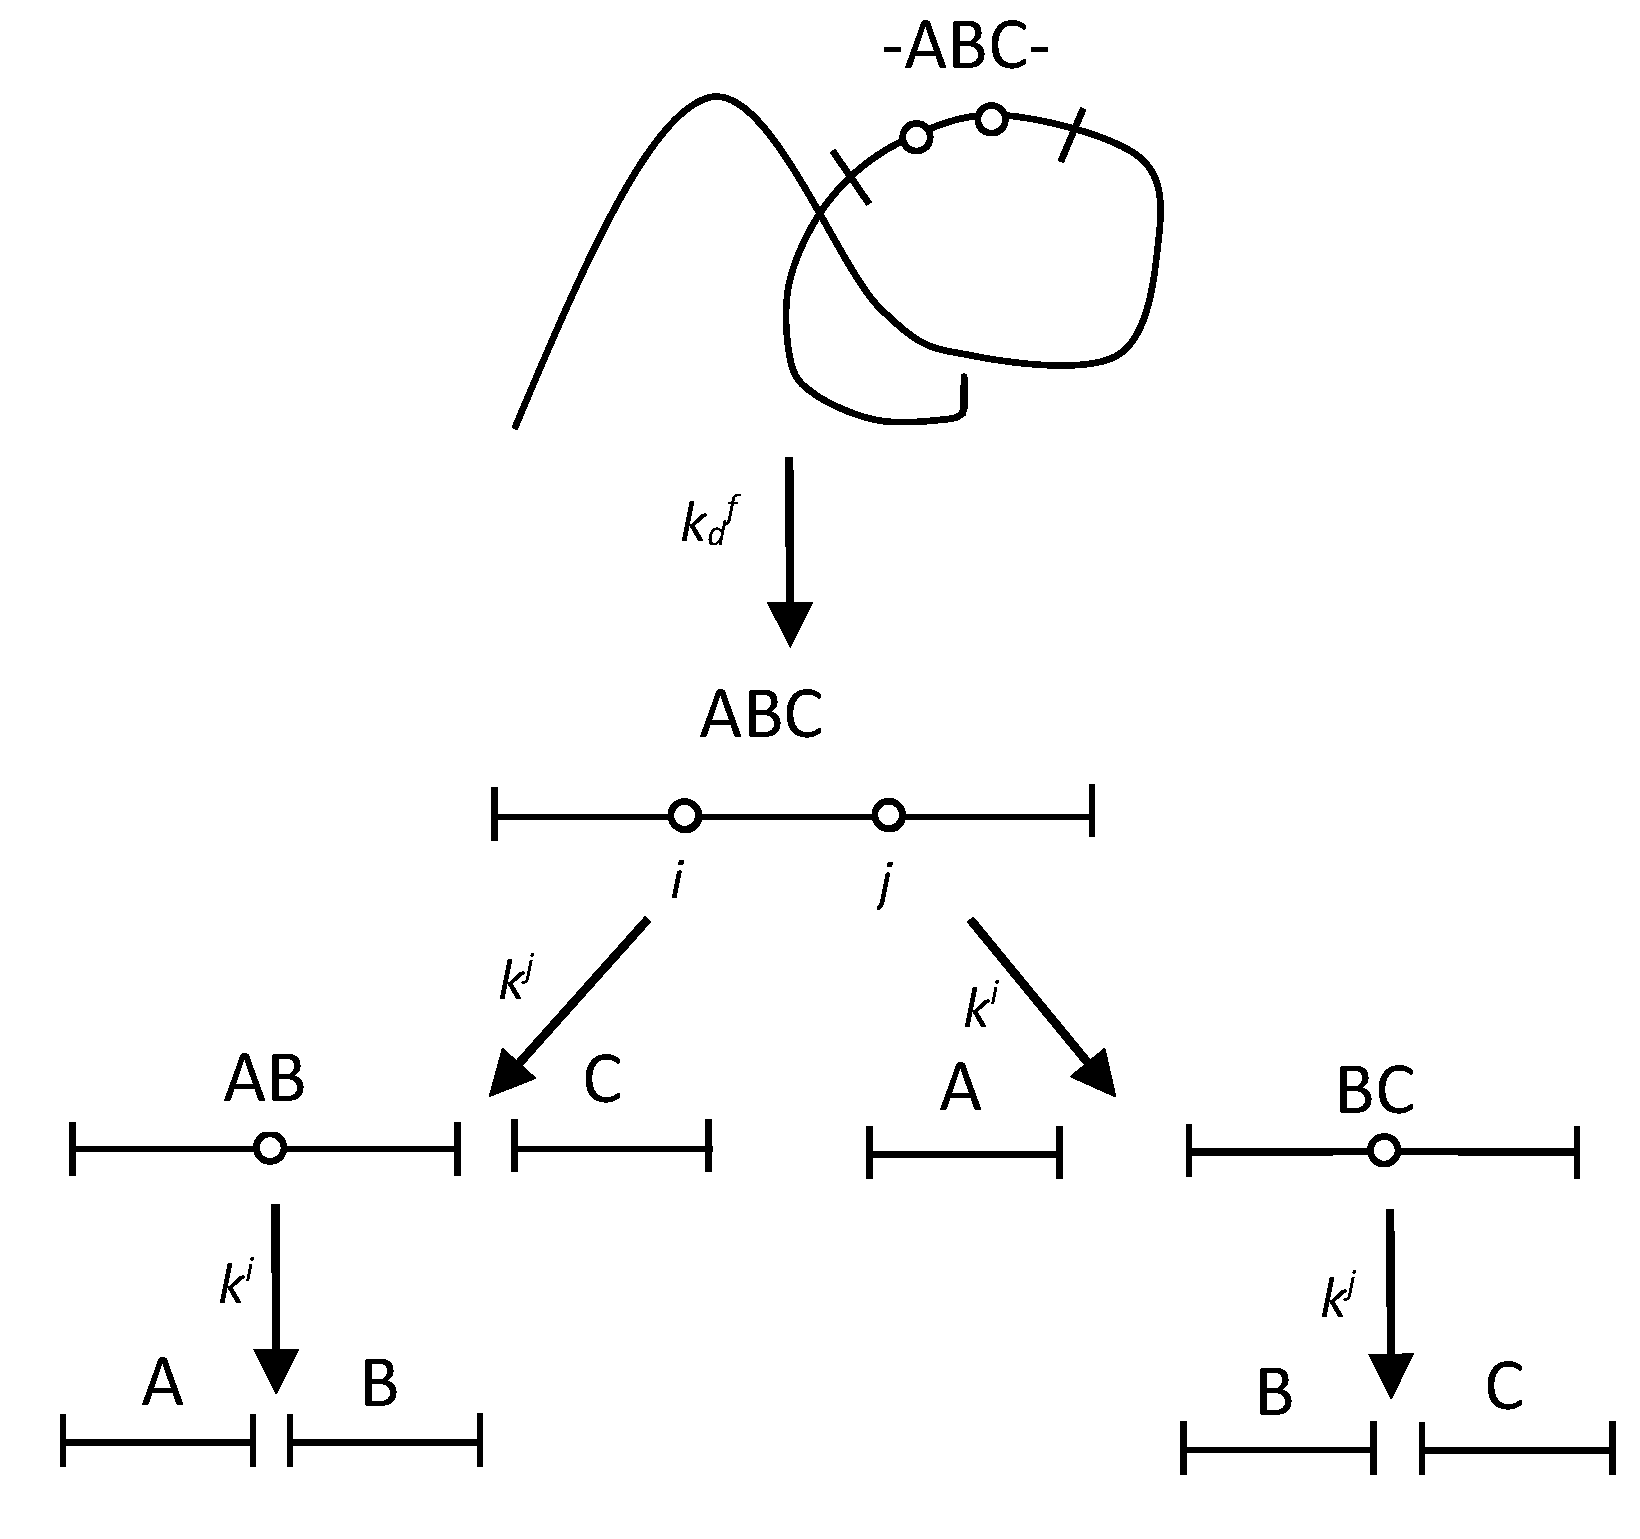
2.1. The polypeptide chain fragmentation with one demasking step
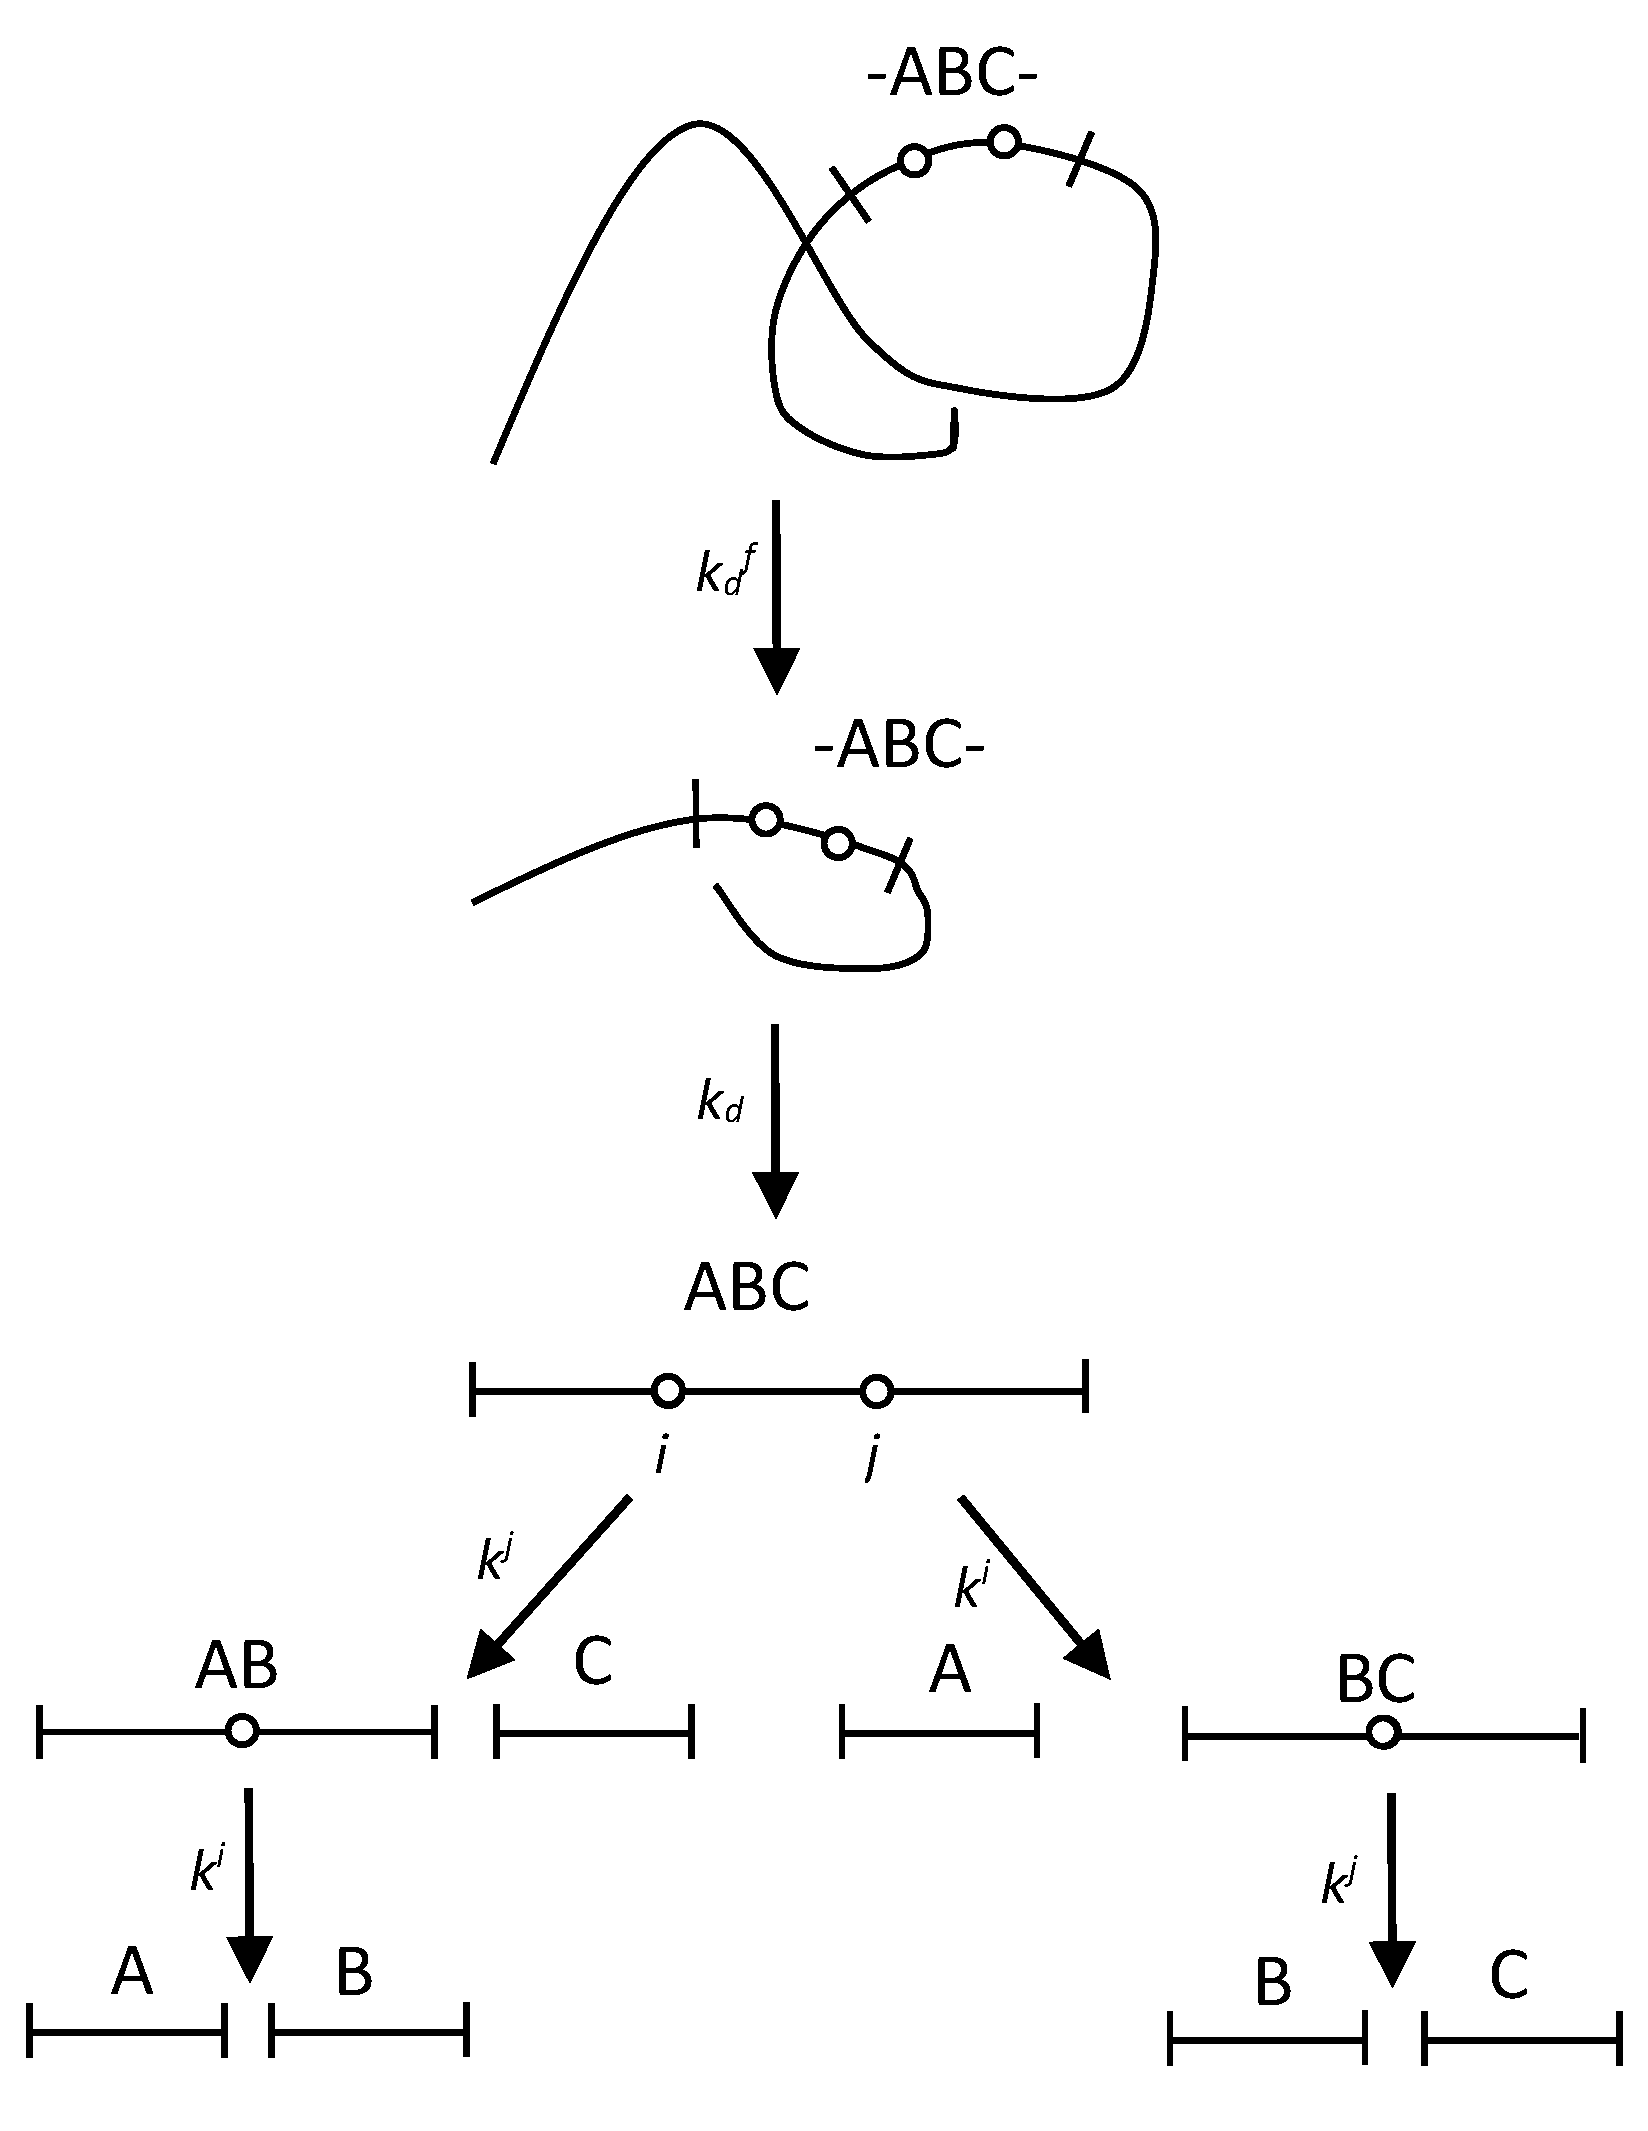
2.2. The polypeptide chain fragmentation with two demasking steps
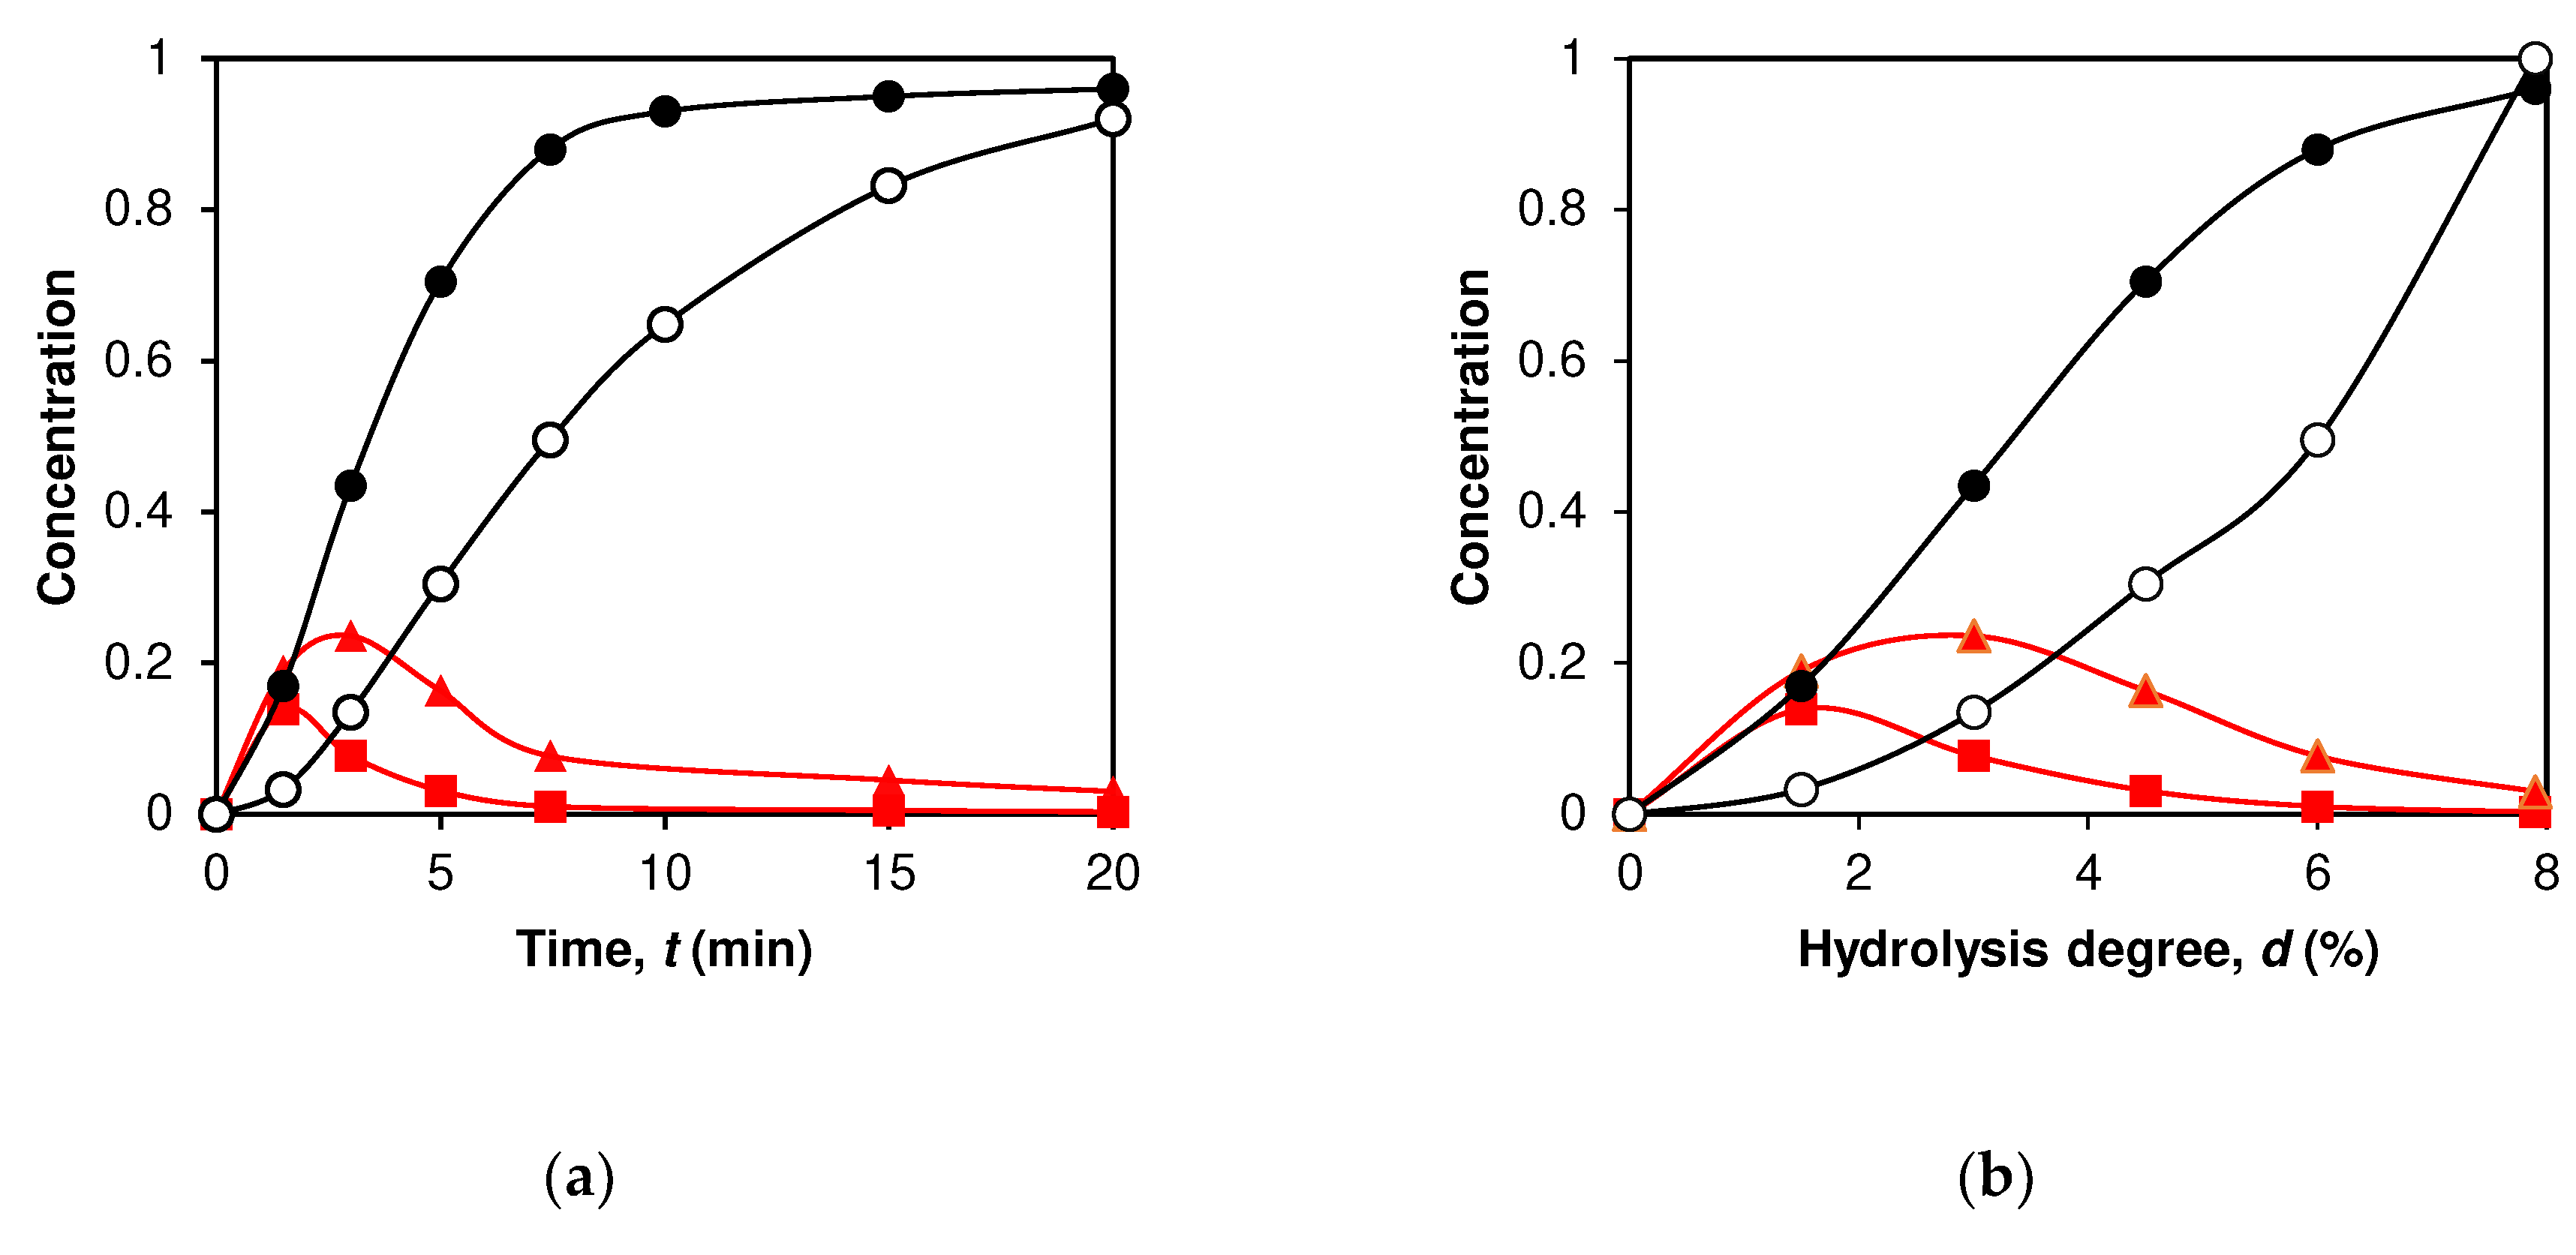
2.3. Application of peptide release schemes to β-LG proteolysis by trypsin.
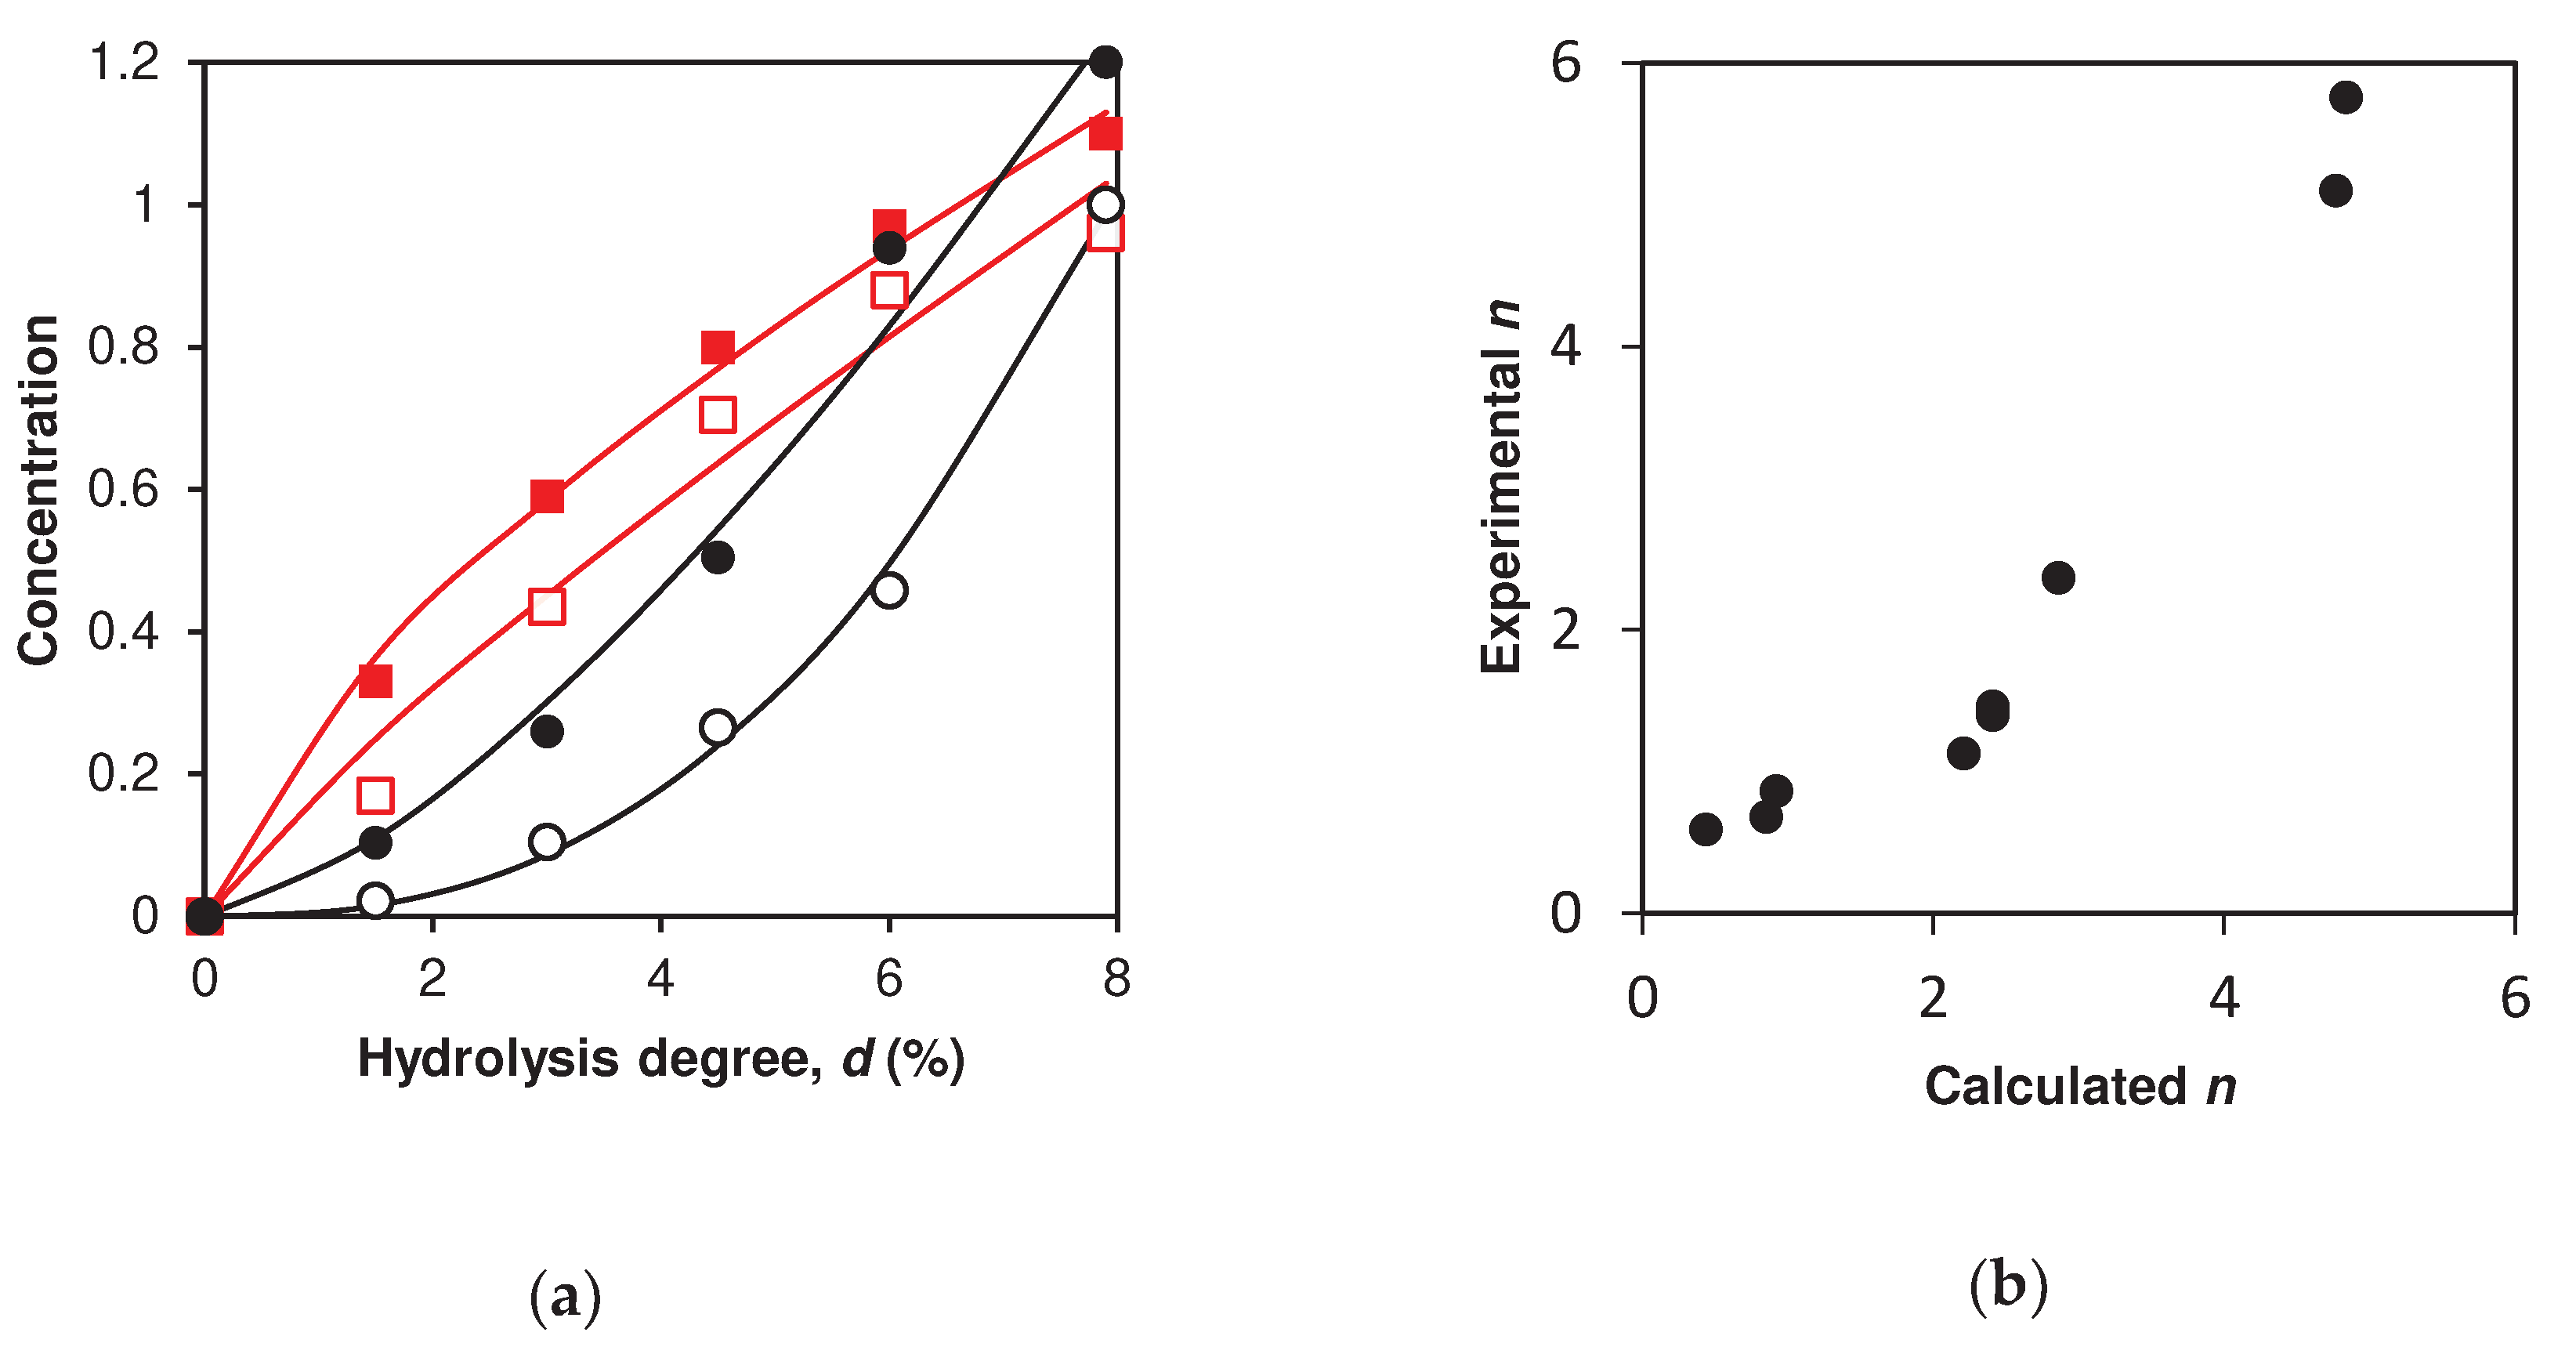
2.4. Simulation of peptide release for β-LG proteolysis by trypsin
3. Discussion
4. Materials and Methods
4.1. Quantitative modelling of proteolysis with one-stage demasking
4.2. Quantitative modelling of proteolysis with two-stage demasking
4.3. Estimation of the parameters for concentration dependences
Author Contributions
Funding
Institutional Review Board Statement
Informed Consent Statement
Data Availability Statement
Conflicts of Interest
References
- Niemann, C. Alpha-chymotrypsin and the nature of enzyme catalysis. Science 1964, 143(3612), 1287–1296. [Google Scholar] [CrossRef] [PubMed]
- Vorob’ev, M.M.; Dalgalarrondo, M.; Chobert, J.-M.; Haertle, T. Kinetics of β-casein hydrolysis by wild-type and engineered trypsin. Biopolymers 2000, 54, 355–364. [Google Scholar] [CrossRef] [PubMed]
- Vorob’ev, M.M. Kinetics of peptide bond demasking in enzymatic hydrolysis of casein substrates. J. Mol. Catal. B 2009, 58, 146–152. [Google Scholar] [CrossRef]
- Antonov, V.K. New Data on Pepsin Mechanism and Specificity. In: Tang, J. (eds) Acid Proteases: Structure, Function, and Biology. Advances in Experimental Medicine and Biology, vol 95. Springer: New York, NY, 1977. [CrossRef]
- Vorob’ev, M.M.; Goncharova, I.A. Computer simulation of proteolysis. Peptic hydrolysis of partially demasked β-Lactoglobulin. Nahrung-Food 1998, 42, 61–67. [Google Scholar] [CrossRef]
- Suwareh, O.; Causeur, D.; Jardin, J.; Briard-Bion, V.; Le Feunteun, S.; Pezennec, S.; Nau, F. Statistical modeling of in vitro pepsin specificity. Food Chem. 2021, 362, 130098. [Google Scholar] [CrossRef]
- Tonda, A.; Grosvenor, A.; Clerens, S.; Le Feunteun, S. In silico modeling of protein hydrolysis by endoproteases: a case study on pepsin digestion of bovine lactoferrin. Food Funct. 2017, 8, 4404–4413. [Google Scholar] [CrossRef]
- Trusek-Holownia, A.; Noworyta, A. A model of kinetics of the enzymatic hydrolysis of biopolymers – a concept for determination of hydrolysate composition. Chem. Eng. Process.: Process Intensif. 2015, 89, 54–61. [Google Scholar] [CrossRef]
- Deng, Y.; van der Veer, F.; Sforza, S.; Gruppen, H.; Wierenga, P.A. Towards predicting protein hydrolysis by bovine trypsin. Process Biochem. 2018, 65, 81–92. [Google Scholar] [CrossRef]
- Butré, C.I. Introducing enzyme selectivity as a quantitative parameter to describe the effects of substrate concentration on protein hydrolysis. Thesis, Wageningen University, 2014, ISBN: 978-94-6257-023-8.
- Muñoz-Tamayo, R.; De Groot, J.; Wierenga, P.A.; Gruppen, H.; Zwietering, M.H.; Sijtsma, L. Modeling peptide formation during the hydrolysis of β-casein by Lactococcus lactis. Process Biochem. 2012, 47, 83–93. [Google Scholar] [CrossRef]
- Polgár, L. The catalytic triad of serine peptidases. Cell. Mol. Life Sci. 2005, 62, 2161–2172. [Google Scholar] [CrossRef]
- Olsen, J.V.; Ong, S.-E.; Mann, M. Trypsin cleaves exclusively C-terminal to arginine and lysine residues. Mol. Cell. Proteomics. 2004, 3, 608–614. [Google Scholar] [CrossRef] [PubMed]
- Stryer, L. Biochemistry, 3rd ed.; W.H. Freeman and Company: NY, USA, 1988; ISBN 0-7167-1843-x. [Google Scholar]
- Vorob’ev, M.M.; Vogel, V.; Güler, G.; Mäntele, W. Monitoring of demasking of peptide bonds during proteolysis by analysis of the apparent spectral shift of intrinsic protein fluorescence. Food Biophys. 2011, 6, 519–526. [Google Scholar] [CrossRef]
- Vorob’ev, M.M. Proteolysis of β-lactoglobulin by trypsin: Simulation by two-step model and experimental verification by intrinsic tryptophan fluorescence. Symmetry 2019, 11, 153. [Google Scholar] [CrossRef]
- Vorob’ev, M.M. Modeling of proteolysis of β-lactoglobulin and β-casein by trypsin with consideration of secondary masking of intermediate polypeptides. Int. J. Mol. Sci. 2022, 23, 8089. [Google Scholar] [CrossRef]
- Vorob’ev, M.M. Tryptophan fluorescence and time-lag hydrolysis of peptide bonds during degradation of β-lactoglobulin by trypsin. Catalysts 2020, 10, 1368. [Google Scholar] [CrossRef]
- Butre, C.I.; Sforza, S.; Gruppen, H.; Wierenga, P.A. Introducing enzyme selectivity: a quantitative parameter to describe enzymatic protein hydrolysis. Anal. Bioanal. Chem. 2014, 406, 5827–5841. [Google Scholar] [CrossRef]
- Vorob’ev, M.M.; Butré, C.I.; Sforza, S.; Wierenga, P.A.; Gruppen, H. Demasking kinetics of peptide bond cleavage for whey protein isolate hydrolysed by Bacillus licheniformis protease. J. Mol. Catal, B. 2016, 133, 426–431. [Google Scholar] [CrossRef]
- Caessens, P.; Visser, S.; Gruppen, H.; Voragen, A. β-Lactoglobulin hydrolysis. 1. Peptide composition and functional properties of hydrolysates obtained by the action of plasmin, trypsin, and Staphylococcus aureus V8 protease. J. Agric. Food Chem. 1999, 47, 2973–2979. [Google Scholar] [CrossRef] [PubMed]
- Cheison, S.; Schmitt, M.; Leeb, E.; Letzel, T.; Kulozik, U. Influence of temperature and degree of hydrolysis on the peptide composition of trypsin hydrolysates of β-lactoglobulin: Analysis by LC-ESI-TOF/MS. Food Chem. 2010, 121, 457–467. [Google Scholar] [CrossRef]
- Fernandez, A.; Riera, F. β-Lactoglobulin tryptic digestion: A model approach for peptide release. Biochem. Eng. J. 2013, 70, 88–96. [Google Scholar] [CrossRef]
- Mao, Y.; Krischke, M.; Kulozik, U. β-lactoglobulin hydrolysis by immobilized trypsin in ethanol/aqueous solvents. Process Biochem. 2019, 82, 84–93. [Google Scholar] [CrossRef]
- Cheison, S.; Lai, M.; Leeb, E.; Kulozik, U. Hydrolysis of β-lactoglobulin by trypsin under acidic pH and analysis of the hydrolysates with MALDI–TOF–MS/MS. Food Chem. 2011, 125, 1241–1248. [Google Scholar] [CrossRef]
- Emsley, A.M.; Heywood, R.J. Computer modeling of the degradation of linear polymers. Polym. Degrad. Stab. 1995, 49, 145–149. [Google Scholar] [CrossRef]
- Leeb, E.; Stefan, T.; Letzel, T.; Hinrichs, J.; Kulozik, U. Tryptic hydrolysis of β-lactoglobulin: A generic approach to describe the hydrolysis kinetic and release of peptides. Int. Dairy J. 2020, 105, 104666. [Google Scholar] [CrossRef]
- Cheison, S.C.; Leeb, E.; Letzel, T.; Kulozik, U. Influence of buffer type and concentration on the peptide composition of trypsin hydrolysates of β-lactoglobulin. Food Chem. 2011, 125, 121–127. [Google Scholar] [CrossRef]
- Vorob’ev, M.M.; Paskonova, E.A. , Vitt, S.V.; Belikov, V.M. Kinetic description of proteolysis. Part 2. Substrate regulation of peptide bond demasking and hydrolysis. Liquid chromatography of hydrolyzates. Nahrung-Food, 1986, 30, 995–1001. [Google Scholar] [CrossRef]
- Chabanon, G.; Chevalot, I.; Framboisier, X.; Chenu, S.; Marc, I. Hydrolysis of rapeseed protein isolates: Kinetics, characterization and functional properties of hydrolysates. Process Biochem. 2007, 42, 1419–1428. [Google Scholar] [CrossRef]
- Vorob’ev, M.M. Quantification of two-step proteolysis model with consecutive demasking and hydrolysis of peptide bonds using casein hydrolysis by chymotrypsin. Biochem. Eng. J. 2013, 74, 60–68. [Google Scholar] [CrossRef]
- Rivera-Burgos, D.; Regnier, F.E. Disparities between immobilized enzyme and solution based digestion of transferrin with trypsin. J. Sep. Sci. 2013, 36, 454–460. [Google Scholar] [CrossRef]
- Melikishvili, S.; Dizon, M. , Hianik, T. Application of high-resolution ultrasonic spectroscopy for real-time monitoring of trypsin activity in β-casein solution. Food Chem. 2021, 337, 127759. [Google Scholar] [CrossRef]
- Buckin, V.; Altas, M.C. Ultrasonic monitoring of biocatalysis in solutions and complex dispersions. Catalysts 2017, 7, 336. [Google Scholar] [CrossRef]
- Vreeke, G.J.C.; Vincken, J.-P.; Wierenga, P.A. The path of proteolysis by bovine chymotrypsin Food Res. Int. 2023, 165, 112485. [Google Scholar] [CrossRef]
- Vorob’ev, M.M.; Vitt, S.V.; Belikov, V.M. Kinetic description of proteolysis. Part 3. Total kinetics of peptide bonds hydrolysis in peptide mixtures. Nahrung-Food 1987, 31, 331–340. [Google Scholar] [CrossRef] [PubMed]
- Marquez, M.C.; Fernandez, V. Enzymic hydrolysis of vegetable proteins: mechanism and kinetics. Process Biochem. 1993, 28, 481–490. [Google Scholar] [CrossRef]

| Peptide | Type of demasking | Hydrolysis rate constants (min-1) | Calculated values of dr (%) | Experimental estimation of dr (%) |
|---|---|---|---|---|
| f(9-69/70) ABC | One-stage1 | k14=0.53 k40=1.41 | 2.6 | 1.53 |
| f(9-40) AB | One-stage1 | 3.5 | 3.6 | |
| f(15-69/70) BC | One-stage1 | 2.8 | -4 | |
| f(76-100/101) ABC | Two-stage | k83=1 k91=1 | 3.9 | 3.4 |
| f(76-91) AB | Two-stage2 | 4.3 | 4.4 | |
| f(84-100/101) BC | Two-stage2 | 4.3 | 4,7 | |
| f(101/102-138) ABC | Two-stage2 | k124=2 k138=0.2 | 3.8 | 3,4 |
| f(101/102-135)AB | Two-stage2 | 4,1 | -4 | |
| f(125-138) BC | Two-stage2 | 4.7 | 6.1 |
| Peptide | Type of demasking | Hydrolysis rate constants (min-1) | Calculated values of n3 | Experimental estimation of n3 |
|---|---|---|---|---|
| f(9-14) A | One-stage1 | k14=0.53 k40=1.41 | 0.85 | 0.68 |
| f(15-40) B f(41-69/70) C |
One-stage1 One-stage1 |
0.92 0.44 |
0.86 0.59 |
|
| f(76-83) A | Two-stage2 | k83=1 k91=1 | 2.41 | 1.46 |
| f(84-91) B | Two-stage2 | 2.86 | 2.37 | |
| f(92-100/101) C | Two-stage2 | 2.41 | 1.40 | |
| f(101/102-124) A | Two-stage2 | k124=2 k135=0.2 | 2.21 | 1.13 |
| f(125-135) B | Two-stage2 | 4.84 | 5.76 | |
| f(136-138) C | Two-stage2 | 4.77 | 5.10 |
| Peptide fragment | Constant term C0 | |||
|---|---|---|---|---|
| A | 1 | 0 | ||
| B | 1 | |||
| C | 1 | 0 | ||
| AB | 0 | |||
| BC | 0 | |||
| ABC | 0 |
| Peptide fragment | ||
|---|---|---|
| A | 0 | |
| B | 0 | 0 |
| C | 0 | |
| AB | 0 | |
| BC | 0 | |
| ABC |
Disclaimer/Publisher’s Note: The statements, opinions and data contained in all publications are solely those of the individual author(s) and contributor(s) and not of MDPI and/or the editor(s). MDPI and/or the editor(s) disclaim responsibility for any injury to people or property resulting from any ideas, methods, instructions or products referred to in the content. |
© 2023 by the authors. Licensee MDPI, Basel, Switzerland. This article is an open access article distributed under the terms and conditions of the Creative Commons Attribution (CC BY) license (http://creativecommons.org/licenses/by/4.0/).


