Conventional lenses are based on the radial shaping of materials like glass or plastic that exhibits a constant refractive index. These optical components have typically one fixed focal length. The standard way of varying the focal length of an imaging system is thus to use a certain number of lenses such that the focus position is changed by mechanically adjusting their mutual distance. This approach makes the system bulky and unsuited for some applications. Compact and lightweight optical systems where the focal length can be varied without moving parts, are clearly very attractive. The fluid nature of the director field in liquid crystals (LC), combined with their high sensitivity to external stimuli, makes lenses based on liquid crystalline materials able to fulfill the above requirements. The focal length of LC lenses is typically electrically tunable and since the first report dated back to 1979 [
1], several different structures have been proposed mainly based on patterned electrodes [
2,
3,
4,
5,
6,
7]. LC cells with pixel-free electrodes, have also been proposed [
8].
Despite they are more than 40 years old and the large amount of existing literature, LC lenses continue to attract the interest of the scientific community due to the great number of possible applications. Some new devices, such as head-mounted displays, mobile cameras, or contact lenses have indeed demonstrated the need for novel adaptive lenses [
9] and non-conventional solutions have been recently proposed [
10,
11,
12,
13].
With the aim of giving a contribution to the recent efforts, we propose here a theoretical study of LC lenses based on a parabolic profile of the anchoring energy that can easily be produced by photoalignment of proper transparent surface coatings [
14,
15,
16,
17]. Our simulations show that the application of an external voltage
V in the range (0.7 – 1) V produces a tunable parabolic modulation of the LC birefringence. Both the phase delay and the focal length have been calculated for the different values of
V and the lens aberrations have been estimated.
Noteworthy, LC lens with a parabolic phase profile have recently been proposed [
7]. In that work the parabolic profile was obtained by a proper electrode pattern that gave rise to a parabolic distribution of the applied voltage. Our approach, on the contrary, is based on photoalignment and does not require any electrode patterning.
1. Modeling the LC lens
Let us consider a nematic liquid crystal (LC) cell of thickness
L and width
D with spatially modulated anchoring. Specifically, we assume strong planar anchoring at the top substrate, and an anchoring energy dependent on the distance from the center of the cell at the bottom substrate [
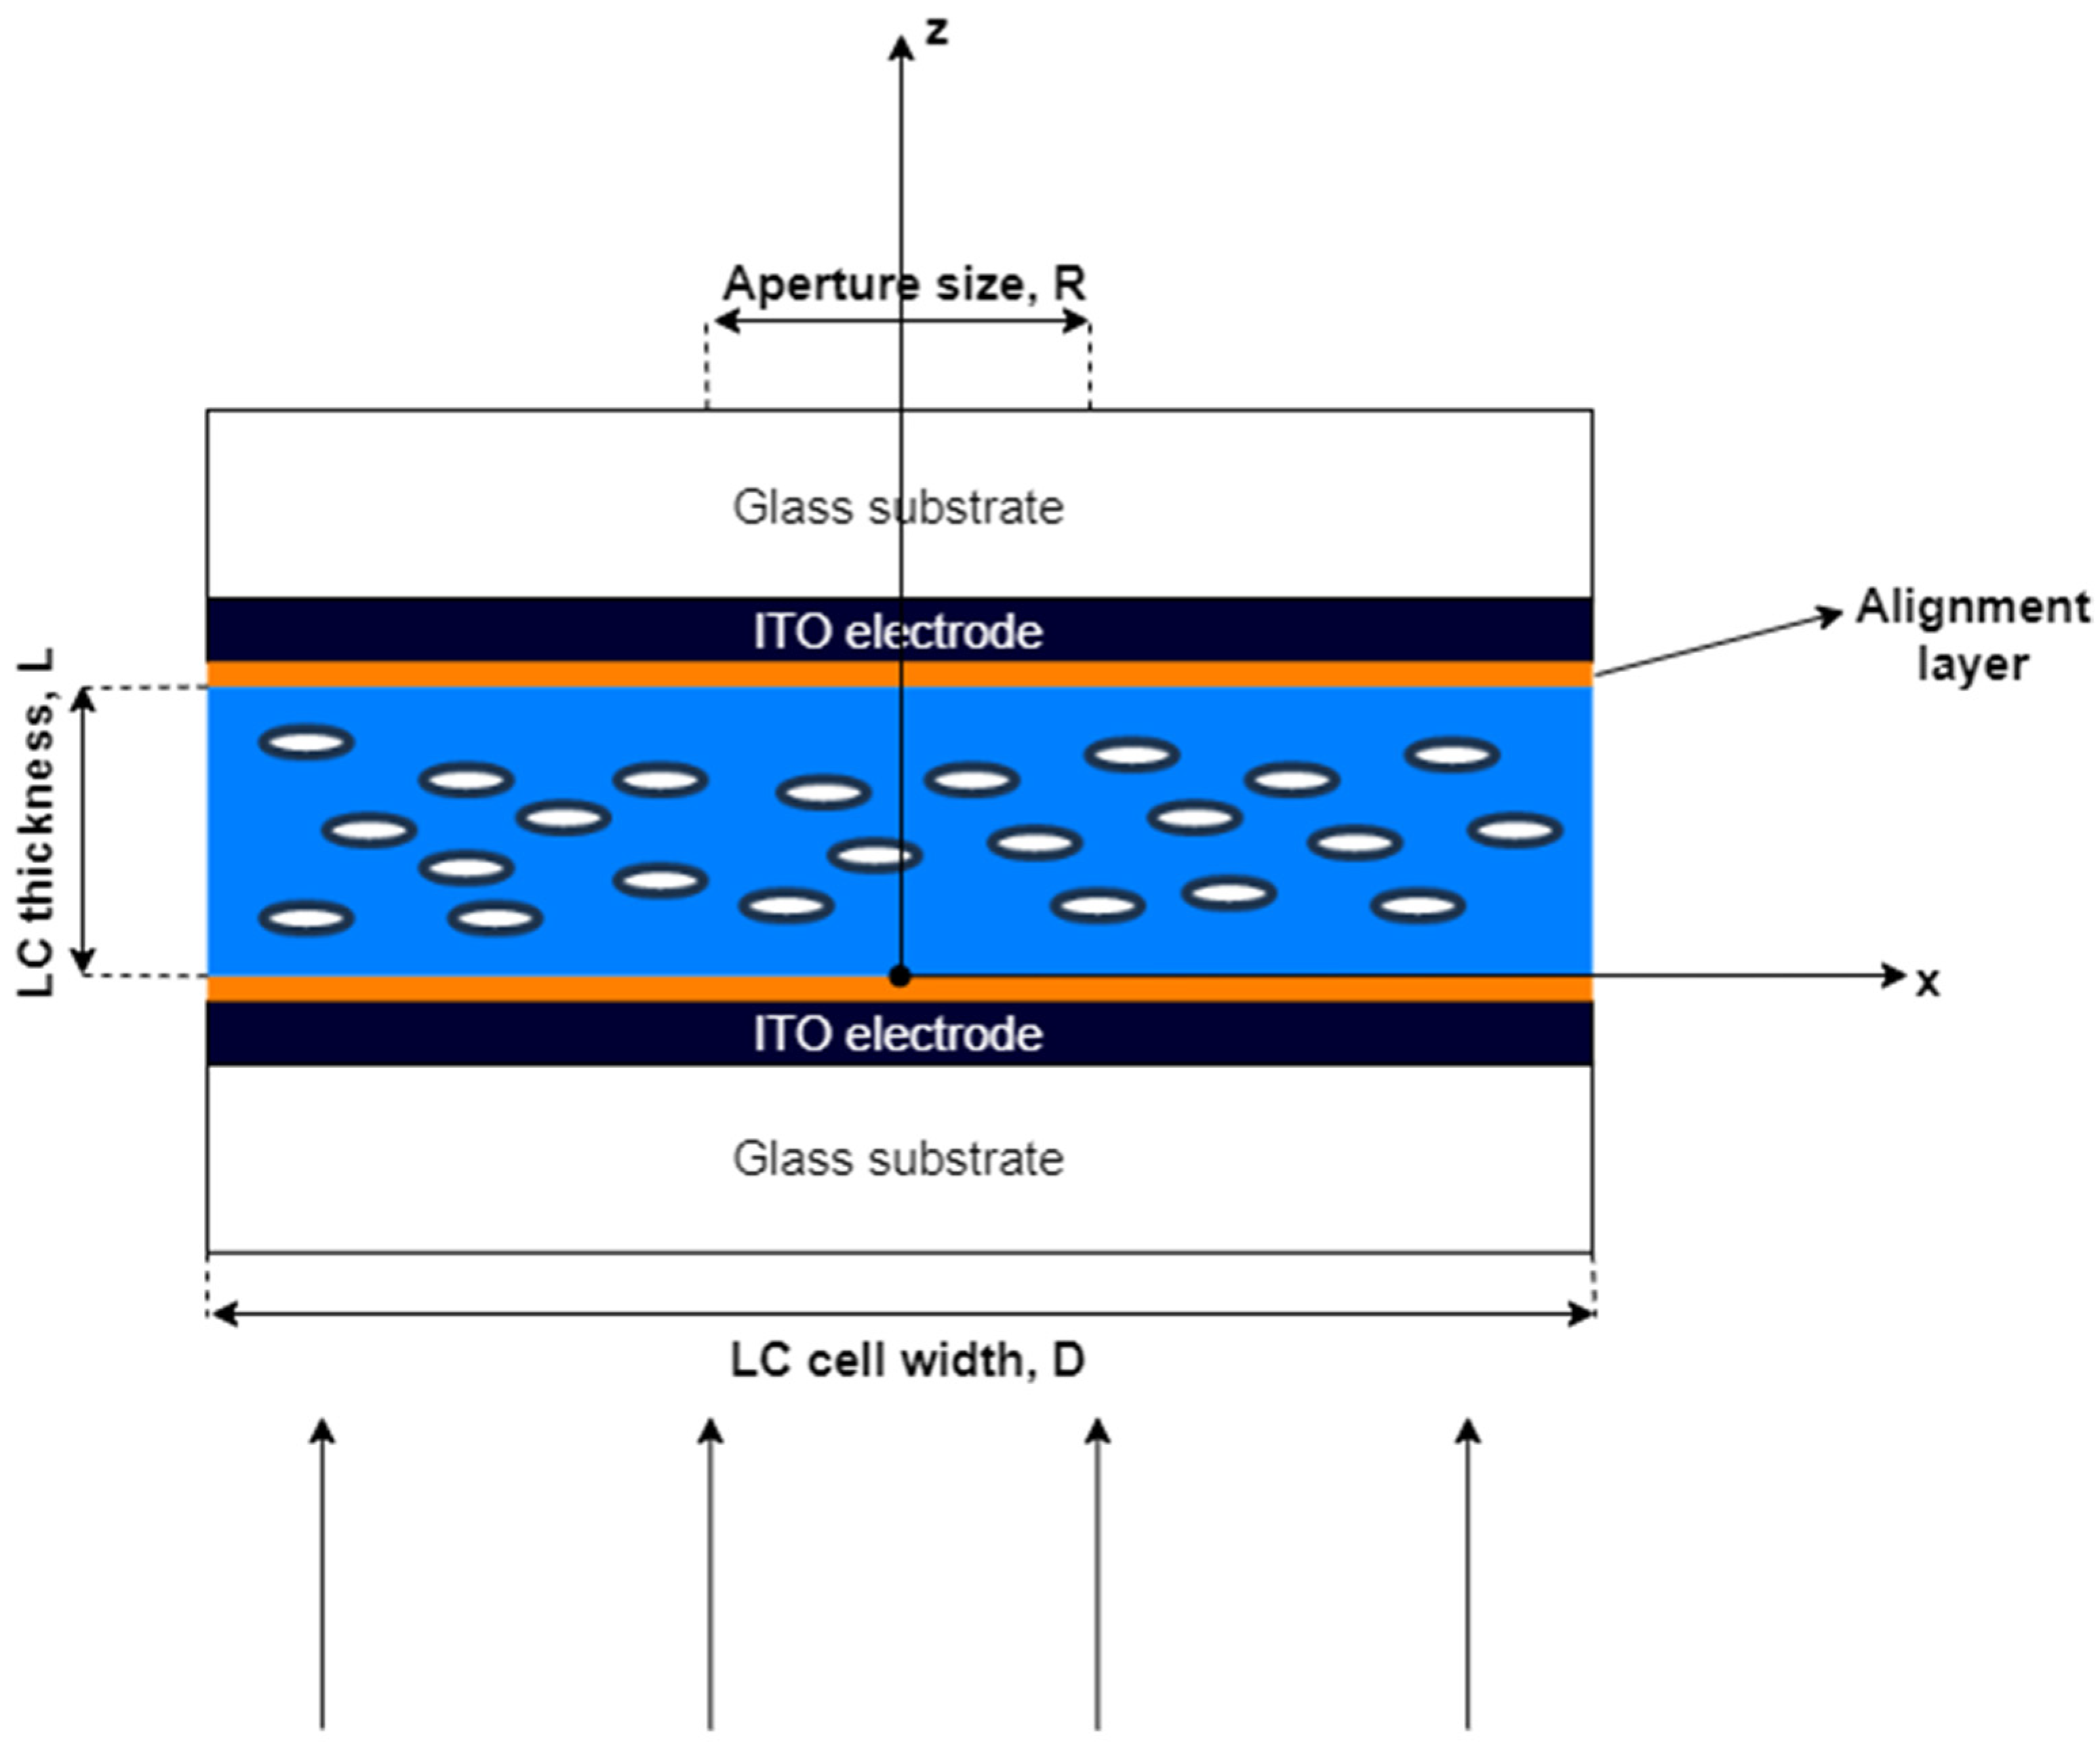
18]. A sketch of the cell is reported in
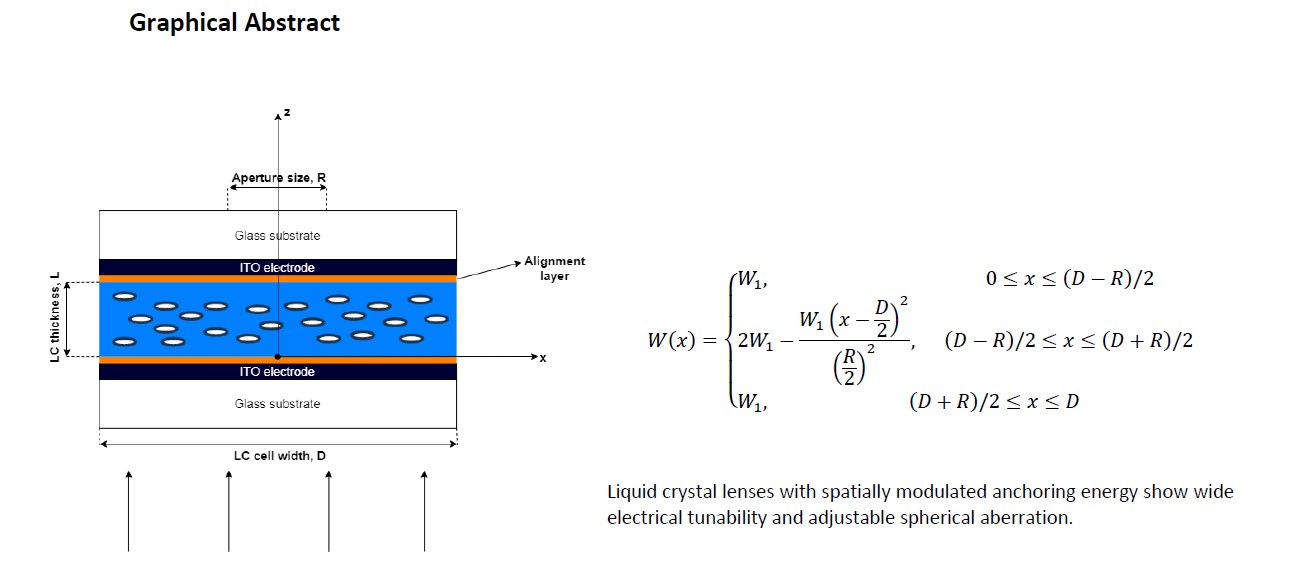
Figure 1. In this figure the OZ axis passing through the cell center and perpendicular to the plane of the cell is shown together with the lens width D and the lens aperture R.
When a proper external voltage V is applied to the cell along Z, the LC director n reorients by an amount that depends both on the value of V and on the value of the anchoring energy W(x). Being the anchoring spatially modulated, this reorientation is modulated as well, thus giving rise to a lens-like refractive index profile. The focal length of the resulting lens depends on the applied voltage and is thus electrically tunable.
We assume an anchoring energy profile
W(x) at the bottom substrate of the cell of the form:
where
D is the lens width,
R the lens aperture and
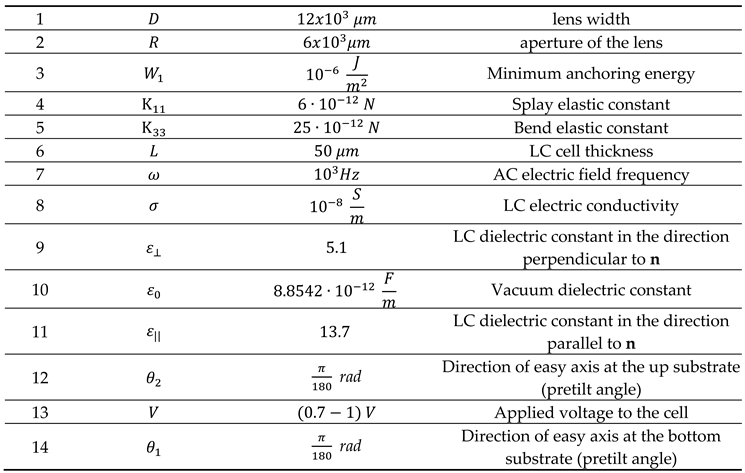
W1 the constant minimum anchoring energy (see
Table 1).
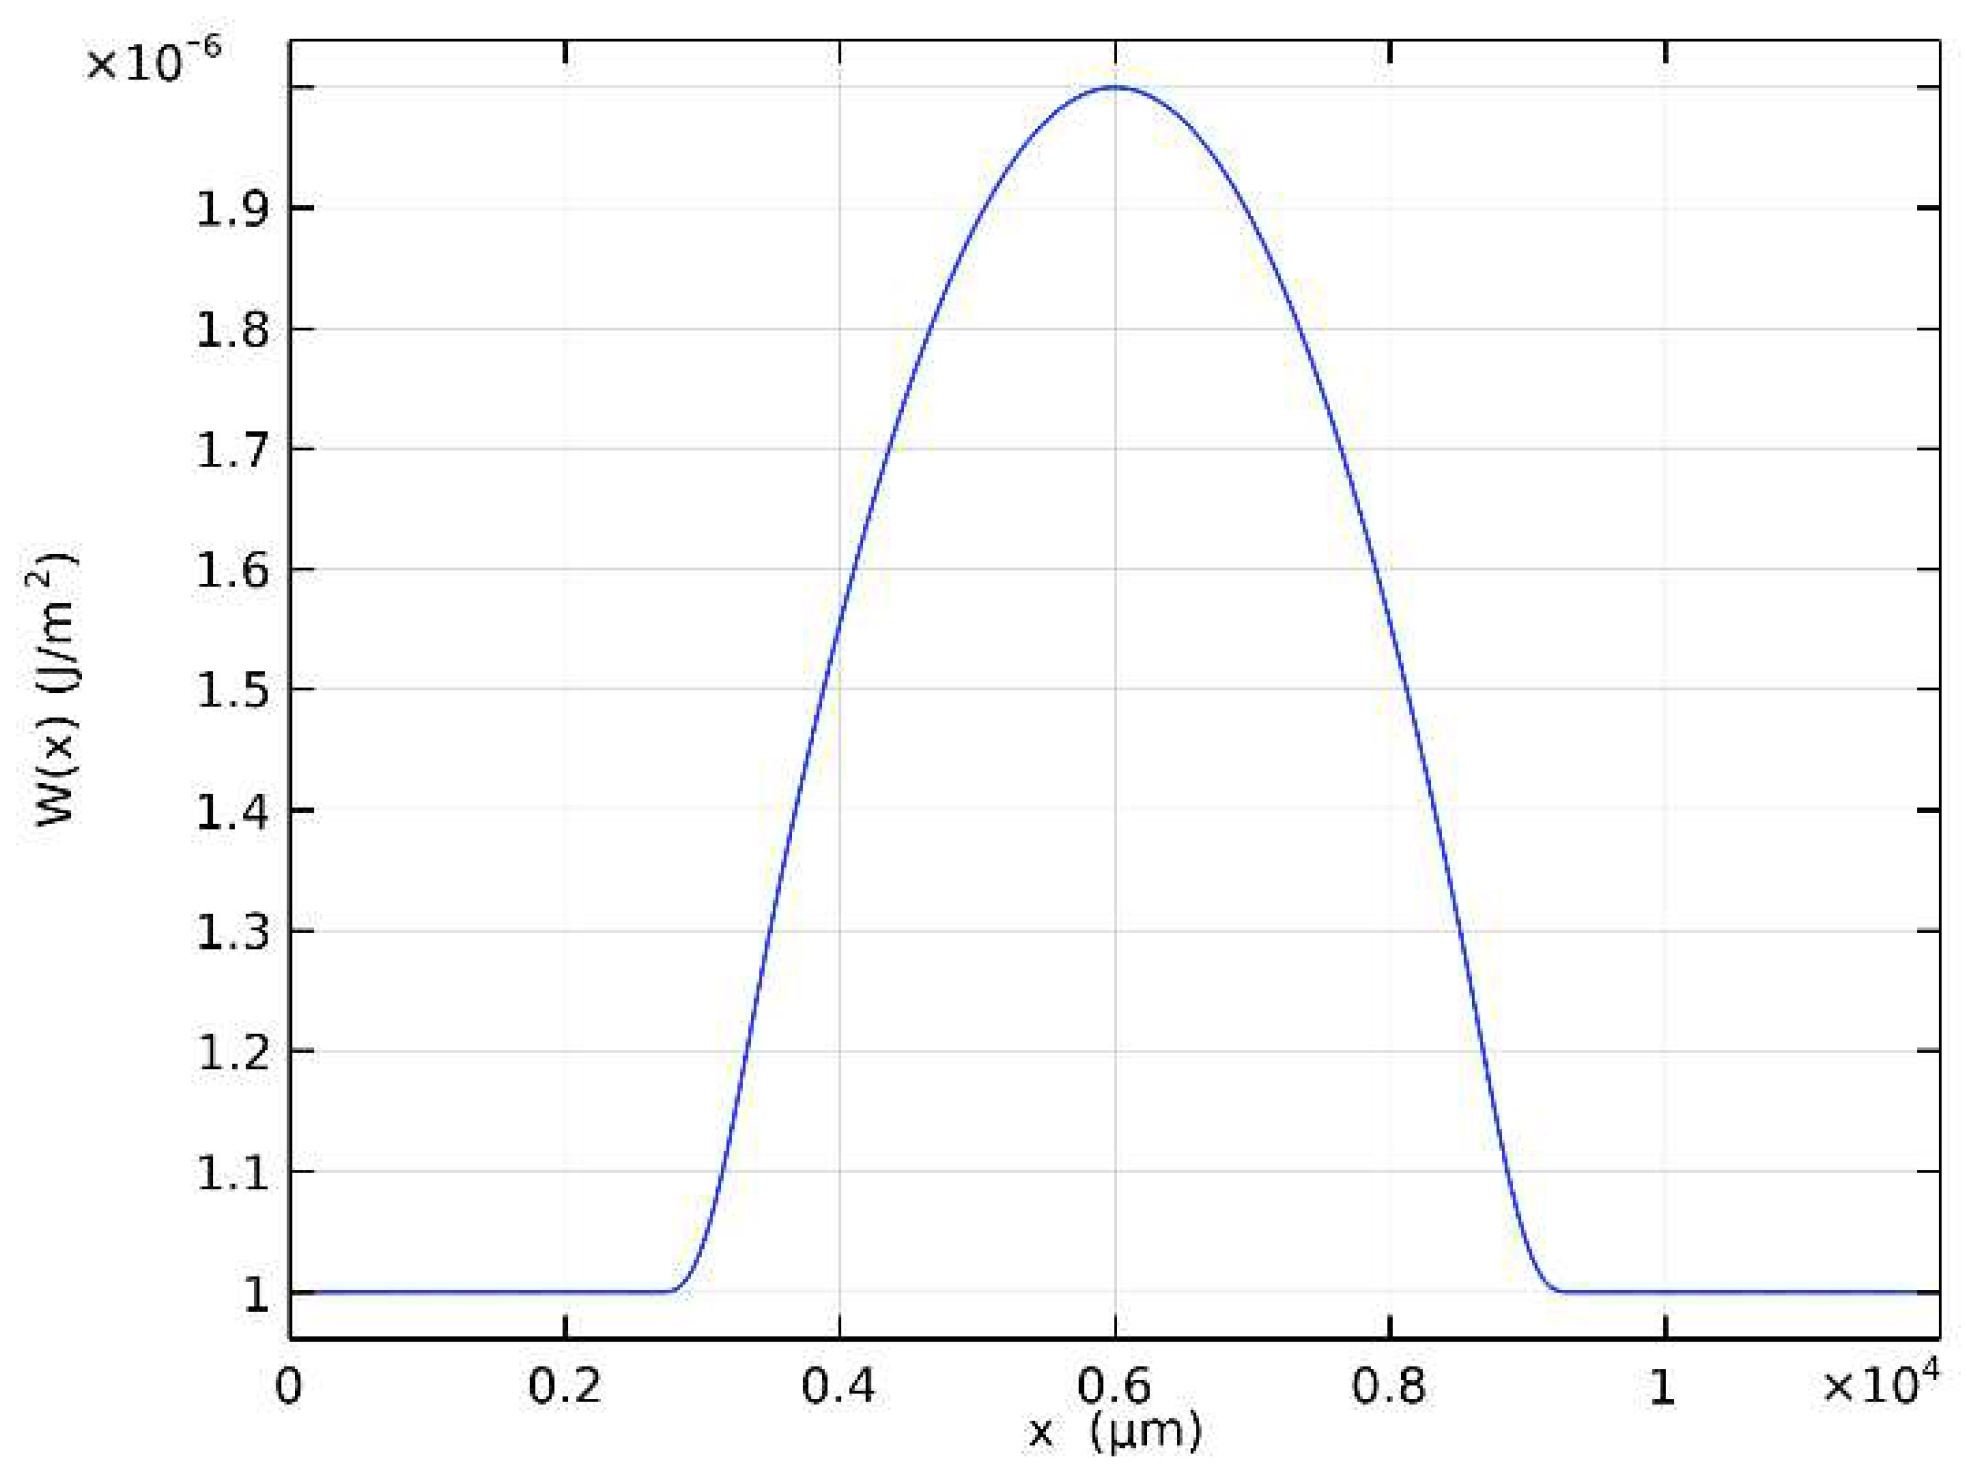
W(x) is shown in
Figure 2. The value of
W1 has been chosen based on previous investigation [
16,
17,
19].
We model a cylindrical lens, which allows simplifying the problem to the 2D case with respect to the 3D approach required for conventional spherical lenses.
2. Director Reorientation under action of externally applied voltage in the cell with modulated anchoring energy
To investigate the electro-optical properties of the proposed LC lens, one needs to find the director reorientation angle θ(x,z). Noteworthy, we suppose that the LC director reorientation induced by the externally applied voltage occurs in XZ-plane therefore this is the only angle one needs to calculate.
The director field has the form
n = (cos
θ (
x,
z),
0, sin
θ (
x,
z)) and the total free energy density
F is given by:
where:
is the elastic free energy density,
represents the dielectric coupling with the external electric field, and the surface part of the total free energy density reads [
20]:
here
kii are the LC elastic constants,
D is the electric displacement vector,
E is the externally applied electric field,
d is the easy axis direction and
Wi (i=1,2) is the anchoring energy at LC cell bounding substrates.
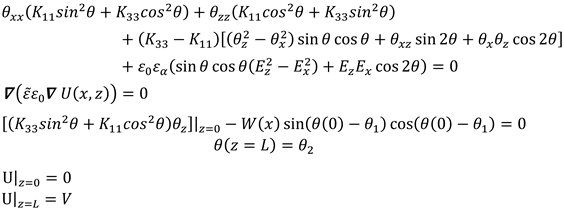
Substituting equations (3)–(5) in eq. (2) and minimizing
F, one obtains the following Euler-Lagrange equation for
θ(
x,
z) :
where
is the LC dielectric anisotropy, i.e. the difference between the dielectric constants in the directions parallel and perpendicular to
n.
Considering finite director anchoring at the bottom substrate and strong anchoring at the top substrate, the boundary conditions take the form:
Equations (6) and (7) should be accompanied by the Poisson equation for the electric field potential U, defined by the relation
E = −
∇U [
18]
where
being
the permittivity tensor,
ω the AC electric field frequency,
σ the LC electric conductivity and
the LC dielectric tensor. In our case this latter has the form:
The electric field potential U(
x,
z) obeys the following boundary conditions:
where
V is voltage applied to the cell at
z =
L.
In this way, one gets the following system of equations for the director field
θ(
x,
z) and for the electric field potential U(
x,
z) with boundary conditions:
The system of equations (11) has no analytical solution. To solve it, it is necessary to use computer calculations. The parameters we used for calculations are reported in
Table 1. The values selected for the splay, K
11, and bend, K
33 elastic constants are of the order of those typical of the most common thermotropic LCs [
18,
21].
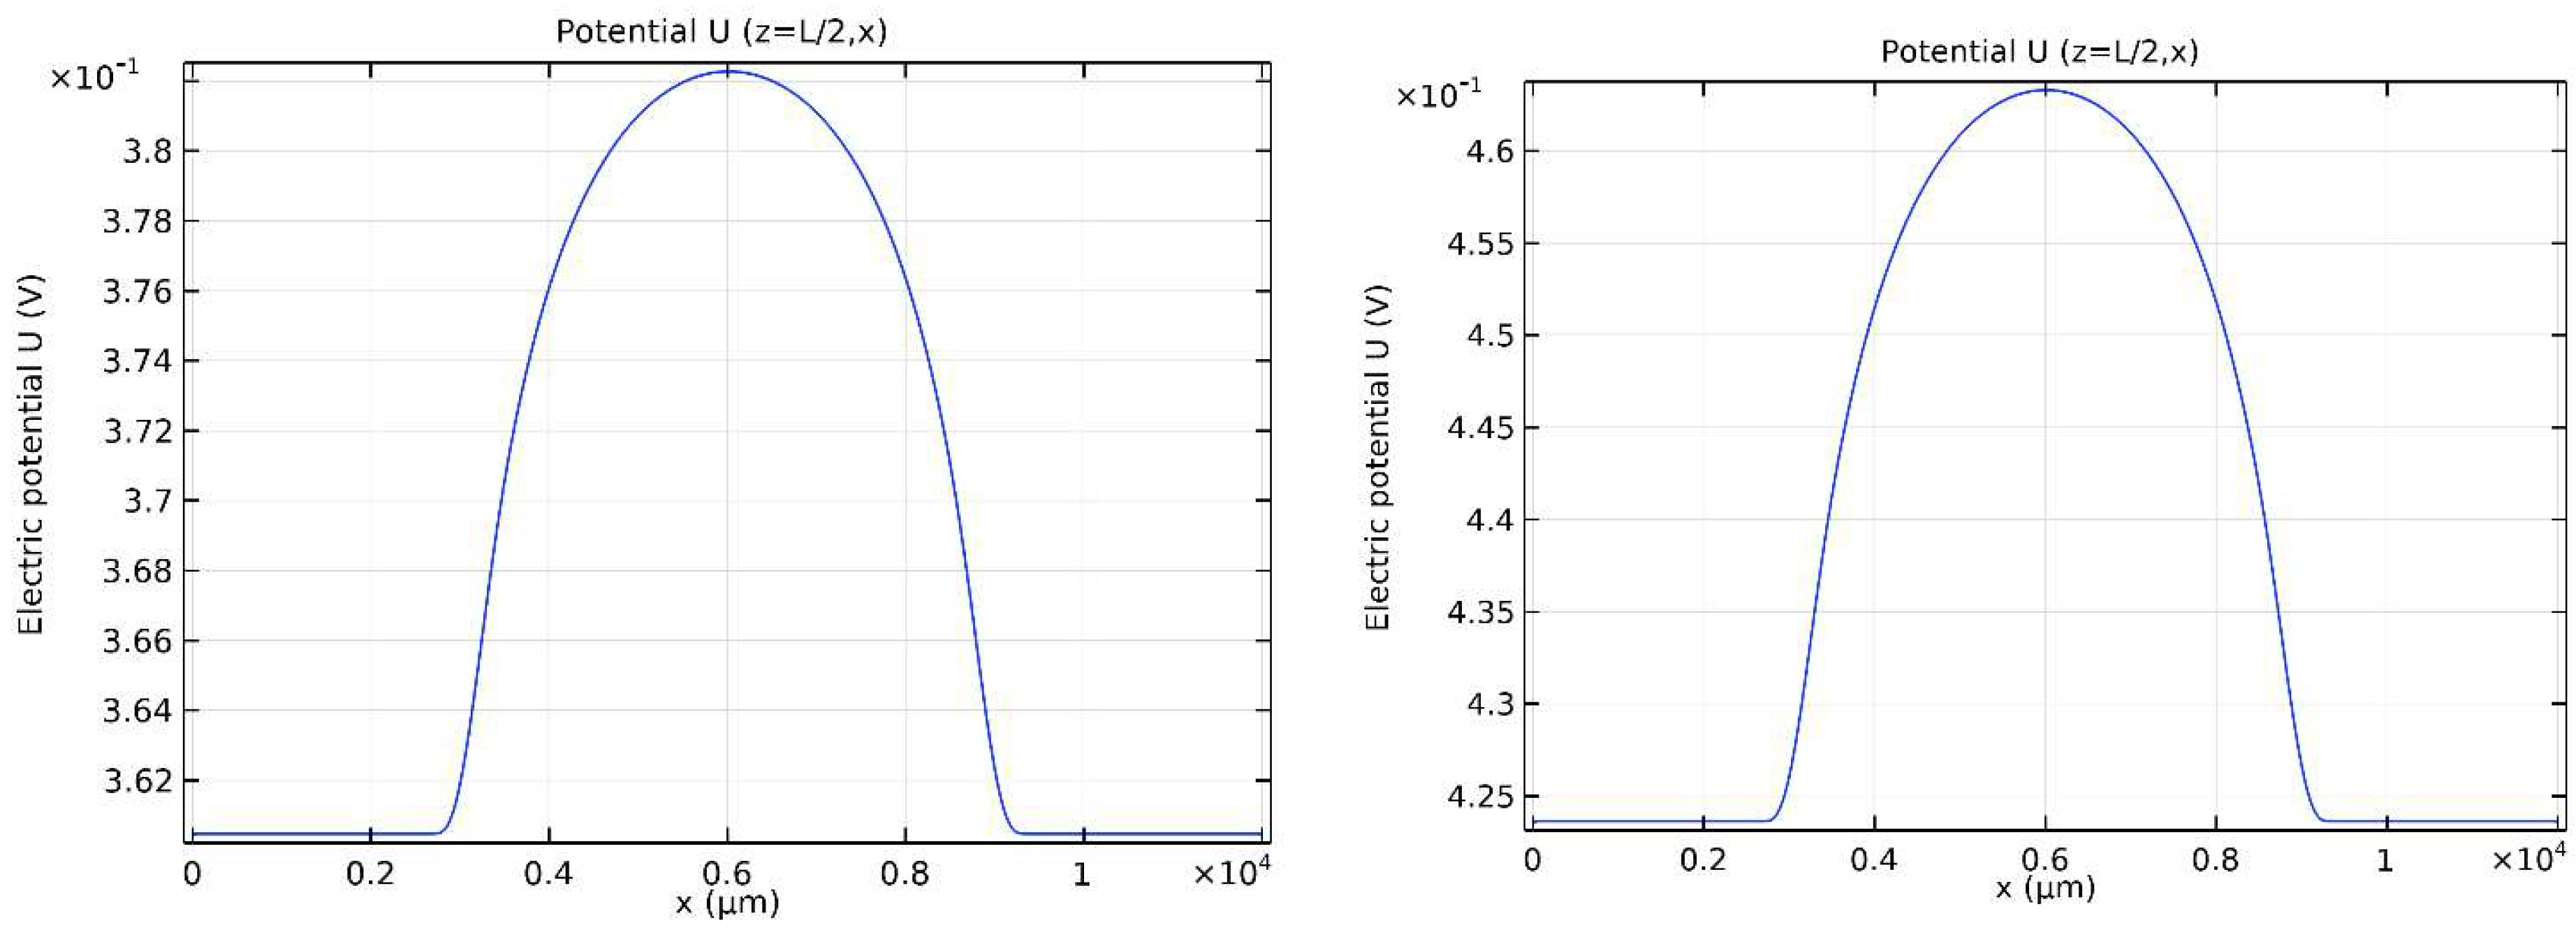
The electric field potentials calculated for
V = 1
V and
V = 0.8
V at the middle of the cell z = L/2, as a function of x, are reported in Figure 3a and 3b, respectively.
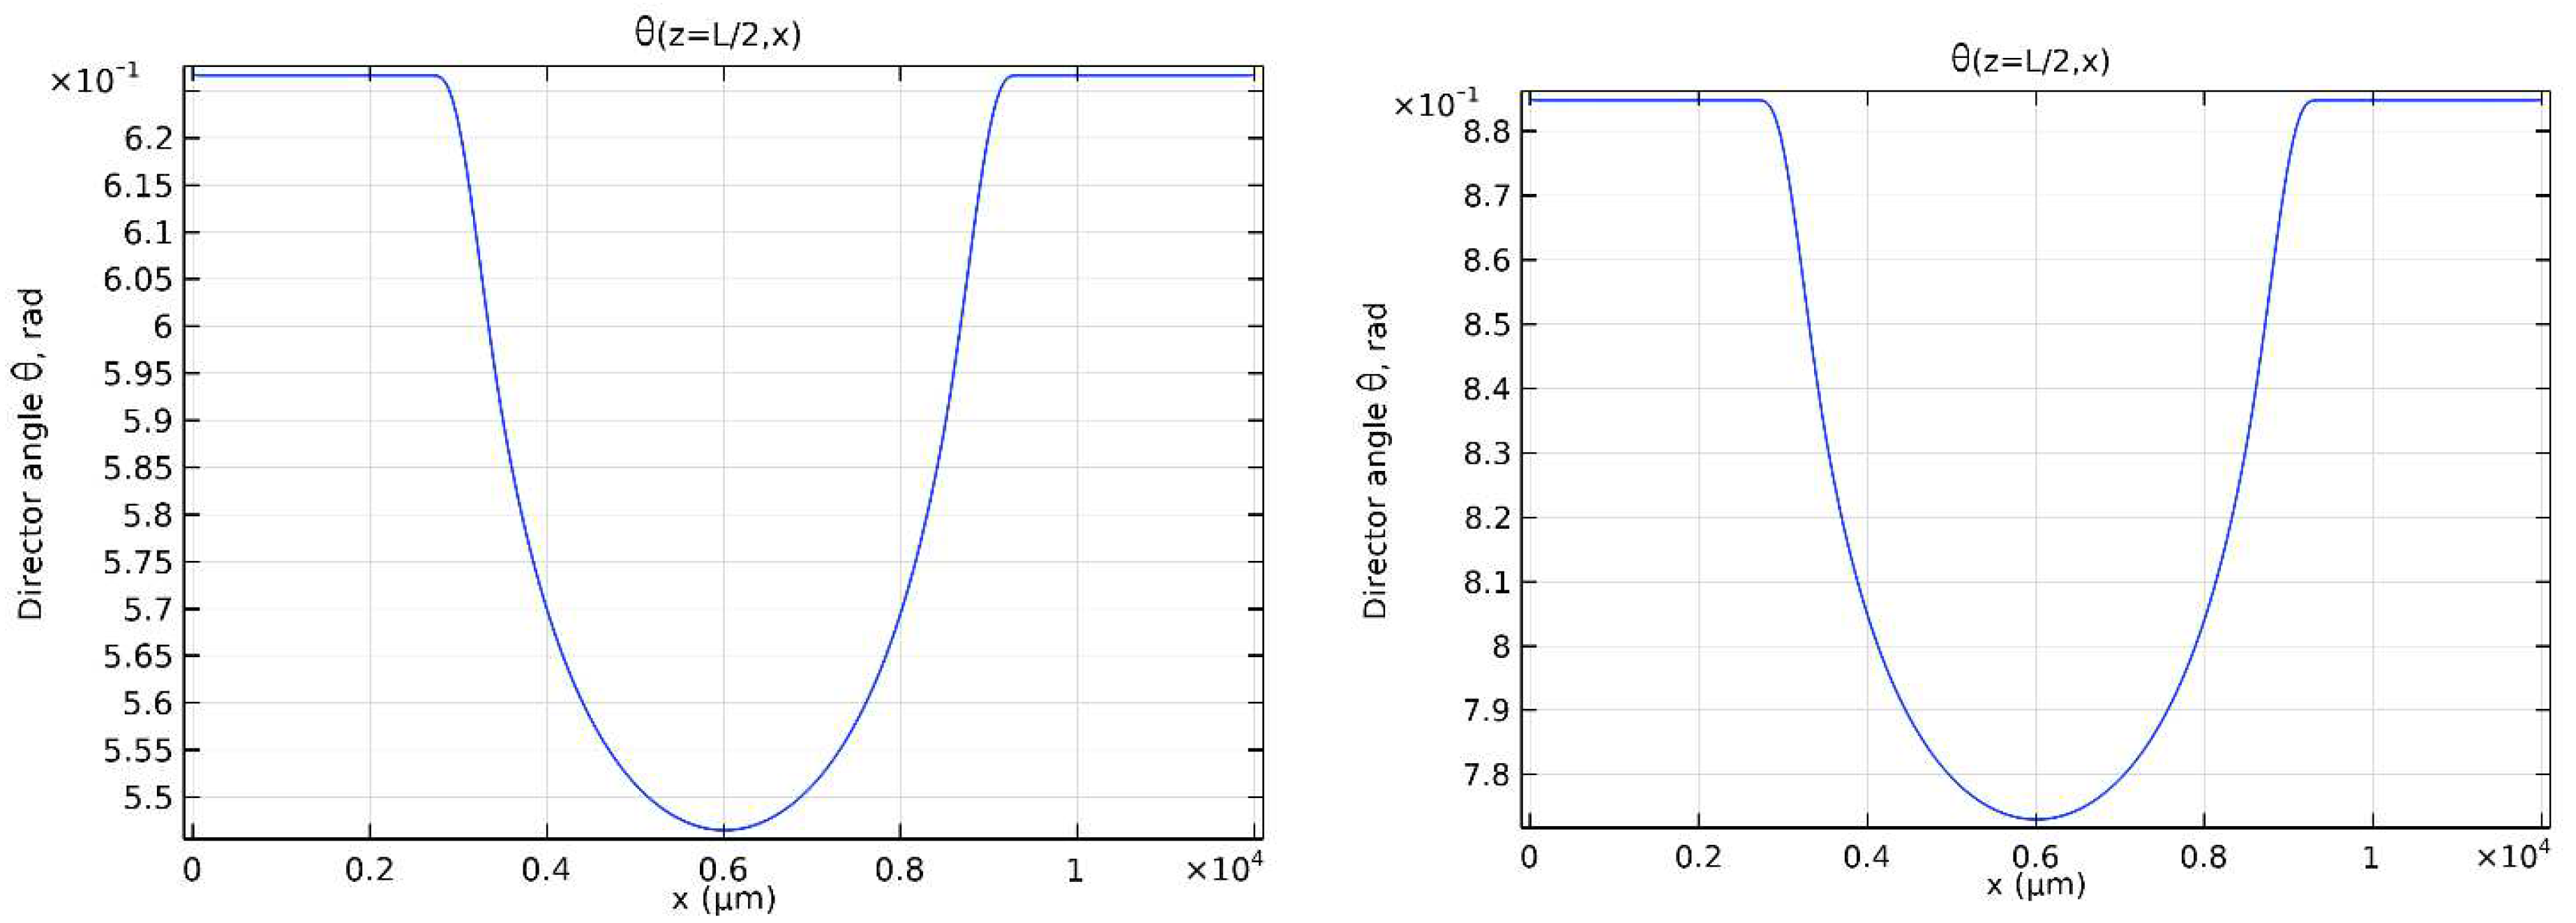
Figure 4 shows the LC director profile vs x for the same values of V at z = L/2. As expected, it follows the profile of the electric field potential.
Figure 2.
Spatial profile of anchoring energy W(x) at the bottom substrate.
Figure 2.
Spatial profile of anchoring energy W(x) at the bottom substrate.
Figure 3.
Electric potential U versus x at z = L/2 for V = 0.8 V (a) and V = 1 V (b).
Figure 3.
Electric potential U versus x at z = L/2 for V = 0.8 V (a) and V = 1 V (b).
Figure 4.
LC director profile at z = L/2 as a function of the distance x from the center of the cell for V = 0.8 V (a) and v = 1 V (b).
Figure 4.
LC director profile at z = L/2 as a function of the distance x from the center of the cell for V = 0.8 V (a) and v = 1 V (b).
3. Light propagation through LC cell subject to externally applied voltage
In the previous section, we have calculated the spatial profile of the LC director subject to an externally applied voltage. The refractive index for an extraordinary beam propagating in the LC cell is given by the relation:
where
ψ is the angle between the LC director (which defines the optical axis) and the light wave vector. In our case
.
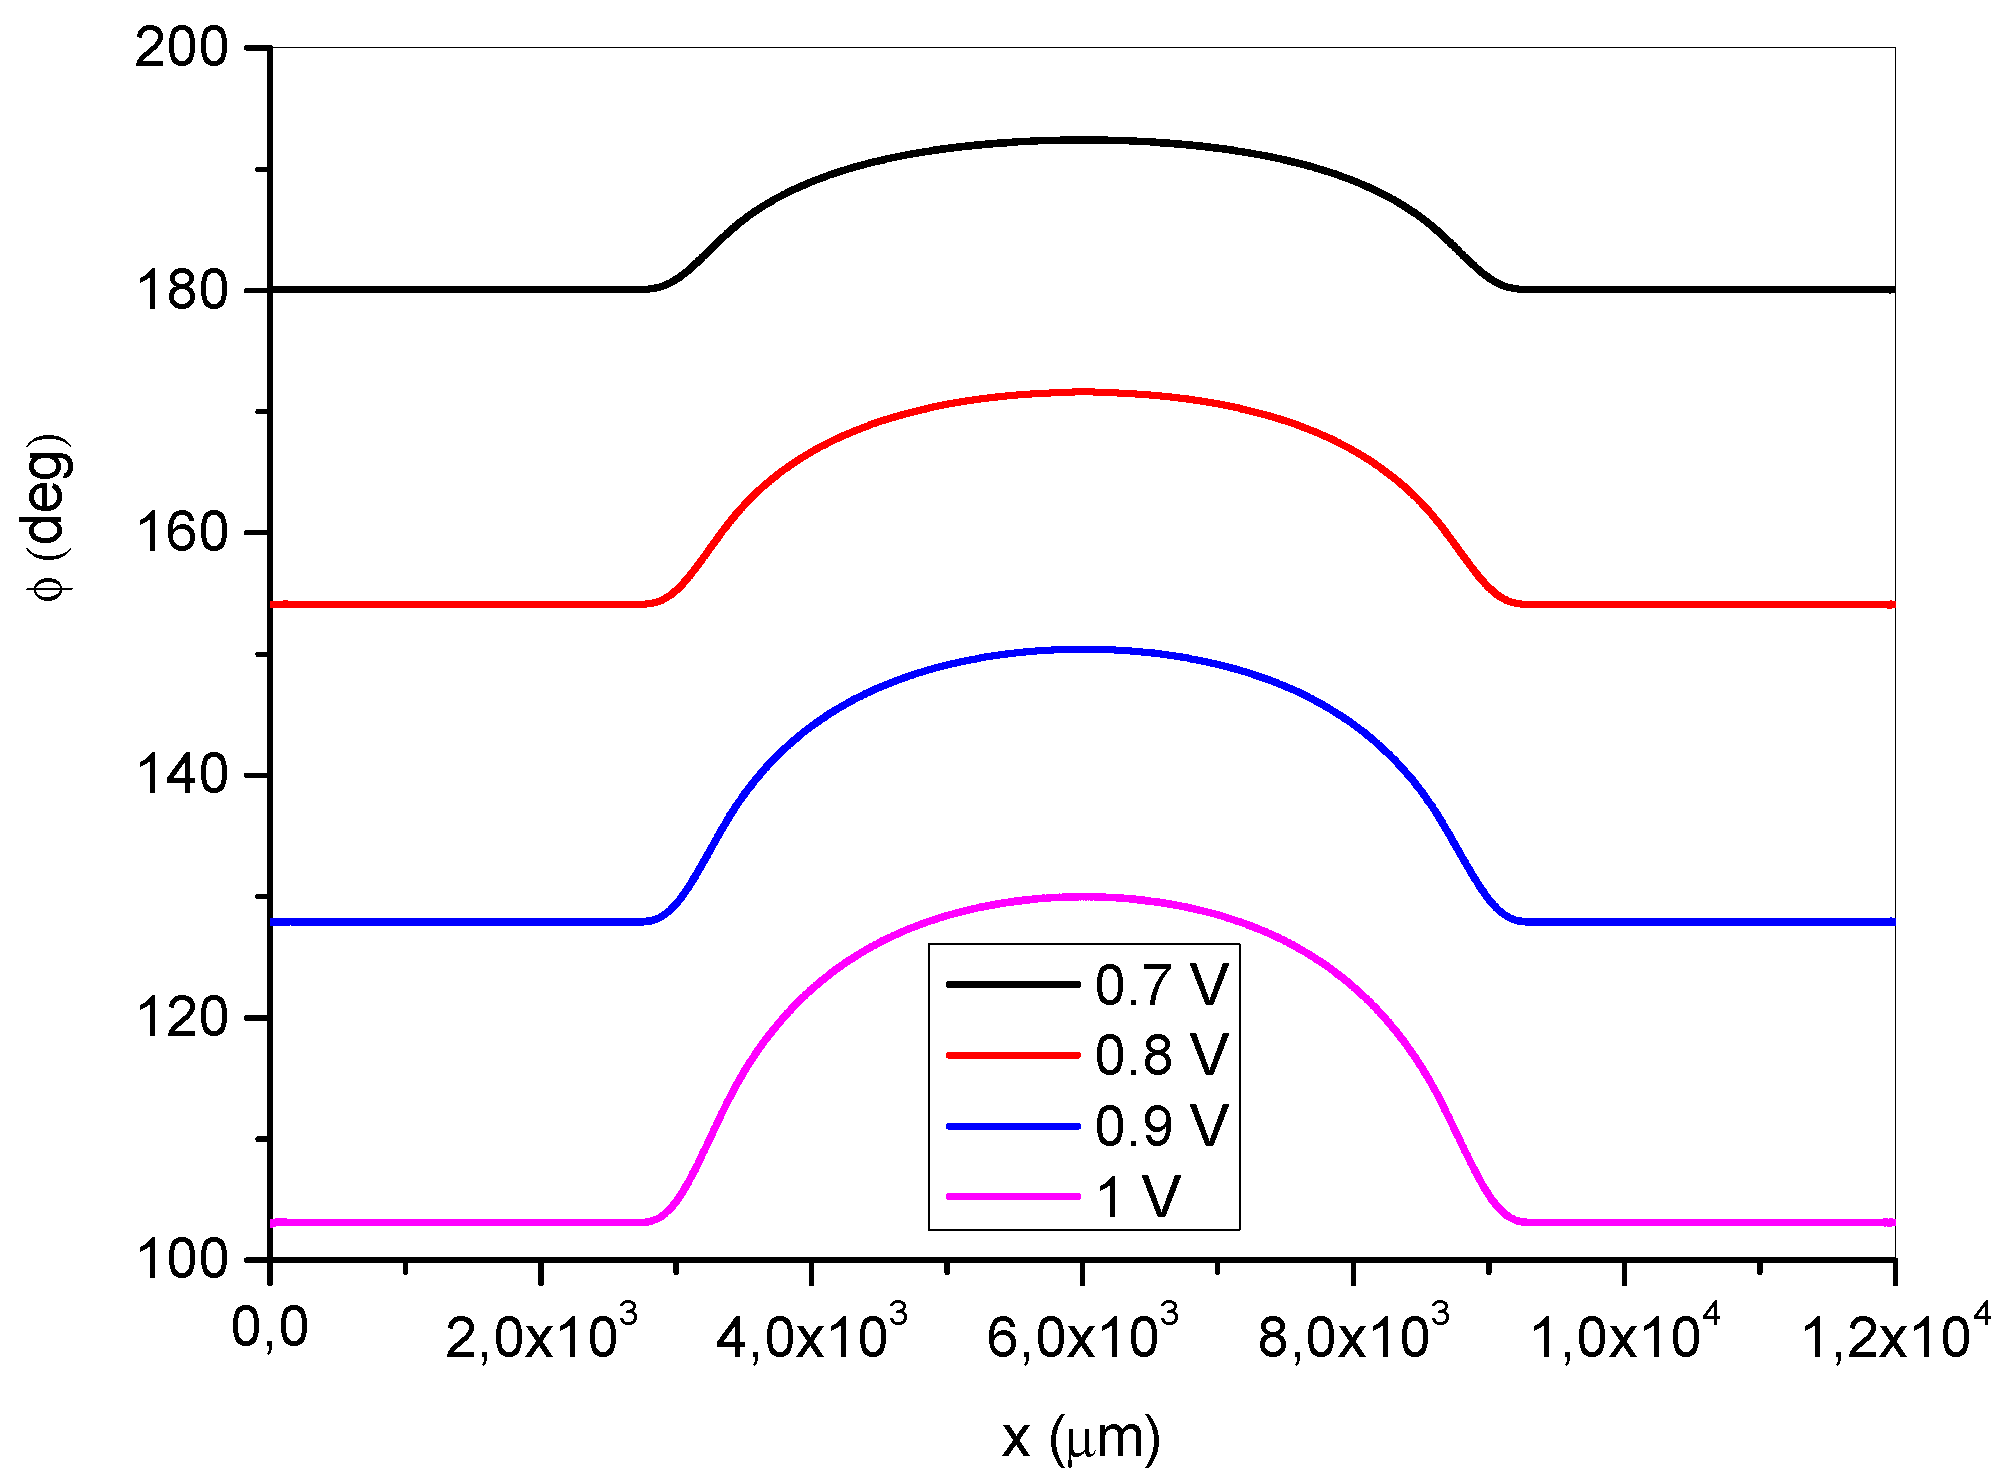
We treat the LC cell with a lens-like director distribution as a thin phase plate. The phase retardation ϕ experienced by a test light beam propagating through the cell is defined as
and depends on the distance x from the center of the cell. This is shown in
Figure 5 for different values of the applied voltage V. This dependence determines the focusing properties of the LC lens.
To evaluate the focal length of the LC lens, we fit the curves ϕ = ϕ(x) in
Figure 5 to a parabola according to the paraxial approximation [
22,
23] using the equation:
being
a = ϕ(0) the phase shift at the center of the LC cell,
f the focal length of the LC lens and
k the modulus of the test beam wave vector.
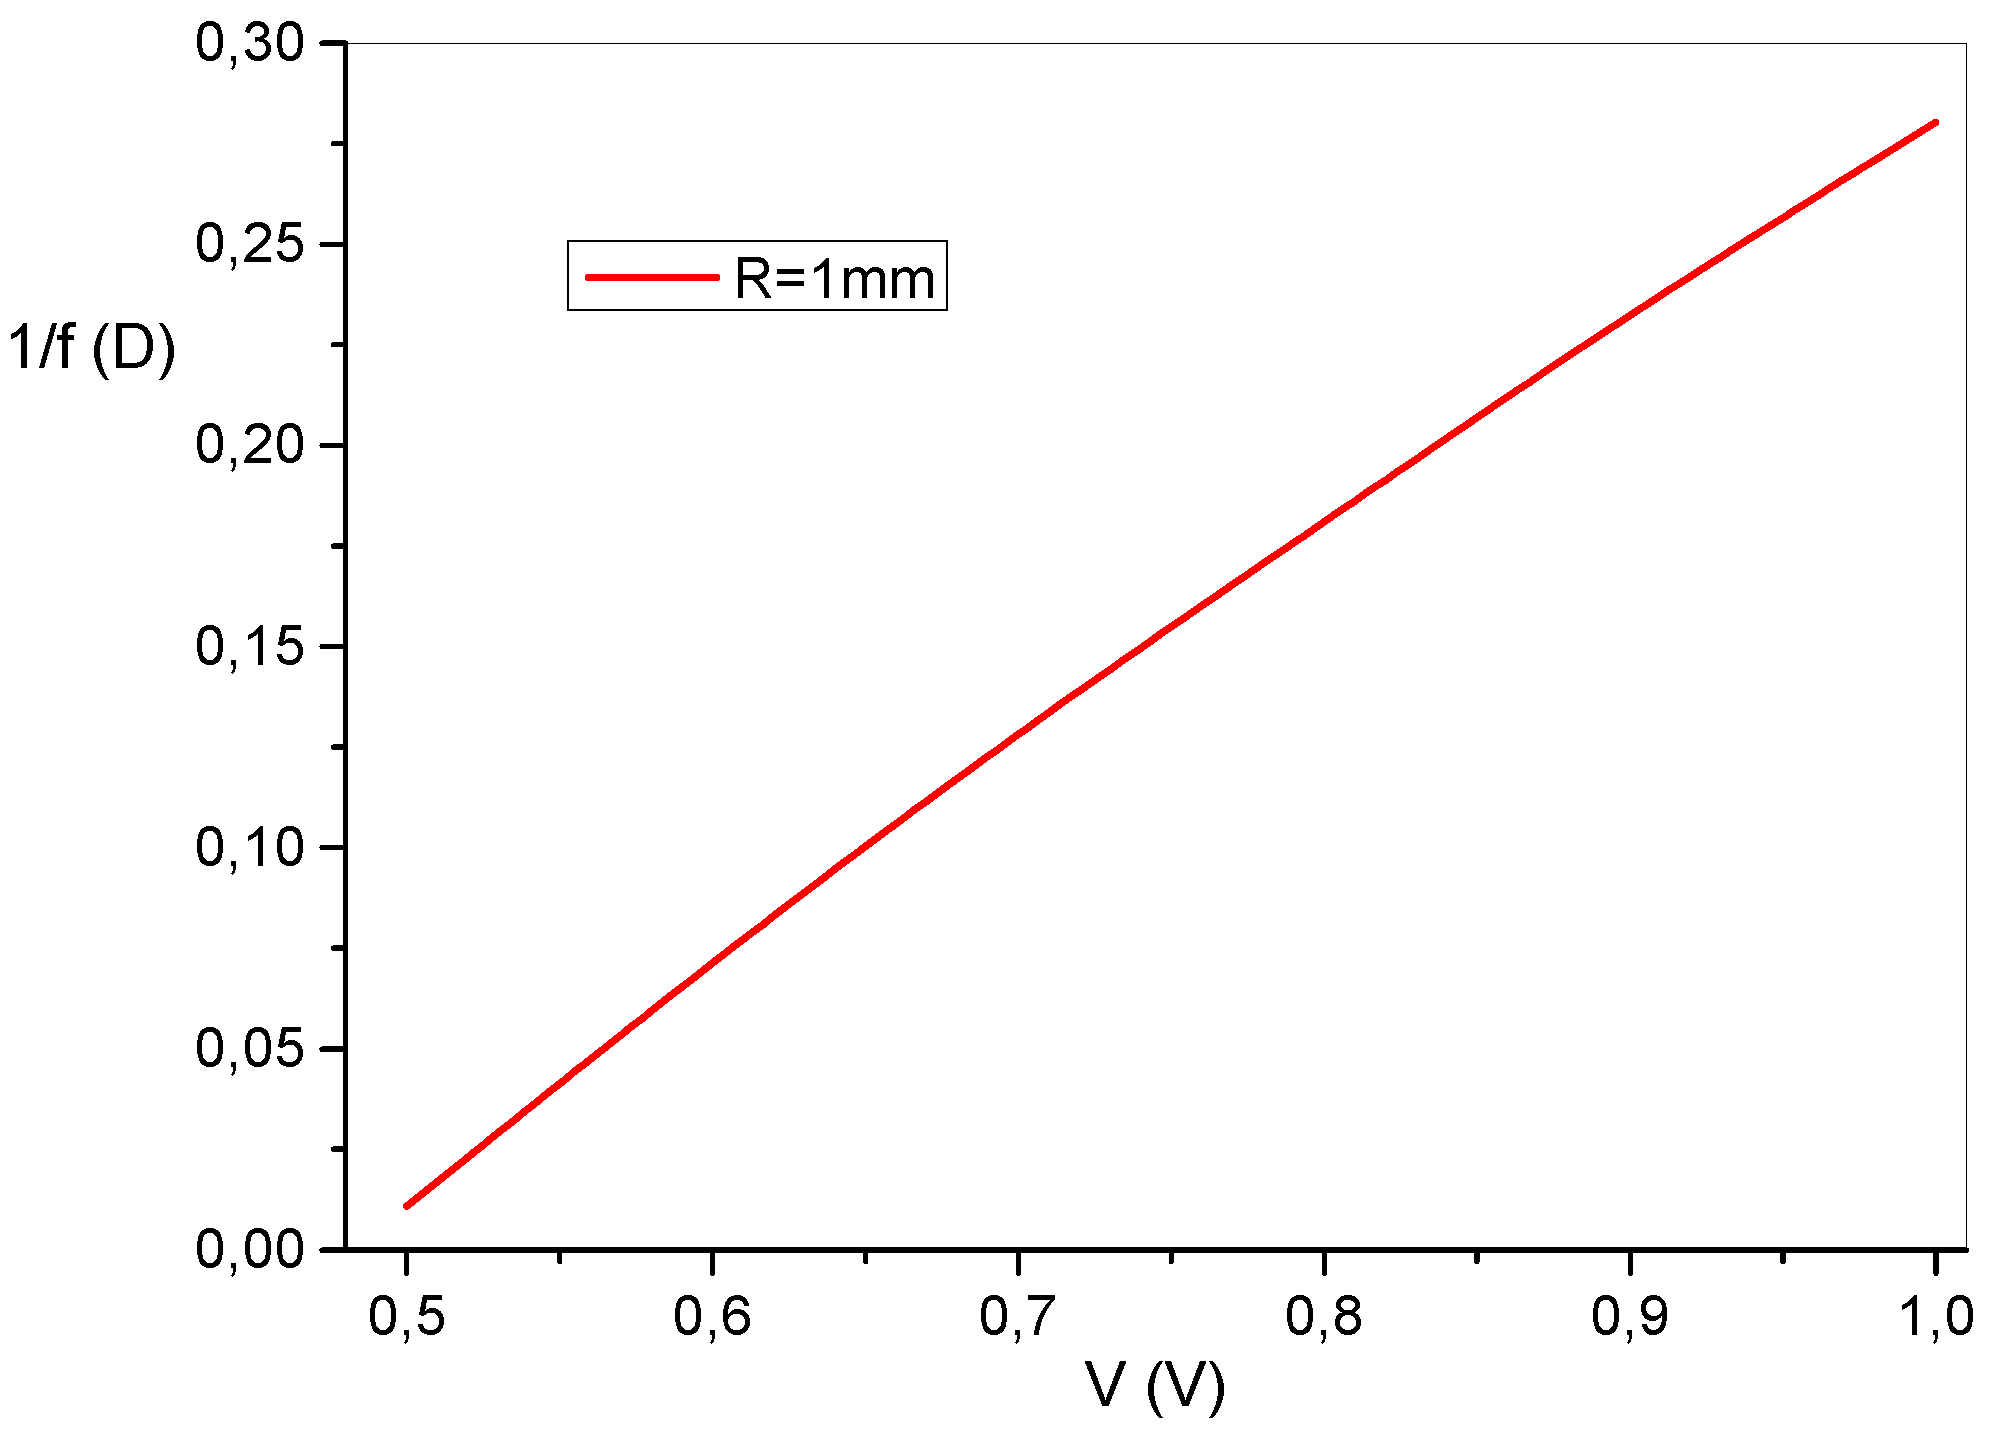
The inverse of the obtained focal length is shown in
Figure 6 as a function of the applied voltage
V for a lens aperture R = 1mm. The electrical tunability of the lens focus is well represented by this curve.
4. Aberration of LC Lens with modulated anchoring energy
Optical lenses, and LC lenses do not make exception, are not ideal optical systems. Indeed, there is always some degree of aberration introduced by the lens, which causes the image to be an imperfect replica of the object. Aberration thus plays an important role in the formation of images and among them spherical aberration is the most common when dealing with monochromatic light.
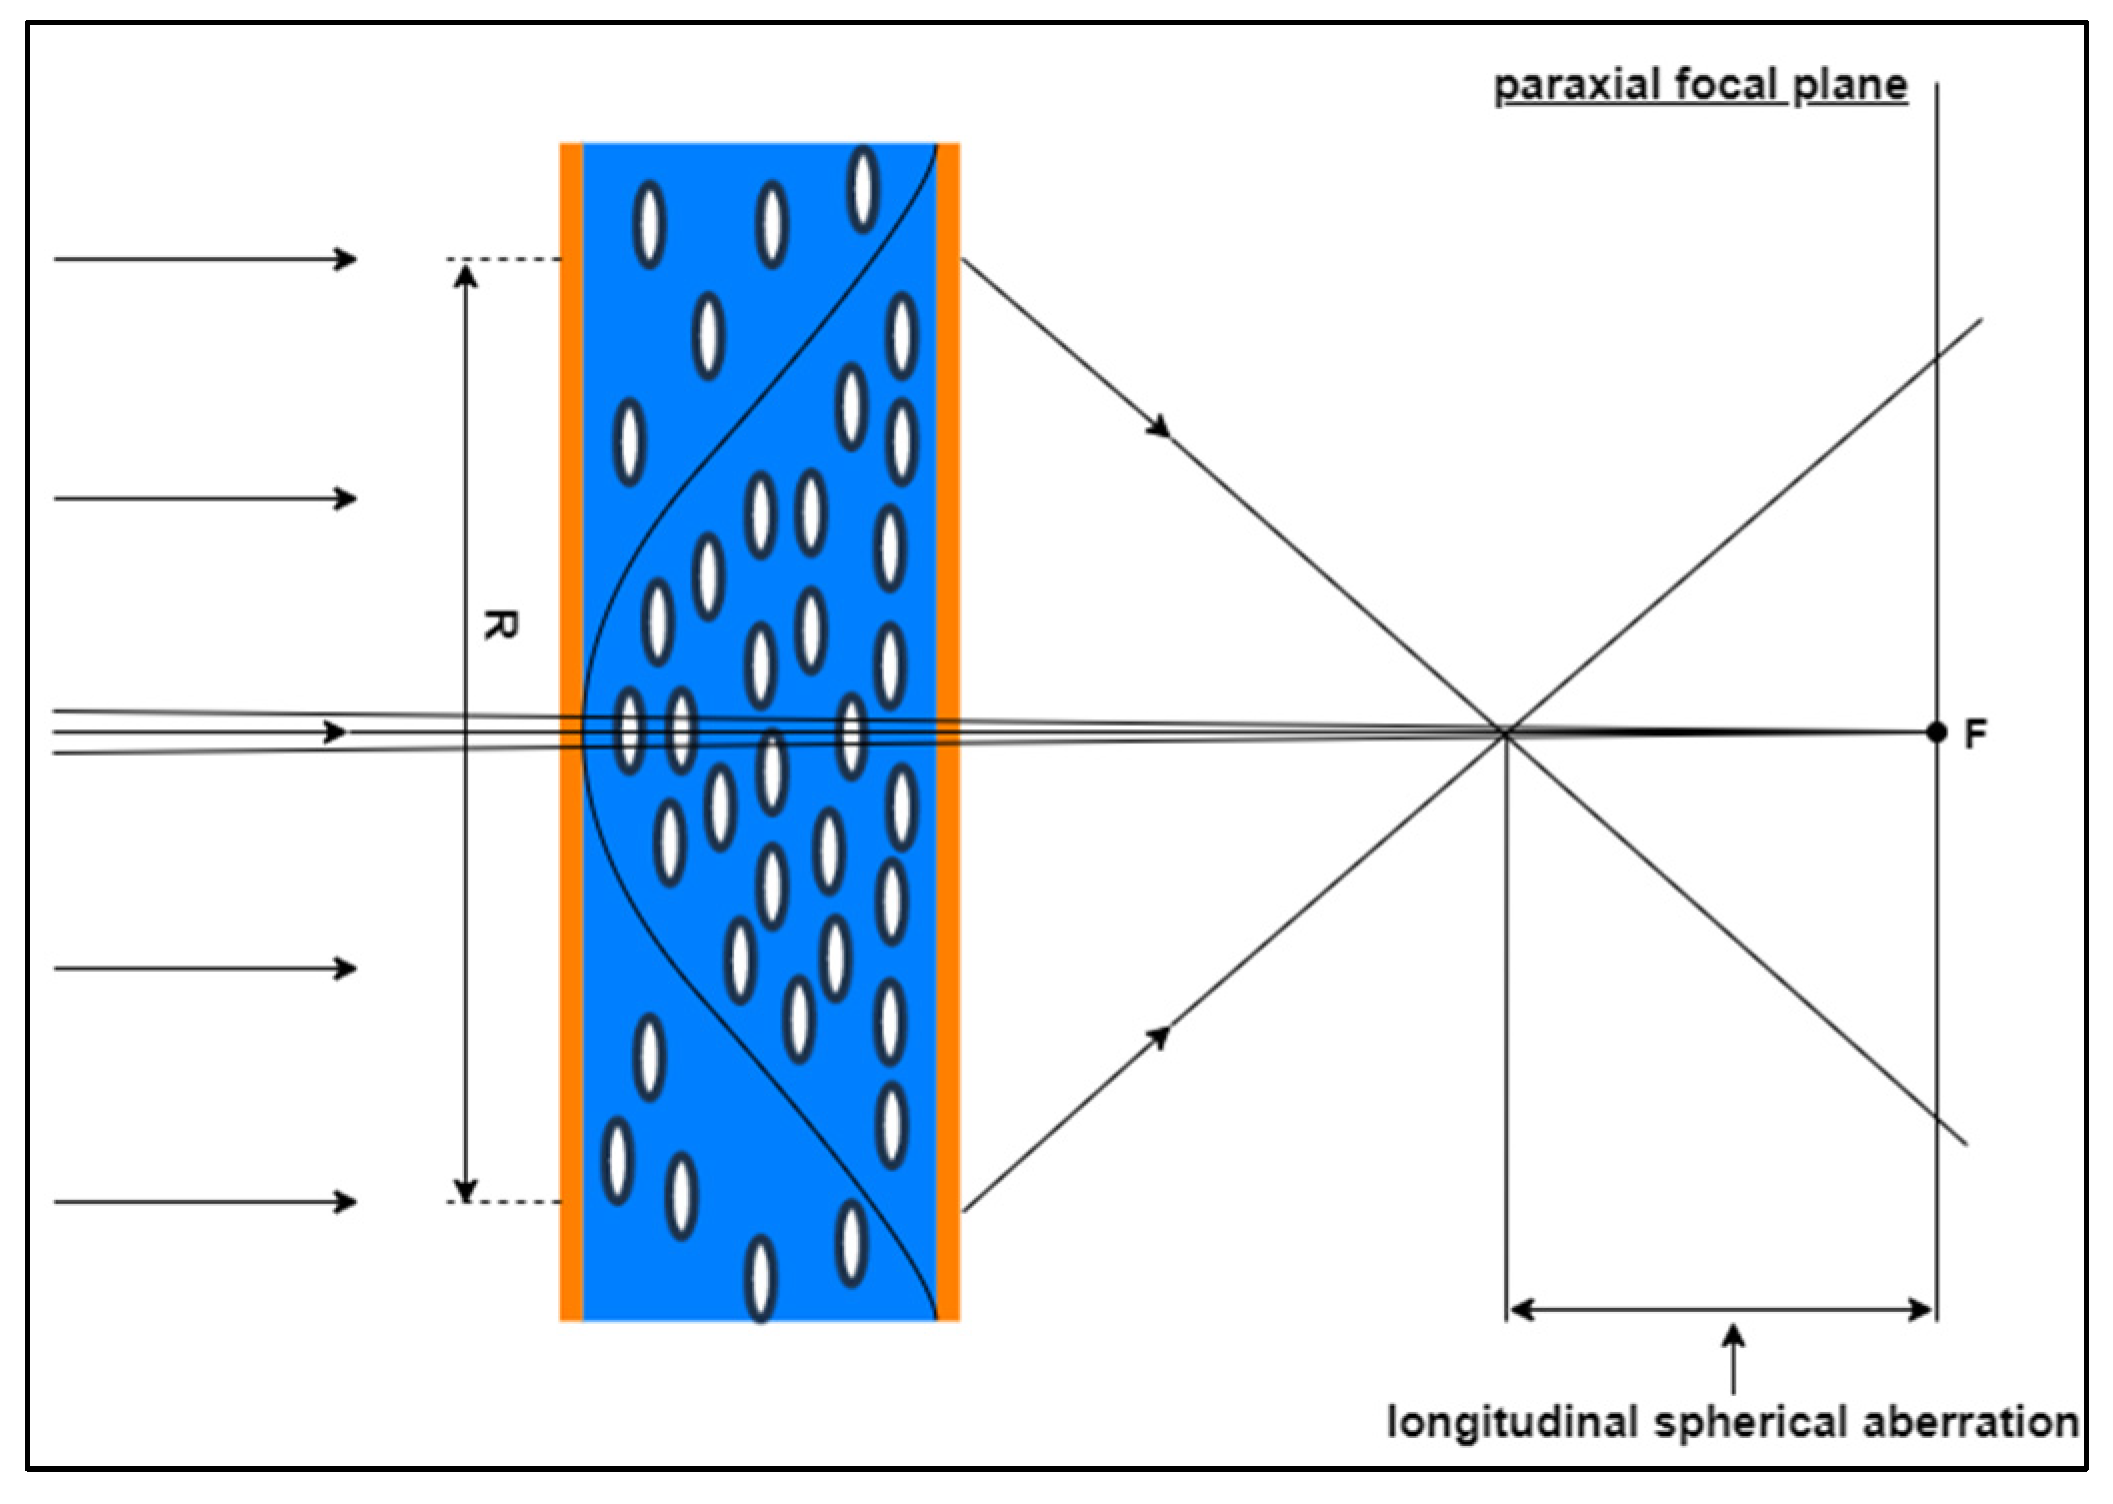
Figure 7 shows the definition of spherical aberration. A spherically aberrated lens has no well-defined focus. The distance along the optical axis between the intercept of the rays that are nearly on the optical axis (paraxial rays) and the rays that go through the edge of the lens (marginal rays) is called longitudinal spherical aberration (LSA) [
24].
Theoretically, to obtain the LSA in a LC lens it is necessary to find the beam trajectory in an inhomogeneous liquid crystal cell [
25,
26]. Here we propose a simpler and quicker approach.
In the previous section, to find the focal length of the LC lens we used the paraxial approximation, that holds for a beam that is as close as possible to the optical axis of the lens [
22], as well as for an ideal spherical wavefront. However, as the aperture of the lens R increases, this approximation is less and less fulfilled.
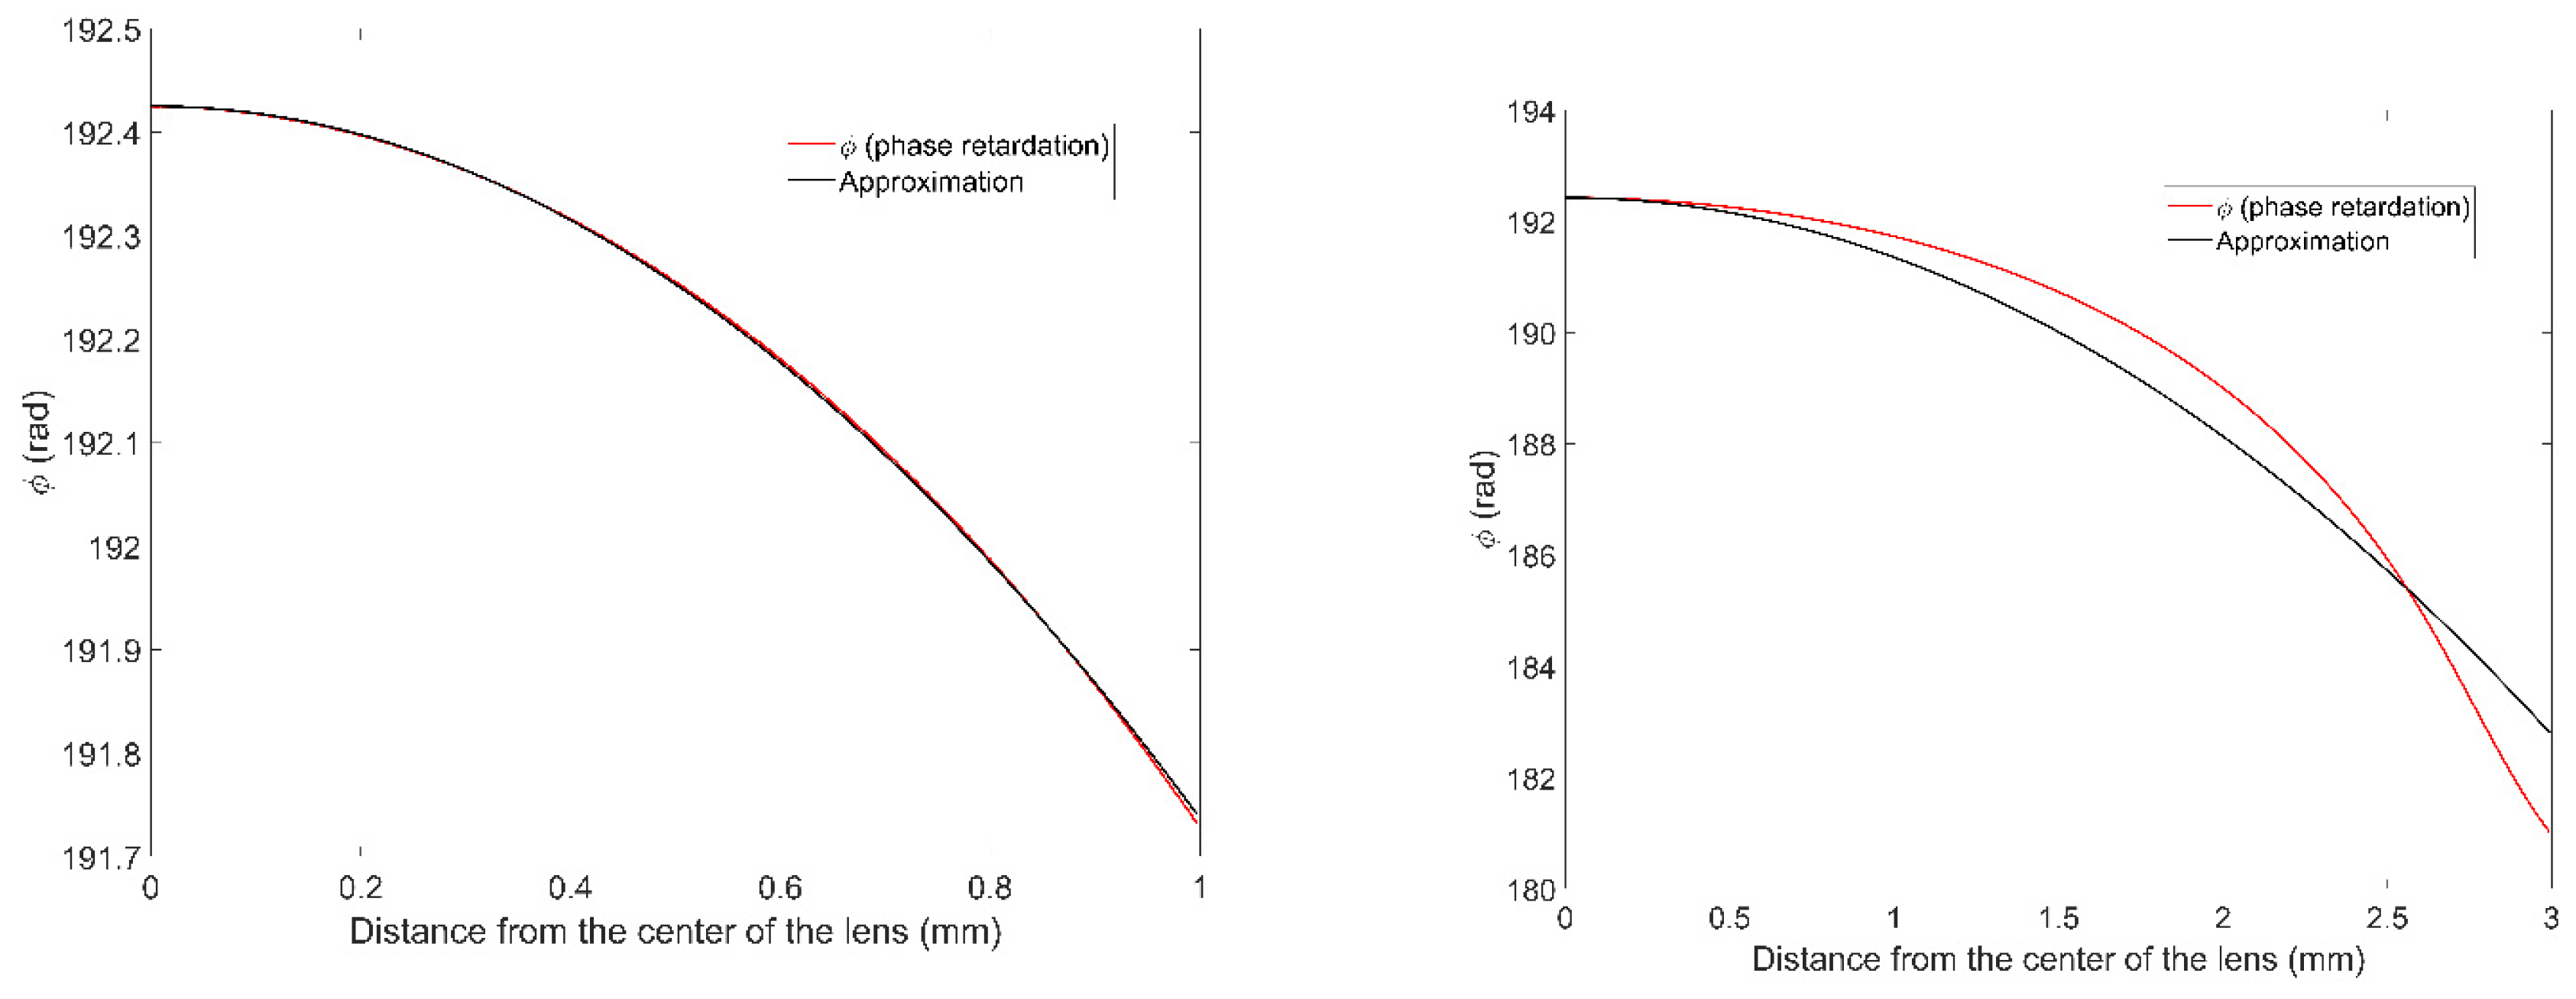
In
Figure 8 one can see the phase retardation (eq. 13) compared to the one modeled using the paraxial approximation (eq. 14) for different lens apertures R = 1 mm (a) and R = 3 mm (b), for an applied voltage
V = 0.7 V. As R increases from 1 to 3 mm, the quality of the approximation worsens, which indicates that we have an imperfect lens and aberrations must be estimated.
To estimate the LSA, we found where the beam come from the edge of the lens aperture. To this aim we used the paraxial approximation (14) to describe the beam wavefront near the lens aperture point. Mathematically, this means that we have approximated a part of the wavefront near the lens aperture and found the approximation coefficients. Next, we found a point on the axis of this parabola, where the rays from the edge of the aperture converge. Using mathematical formulas, we projected it onto the axis of the lens. Thus, we got the point where the rays will come from the edge of the lens (lens aperture).
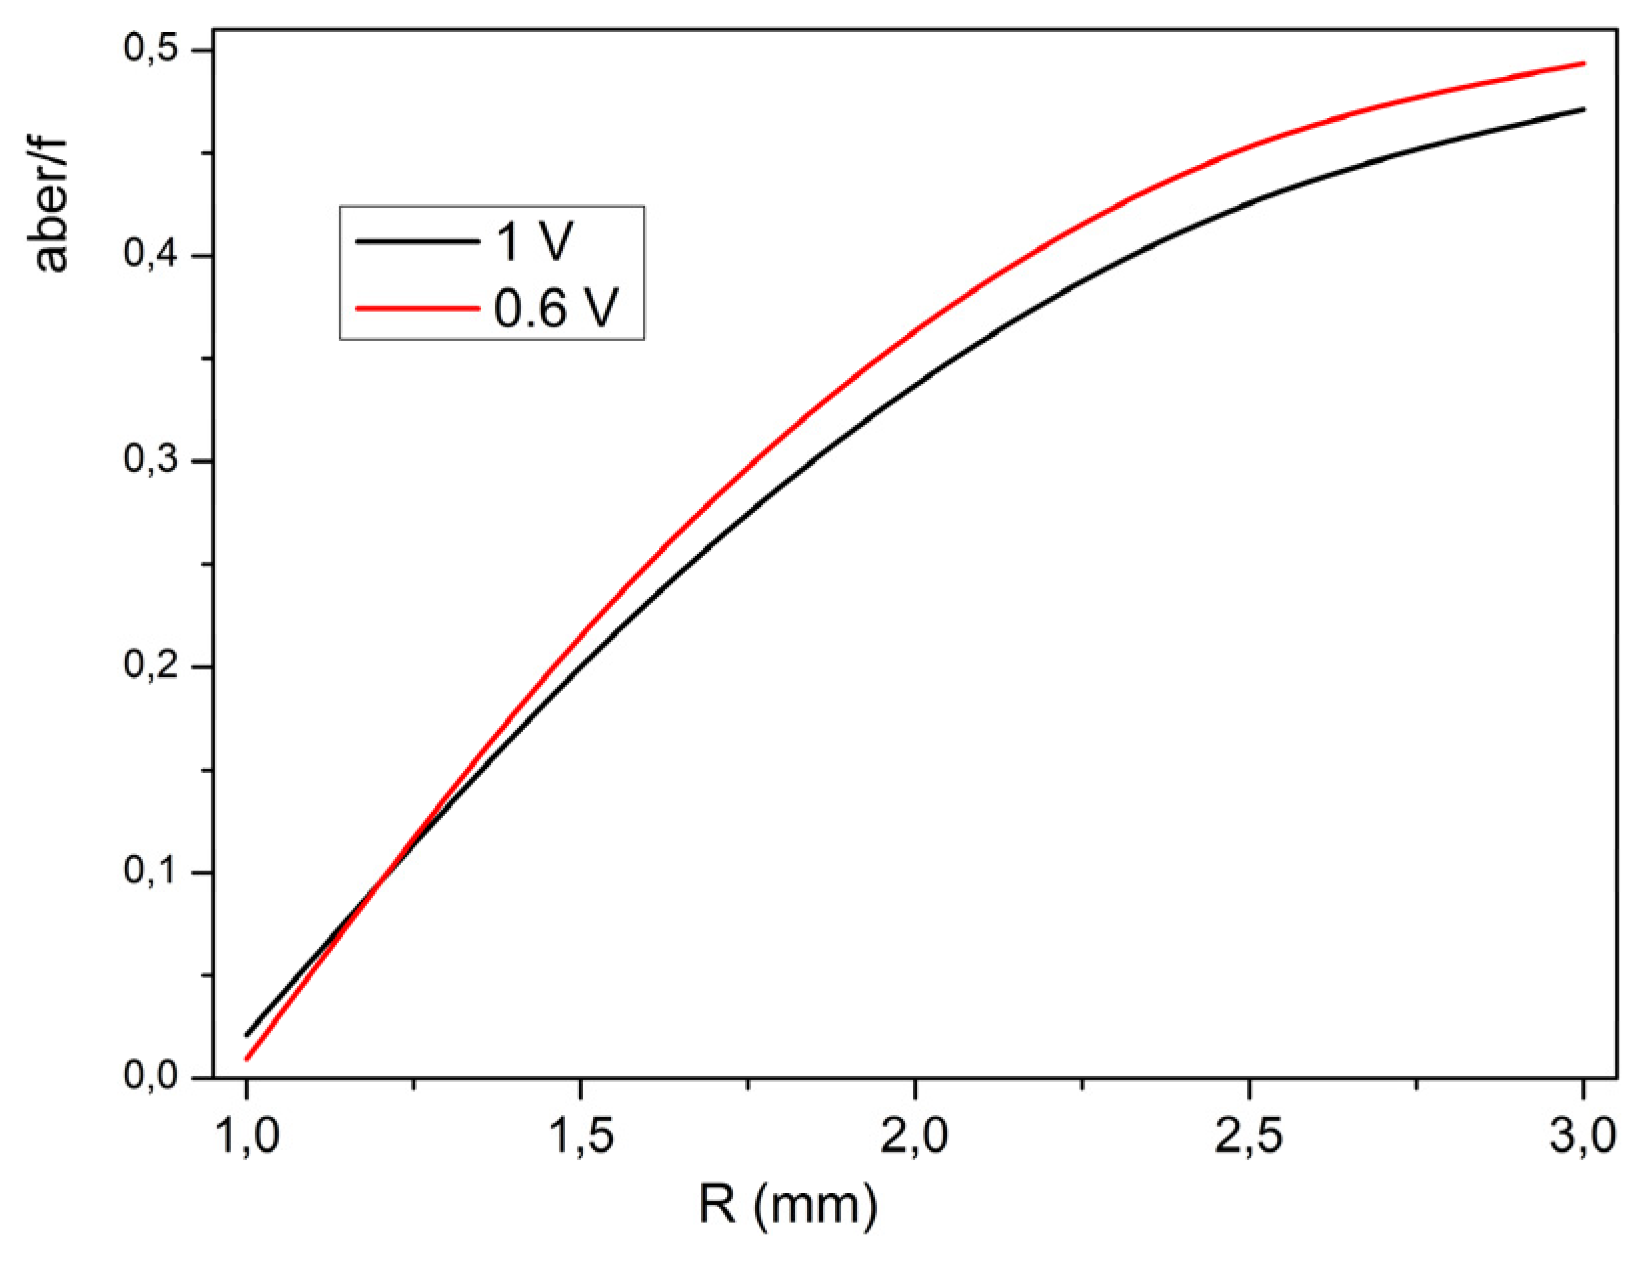
Figure 9 shows the relative longitudinal spherical aberration, defined as the ratio between the LSA and the focal length, versus the lens aperture R, for
V = 0.8 V (black line) and
V = 1 V (red line).
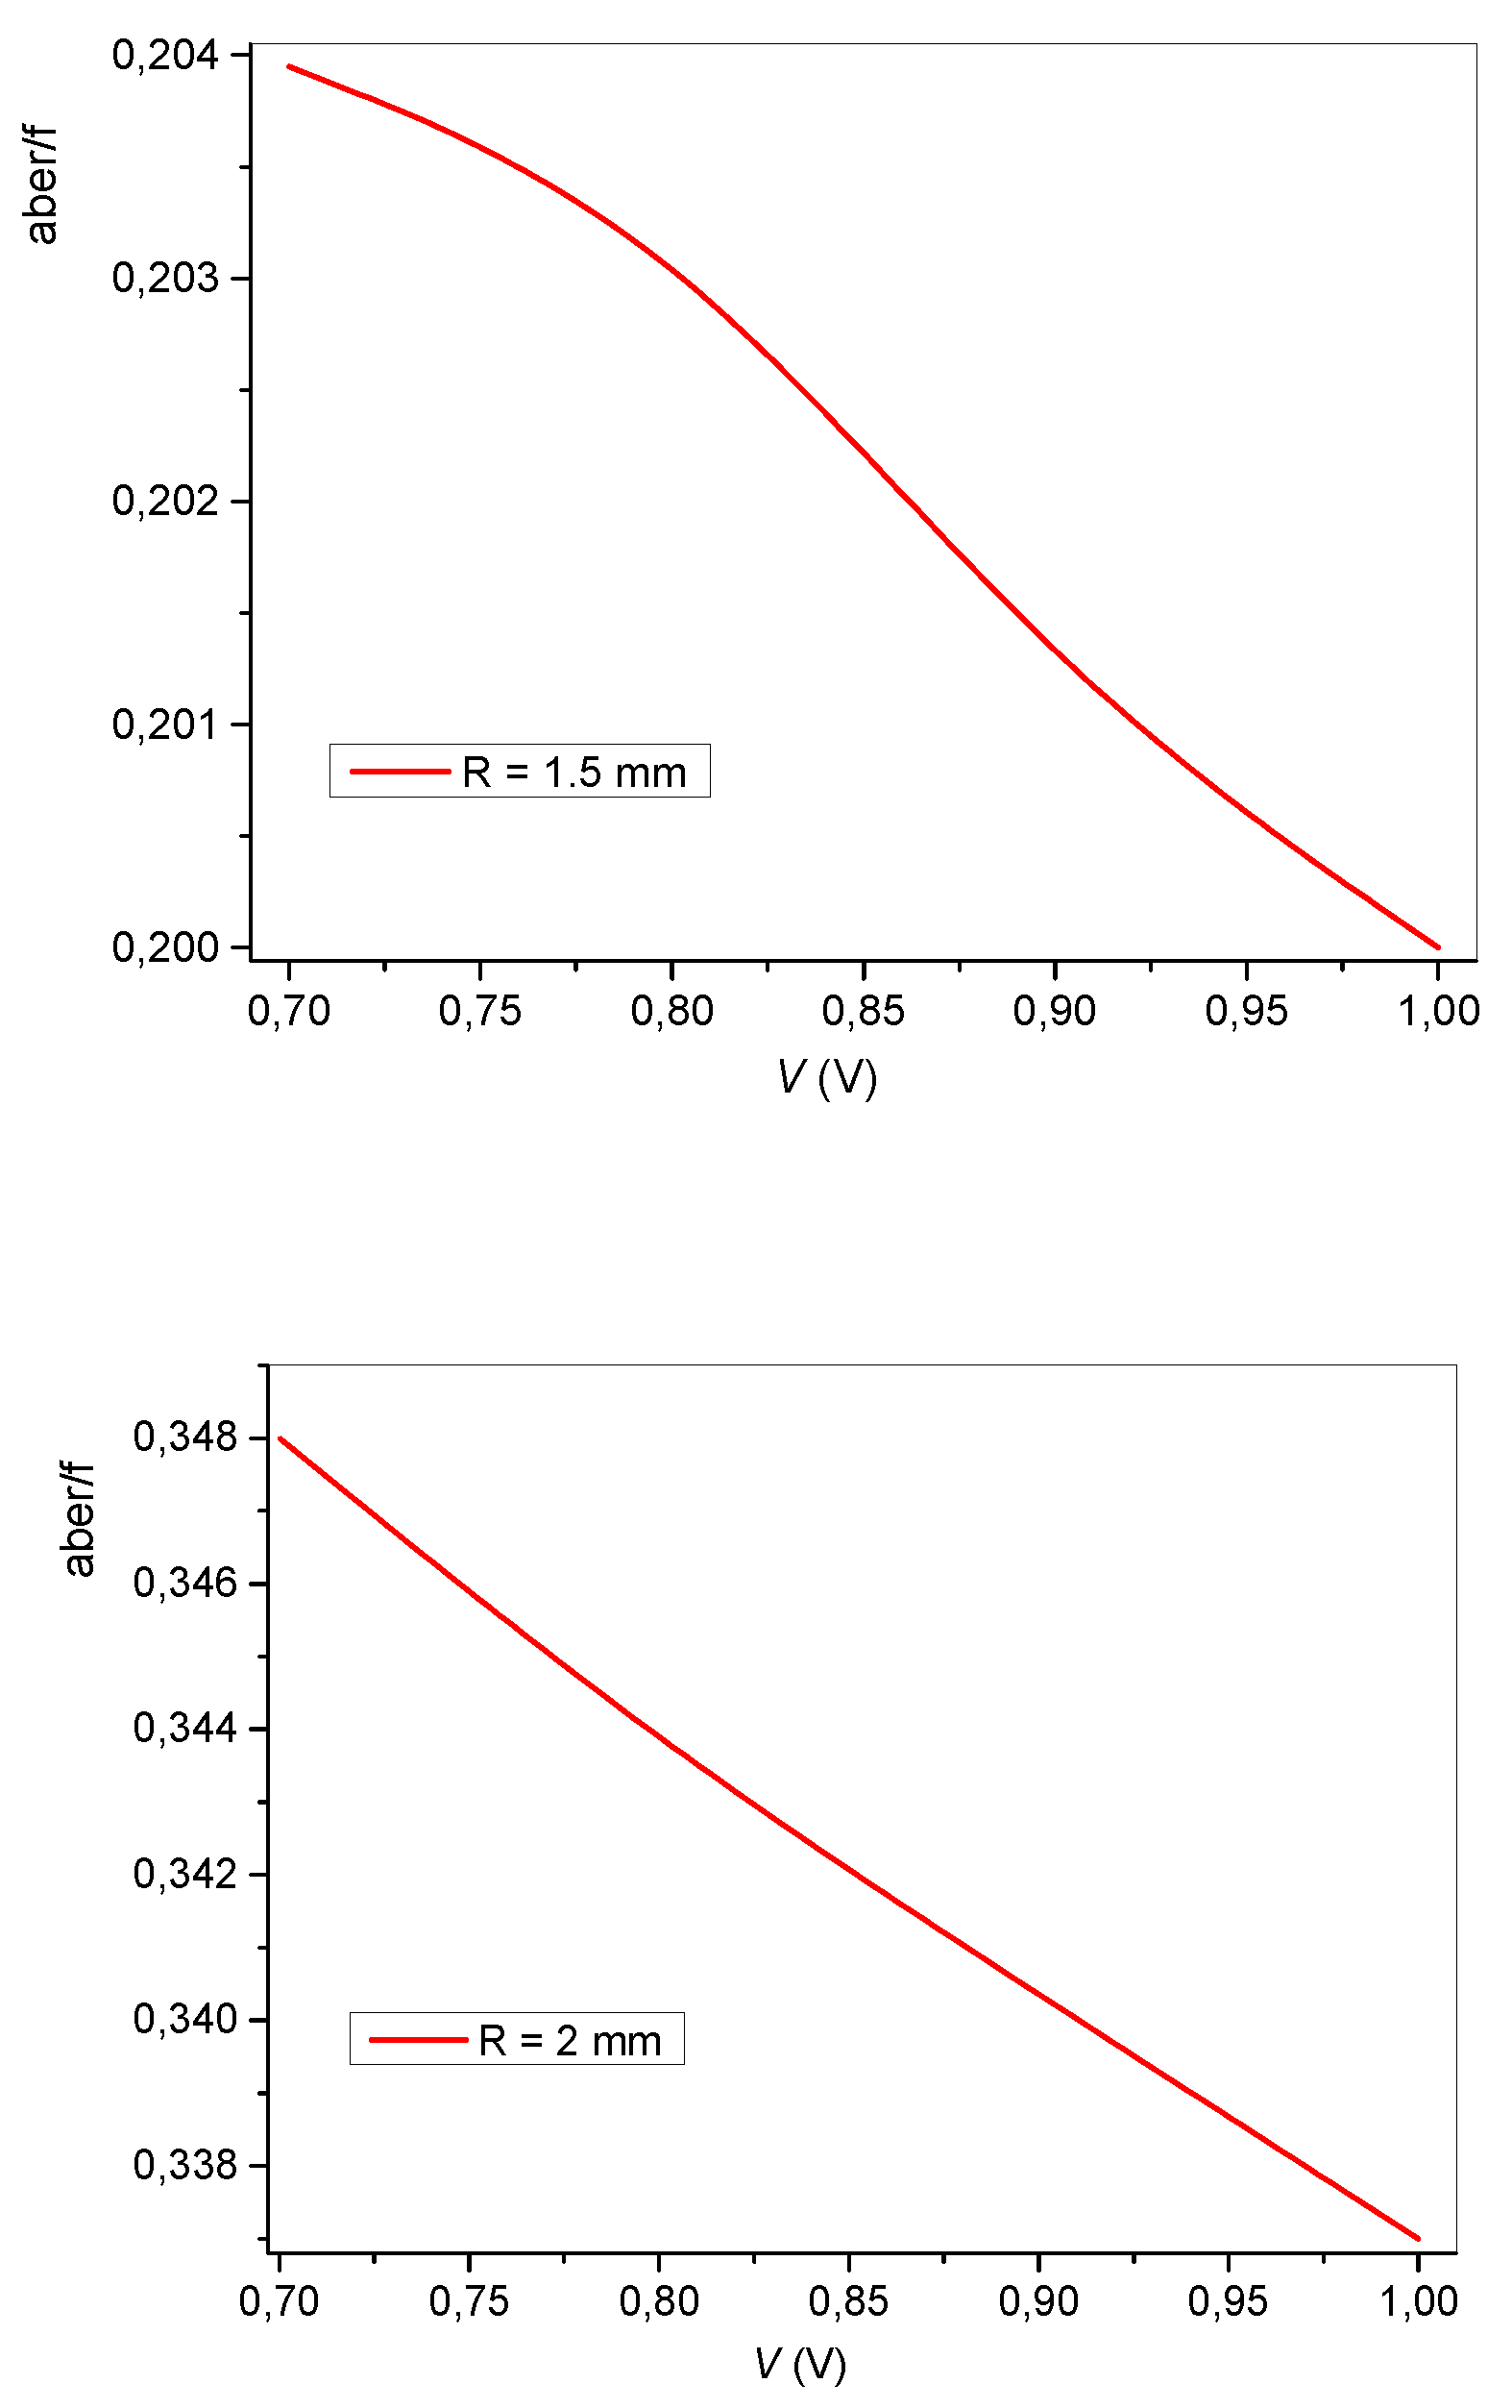
The relative longitudinal spherical aberration as a function of the applied voltage at fixed values of R (R = 1.5 mm and R = 2 mm) is instead reported in
Figure 10 a and b.
The relative LSA increases with R, as expected, and slightly decreases with increasing V, which we understand as a voltage-induced change in the phase profile. The increasing voltage makes the phase profile “more parabolic”.
5. Conclusion
We proposed a theoretical model that describes the properties of a cylindrical LC lens with parabolic phase profile induced by a spatially modulated anchoring energy. We have calculated the director profile, the electric field potential in the LC cell and the phase delay experienced by a light beam propagating through the cell. Moreover, we have estimated the focal length and the longitudinal spherical aberration of the LC lens. The dependence of the focal length on the applied voltage demonstrates the electrical tunability of the modeled lens.
The observed dependence of the lens aberration on the external voltage and on the lens aperture allows optimizing the lens features to get the best image quality. As an example, combining f and LSA, it is possible to look for the conditions giving the highest optical power with the lowest aberrations. The obtained results can easily be applied to experimentally developed LC lenses. Indeed, in principle photoalignment allows to obtain different profiles of the anchoring energy so that the phase retardation can become closer to the parabolic profile in a wide range of externally applied voltages, thus reducing the aberrations. We expect that AI or machine learning can also help to find the optimal profile of the anchoring energy.
Proper experiments will be soon under way to validate the above predictions.
References
- S. Sato, Jpn. J. Appl. Phys. 18, 1679 (1979). [CrossRef]
- N.A. Riza and M.C. DeJule, Opt. Lett. 19, 1013 (1994). [CrossRef]
- H. Ren and S.T. Wu, Appl. Phys. Lett. 82, 22 (2003). [CrossRef]
- M. Ye, Y. Yokoyama and S. Sato, Appl. Phys. Lett. 89, 141112 (2006). [CrossRef]
- M. Ye, B. Wang and S. Sato, Opt. Commun. 259, 710 (2006). [CrossRef]
- J. F. Algorri, P. Morawiak, N. Bennis, D. C. Zografopoulos, V. Urruchi, L. Rodríguez- Cobo, L. R. Jaroszewicz, J. M. Sánchez-Pena, J. M. López-Higuera, Sci. Rep. 10:10153 (2020).
- W. Feng, Z. Liu, H. Liu and M. Ye, Crystals 13, 8 (2023).
- L. Lucchetti, J. Tasseva, Appl. Phys. Lett. 100, 181111 (2012). [CrossRef]
- J. F. Algorri, D. C. Zografopoulos, V. Urruchi, J. M. Sánchez-Pena, Crystals, 9, 272 (2019). [CrossRef]
- T. Zhan, Y.-H. Lee, G. Tan, J. Xiong, K. Yin, F. Gou, J. Zou, N. Zhang, D. Zhao, J. Yang, S. Liu, S.-T. Wu, J. Opt. Soc. Am. B 36, D52 (2019). [CrossRef]
- Y. Ma, A. M. W. Tam, X. T. Gan, L. Y. Shi, A. K. Srivastava, V. G. Chigrinov, H. S. Kwok, J. L. Zhao, Opt. Exp. 27, 10079 (2019). [CrossRef]
- A. Jamali, D. Bryant, Y. Zhang, A. Grunnet-Jepsen, A. Bhowmik, P. J. Bos, Appl. Opt. 57, B10 (2018). [CrossRef]
- H.-Y. Lin, N. Avci, S.-J. Hwang, Liq. Cryst. (2019). [CrossRef]
- A.G. Dyadyusha, T. Ya. Marusii, Yu. A. Reznikov, A.I. Khizhniak, V. Yu. Reshetnyak, JETP Letts, 56, 17-21
(1992).
- M. Schadt, H. Seiberle, A. Schuster, Nature, 381, 212–215 (1996). [CrossRef]
- V.G. Chigrinov, V.M. Kozenkov, H. Kwok, Photoalignment of liquid crystalline materials: physics and
application, John Wiley&Sons, Ltd, Publication, 231 (2008).
- D. Alexei, V. Kiselev, V.G. Chigrinov, D.D. Huang, Phys. Rev. E 72, 061703 2005, 2005.
- V. Yu. Reshetnyak, O. Sova, Yu-Jen Wang, Yi-Hsin Lin, Proc. SPIE 11303, Emerging Liquid Crystal
Technologies XV, 1130304 (2020). [CrossRef]
- K. Takatoh, M. Hasegawa, M. Koden, N. Itoh, R. Hasegawa and M. Sakamoto, Alignment Technologies
and Applications of Liquid Crystal Devices, Taylor & Francis Oxon OX14 4RN, ISBN 0-748-40902-5
(2005).
- P. G. de Gennes and J. Prost, The Physics of Liquid Crystals, 2nd edition, Clarendon Press, Oxford, 1993,
614 p.
- L. Lucchetti, G. Nava, R. Barboza, F. Ciciulla, T. Bellini, J. Mol. Liq., 329, 115520 (2021). [CrossRef]
- J.W. Goodman, Introduction to Fourier Optics (McGrawHill, New York, 2002).
- Yi-Hsin Lin, Yu-Jen Wang and V. Yu. Reshetnyak, Liquid Crystals Reviews, 5, 111, (2017). [CrossRef]
- M. Born and E.W. Wolf, Principles of Optics (Pergamon Press, Oxford, 1991).
- S. Valyukh, V.G. Chigrinov, H.S. Kwok, SID 08 DIGEST, pp 659-662 (2008).
- S. Bielykh, S. Subota, V. Reshetnyak, T. Galstian, Ukr. J. Phys., 55, 294 (2010).
- J.W. Goodman, Introduction to Fourier Optics, McGraw Hill, New York (2002).
|
Disclaimer/Publisher’s Note: The statements, opinions and data contained in all publications are solely those of the individual author(s) and contributor(s) and not of MDPI and/or the editor(s). MDPI and/or the editor(s) disclaim responsibility for any injury to people or property resulting from any ideas, methods, instructions or products referred to in the content. |
© 2023 by the authors. Licensee MDPI, Basel, Switzerland. This article is an open access article distributed under the terms and conditions of the Creative Commons Attribution (CC BY) license (http://creativecommons.org/licenses/by/4.0/).
