1. INTRODUCTION
With the continuous exploration of extreme environments such as deep space, deep sea, and outer space, there is an increasing requirement for functional materials capable of withstanding ultra-high and ultra-low temperatures as well as corrosion resistance. High-temperature alloys are the main materials serving as core components in frontier technologies such as aerospace and nuclear industries, such as engines, gas turbines, and high-temperature structural parts. These alloys require high strength, high-temperature fatigue resistance, oxidation resistance, and thermal corrosion capability. However, high-temperature and oxidation have become the primary problems that limit the further application of high-temperature alloys in extreme environments.
Comprehensive consideration of existing high-temperature oxidation-resistant materials, the main high-temperature oxidation-resistant alloys used in engineering are iron, cobalt, and nickel-based alloys. The cost of iron-based high-temperature alloys is relatively lower, but poorer high-temperature stability. FeAl intermetallic compounds [
1] have better temperature resistance and excellent mechanical properties than ceramic materials, but they are limited by their inherent brittleness. Cobalt-based high-temperature alloys are strengthened mainly by the precipitation of carbides and a solid solution of refractory elements [
2,
3]. There are also imbalances in the performance of both the results of the two strengthening methods and the results of the improved experiments [4-7]. Their high-temperature stability and mechanical properties are much lower than those of nickel-based high-temperature alloys. Nickel-based high-temperature alloys have excellent comprehensive properties and they are widely used high-temperature structural materials at present [
8]. Therefore, niobium-based alloys have received attention due to the lower liquid-phase line temperature and the limitation of their melting point, but their limited service temperature [
9] can no longer meet the temperature-bearing capacity required for advanced aero-engines [
10]. Although niobium-based alloys have ideal high-temperature mechanical properties [
11,
12], they suffer from serious oxidation problems at high temperatures [
13,
14], for example, niobium-silicon-based alloys. The alloys currently used in industry have problems in the high-temperature oxidation environment such as pulverization and mechanical property imbalance. It has been reported [15-17] that an alloy material resistant to high-temperature oxidation has been developed by scholars internationally and it can operate at 1800-2000C°, but the material has not been found domestically. Therefore, this study aims to establish an experimental foundation for subsequent research.
In recent years, with a lot of research on High-entropy alloys(HEAs), refractory HEAs have gradually received attention due to their excellent properties. For instance, alloys such as NbMoTaW and NbMoTaWV can operate at 1600 °C although they show a decrease in performance [
18], which surpassing to the working temperature of existing alloys. HEAs offer the potential to sustain materials’ function properly in ultra-high temperature environments. Among all the publicly reported HEA systems, the constituent elements are mainly refractory metal elements such as titanium, zirconium, niobium, molybdenum, hafnium, tantalum, wolfram, vanadium, etc, which have higher melting points and strength, and excellent properties at higher temperatures, making them one of the most promising high-temperature structural metals [19-22]. Currently, the most effective measure to prevent HEA materials’ oxidative failure is to prepare antioxidant coatings on the material surface [
23]. In this paper, the preparation of HEA-based hafnium coatings and related properties was carried out by using a hot-pressure sintering process to provide some research basis for the study of high-temperature resistant composites.
3. RESULTS AND DISCUSSION
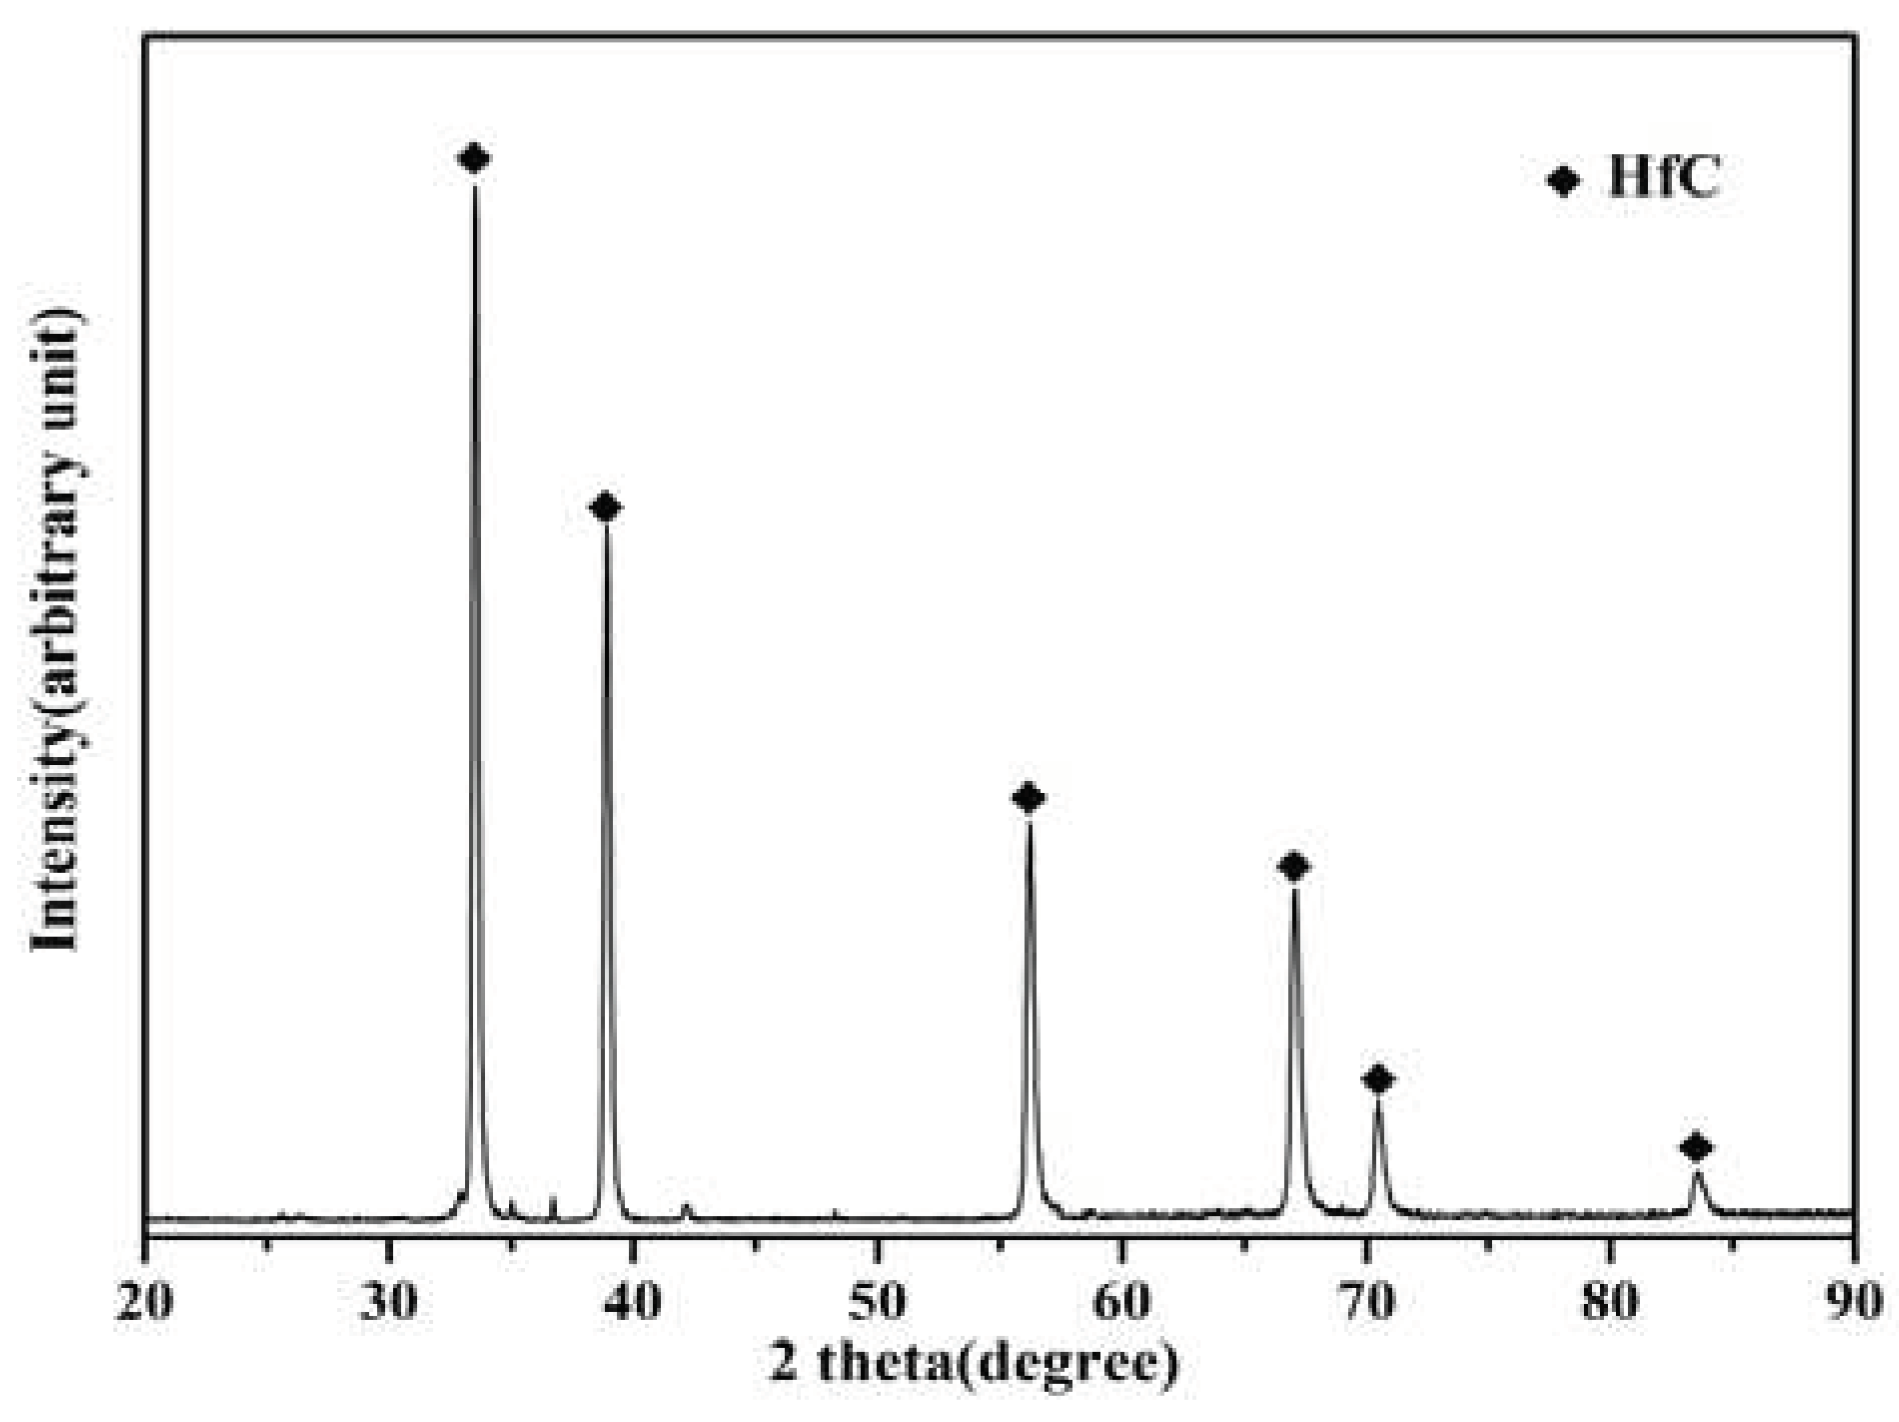
Figure 2 shows the X-ray Diffraction(XRD)spectrum of the surface of the Hf-coated sample prepared by hot-press sintering. This suggests that the main phase of the surface coating is HfC, and it is easy for hafnium to react with carbon to form carbide in the carbon environment, which can increase the hardness of the coating. Based on the thermodynamic calculations of the equilibrium module in the software Factsage 8.1, the value of the Gibbs free energy for the reaction of hafnium with carbon to form an HfC solid at 1600 °C is much less than 0, which means that the reaction can proceed spontaneously at 1600 °C.
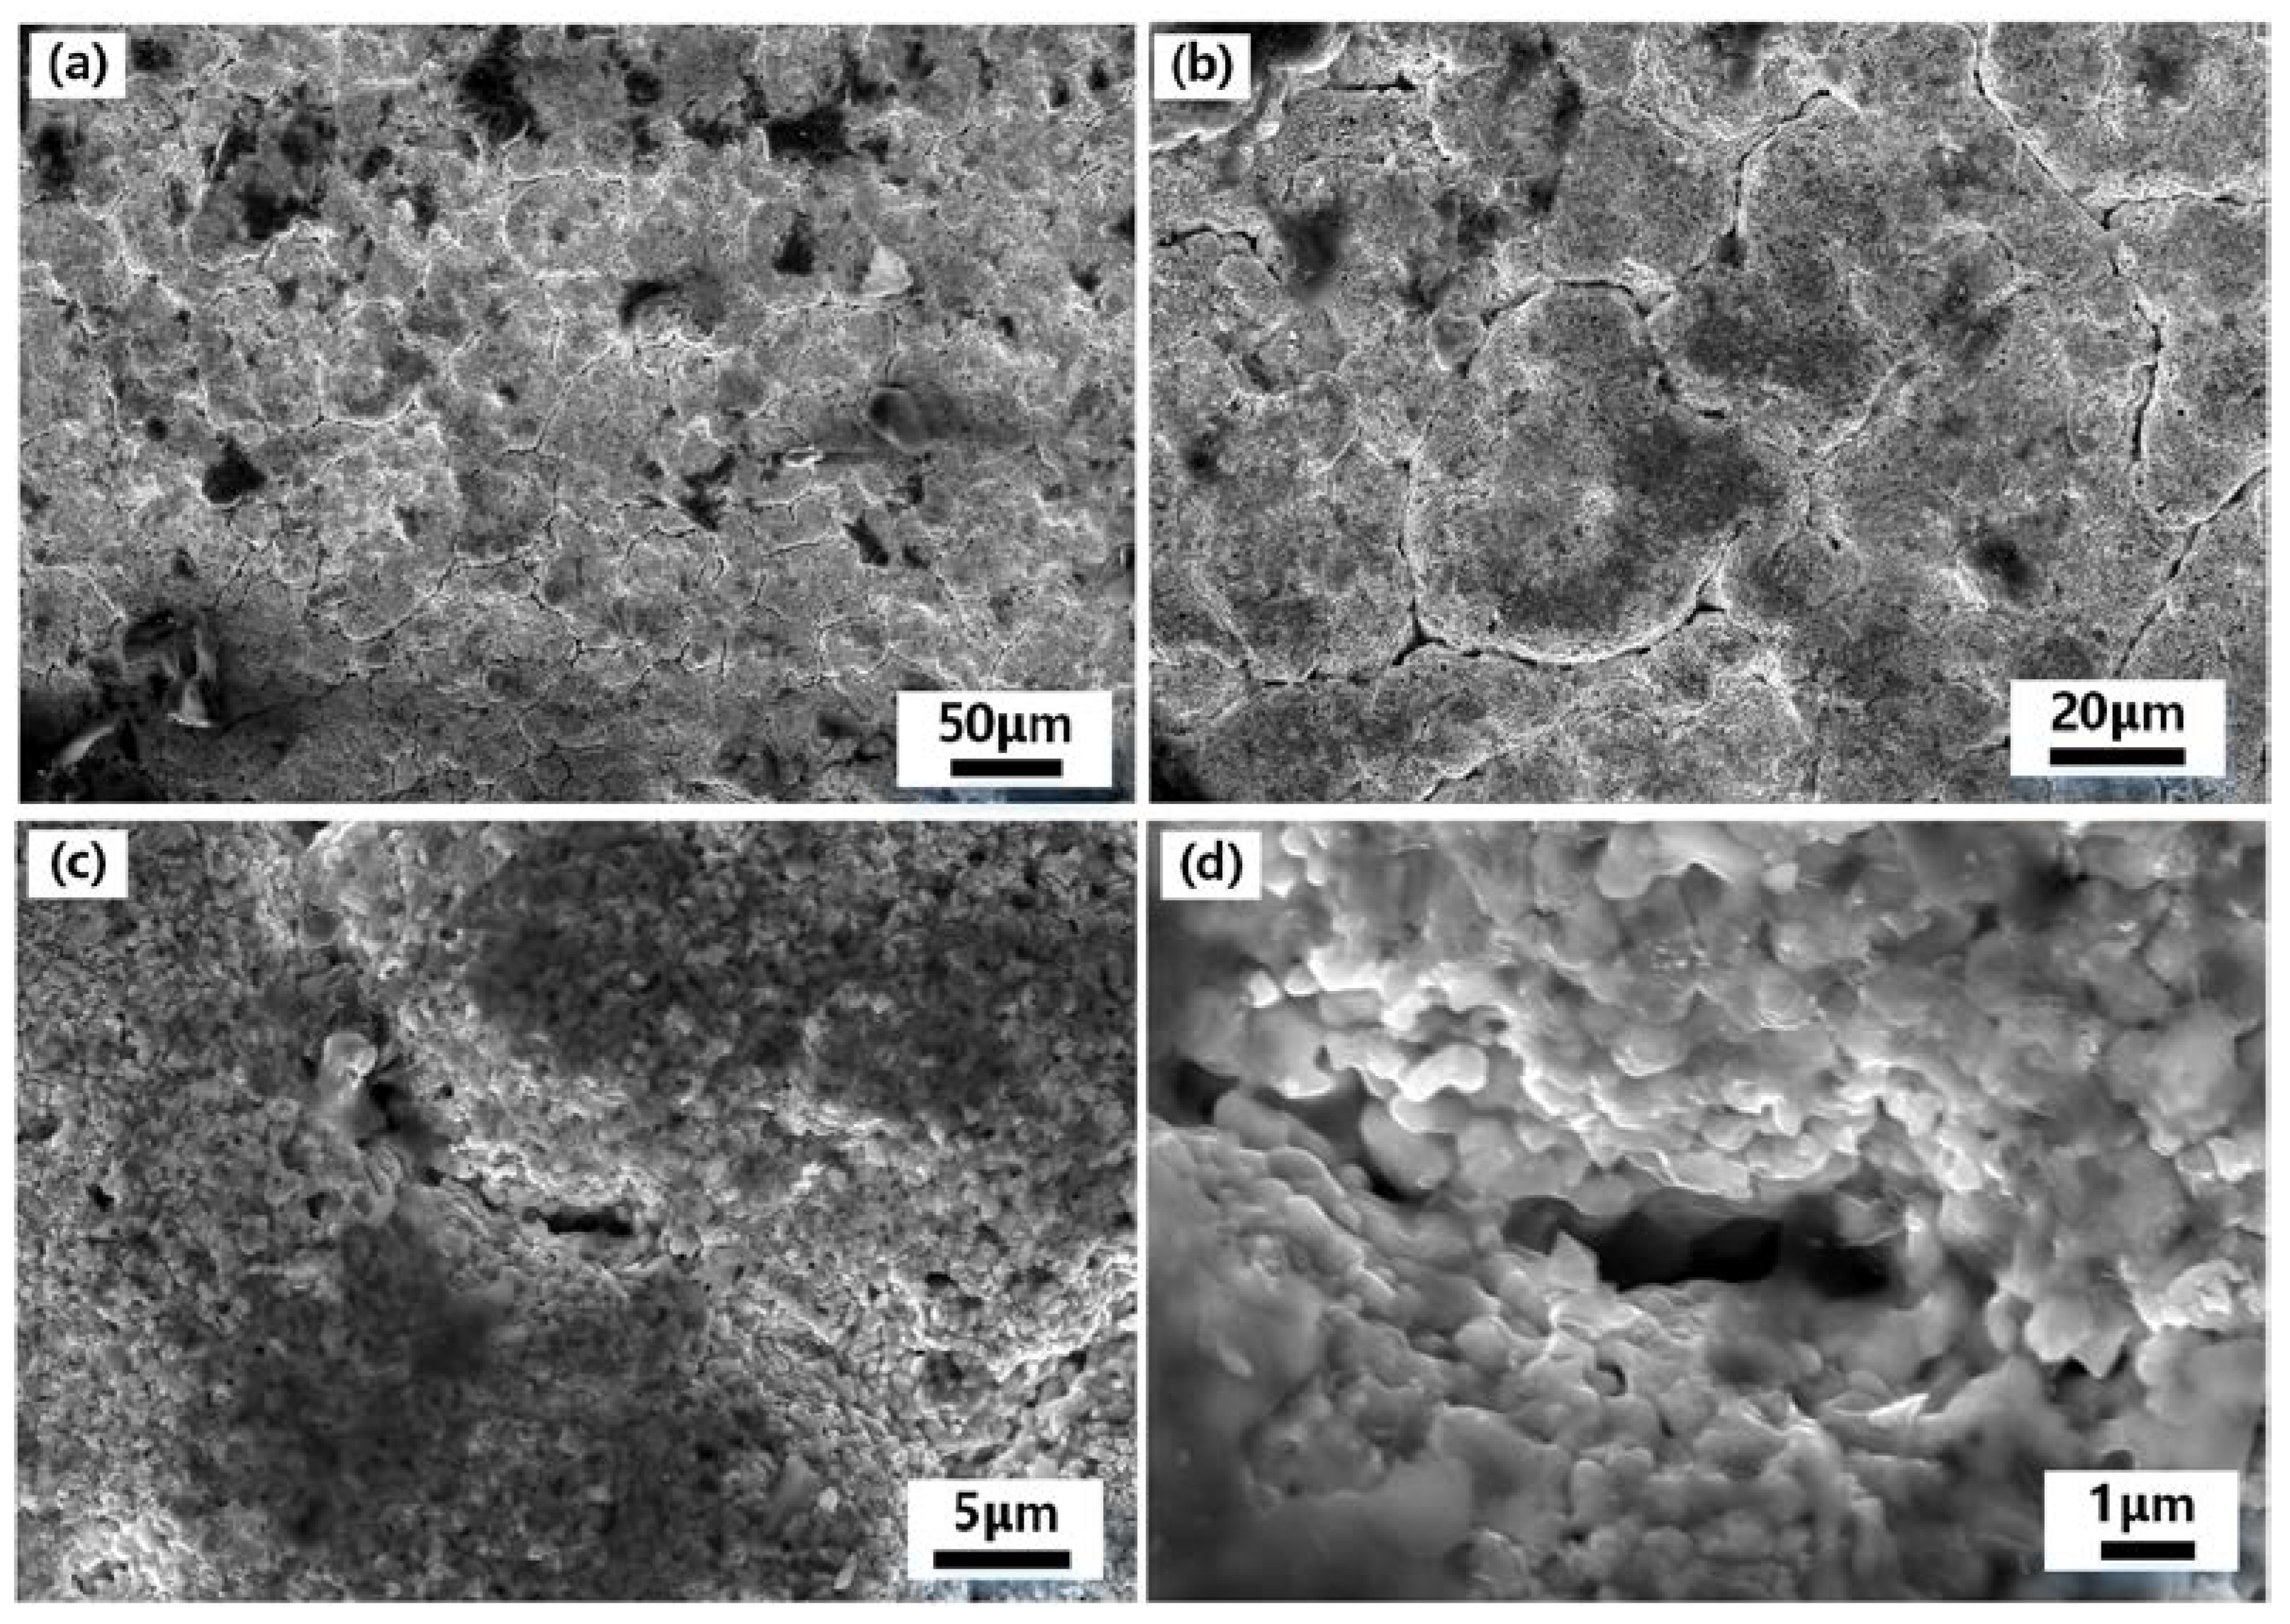
Figure 3 shows the surface Scanning Electronic Microscopy(SEM)photographs of the Hf-coated samples prepared by hot-press sintering. As seen in
Figure 3(a) and 3(b), there are cracks on the surface of the coating. This is due to the sintering volume shrinkage of the high melting point HfC in the coating at 1823 K. Further magnification of the area of the cracks reveals the internal sintering, as shown in
Figure 3(c) and 3(d). The metal hafnium powder particles forming the coating are bonded to each other, and the diameter of small particles is less than 1 μm. The width of the cracks is less than 1 μm, which ensures the eminent density and strength of the coating.
To clarify the composite mechanism between the coating prepared by the hot-press sintering process and the matrix VZrHfNbTa HEA, the samples were systematically tested and analyzed before and after sintering.
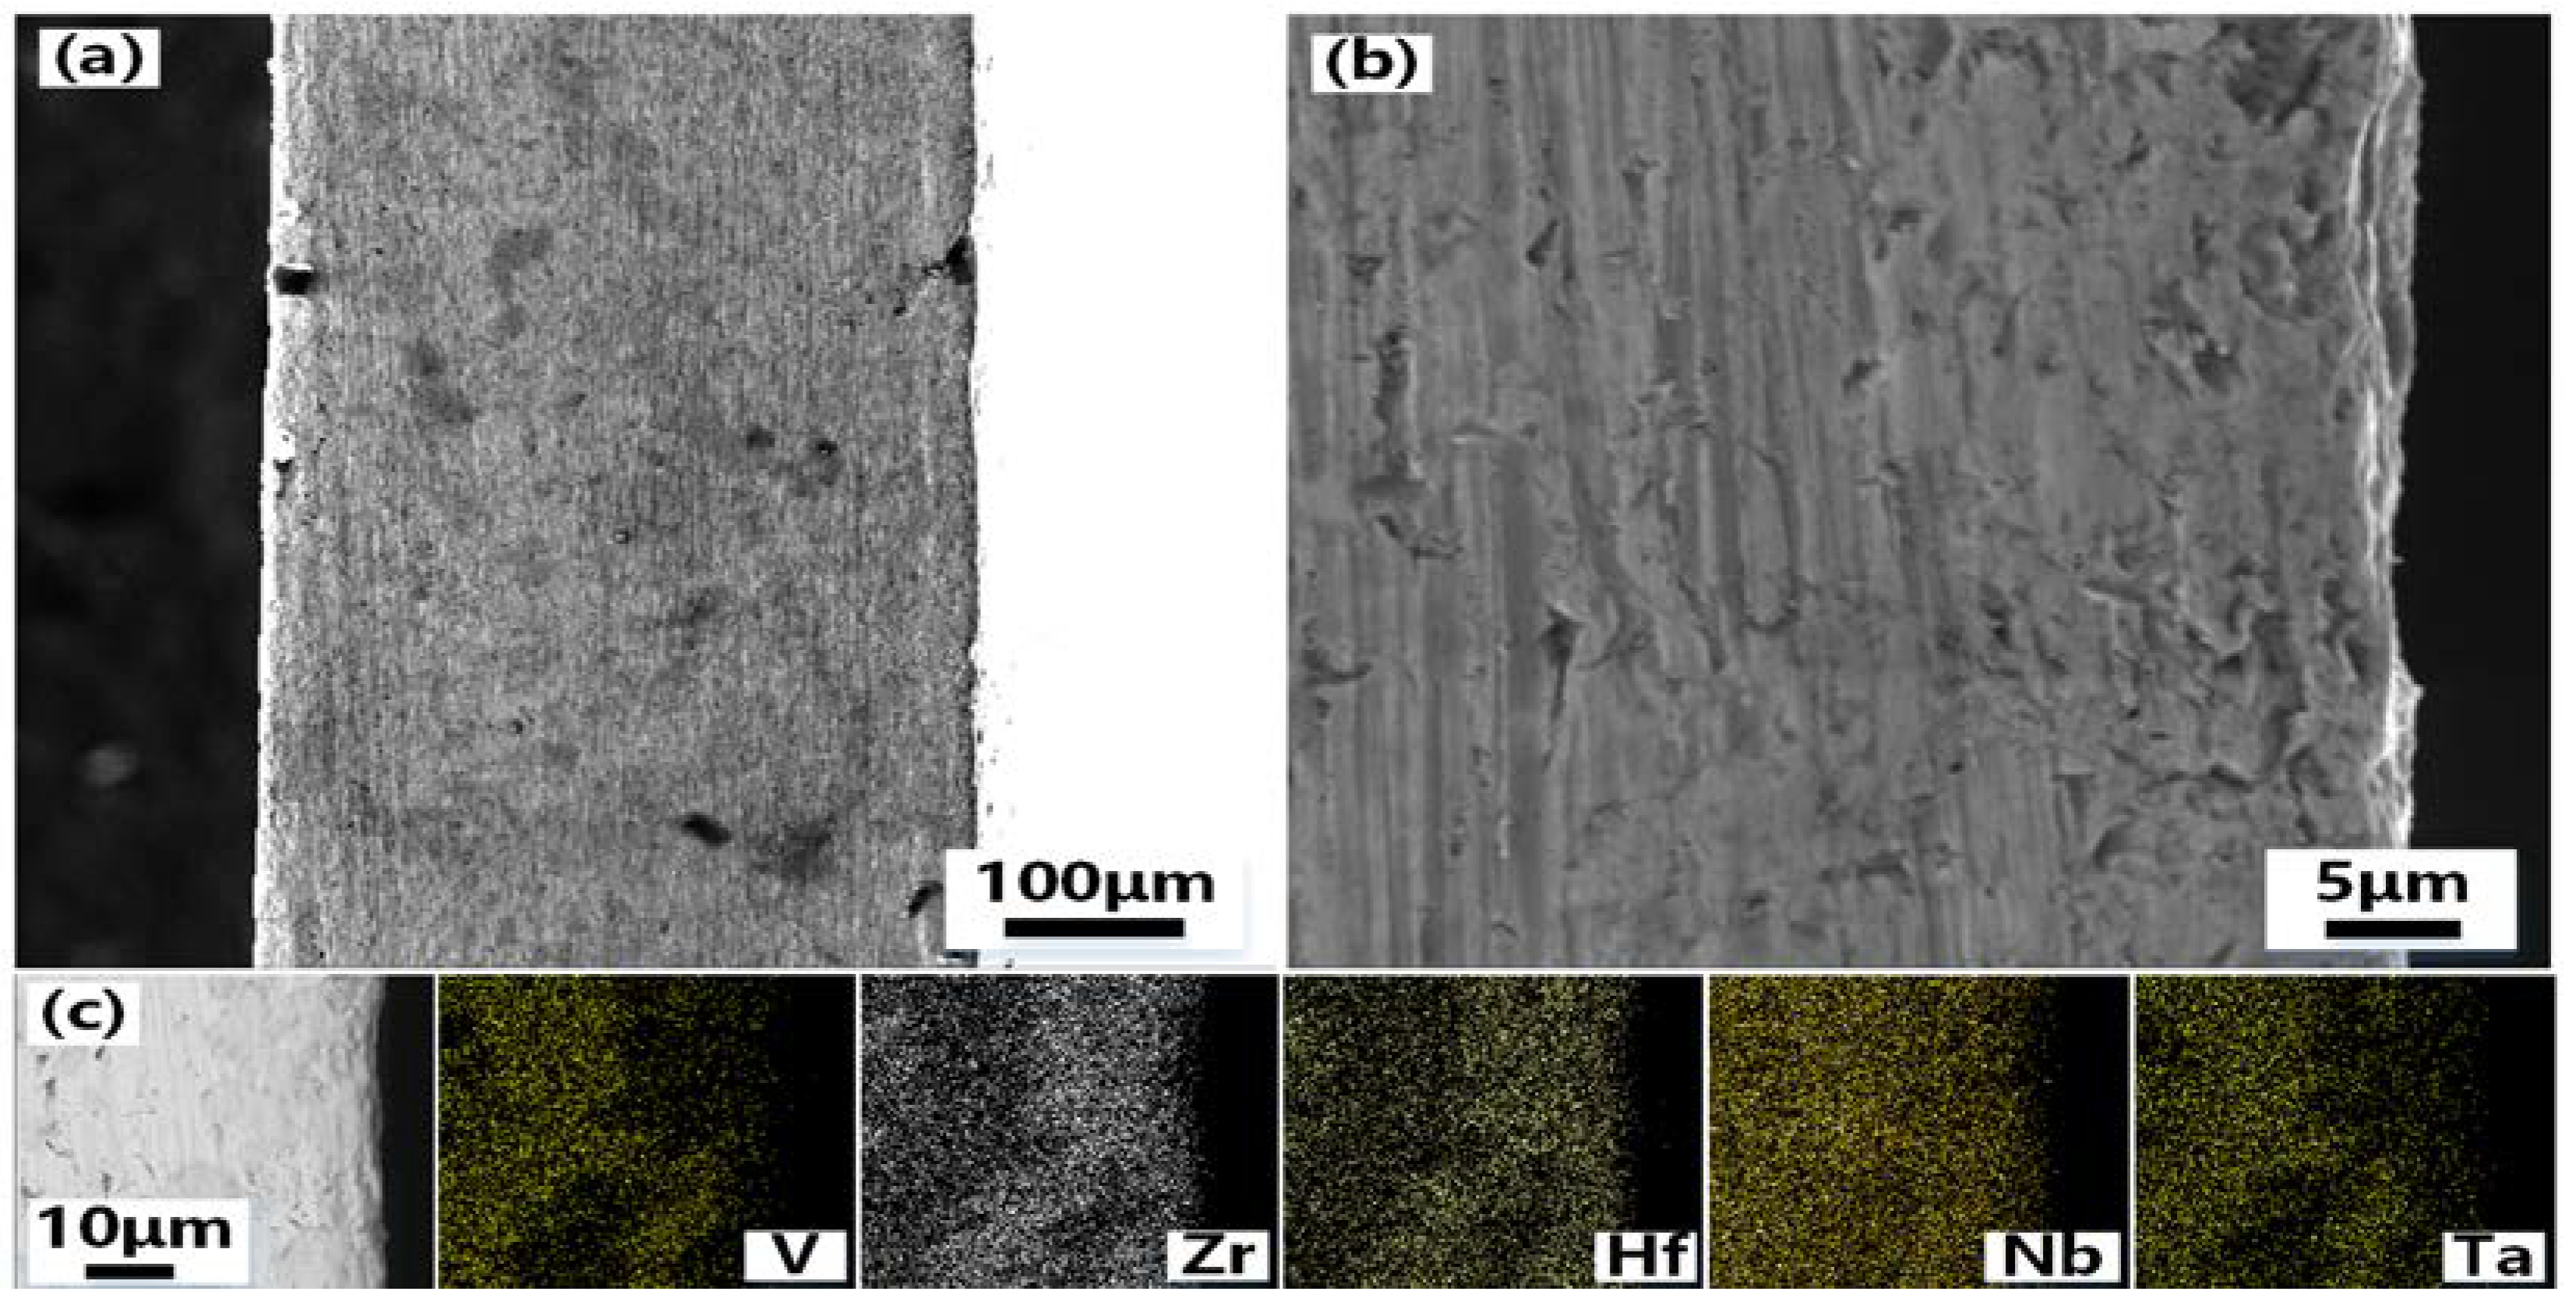
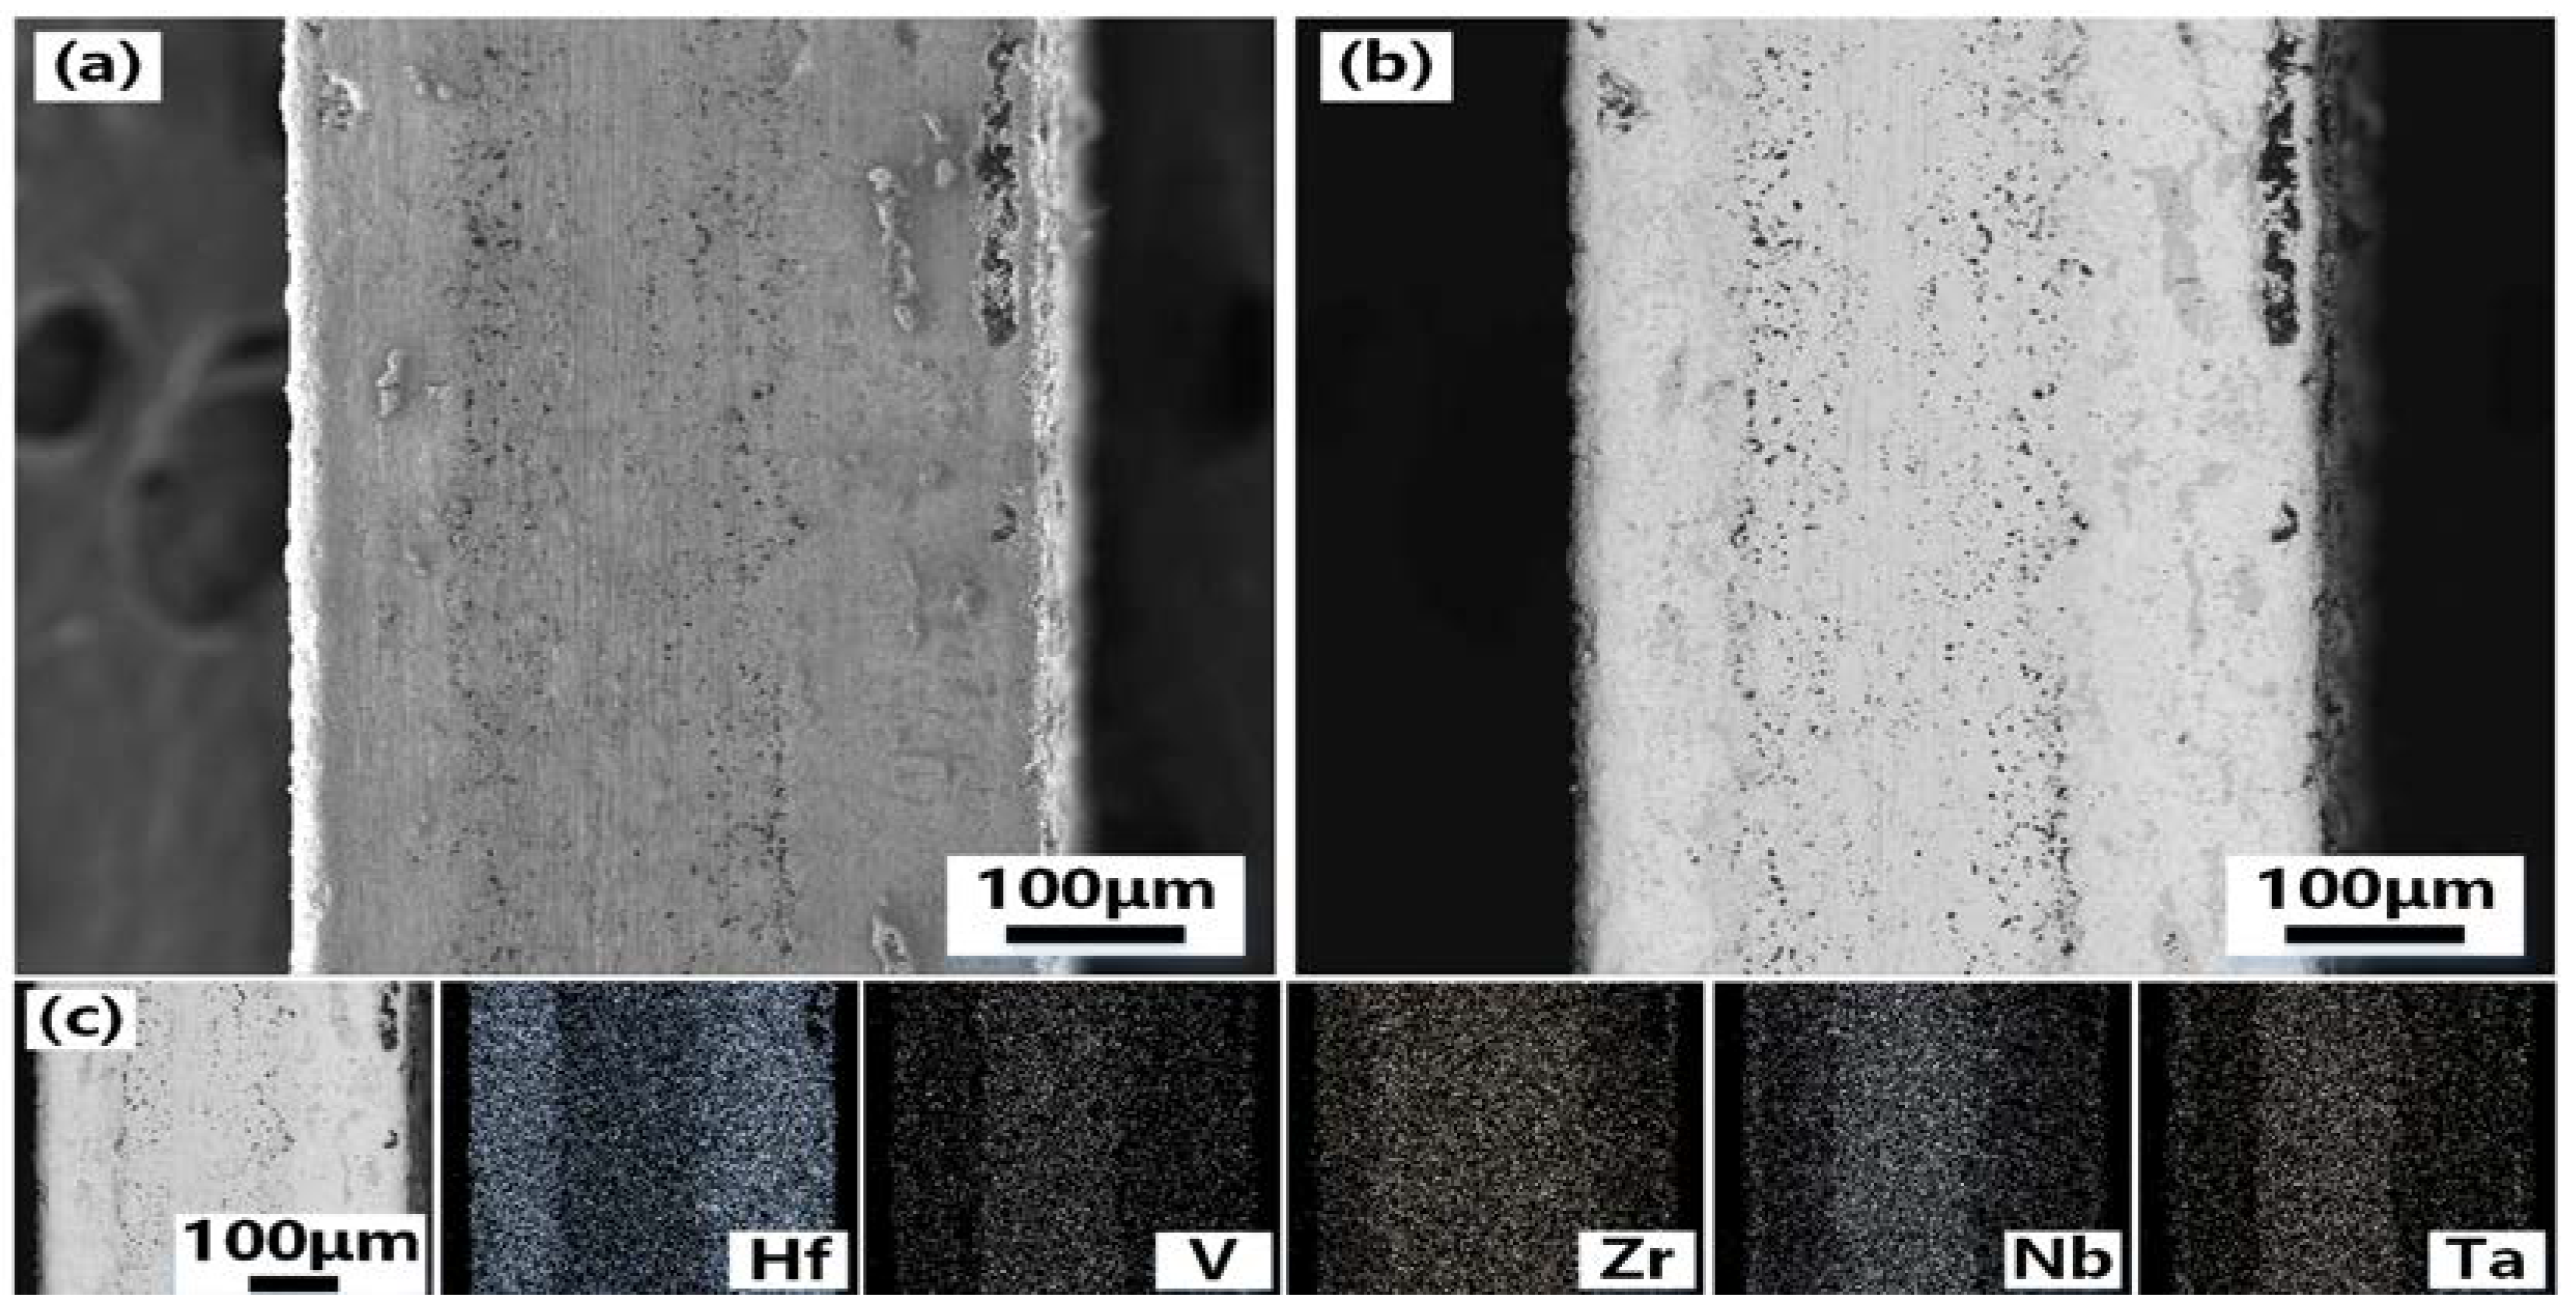
Figure 4 shows the SEM photos of the cross-section of VZrHfNbTa alloy and the energy spectrum analysis.
Figure 4(a) and 4(b) show the cross-section and the side of the cross-section near the edge of the VZrHfNbTa alloy prepared by hot-press sintering, respectively, the alloy layer exhibits a dense surface, indicating an excellent hot-press sintering effect. The cross-sectional energy spectrum surface scan analysis shows that the elements of zirconium, hafnium, and niobium are uniformly distributed, while vanadium and tantalum are less concentrated near the surface.
Figure 5 shows the SEM, Back-Scaterred Electron(BSE), and energy spectrum analysis of the cross-section of the Hf-coated samples prepared by hot-press sintering. As shown in
Figure 5(a) and 5(b), the center of the alloy cross-section has a clear boundary with the edge, and the thickness of the central part is about 150 μm. From the energy spectral surface scan of
Figure 4(c), a layer formed from metal hafnium with a thickness of approximately 120 μm was formed on the surface of the substrate VZrHfNbTa alloy. The energy spectrum analysis shows that the elements of vanadium, niobium, and tantalum have clear boundaries with the coating. Therefore, no diffusion of elements was observed during the hot pressing sintering process, and the hafnium in the coating has a distinct boundary due to its different concentration compared to the substrate alloy. In contrast, the boundary between zirconium and the coating in the cross-section is very blurred, which indicates a significant diffusion and migration of zirconium of the substrate alloy to the coating occurred during the hot-press sintering process.
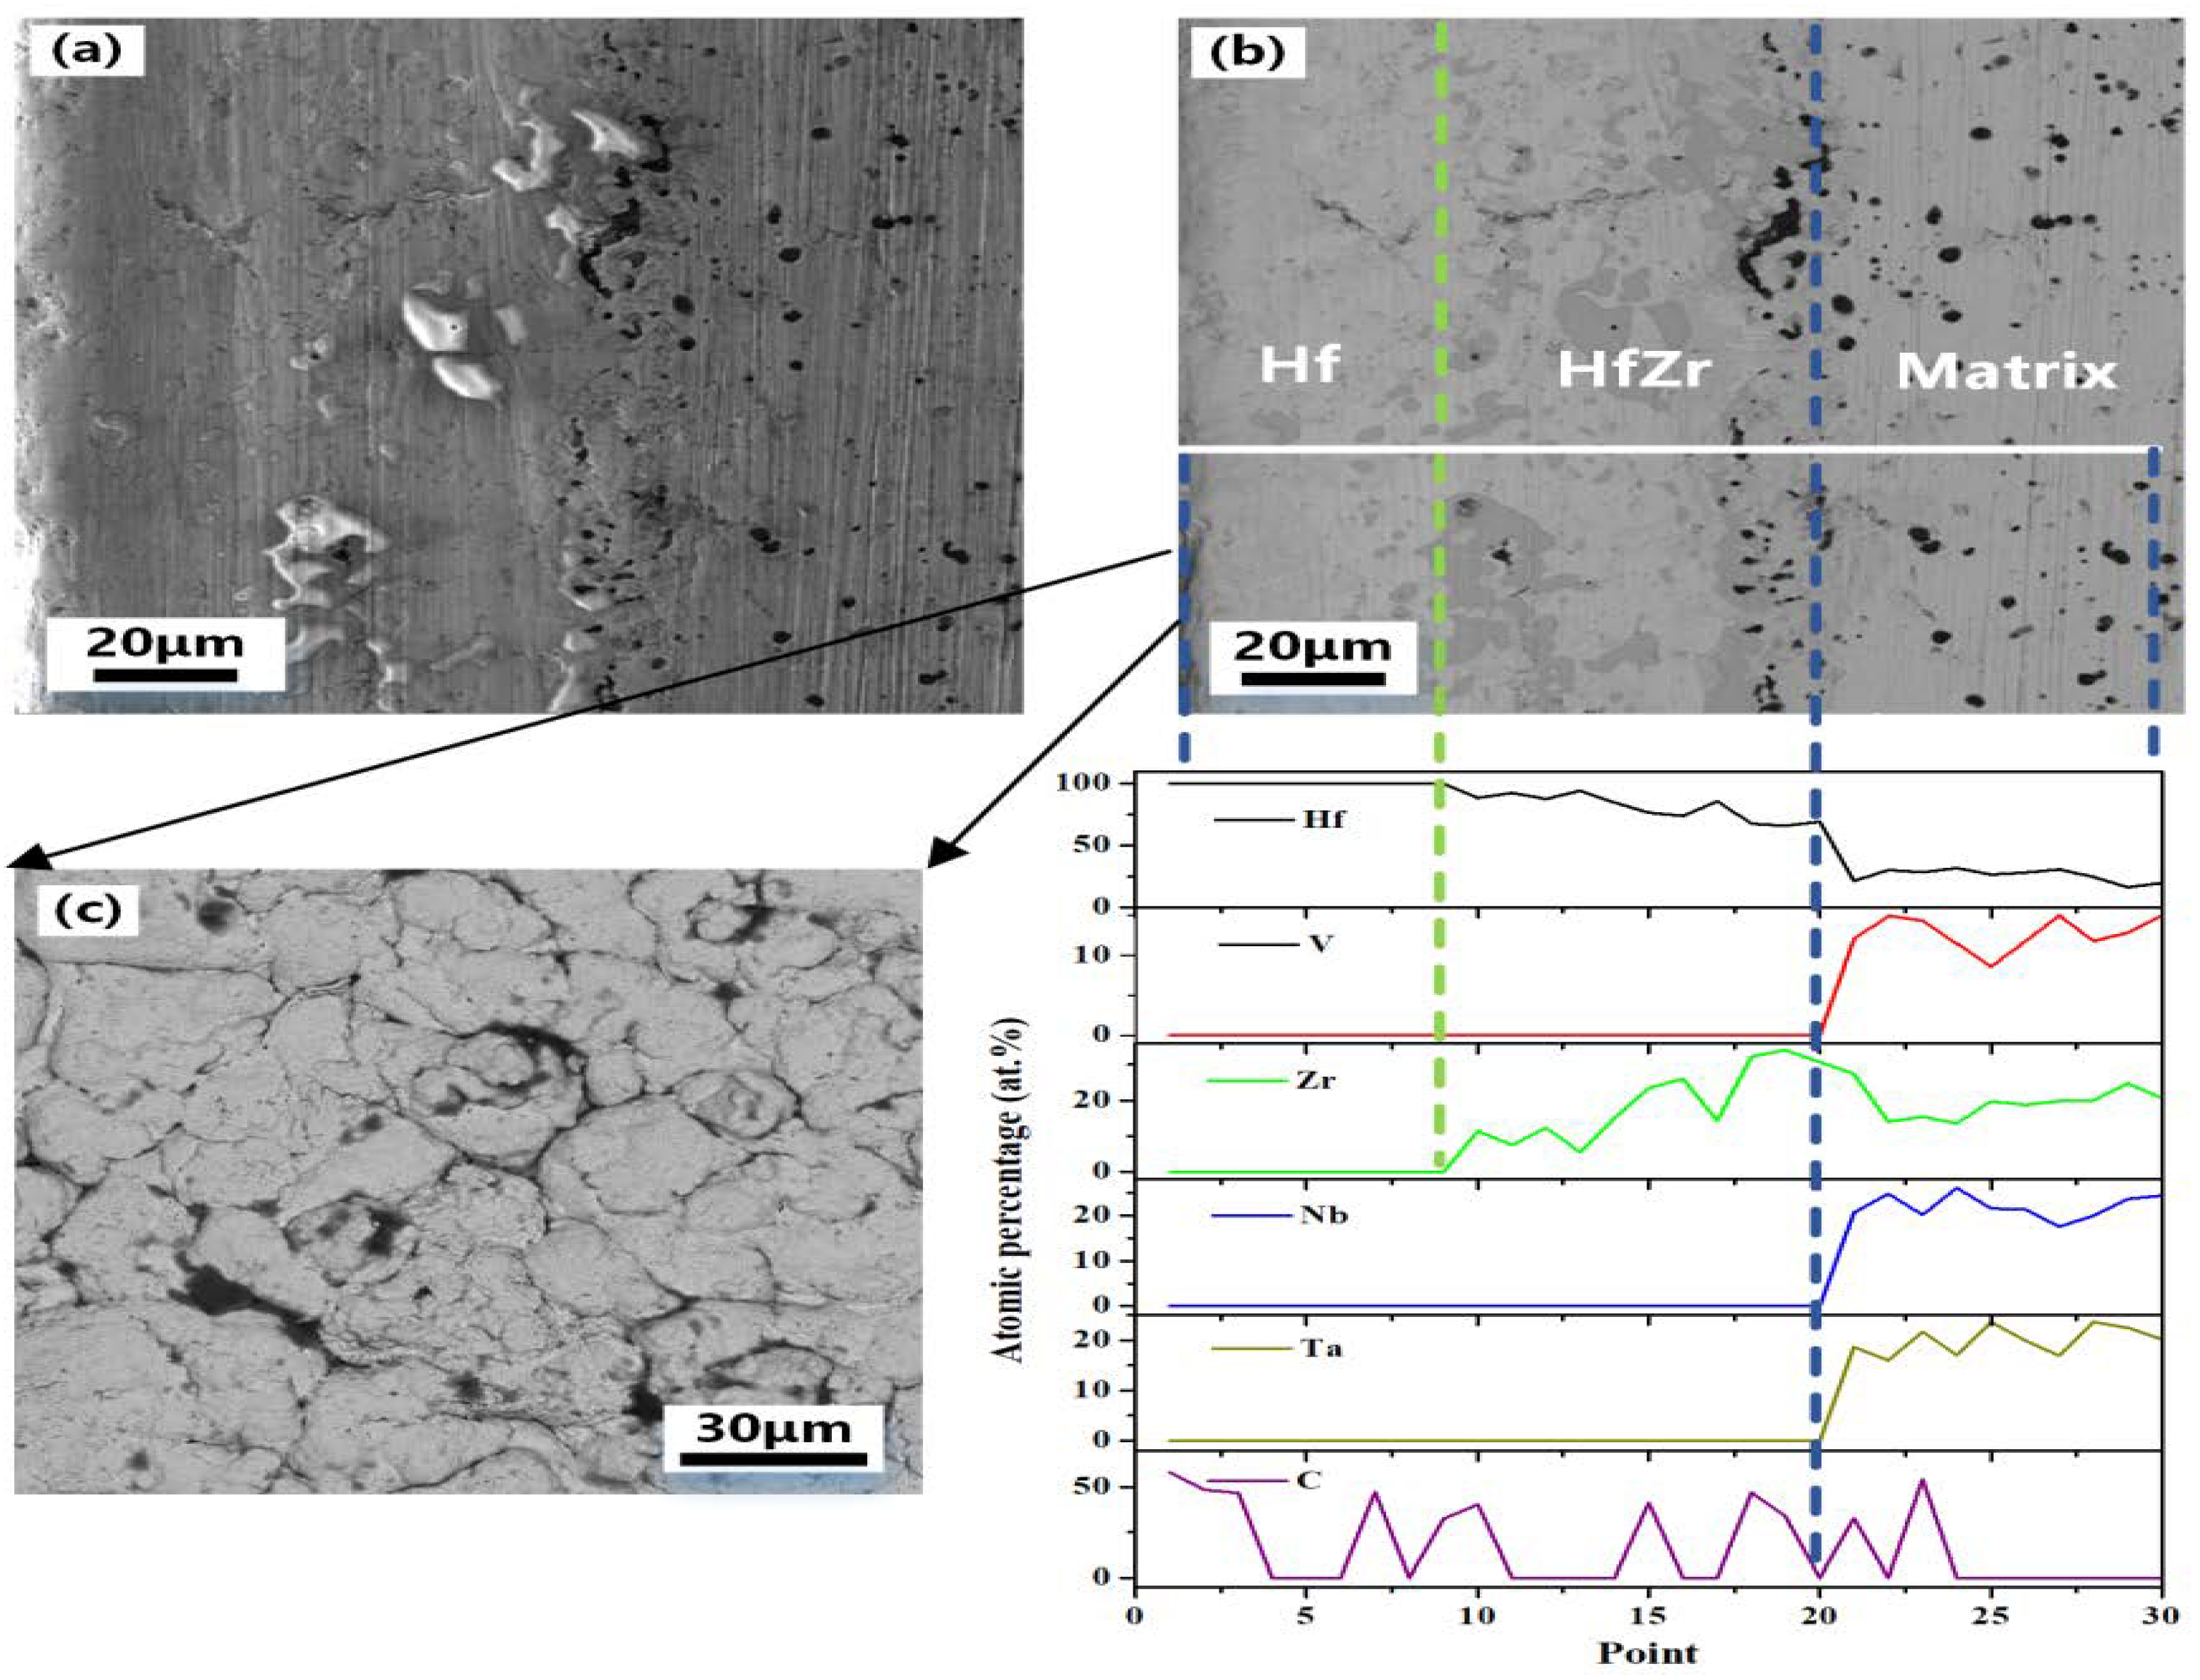
To further clarify the distribution of elements at the interface between the coating and the substrate, energy spectral line scan analysis was applied to the cross-section of the coated sample.
Figure 6 shows the SEM, BSE, and energy spectrum line scan analysis of a half cross-section of the hafnium-coated sample prepared by hot-press sintering. As shown in
Figure 6(b), the phase difference between the substrate and the coating can be observed, but the boundary is not obvious. The white line in
Figure 6(b) is the energy spectrum scan line. According to the content data of the line scan elements, the cross-section is divided into three parts: alloy matrix, HfZr coating, and hafnium coating from inside to outside. Based on the distribution of the zirconium element, it can be concluded that the diffusive distance of the zirconium element is about 60 μm when hot-press sintered at 1823 K for 1 h. the distribution of carbon element, indicate that hafnium on the coating surface and carbon paper formed hafnium coating during the hot-press sintering process, but the thickness of HfC coating is less than 10 μm due to the limited diffusive distance of carbon element, and the carbon at the interface between the substrate and the coating mainly originates from the mixture of metal hafnium prepared by electro-deoxygenation and HfC powder in the coating, and the diffusive distance is similar to the thickness of the surface HfC. The migration of zirconium elements at the interface between the coating and the substrate helps to improve the bondability between the coating and the substrate, thus effectively improving the protection of the coating against the substrate.
Figure 6(b) illustrates that a chemically bonded interface was formed in the coating, which enhances the adhesion between the coating and the substrate and solves the problem of peeling that commonly occurred in traditional alloy coating. In the VZrHfNbTa system, zirconium and hafnium belong to the same main group with similar physical and chemical properties, and
Table 1 shows the basic parameters of the alloying elements. The closer the atomic radii between the alloying elements in HEAs, the more similar type of crystal structure between the group elements, the smaller the electronegativity difference, the easier it is for two infinite intercalations, then the more favorable to the formation of solid solution. According to the Miedema model [
24], it is known that the enthalpy of mixing of Hf-Zr is 0, therefore, the two elements tend to form a stable solid solution. And only the zirconium and hafnium undergo the BCC→HCP isomeric transition at low temperatures as well. After the HCP solid solution is formed, there will be serious lattice distortion, which may be one of the factors that affect the diffusion of zirconium.
In a certain period,
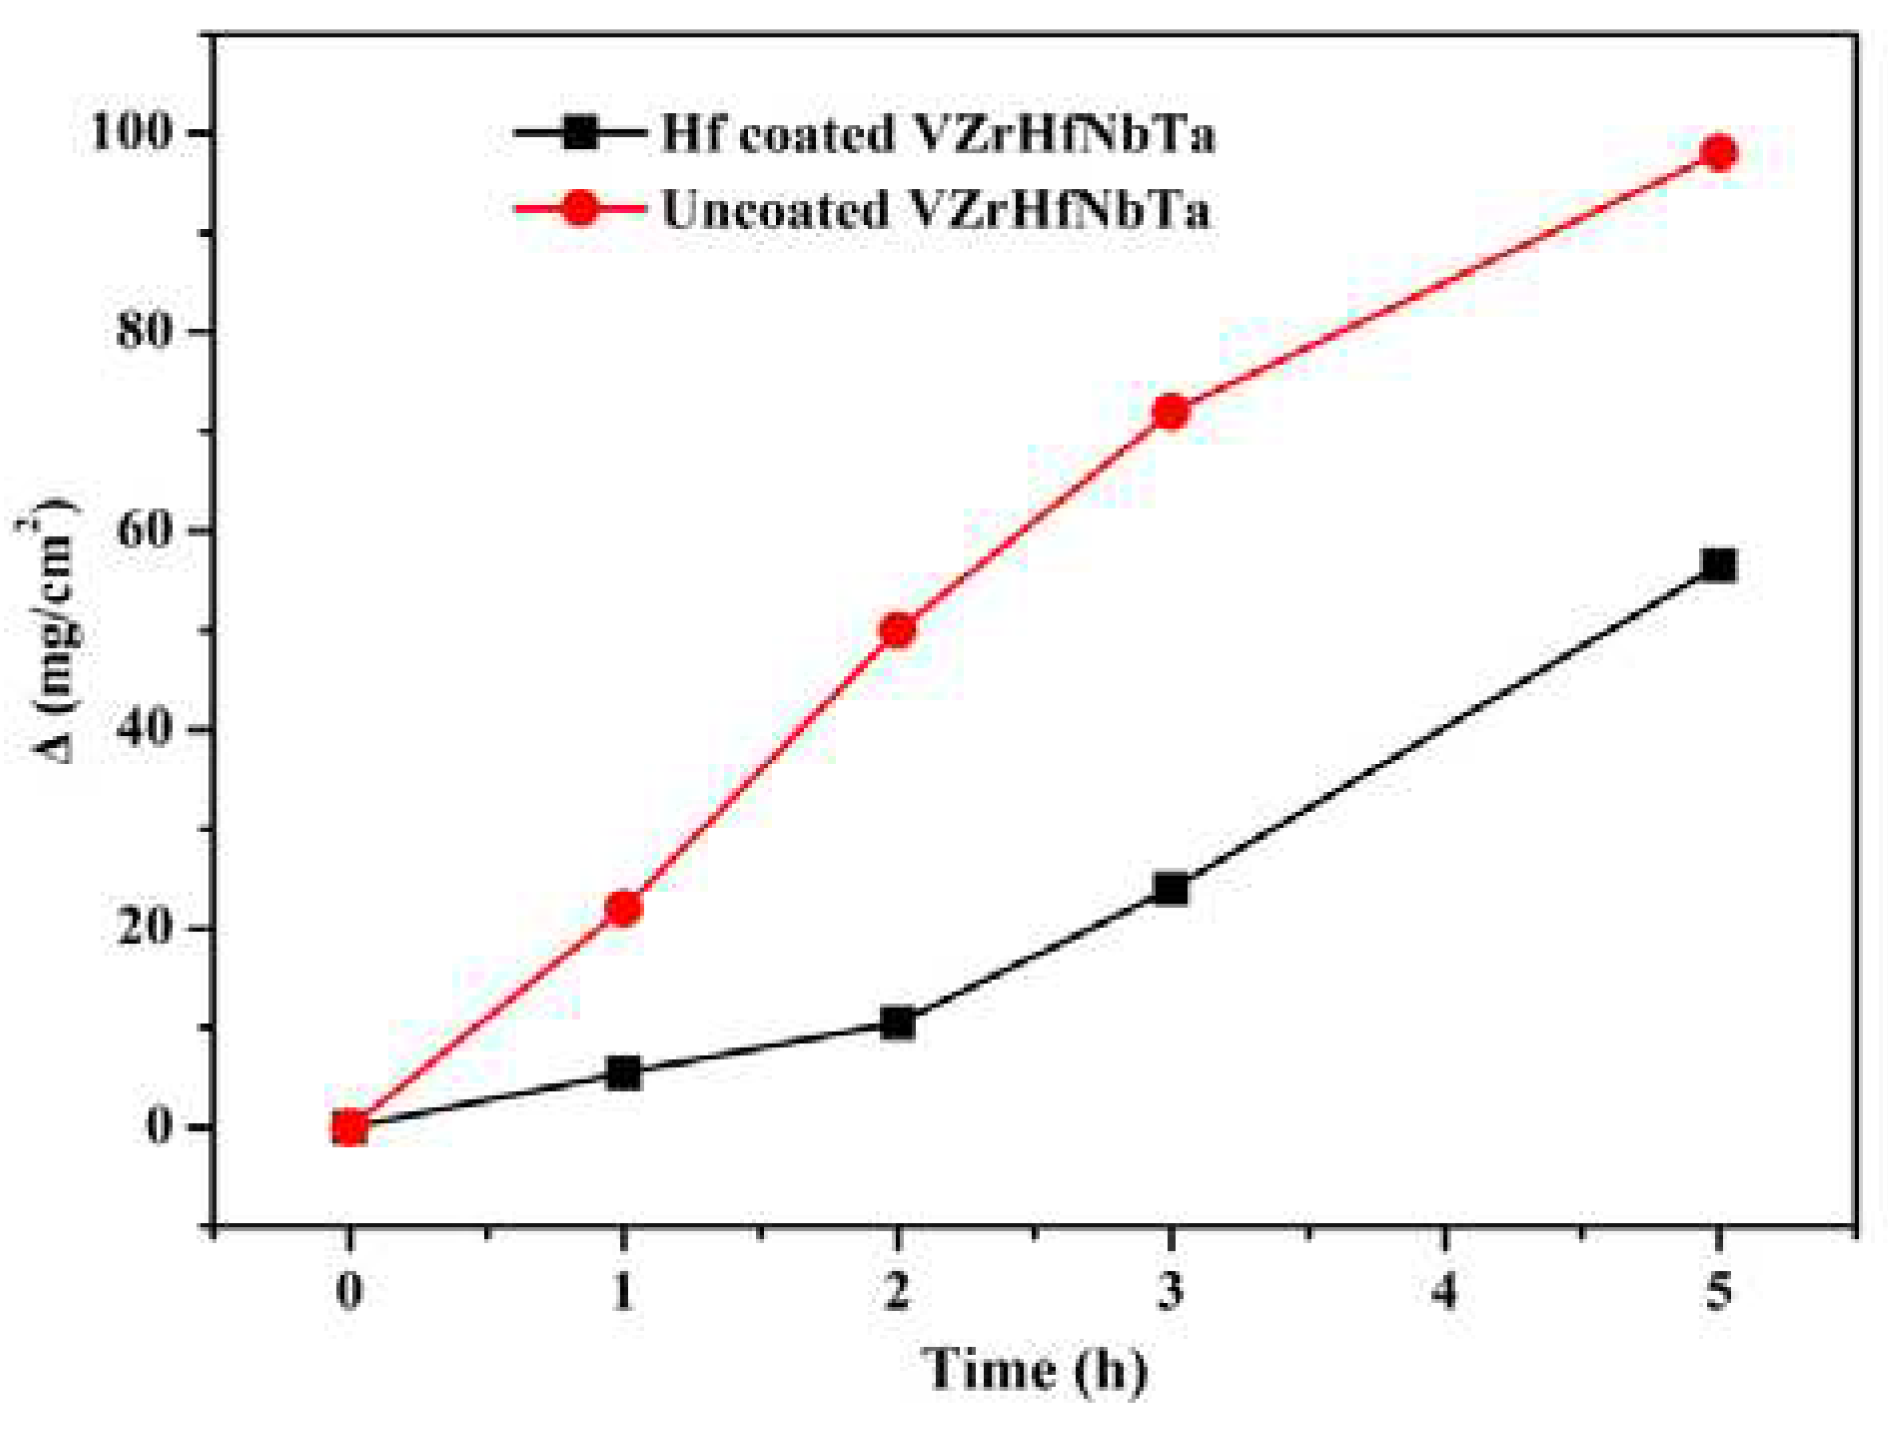
Figure 7 shows the weight change curves of the specimens with and without coating during isothermal oxidation in air at a temperature of 1873 K. With the extension of oxidation time, the rate of the sample with Hf coating weight gain increased, while the rate of the sample without Hf coating weight gain slowed down. Two samples may reach an equal weight after a long enough oxidation time, but the coated sample still has better high-temperature oxidation resistance and mechanical properties. It can be seen that the weight gain per unit area of the Hf-coated alloy is significantly smaller than that of the uncoated VZrHfNbTa alloy. As shown in
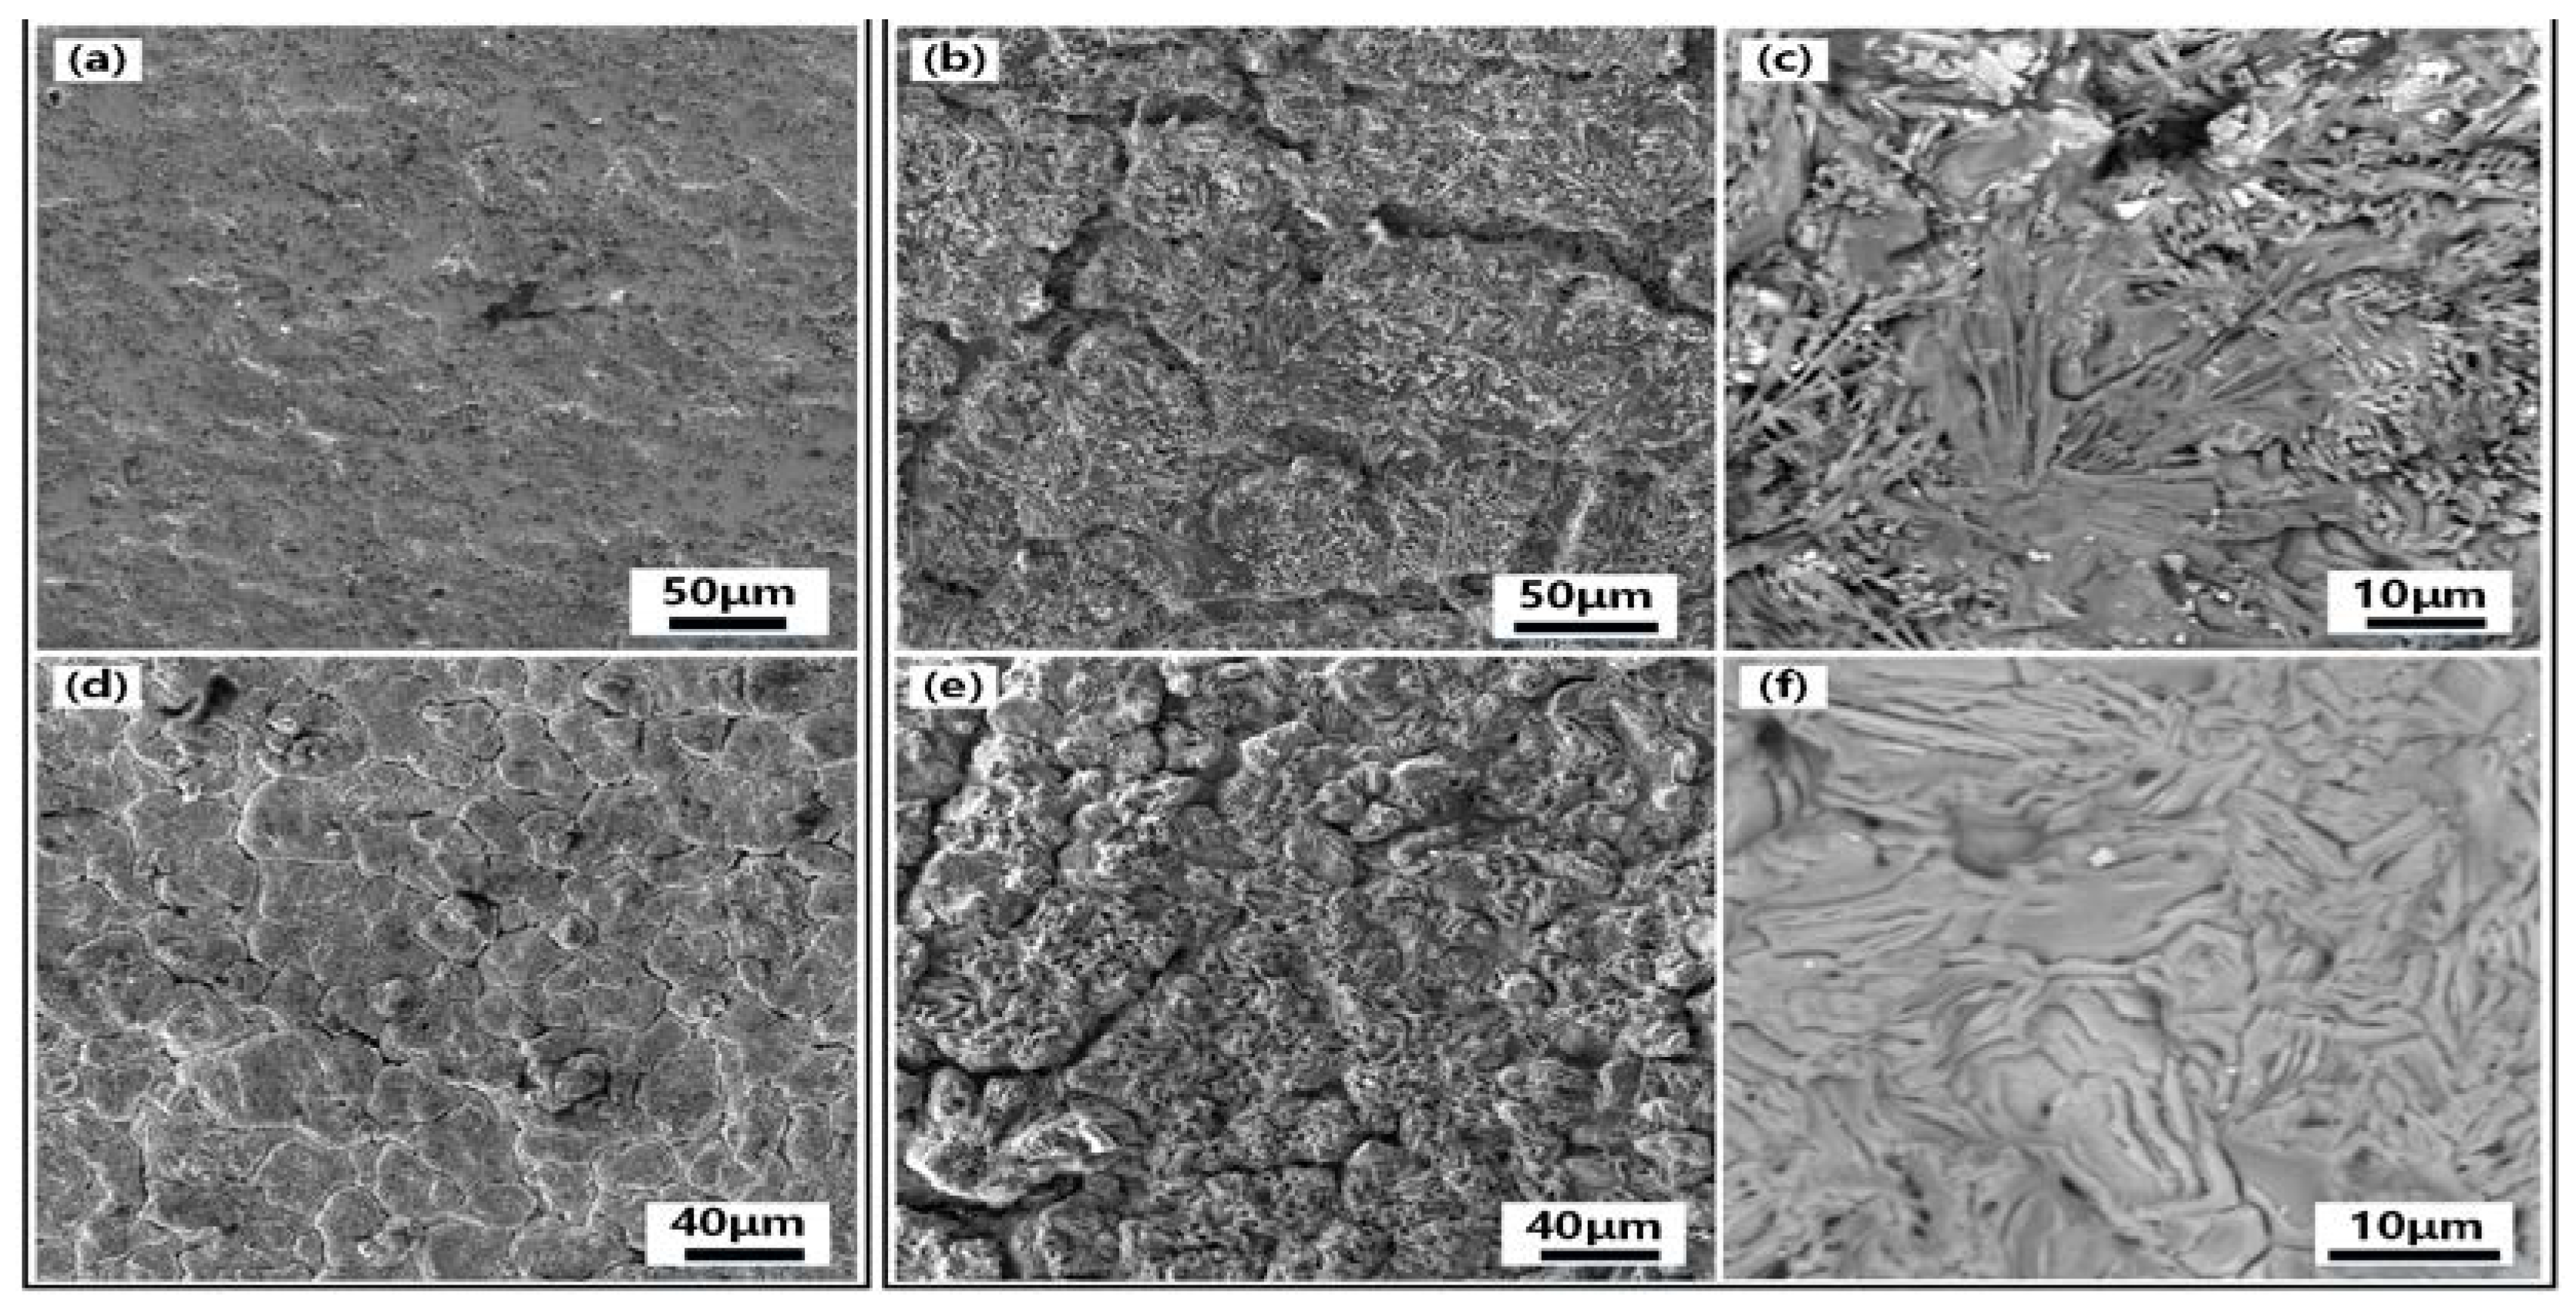
Figure 8, SEM comparisons of the surface of specimens with and without hafnium coating before and after oxidation. The surface SEM of the specimen before oxidation shows that the uncoated VZrHfNbTa alloy in
Figure 8(a) had a dense surface, in contrast, the Hf-coated specimen in
Figure 8(d) had chaps due to the sintering volume shrinkage. After oxidation for 5 h, the surface of the uncoated VZrHfNbTa alloy is shown in
Figure 8(b), it illustrates obvious dents and surface pulverization, and in
Figure 8(e), it can be observed that the Hf-coated specimen underwent obvious oxidation sintering, characterized by the disappearance of surface pulverization and appearance of ablation marks. The BSE photograph of the specimen surface at high magnification after oxidation is shown in
Figure 8(c), the surface erosion of the uncoated VZrHfNbTa alloy is obvious and different phases were produced. And the energy spectrum analysis reveals the presence of a large amount of oxygen on the surface of the alloy. This indicates that severe oxidation occurred in the VZrHfNbTa alloy, and the different oxidation degrees of the different elements led to the pulverization of the alloy surface. The surface of the Hf-coated specimen in
Figure 8(f) is dense and there is no other phase generation. The energy spectrum analysis shows that a dense HfO
2 protective layer was formed on the surface of the Hf-coated specimen after oxidation, therefore, hafnium and a minor amount of HfC in the coating were oxidized to form HfO
2 and induced a sintering reaction on the coating surface.
The specimen sections were analyzed to determine the condition of oxidation inside the two specimens.
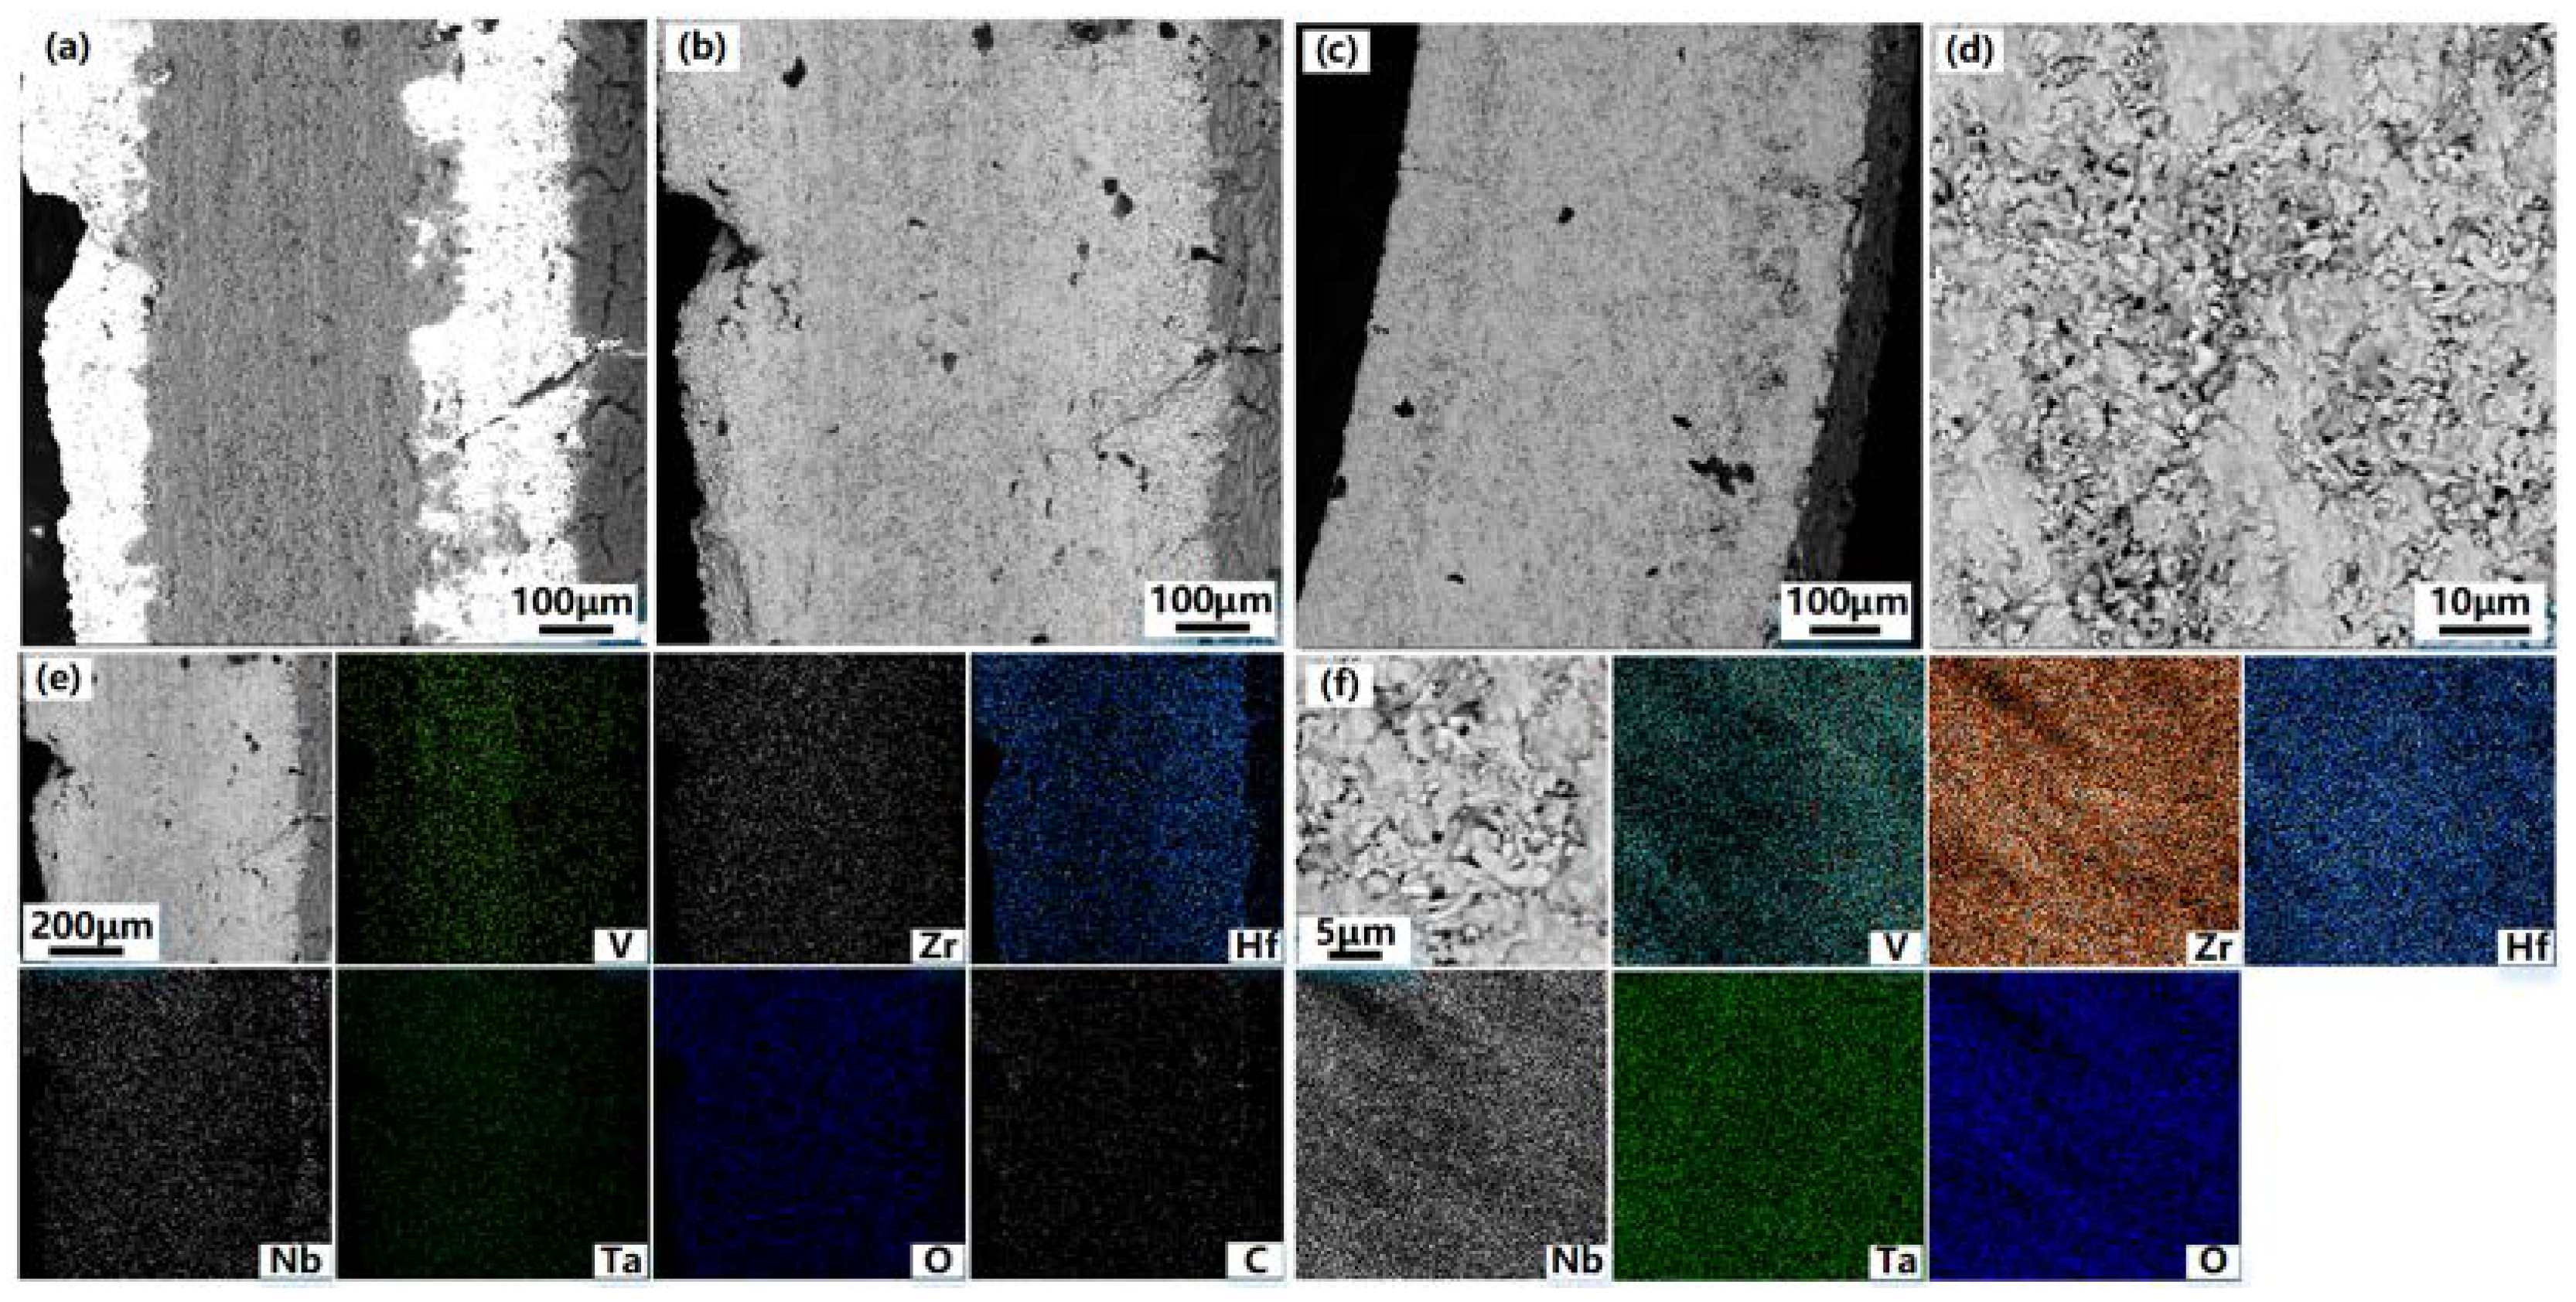
Figure 9 shows the SEM and BSE images of the coated and uncoated specimens’ cross-sections after oxidation and the respective energy spectrum analyses. From the BSE photograph of the coated specimen cross-section in
Figure 9(b), The phase difference between the substrate and the coating cannot be distinguished after oxidation for 5 h. The energy spectrum analyses in
Figure 9(e) show that almost all elements have emerged with significant diffusion and cannot be distinguished from the boundary of the coating, except vanadium, which has a clear boundary with the coating. This is due to the significant diffusion and migration of the elements within the specimen at the high temperature of 1873 K. However, the poor compatibility of vanadium with other alloying elements resulted in the slow diffusion and migration of vanadium. The distribution of oxygen elements shows that a certain degree of oxidation occurred in the overall cross-section of the coated specimen. From the high magnification BSE image of the cross-section of the uncoated specimen in
Figure 9(d), it can be seen that the interior of the alloy shows oxidation and pulverization as the same as the alloy surface. The energy spectrum analyses in
Figure 9(f) show that the internal alloy experienced severe oxidation additionally, the uncoated specimen had a notably higher oxygen content compared to the coated specimen. The surface hardness of the specimens was further compared before and after oxidation, and
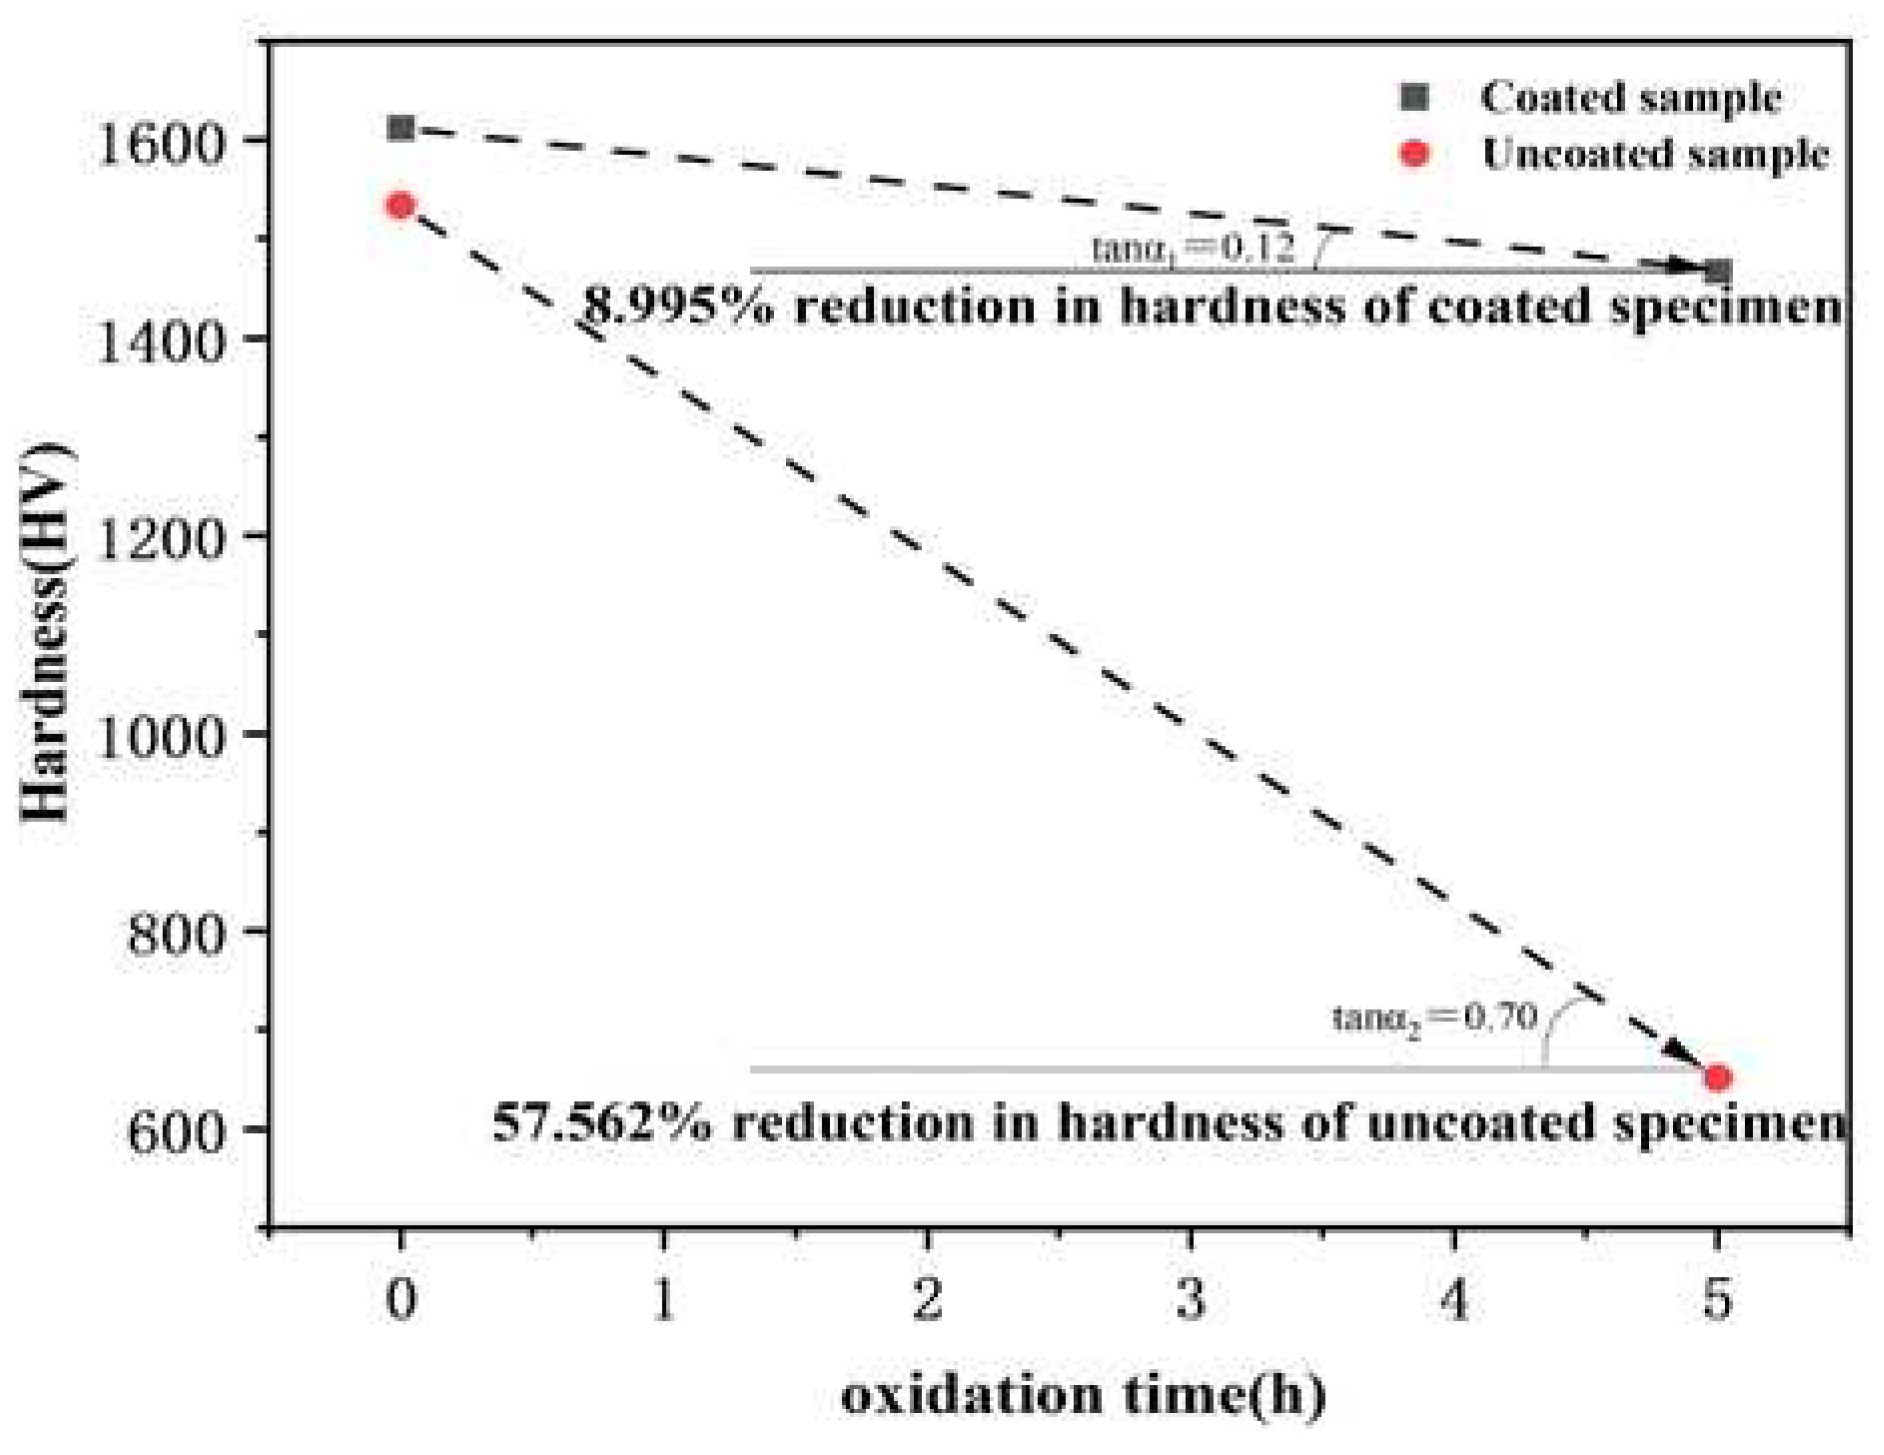
Figure 10 shows the comparison of the surface hardness of specimens with and without hafnium coating before and after oxidation. The results indicate the surface hardness of the coated specimen decreased by 145 HV, which decreased from 1612 HV before oxidation to 1467 HV after oxidation, with a reduction of 8.995 %; the surface hardness of the uncoated VZrHfNbTa HEA decreased by 883 HV, which decreased from 1534 HV before oxidation to 651 HV after oxidation, with a reduction of 57.562 %, and the specimen experienced significant deformation. This can be attributed to the oxidation and pulverization of the VZrHfNbTa HEA. And the hardness of the coated specimen changed less, possibly due to the HfC and hafnium in the coating forming a dense HfO
2 protective layer after oxidizing and sintering.
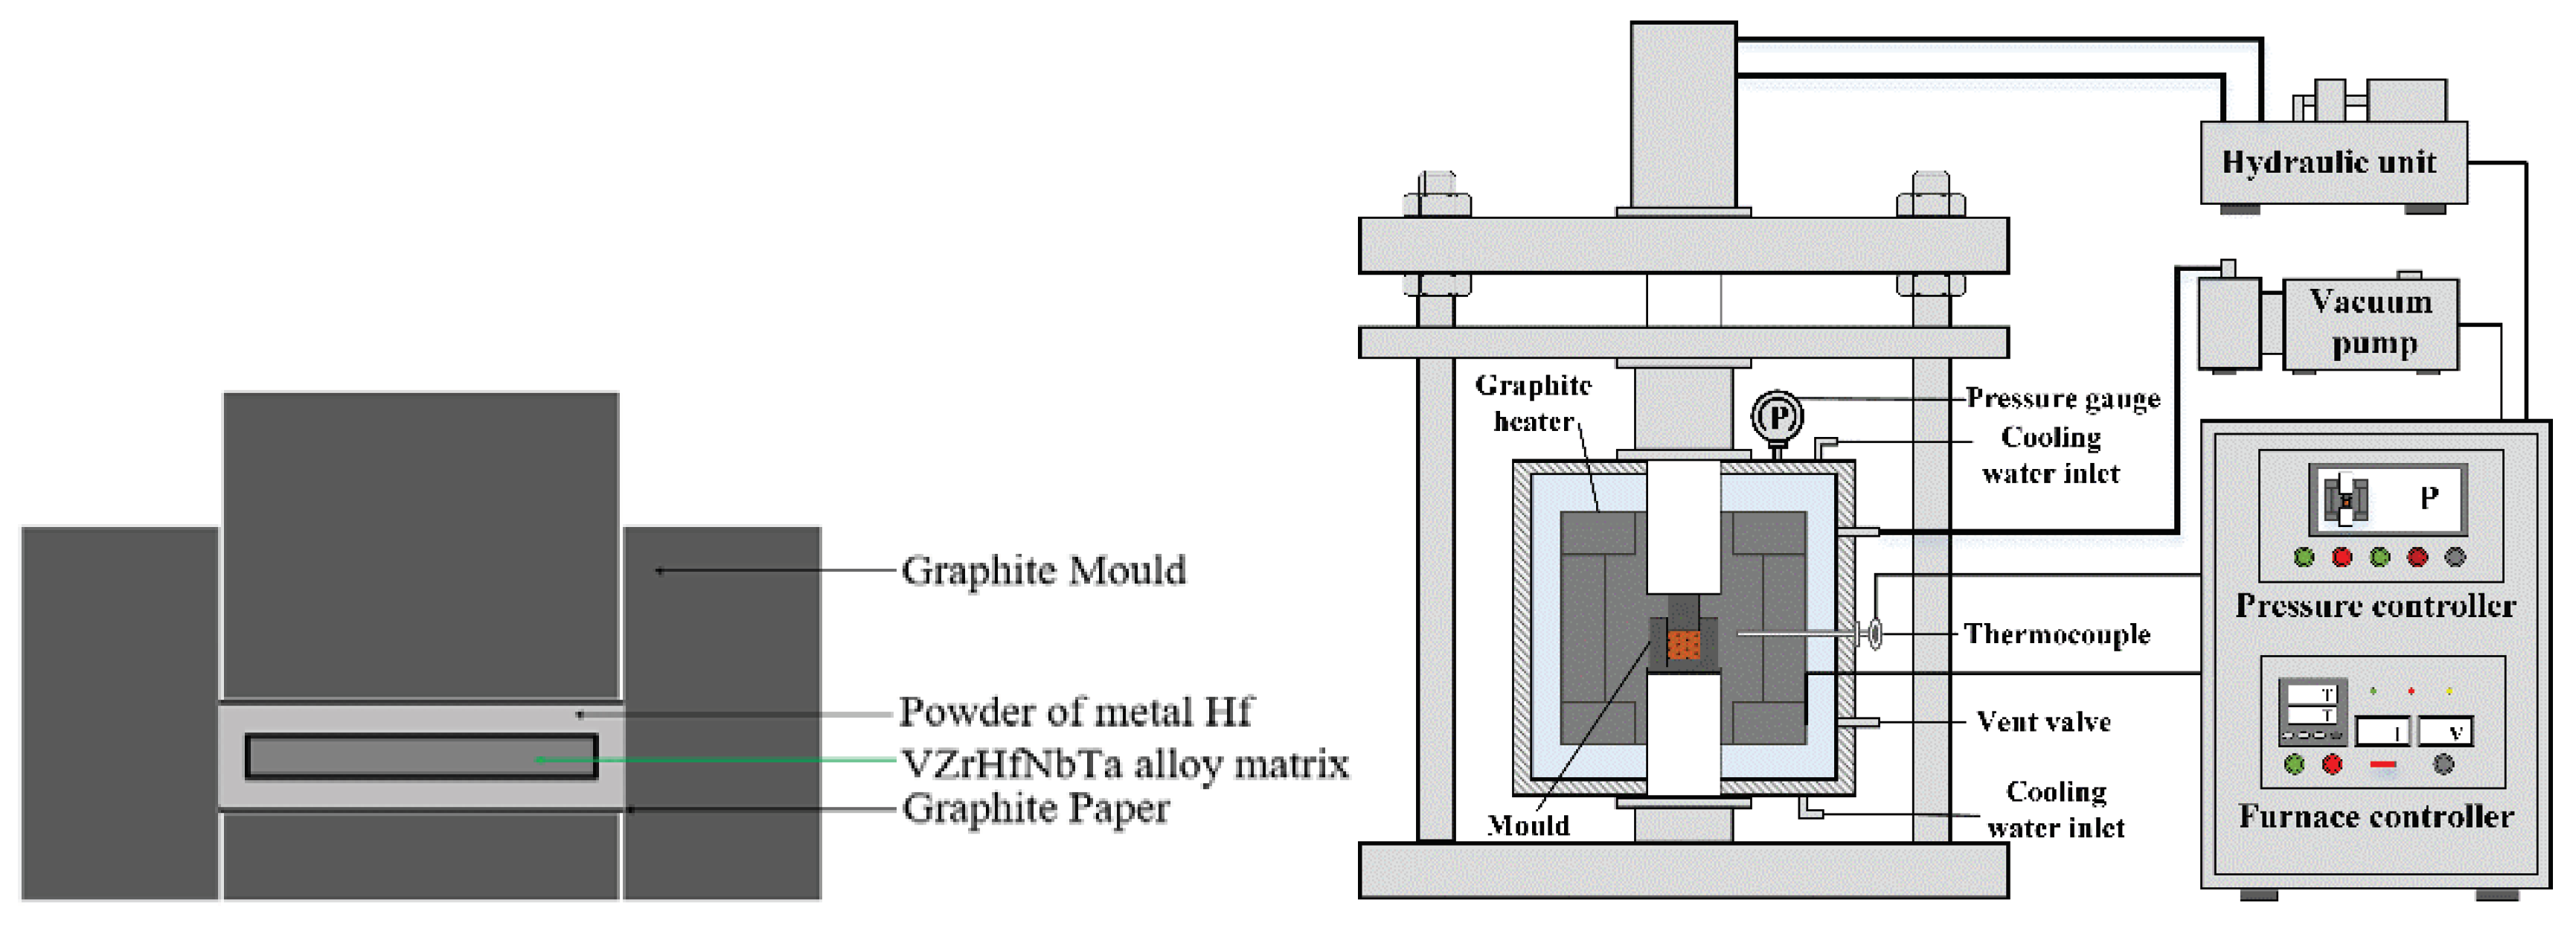
Figure 1.
Schematic diagram of coating preparation by hot-press sintering process.
Figure 1.
Schematic diagram of coating preparation by hot-press sintering process.
Figure 2.
XRD pattern of the coating of the sample prepared by the hot-press sintering process.
Figure 2.
XRD pattern of the coating of the sample prepared by the hot-press sintering process.
Figure 3.
SEM images of the coating of the sample prepared by hot-press sintering process: (a)−(d) SEM images of the coating of the sample prepared by hot-press sintering process:(a)low-magnification view of Hf coating at 50 μm;(b)low-magnification view of Hf coating at 20 μm;(c)high-magnification view of Hf coating at 5 μm;(d)high-magnification view of Hf coating at 1 μm.
Figure 4.
SEM images and EDX analysis of the cross-section of the VZrHfNbTa HEA: (a)low-magnification view of the cross-section of VZrHfNbTa high entropy alloy;(b)high-magnification view of the cross-section of the edge side of the VZrHfNbTa high entropy alloy;(c) EDX of V, Zr, Hf, Nb and Ta elements in cross sections of bulk high-entropy alloys.
Figure 5.
(a) SEM, (b) BSE images, and (c) EDX analysis of the coating sample cross-section:(a) SEM of sample cross-section of alloy substrate with Hf coating;(b)BSE of sample cross-section of alloy substrate with Hf coating;(c) EDX of V, Zr, Hf, Nb, and Ta elements in the cross-section of high entropy alloy possessing Hf coating.
Figure 6.
(a) SEM image of a cross-section of alloy sample with Hf coating. (b) BSE image and EDX image of a cross-section of alloy sample with Hf coating. (c) SEM image of Hf coating surface.
Figure 6.
(a) SEM image of a cross-section of alloy sample with Hf coating. (b) BSE image and EDX image of a cross-section of alloy sample with Hf coating. (c) SEM image of Hf coating surface.
Figure 7.
Weight change curves obtained for uncoated and coated VZrHfNbTa specimens during isothermal oxidation at 1873 K in air.
Figure 7.
Weight change curves obtained for uncoated and coated VZrHfNbTa specimens during isothermal oxidation at 1873 K in air.
Figure 8.
SEM and BSE images of uncoated specimen surface before and after oxidation and SEM and BSE images of Hf coated specimen surface before and after oxidation (a)SEM image of the surface of uncoated alloy specimen before oxidation,(b) SEM image of the surface of uncoated alloy specimen after 5 hours of oxidation,(c) high-magnification BSE image of the surface of uncoated alloy specimen after 5 hours of oxidation;, (d) – (f):,(d) SEM image of the surface of the alloy specimen with Hf coating before oxidation,(e) SEM image of the surface of the alloy specimen with Hf coating after 5 hours of oxidation,(f) High magnification BSE image of the surface of the alloy specimen with Hf coating after 5 hours of oxidation.
Figure 9.
SEM, BSE images, and EDX analyses of the coated specimen cross-section after oxidation (a) SEM image of coated specimen sections after oxidation;(b) BSE image of coated specimen sections after oxidation; (e) EDX images of individual elements of coated specimen sections after oxidation;(c d f) SEM, BSE images and EDX analyses of the uncoated specimen cross-section after oxidation.: (c) SEM image of uncoated specimen sections after oxidation;(d) high-magnification BSE image of uncoated specimen sections after oxidation; (f) EDX images of individual elements of uncoated specimen sections after oxidation.
Figure 10.
Comparison curves of surface hardness changes of coated and uncoated samples during air isothermal oxidation at 1873 K.
Figure 10.
Comparison curves of surface hardness changes of coated and uncoated samples during air isothermal oxidation at 1873 K.
Table 1.
Basic parameters of alloying elements.
Table 1.
Basic parameters of alloying elements.
| Elements |
V |
Zr |
Hf |
Nb |
Ta |
| atomic mass(g/mol) |
50.94 |
91.22 |
178.49 |
92.91 |
180.9 |
| Atomic radius(nm) |
0.132 |
0.158 |
0.159 |
0.143 |
0.147 |
| Density(g/cm3) |
5.80 |
6.49 |
13.1 |
8.55 |
16.6 |
| Melting point(K) |
2175 |
2125 |
2500 |
2740 |
3287 |
| Boiling point(K) |
3682 |
4682 |
4876 |
5017 |
5731 |
| Crystal structure(Low Temperature) |
BCC |
HCP |
HCP |
BCC |
BCC |
| Crystal structure(High temperature) |
BCC |
BCC |
BCC |
BCC |
BCC |
| Crystal structure transition temperature(K) |
— |
1135 |
2033 |
— |
— |
| Lattice constants(nm) |
0.304 |
0.361 |
— |
0.330 |
0.330 |
| Electronegativity |
1.63 |
1.33 |
1.3 |
1.6 |
1.5 |
