Submitted:
27 June 2023
Posted:
28 June 2023
You are already at the latest version
Abstract
Keywords:
1. Introduction
2. Materials and Methods
2.1. Fungal pathogen and Bio-control agents
2.2. Antagonism Assay
2.3. In vivo application of S. oryzae and its severity in plants
2.4. Seed and soil treatment
2.5. Sample collection and estimation of defense-related enzymes
2.5.1. Phenylalanine ammonia-lyase (PAL) assay
2.5.2. Peroxidase (PO) assay
2.5.3. Polyphenol oxidase (PPO) assay
2.5.4. Total phenol content (TPC) assay
2.6. Soil analysis
2.6.1. Estimation of soil chemical properties
2.6.2. Estimation of soil enzymes
2.6.2.1. Assay of dehydrogenase enzyme
2.6.2.2. Assay of phosphatases enzyme
2.6.2.3. Assay of urease enzyme
2.7. Estimation of plant nutrients analysis
2.8. Statistical analysis
3. Results
3.1. Antagonism assay
3.2. In vivo application of S. oryzae and its severity in plants
3.3. Plant growth-promotion and yield attributes
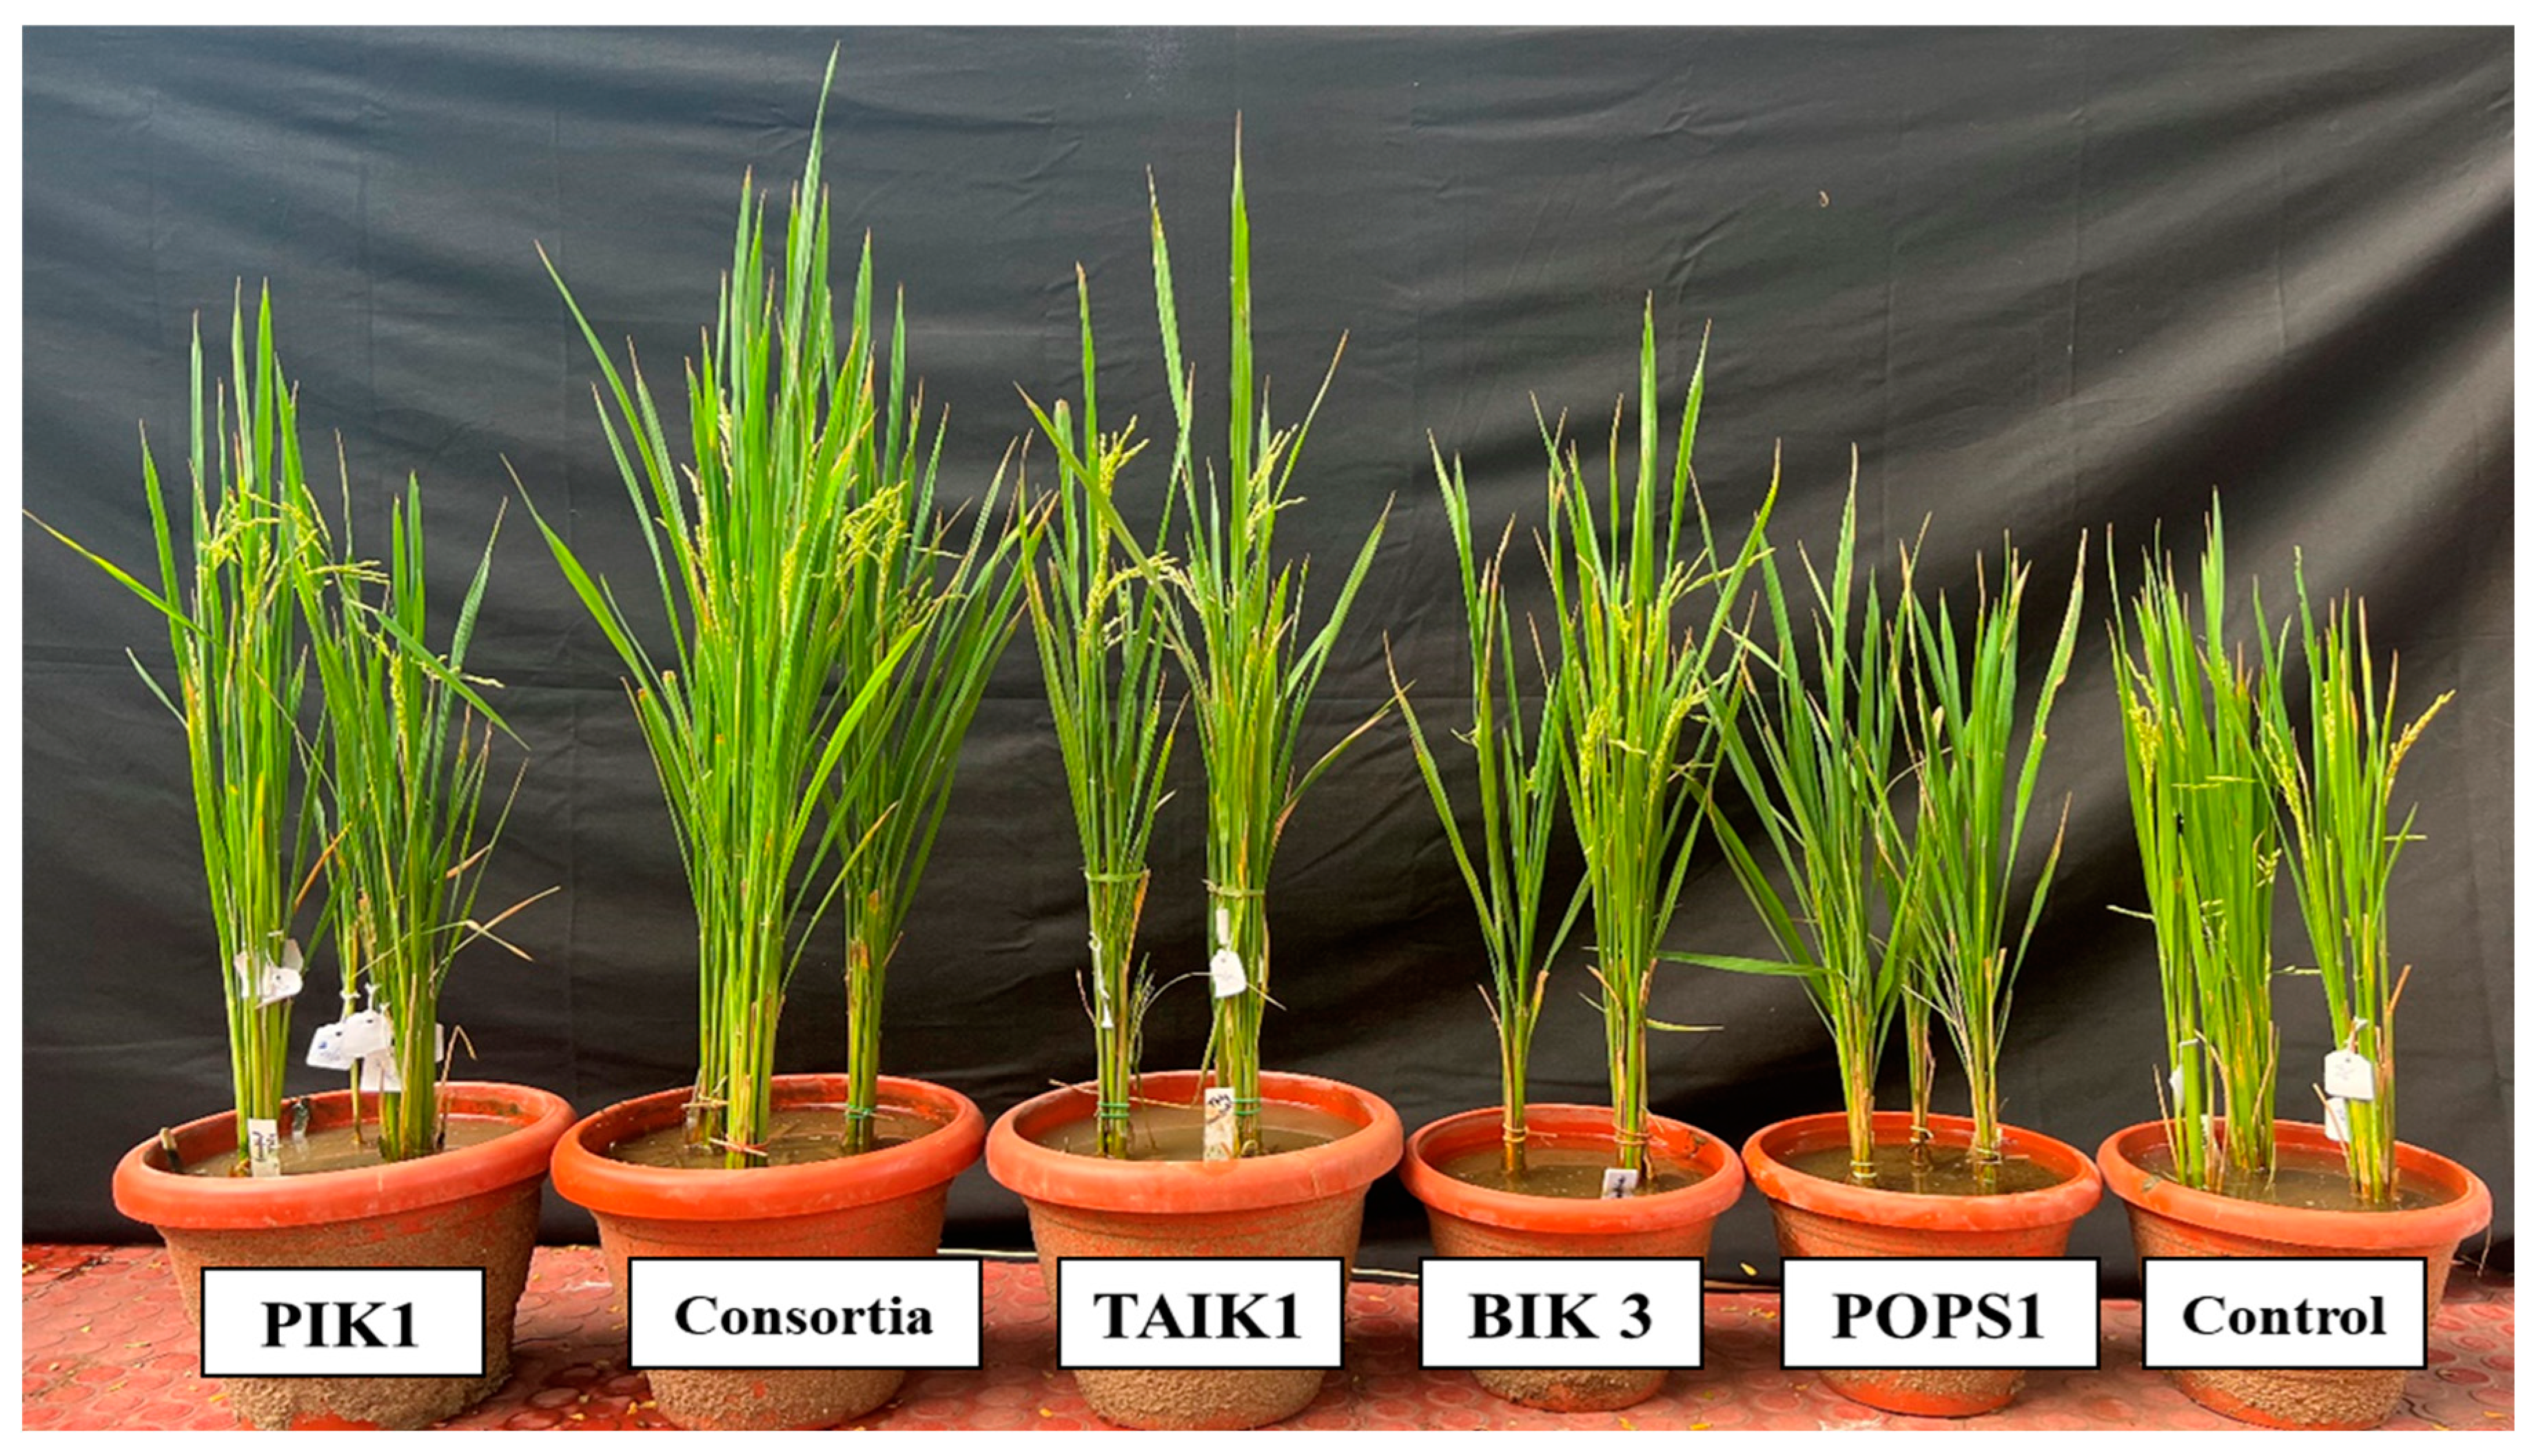
| Bioagents | Shoot Length | Root Length | Fresh Weight | Dry Weight | No. of tillers | No. of panicles | Kernel length (mm) | Kernel breadth (mm) | Panicle length (cm) | Test weight (gm) | Grain Yield /hill | PDI (%) |
|---|---|---|---|---|---|---|---|---|---|---|---|---|
| (gm) | ||||||||||||
| PIK1 | 48.77c | 31.20c | 32.20c | 10.50c | 19.82b | 8.44c | 5.80bc | 2.60ab | 22.80c | 21.50c | 16.10c | 26.38d |
| POPS 1 | 41.60e | 25.20d | 23.30e | 7.83e | 18.99c | 7.99d | 5.60cd | 2.30bc | 20.00e | 18.50e | 14.00e | 38.73b |
| BIK 3 | 44.07d | 25.77d | 26.50d | 8.93d | 19.01c | 8.11d | 5.70c | 2.40bc | 21.20d | 20.00d | 15.00d | 36.88c |
| TAIK 1 | 50.90b | 33.87b | 35.67b | 12.00b | 20.11d | 9.63b | 6.00ab | 2.70ab | 23.80b | 22.20b | 17.10b | 24.06e |
| Consortia | 58.33a | 39.03a | 41.53a | 13.57a | 22.32a | 10.50a | 6.20a | 2.90a | 25.80a | 24.10a | 19.10a | 19.32f |
| Control | 36.90f | 22.33e | 18.00f | 6.97f | 18.54d | 7.32e | 5.40d | 2.10c | 19.20f | 17.70f | 11.20f | 75.24a |
| CD | 0.358 | 0.605 | 0.196 | 0.181 | 0.361 | 0.285 | 0.067 | 0.149 | 0.088 | 0.096 | 0.306 | 2.006 |
| CV | 0.647 | 1.267 | 0.647 | 1.830 | 0.663 | 0.687 | 0.661 | 3.461 | 0.231 | 0.368 | 0.871 | 3.290 |
| SEm | 0.116 | 0.197 | 0.064 | 0.059 | 0.034 | 0.025 | 0.022 | 0.049 | 0.029 | 0.031 | 0.018 | 0.023 |
3.4. Biochemical parameters
3.5. Soil chemical properties
3.6. Soil enzymes
3.7. Plant nutrients
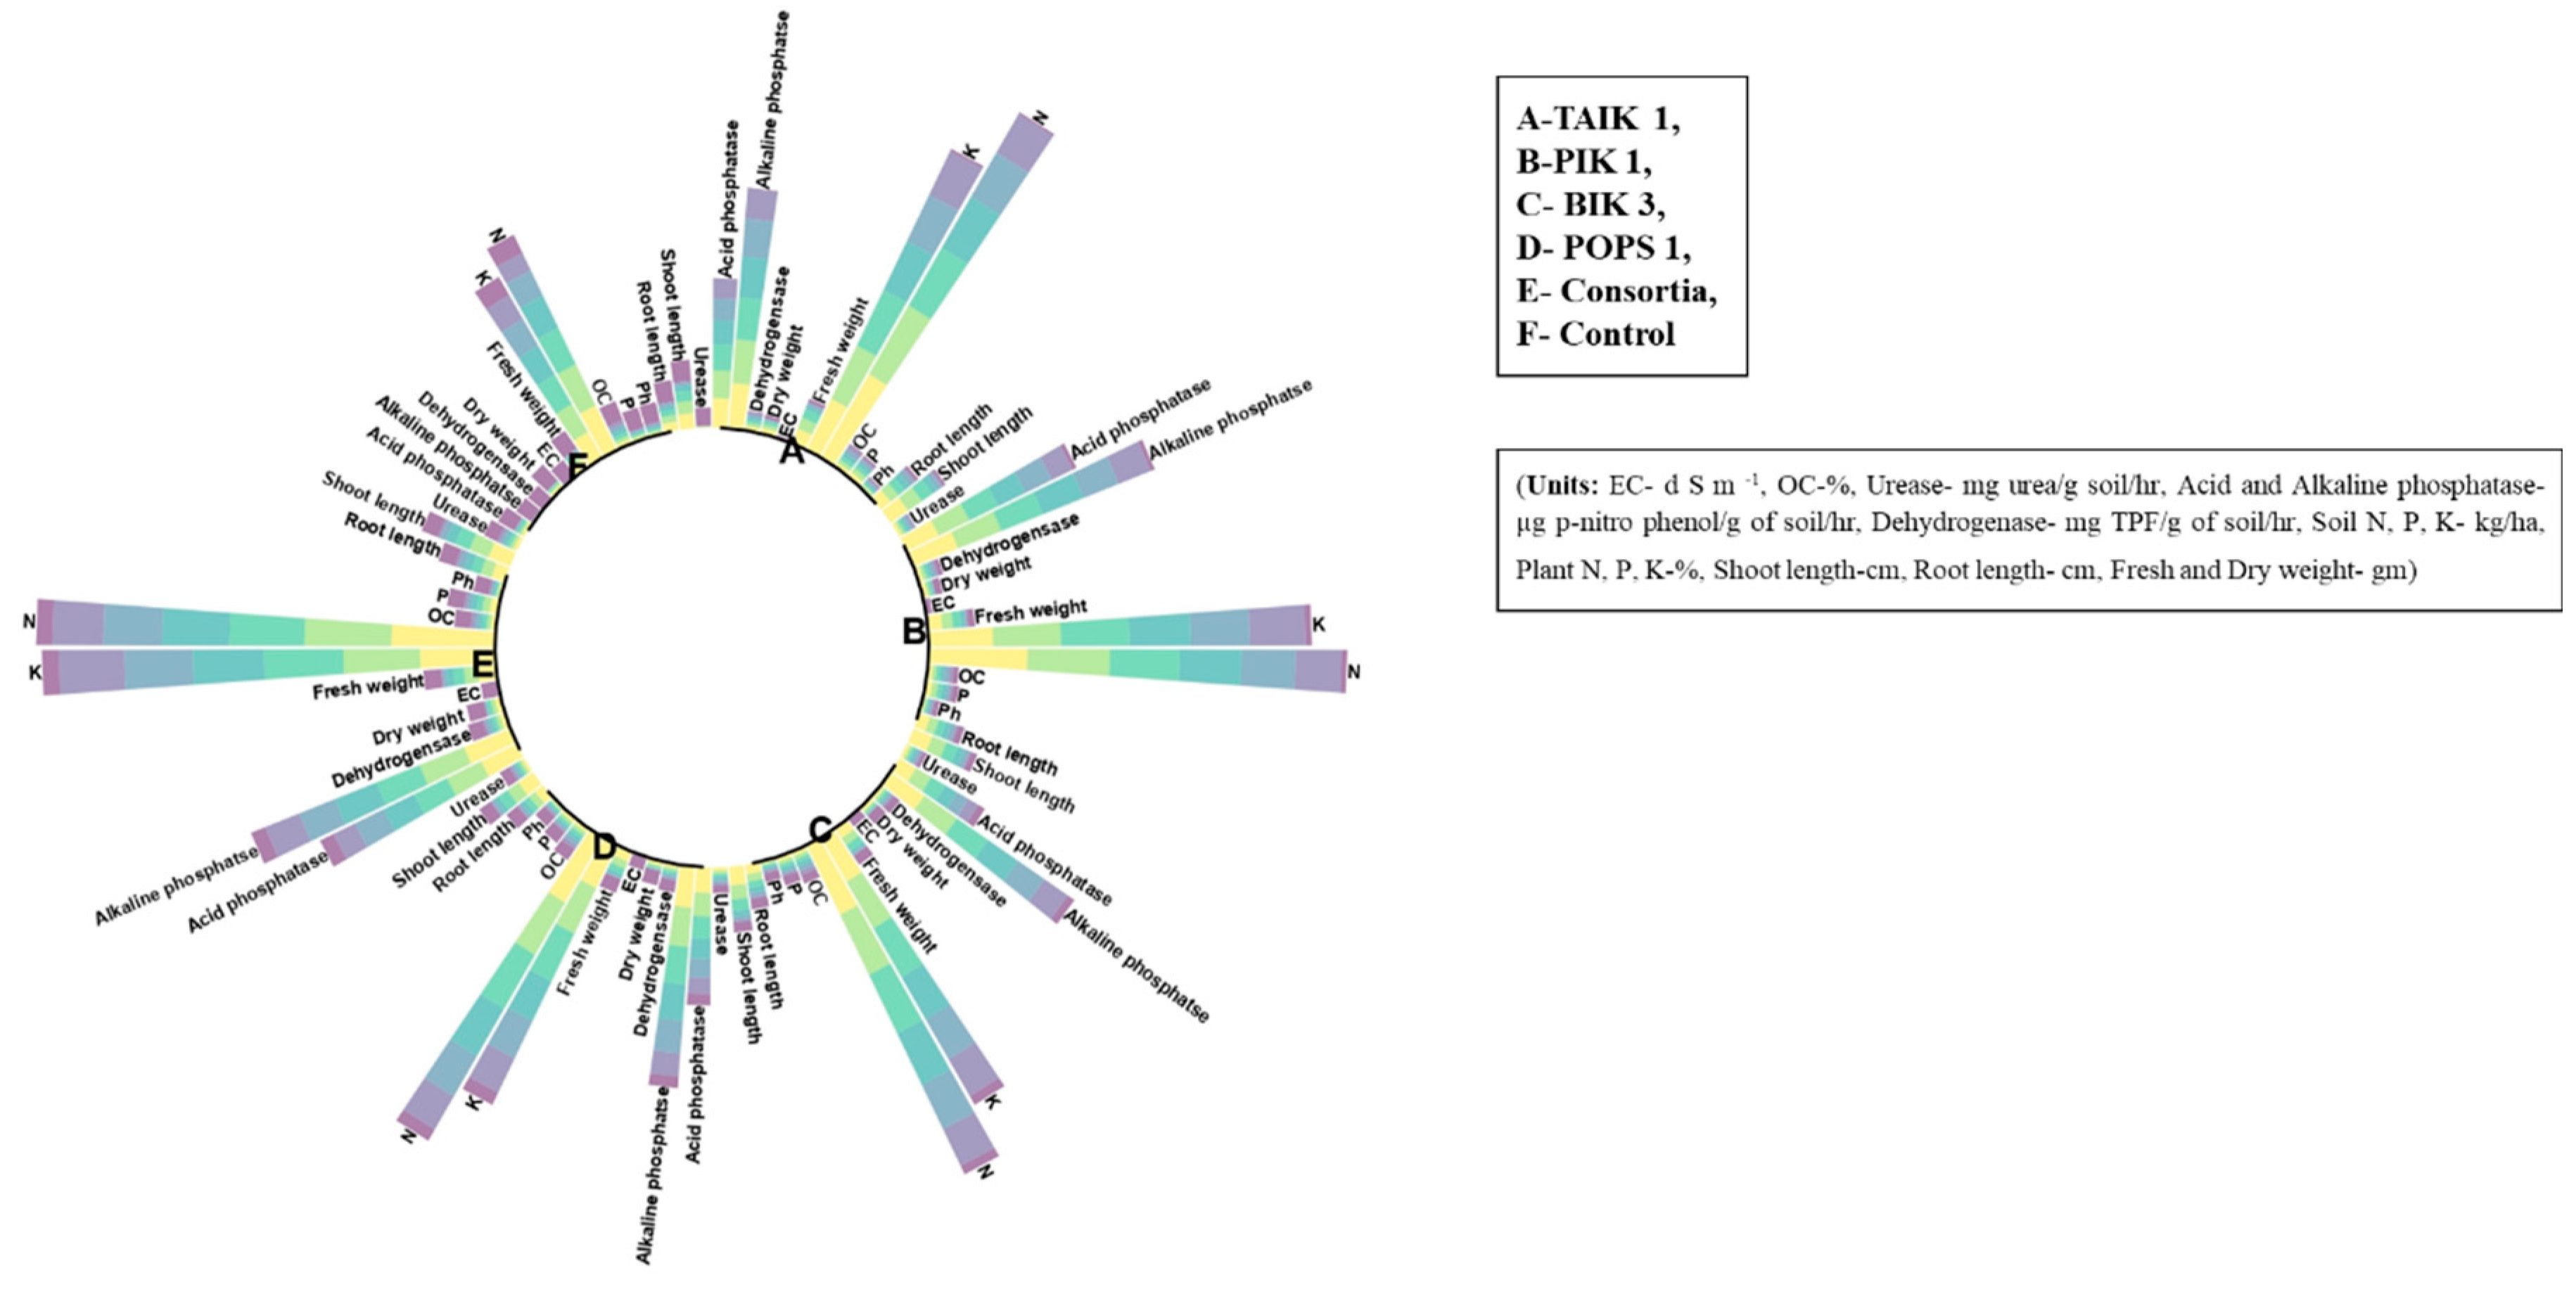
| Bioagents | Soil pH | EC | OC | Urease | Acid Phosphatase | Alkaline Phosphatase | Dehydrogenase | Soil N | Soil P | Soil K | Plant N | Plant P | Plant K |
|---|---|---|---|---|---|---|---|---|---|---|---|---|---|
| PIK1 | 8.24a | 0.75a | 0.64a | 6.18b | 1.25ab | 1.66ab | 12.96c | 283.15c | 17.06c | 216.35c | 0.41b | 0.07ab | 1.23ab |
| POPS 1 | 8.15a | 0.73a | 0.60a | 5.85c | 0.85cd | 1.42b | 11.35d | 235.21e | 12.39e | 181.72e | 0.27c | 0.04b | 1.01ab |
| BIK 3 | 8.20a | 0.74a | 0.61a | 6.10b | 0.64d | 1.46b | 11.58d | 247.63d | 14.01d | 195.27d | 0.38b | 0.05ab | 1.10ab |
| TAIK 1 | 8.25a | 0.75a | 0.65a | 6.32b | 1.00bc | 1.67ab | 14.60b | 297.67b | 19.67b | 249.42b | 0.47b | 0.08ab | 0.93b |
| Consortia | 8.28a | 0.76a | 0.68a | 7.33a | 1.39a | 1.78a | 16.44a | 315.82a | 24.91a | 288.28a | 0.58a | 0.11a | 1.58a |
| Control | 8.08a | 0.72a | 0.57b | 0.73d | 0.09e | 0.90c | 0.14e | 155.18f | 7.87f | 121.29f | 0.21c | 0.02b | 0.76c |
| CD | 0.023 | 0.028 | 0.268 | 0.057 | 0.070 | 0.074 | 0.111 | 0.024 | 0.002 | 0.772 | 0.009 | 0.001 | 1.952 |
| CV | 1.578 | 1.926 | 1.360 | 2.727 | 1.335 | 1.960 | 9.548 | 0.352 | 1.993 | 2.430 | 1.342 | 5.914 | 2.564 |
| SEm | 0.075 | 0.008 | 0.127 | 0.018 | 0.022 | 0.024 | 0.035 | 0.008 | 0.001 | 0.252 | 0.003 | 0.001 | 0.638 |
3.8. Correlation analysis
3.9. Stepwise regression analysis
3.10. PCA analysis
4. Discussion
5. Conclusions
Author Contributions
Funding
Institutional Review Board Statement
Informed Consent Statement
Data Availability Statement
Acknowledgments
Conflicts of Interest
References
- Neher, D.A. Soil community composition and ecosystem processes: comparing agricultural ecosystems with natural ecosystems. Agrofor. Systems 1999, 45, 159–185. [Google Scholar] [CrossRef]
- Raj, A.; Jhariya, M.K.; Yadav, D.K.; Banerjee, A.; Meena, R.S. Soil for sustainable environment and ecosystems management. Sustainable agriculture, forest and environmental management 2019, 189–121. [Google Scholar]
- Fan, K.; Chu, H.; Eldridge, D.J.; Gaitan, J.J.; Liu, Y.R.; Sokoya, B.; Wang, J.T.; Hu, H.W.; He, J.Z.; Sun, W.; Cui, H. Soil biodiversity supports the delivery of multiple ecosystem functions in urban greenspaces. Nature Ecol. Evol. 2023, 7, 113–126. [Google Scholar] [CrossRef]
- Chaparro, J.M.; Sheflin, A.M.; Manter, D.K.; Vivanco, J.M. Manipulating the soil microbiome to increase soil health and plant fertility. Biol. Fertil Soils 2012, 48, 489–499. [Google Scholar] [CrossRef]
- Else, K.B.; Giulia, B.; Zhanguo, B.; Rachel, E.C.; Gerlinde, D.D.; Ron, G.; Luuk, F.; Violette, G.; Thom Erdel, E.; Simsek, U.; Kesimci, T.G. Effects of Fungi on Soil Organic Carbon and Soil Enzyme Activity under Agricultural and Pasture Land of Eastern Türkiye. Sustainability 2023, 15, 1765. [Google Scholar]
- Nikita, B.; Puneet, S.C. Excessive and Disproportionate Use of Chemicals Cause Soil Contamination and Nutritional. 2020. [Google Scholar] [CrossRef]
- Jagaba, A.H.; Kutty, S.R.M.; Isa, M.H.; Ghaleb, A.A.S.; Lawal, I.M.; Usman, A.K.; Birniwa, A.H.; Noor, A.; Abubakar, S.; Umaru, I.; Saeed, A.A.H. Toxic effects of xenobiotic compounds on the microbial community of activated sludge. Chem. Bio. Eng. Reviews 2022, 9, 497–535. [Google Scholar] [CrossRef]
- Punam, K.; Mukesh, M.; Pooja, G.; Manish, K.D.; Gopal, N.; Upadhyay, R.S. Plant growth promoting rhizobacteria and their biopriming for growth promotion in mung bean (Vigna radiata (L.) R. Wilczek). Biocatal. Agric. Biotechnol. 2018, 16, 163–171. [Google Scholar]
- Kumar, S.; Chandra, R.; Behera, L.; Keswani, C.; Sansinenea, E. Dual Trichoderma consortium mediated elevation of systemic defense response against early blight in potato. Eur. J. Plant Pathol. 2021, 162, 681–696. [Google Scholar] [CrossRef]
- de Andrade, L.A.; Santos, C.H.B.; Frezarin, E.T.; Sales, L.R.; Rigobelo, E.C. Plant growth-promoting rhizobacteria for sustainable agricultural production. Microorganisms 2023, 11, 1088. [Google Scholar] [CrossRef]
- Kumari, S.; Bharat, N.K.; Thakur, A.K. Role of plant growth-promoting rhizobacteria (PGPR) and bio-control agents (BCAs) in crop production. Int. J. Economic Plants 2020, 7, 144–150. [Google Scholar] [CrossRef]
- Mishra, R.K.; Sahu, P.K.; Mishra, V.; Jamal, H.; Varma, A.; Tripathi, S. Isolation and characterization of halotolerant plant growth promoting rhizobacteria from mangrove region of Sundarbans, India for enhanced crop productivity. Front. Plant Sci. 2023, 14, 1122347. [Google Scholar]
- Neina, D. The role of soil pH in plant nutrition and soil remediation. Appl. Env. Soil Sci. 2019, 1–9. [Google Scholar] [CrossRef]
- Shah, K.K.; Tripathi, S.; Tiwari, I.; Shrestha, J.; Modi, B.; Paudel, N.; Das, B.D. Role of soil microbes in sustainable crop production and soil health: A review. Agricul. Sci. Technol. 2021, 13, 1313–1336. [Google Scholar] [CrossRef]
- Pooja, S.; Rajesh, K. Soil salinity: A serious environmental issue and plant growth promoting bacteria as one of the tools for its alleviation. Saudi J. Biol. Sci. 2015, 22, 123–131. [Google Scholar]
- Chandran, H.; Meena, M.; Swapnil, P. Plant growth-promoting rhizobacteria as a green alternative for sustainable agriculture. Sustainability 2021, 13, 10986. [Google Scholar] [CrossRef]
- Muhammad, I.R.; Liyakat, H.M.; Tanvir, S.; Talal, A.; Iqbal, M.I.; Ismail, M.O. Bacteria and fungi can contribute to nutrients bioavailability and aggregate formation in degraded soils. Microbiol. Res. 2016, 183, 26–41. [Google Scholar]
- Singh, D.P.; Prabha, R.; Renu, S.; Sahu, P.K.; Singh, V. Agrowaste bioconversion and microbial fortification have prospects for soil health, crop productivity, and eco-enterprising. Int. J. Recycling Organic Waste Agricul. 2019, 8, 457–472. [Google Scholar] [CrossRef]
- Shen, H.; He, X.; Liu, Y.; Chen, Y.; Tang, J.; Guo, T. A Complex Inoculant of N2-Fixing, P- and K-Solubilizing Bacteria from a Purple Soil Improves the Growth of Kiwifruit (Actinidia chinensis) Plantlets. Front. Microbiol. 2016, 7, 841. [Google Scholar] [CrossRef]
- Meena, V.S.; Meena, S.K.; Verma, J.P.; Kumar, A.; Aeron, A.; Mishra, P.K.; Bisht, J.K.; Pattanayak, A.; Naveed, M.; Dotaniya, M.L. Plant beneficial rhizospheric microorganism (PBRM) strategies to improve nutrients use efficiency: a review. Ecol. Engineering 2017, 107, 8–32. [Google Scholar] [CrossRef]
- Gopika, K.; Jagadeeshwar, R.; Rao, V.K.; Vijayalakshmi, K. An overview of stem rot disease of rice (Sclerotium oryzae catt.) and its comprehensive management. Int. J. Appl. Biol. Pharml. Technol. 2016, 7, 111–124. [Google Scholar]
- Pramesh, D.; Alase, S.; Muniraju, K.M.; Kumara, M.K. A combination fungicide for the management of sheath blight, sheath rot and stem rot diseases of paddy. Int. J. Current Microbiol. Appl. Sci. 2017, 6, 3500–3509. [Google Scholar]
- Bashyal, B.M.; Parmar, P.; Zaidi, N.W.; Sunil, K.S.; Prakash, G.; Rashmi, A. Improved methodology for the isolation of false smut pathogen Ustilaginoidea virens of rice. Indian Phytopathol. 2021, 74, 249–252. [Google Scholar] [CrossRef]
- Sinclair, J.B.; Dhingra, O.D. Basic Plant Pathology Methods. CRC Press: Boca Raton, 2017; pp. 287–300. [Google Scholar]
- Gangwar, G.P.; Sinha, A.P. Comparative antagonistic potential of Trichoderma spp. against Xanthomonas oryzae pv. oryzae. Ann. Plant Sci. 2010, 8, 458–463. [Google Scholar]
- Kumar, V.; Singh, R.; Jalali, B.L. Evaluation of resistance to stem rot and yield losses caused by the disease in rice. Indian Phytopathol. 2003, 4, 403–407. [Google Scholar]
- IRRI. Standard Evaluation System for Rice, International Rice Research Institute, Los Banos, Manila, Philippines. 2002, p. 24. Available online: http://www.knowledgebank.irri.org/images/docs/rice-standard-evaluation-system.pdf.
- Brueske, C.H. Phenylalanine ammonia lyase activity in tomato roots infected and resistant to the root-knot nematode, Meloidogyne incognita. Physiol. Plant Pathol. 1980, 16, 409–414. [Google Scholar] [CrossRef]
- Hammerschmidt, R.; Nuckles, E.M.; Kuc, J. Association of enhanced peroxidase activity with induced systemic resistance of cucumber to Colletotrichum lagenarium. Physiol. Plant Pathol. 1982, 20, 73–82. [Google Scholar] [CrossRef]
- Gauillard, F.; Richardforget, F.; Nicolas, J. New spectrophotometric assay for polyphenol oxidase activity. Anal. Biochem. 1993, 215, 59–65. [Google Scholar] [CrossRef] [PubMed]
- Malick, C.P.; Singh, M.B. Plant Enzymology and Histo Enzymology; Kalyani Publishers: New Delhi, India, 1980; p. 289. [Google Scholar]
- McLean, E.O. Soil pH and lime requirement. In Methods of Soil Analysis: Part 2 Chemical and Microbiological Properties; 1983; Volume 9, pp. 199–224. [Google Scholar]
- Rhoades, J.D. Soluble Salts. In Methods of Soil Analysis: Part 2 Chemical and Microbiological Properties; Agronomy Monographs; American Society of Agronomy: Madison, WI, USA, 1983; pp. 167–179. [Google Scholar]
- Walkley, A.; Black, L.A. An examination of the Degtjareff method for determining soil organic matter, and a proposed modification of the chromic acid titration method. Soil Sci. 1934, 37, 29–38. [Google Scholar] [CrossRef]
- Subbaiah, B.V. A rapid procedure for estimation of available nitrogen in soil. Curr. Sci. 1956, 25, 259–260. [Google Scholar]
- Watanabe, F.S.; Olsen, S.R. Test of an ascorbic acid method for determining phosphorus in water and NaHCO3 extracts from soil. Soil Sci. Soc. Am. J. 1965, 29, 677–678. [Google Scholar] [CrossRef]
- Muhr, G.R. Soil Testing in India; USAID Mission to India: New Delhi, India, 1965; p. 120. [Google Scholar]
- Casida, J.L.E.; Klein, D.A.; Santoro, T. Soil dehydrogenase activity. Soil Sci. 1964, 98, 371–376. [Google Scholar] [CrossRef]
- Tabatabai, M.A.; Bremner, J.M. Use of p-nitrophenyl phosphate for assay of soil phosphatase activity. Soil. Biol. Biochem. 1969, 1, 301–307. [Google Scholar] [CrossRef]
- Eivazi, F.; Tabatabai, M.A. Phosphatases in soils. Soil Biol. Biochem. 1977, 9, 167–172. [Google Scholar] [CrossRef]
- Piper, C.S. Vanado-Molybdo-Phosphoric Yellow Colour Method. Soil Sci. Plant Anal. 1966, 368. [Google Scholar]
- Bhargava, B.S.; Raghupathi, H.B. Analysis of plant materials for macro and micronutrients. Methods of analysis of soils, plants, water and fertilizers 1993, 49–82. [Google Scholar]
- Husson, F.; Josse, J.; Le, S.; Mazet, J. FactoMineR: multivariate exploratory data analysis and data mining. 2020. Available online: https://CRAN.R-project.org/package=FactoMineR.
- Kassambara, A.; Mundt, F. Factoextra: Extract and visualize the results of multivariate data analyses, R package v. 1.0.7. 2020.
- Kannan, C.; Divya, M.; Rekha, G.; Maruthi, P.; Hajira, S.; Sundaram, R.M. Diversity analysis of antagonistic microbes against bacterial leaf and fungal sheath blight diseases of rice. Egypt. J. Biol. Pest Cont. 2021, 31, 115. [Google Scholar] [CrossRef]
- Nawaz, M.E.; Malik, K.; Hassan, M.N. Rice-associated antagonistic bacteria suppress the Fusarium fujikoroi causing rice bakanae disease. Biol. Cont. 2022, 67, 101–109. [Google Scholar] [CrossRef]
- Caulier, S.; Nannan, C.; Gillis, A.; Licciardi, F.; Bragard, C.; Mahillon, J. Overview of the Antimicrobial Compounds Produced by Members of the Bacillus subtilis group. Front. Microbiol. 2019, 10, 003. [Google Scholar] [CrossRef] [PubMed]
- Adrien, B.; Martin, F. Phenazines in plant-beneficial Pseudomonas spp. biosynthesis, regulation, function and genomics. Environ. Microbiol. 2018, 20, 3905–3917. [Google Scholar]
- Pandit, M.A.; Kumar, J.; Gulati, S.; Bhandari, N.; Mehta, P.; Katyal, R.; Rawat, C.D.; Mishra, V.; Kaur, J. Major Biological Control Strategies for Plant Pathogens. Pathogens 2022, 11, 273. [Google Scholar] [CrossRef] [PubMed]
- Moubark, M.Y.; Abdel-Monaim, M.F. Effect of bio-control agents on yield, yield components and root rot control in two wheat cultivars at New Valley region. Not. Sci. Biol. 2011, 3, 79–87. [Google Scholar] [CrossRef]
- Ivica, D.; Tamara, J.; Marija, P.; Giuliano, D.; Djordje, F. Plant-associated Bacillus and Pseudomonas antimicrobial activities in plant disease suppression via biological control mechanisms—A review. Physiol. Mol. Plant Pathol. 2022, 117, 101754. [Google Scholar]
- Stuti, S.; Shweena, K.; Rajni, S. Pseudomonas mediated nutritional and growth promotional activities for sustainable food security. Microbiol. Curr. Res. 2021, 2, 2666–5174. [Google Scholar]
- Tian, J.; Ge, F.; Zhang, D.; Deng, S.; Liu, X. Roles of Phosphate Solubilizing Microorganisms from Managing Soil Phosphorus Deficiency to Mediating Biogeochemical P Cycle. Biol. J. 2021, 10, 158. [Google Scholar] [CrossRef]
- Sowmya, V.; Raja Gopalan, N.S.; Maruthi, P.; Baskar, M.; Umadevi, G.; Ladha lakshmi, D.; Koteshwar, P.; Jesudasu, G.; Rathod, S.; Srinivas Prasad, M.; et al. Native bio-control agents from the rice fields of Telangana, India: Characterization and unveiling the potential against stem rot and false smut diseases of rice. World J Microbiol Biotechnol. 2023, in press.
- Mukherjee, M.; Mukherjee, P.K.; Horwitz, B.A.; Zachow, C.; Berg, G.; Zeilinger, S. Trichoderma-plant-pathogen interactions: advances in genetics of biological control. Indian J. Microbiol. 2012, 52, 522–529. [Google Scholar] [CrossRef] [PubMed]
- Singh, J.S.; Koushal, S.; Kumar, A.; Vimal, S.R.; Gupta, V.K. Book review: microbial inoculants in sustainable agricultural Productivity—Vol. II: functional application. Microbiology 2016, 7, 7. [Google Scholar] [CrossRef]
- Halifu, S.; Deng, X.; Song, X.; Song, R.; Liang, X. Inhibitory mechanism of Trichoderma virens ZT05 on Rhizoctonia solani. Plants 2020, 9, 912. [Google Scholar] [CrossRef] [PubMed]
- Rais, A.; Jabeen, Z.; Shair, F.; Hafeez, F.; Hassan, M. Bacillus spp. a bio-control agent enhances the activity of antioxidant defense enzymes in rice against Pyricularia oryzae. PLoS ONE 2017, 12, e0187412. [Google Scholar] [CrossRef]
- Wiesel, L.; Newton, A.C.; Elliott, I.; Booty, D.; Gilroy, E.M.; Birch, P.R.J.; Hein, I. Molecular effects of resistance elicitors from biological origin and their potential for crop protection. Plant Signal Behav. 2014, 5, 655. [Google Scholar] [CrossRef] [PubMed]
- Deice Raasch-Fernandes, L.; Bonaldo, S.M.; Jesus Rodrigues, D.; Magela Vieira-Junior, G.; Regina Freitas Schwan-Estrada, K.; Rocco da Silva, C.; Gabriela Araújo Verçosa, A.; Lopes de Oliveira, D.; Wender Debiasi, B. Induction of phytoalexins and proteins related to pathogenesis in plants treated with extracts of cutaneous secretions of southern Amazonian Bufonidae amphibians. PLoS ONE 2019, 14, e0211020. [Google Scholar] [CrossRef]
- Zandi, P.; Schnug, E. Reactive Oxygen Species, Antioxidant Responses and Implications from a Microbial Modulation Perspective. Biology 2022, 11, 155. [Google Scholar] [CrossRef]
- Kaur, S.; Samota, M.K.; Choudhary, M.; Abhay, K.P.; Anshu, S.; Julie, T. How do plants defend themselves against pathogens-Biochemical mechanisms and genetic interventions. Physiol. Mol. Biol. Plants 2022, 28, 485–504. [Google Scholar] [CrossRef]
- Aryal, S.; Baniya, M.K.; Danekhu, K.; Kunwar, P.; Gurung, R.; Koirala, N. Total Phenolic Content, Flavonoid Content and Antioxidant Potential of Wild Vegetables from Western Nepal. Plants 2019, 8, 96. [Google Scholar] [CrossRef]
- Jacoby, R.; Peukert, M.; Succurro, A.; Koprivova, A.; Kopriva, S. The Role of Soil Microorganisms in Plant Mineral Nutrition-Current Knowledge and Future Directions. Front. Plant Sci. 2017, 8, 1617. [Google Scholar] [CrossRef]
- Ahmad, M.I.; Biswas, A.K.; Sultana, M.S.; Sarker, B.C.; Mondal, C. Effect of Different Media and pH on Mycelial Growth of Sclerotium oryzae Causing Sheath Rot of Rice. South Asian J. Agric. 2019, 18, 67–72. [Google Scholar] [CrossRef]
- Du, J.X.; Li, Y.; Ur-Rehman, S.; Mukhtar, I.; Yin, Z.; Dong, H.; Wang, H.; Zhang, X.; Gao, Z.; Zhao, X.; Xin, X.; Ding, X. Synergistically promoting plant health by harnessing synthetic microbial communities and prebiotics. Iscience 2021, 24, 102918. [Google Scholar] [CrossRef] [PubMed]
- Hibbing, M.E.; Fuqua, C.; Parsek, M.R.; Peterson, S.B. Bacterial competition: surviving and thriving in the microbial jungle. Nat. Rev. Microbiol. 2010, 8, 15–25. [Google Scholar] [CrossRef] [PubMed]
- Keim, R.; Webster, R.K. Fungistasis of sclerotia of Sclerotium oryzae. Phytopathology 1975, 65, 283–287. [Google Scholar] [CrossRef]
- Yadav, R.L.; Shukla, S.K.; Suman, A.; Singh, P.N. Trichoderma inoculation and trash management effects on soil microbial biomass, soil respiration, nutrient uptake and yield of ratoon sugarcane under subtropical conditions. Biol. Fertil. Soils 2009, 45, 461–468. [Google Scholar] [CrossRef]
- Kapri, A.; Tewari, L. Phosphate solubilization potential and phosphatase activity of rhizospheric Trichoderma spp. Braz. J. Microbiol. 2010, 41, 787–795. [Google Scholar] [CrossRef]
- Kucuk, C.; Kivanc, M.; Kinaci, E.; Kinaci, G. Determination of the growth and solubilization capabilities of Trichoderma harzianum T1. Biologia 2008, 63, 167–170. [Google Scholar] [CrossRef]
- Nannipieri, P.; Kandeler, E.; Ruggiero, P. Enzyme activities and microbiological and biochemical processes in soil. Enzymes in the Environment 2002, 1–33. [Google Scholar]
- Gil-Sotres, F.; Trasar-Cepeda, C.; Leirós, M.C.; Seoane, S. Different approaches to evaluating soil quality using biochemical properties. Soil Biol. Biochem. 2005, 37, 877–887. [Google Scholar] [CrossRef]
- Burns, R.G. Enzyme activity in soil: location and a possible role in microbial ecology. Soil Biol Biochem. 1982, 14, 423–427. [Google Scholar] [CrossRef]
- Ng, C.W.W.; Yan, W.H.; Tsim, K.W.K.; So, P.S.; Xia, Y.T.; To, C.T. Effects of Bacillus subtilis and Pseudomonas fluorescens as the soil amendment. Heliyon 2022, 8, e11674. [Google Scholar] [CrossRef] [PubMed]
- Qiu, L.P.; Liu, J.; Wang, Y.Q.; Sun, H.M.; He, W.X. Research on relationship between soil enzyme activities and soil fertility. Plant Nut. Fert. Sci. 2004, 10, 277–280. [Google Scholar]
- Zenichi, M.; Fumie, I.; Konomi, T.; Masao, T. The Effects of Phosphorus and Magnesium on Sclerotium formation in Rhizoctonia solani Kühn. Japanese J. Phytopathol. 1991, 57, 649–656. [Google Scholar]


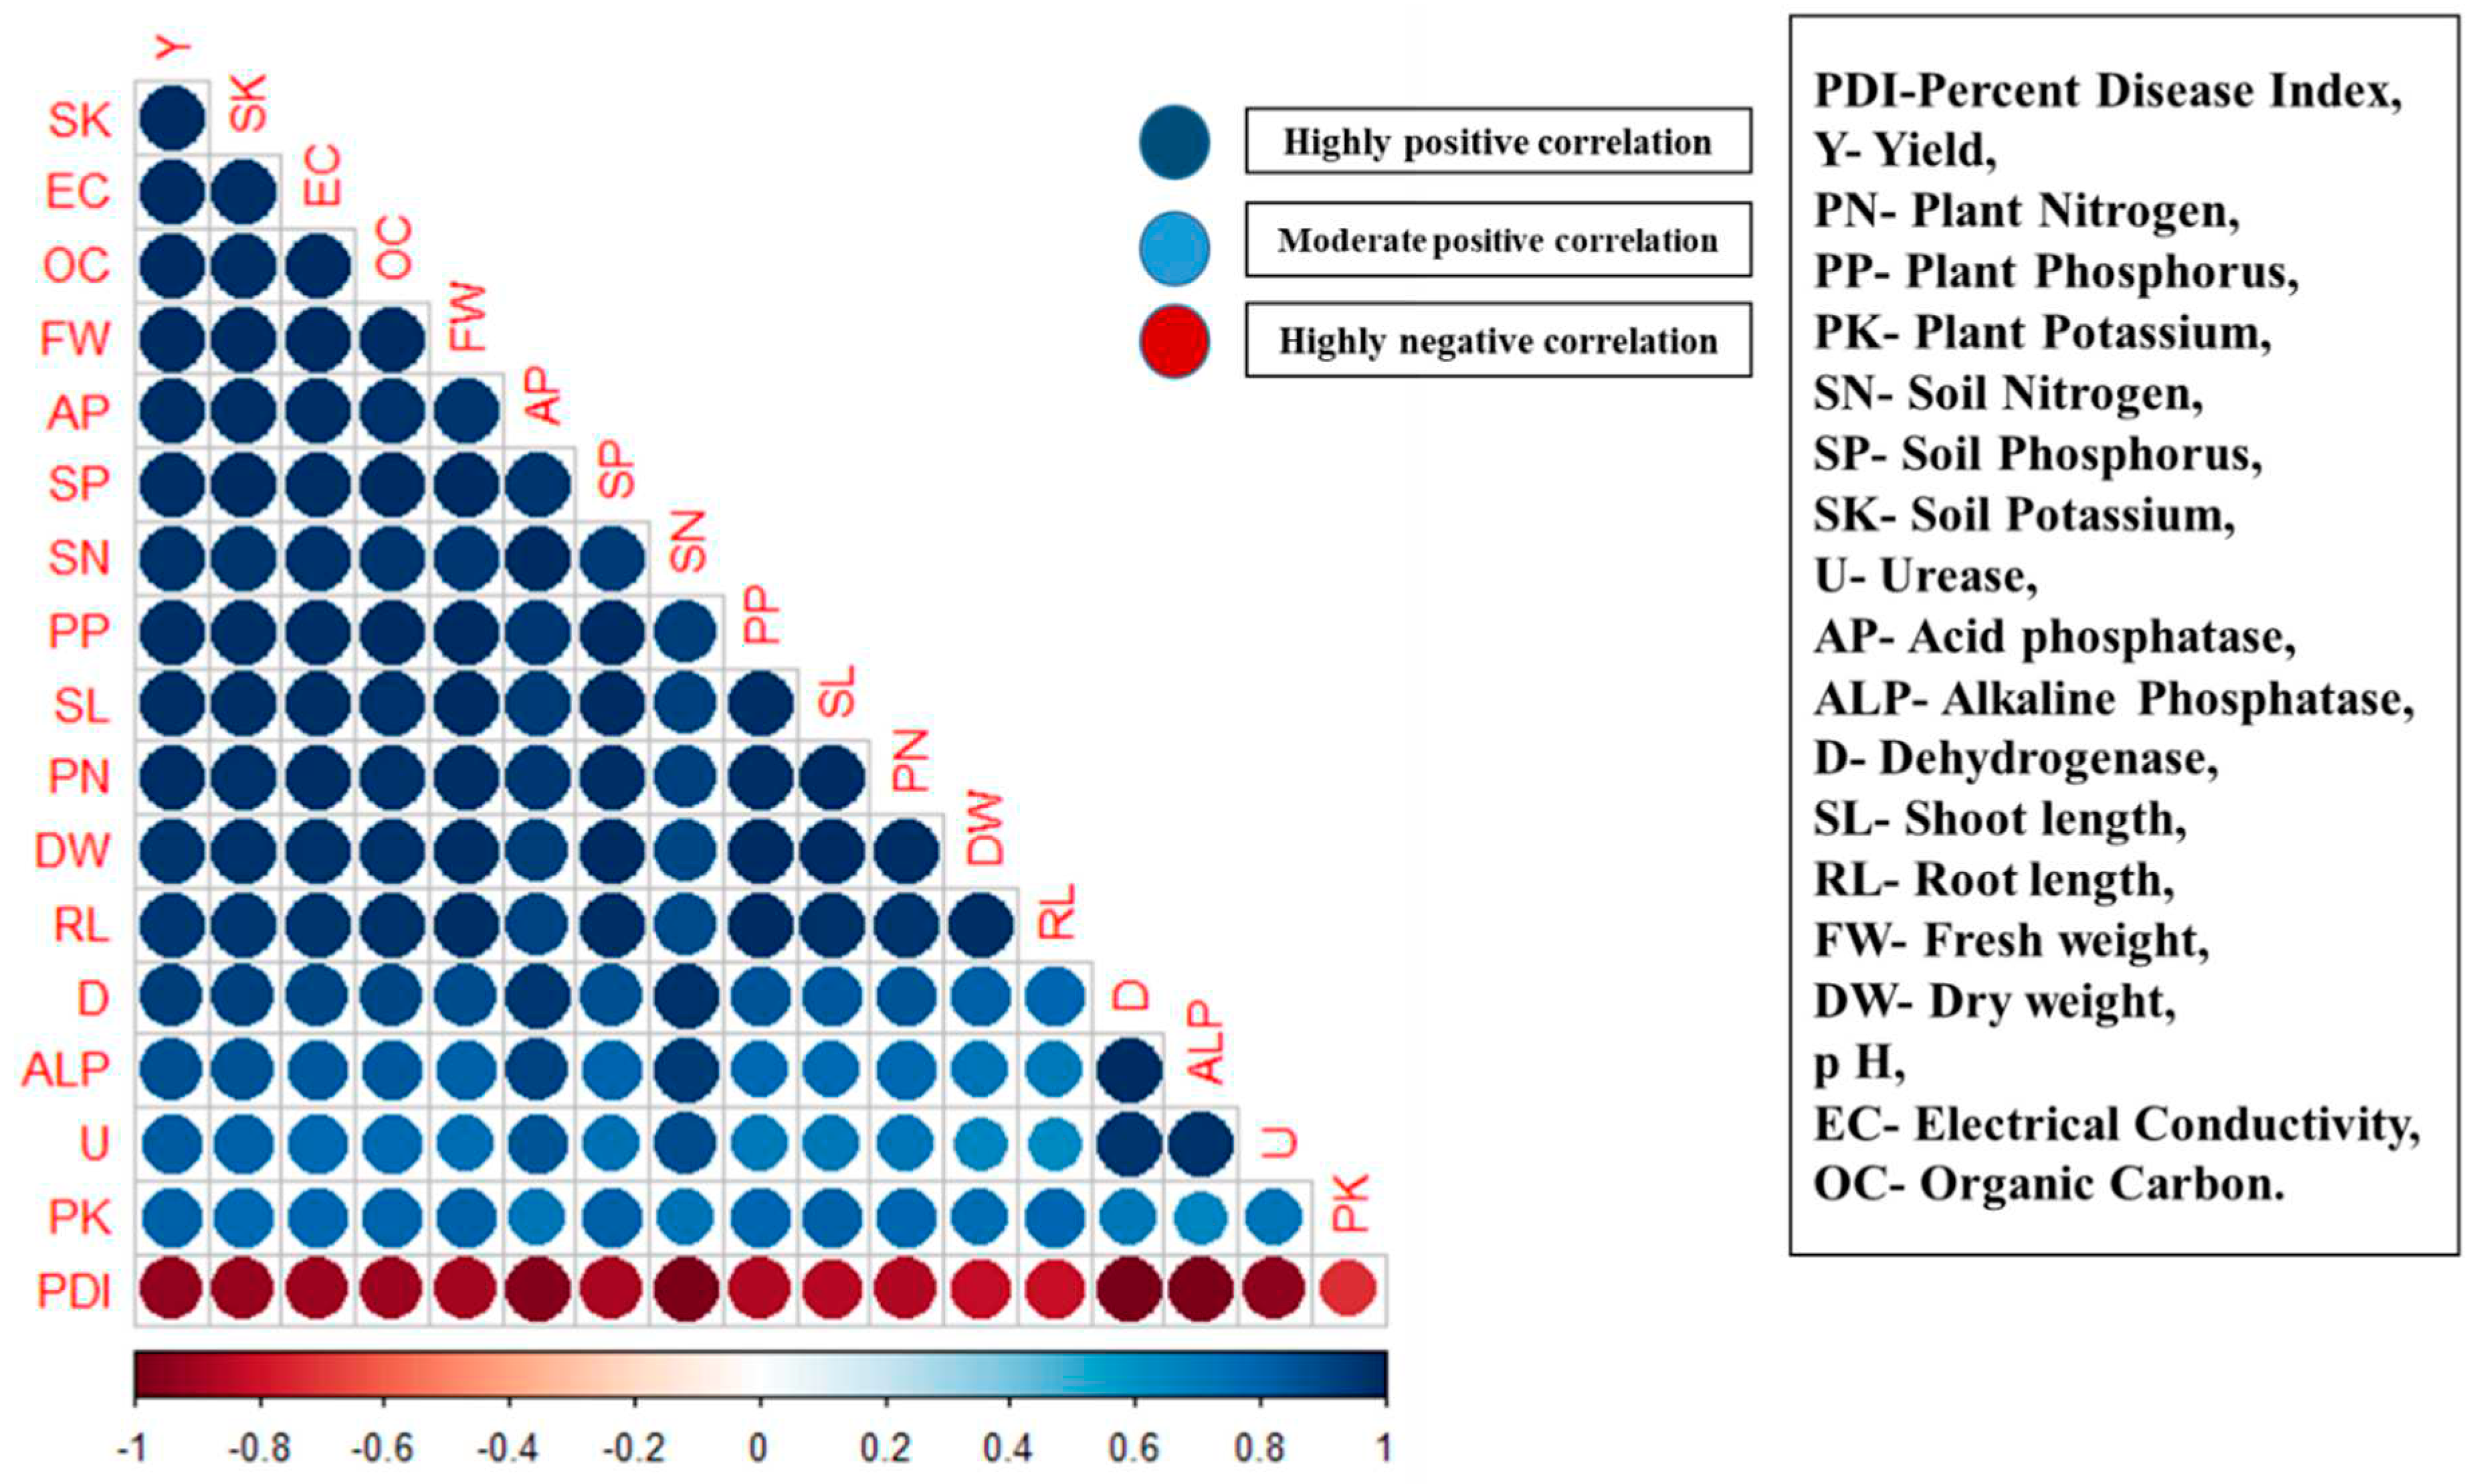
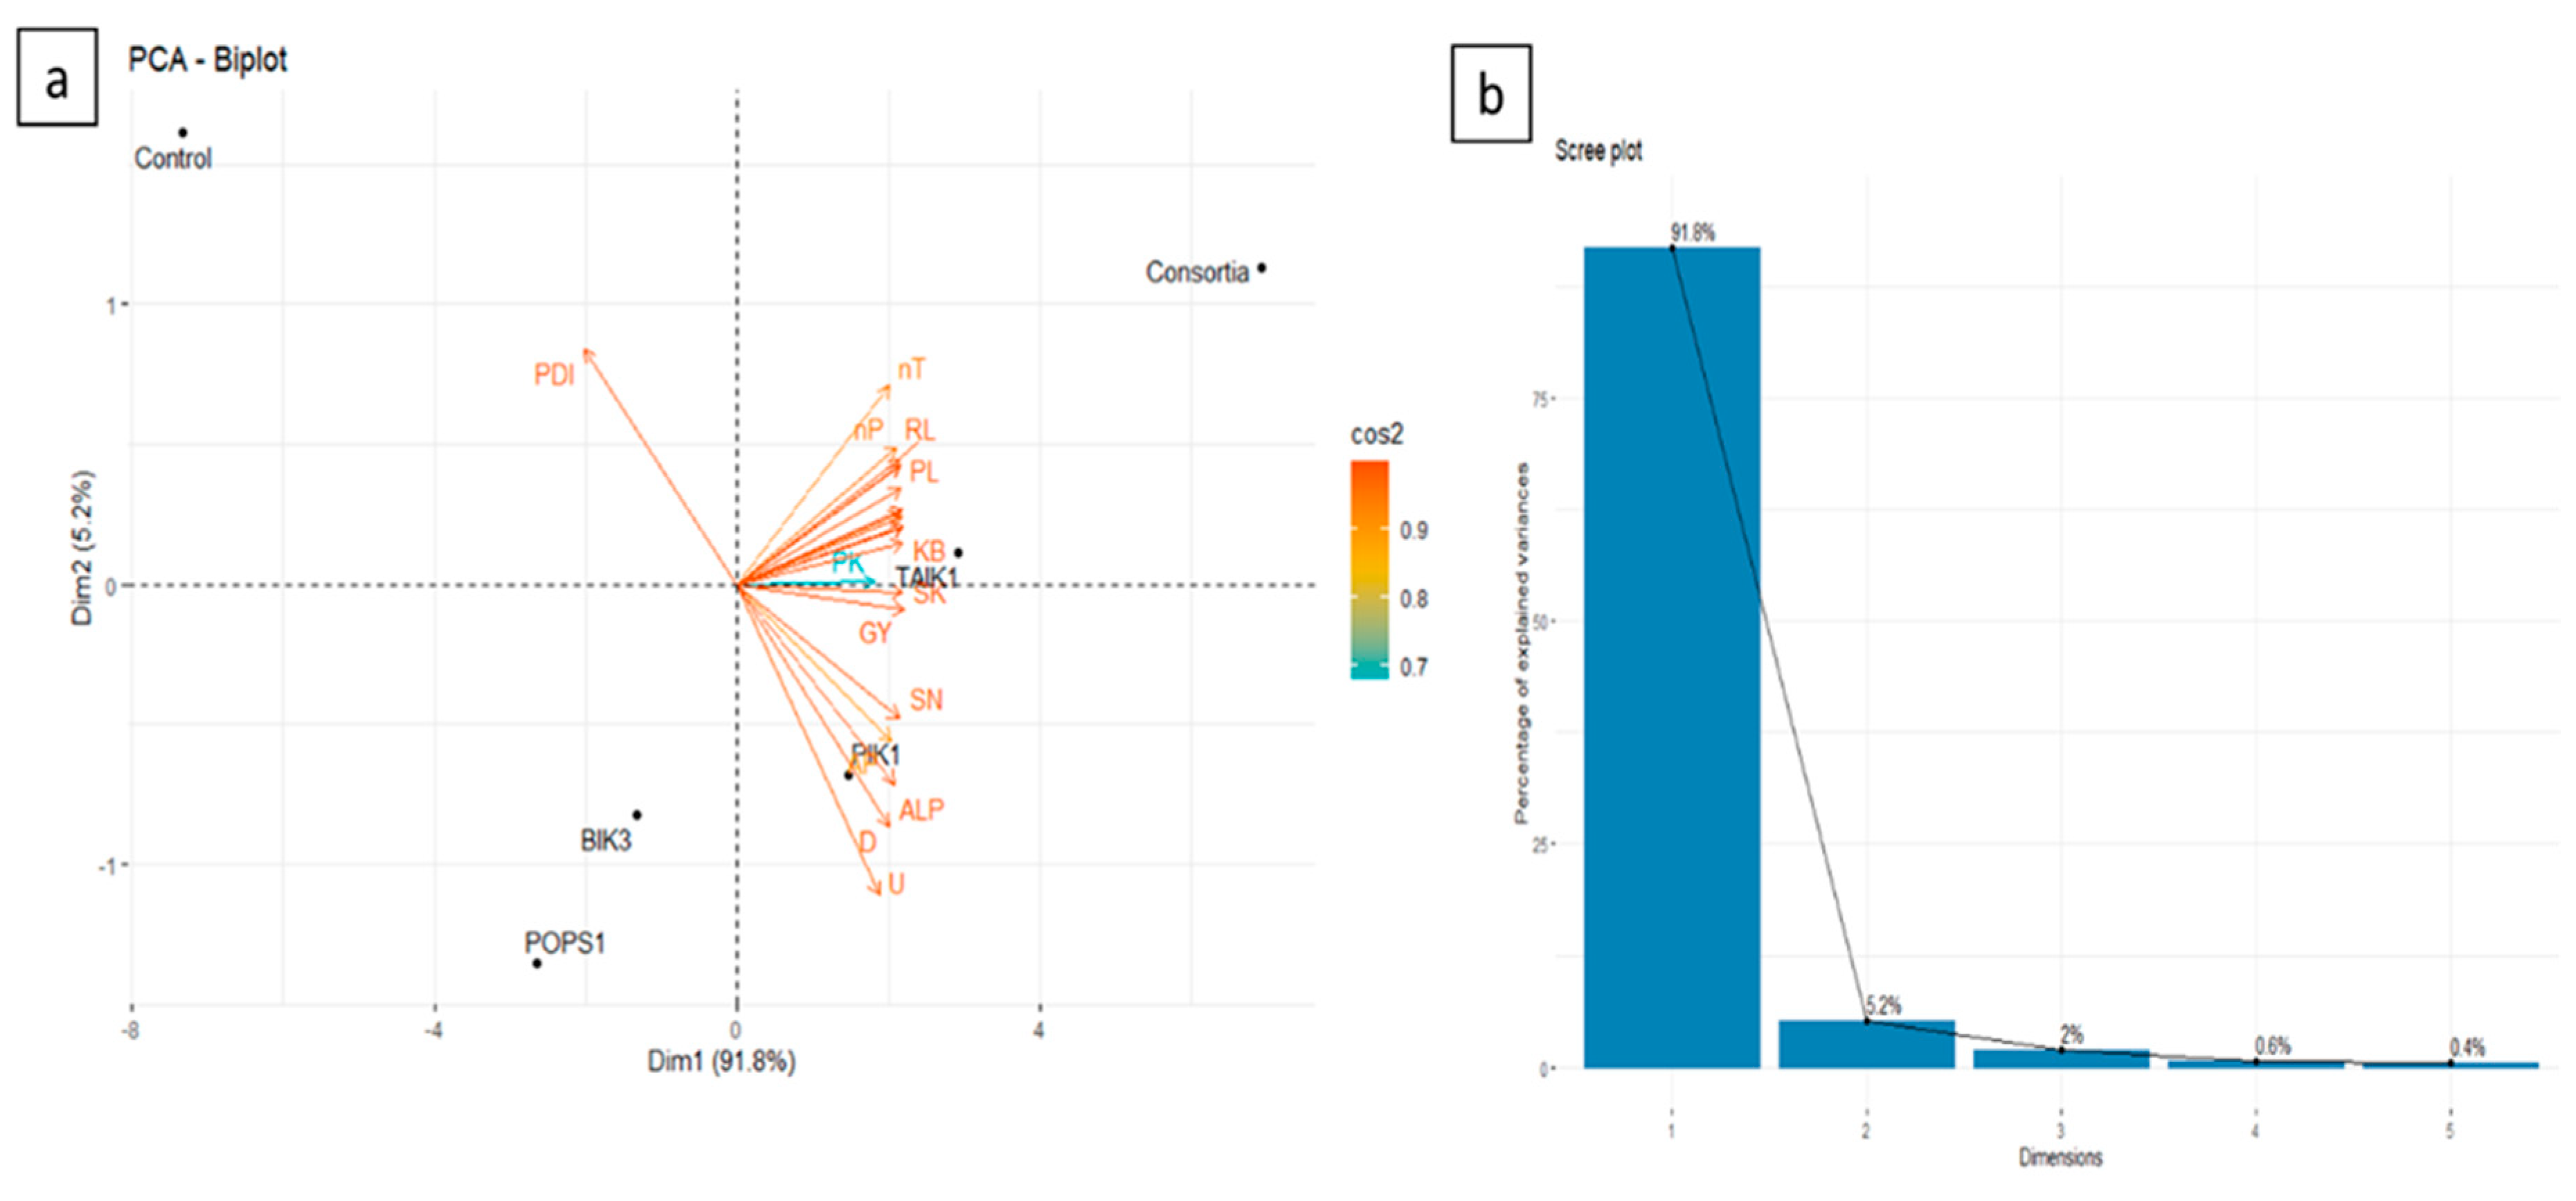
| Soil and plant characteristics | Parameters | Estimates | Standard Error | Probability | Partial R- Square | Model R- Square |
|---|---|---|---|---|---|---|
| PH | POPS1 | 0.97 | 0.05 | 0.0624 | 0.04 | 0.95 |
| BIK 3 | 0.62 | 0.06 | <.0001 | 0.91 | ||
| EC | BIK 3 | 0.65 | 0.08 | <.0001 | 0.96 | 0.9552 |
| OC | PIK 1 | 0.68 | 0.06 | <.0001 | 0.94 | 0.9414 |
| Available N | TAIK 1 | 0.39 | 0.03 | <.0001 | 0.94 | 0.9403 |
| Available P | PIK 1 | 0.69 | 0.05 | <.0001 | 0.95 | 0.9527 |
| Available K | PIK 1 | 0.69 | 0.05 | 0.0003 | 0.33 | 0.9462 |
| Consortia | 0.89 | 0.1 | <.0001 | 0.61 | ||
| Urease | Consortia | 0.9 | 0.03 | <.0001 | 0.96 | 0.959 |
| Acid Phosphatase | POPS1 | 0.63 | 0.01 | <.0001 | 0.98 | 0.9783 |
| Alkaline Phosphatase | POPS1 | 0.4 | 0.05 | 0.0037 | 0.05 | 0.9702 |
| BIK 3 | 0.14 | 0.02 | 0.0025 | 0.84 | ||
| TAIK 1 | 0.55 | 0.07 | 0.0073 | 0.08 | ||
| Dehydrogenase | POPS1 | 0.42 | 0.08 | <.0001 | 0.96 | 0.9633 |
| Plant N | BIK3 | 0.44 | 0.03 | 0.0098 | 0.59 | 0.76 |
| Consortia | 0.57 | 0.07 | 0.055 | 0.18 | ||
| Plant P | POPS1 | 0.99 | 0.05 | 0.0287 | 0.02 | 0.9785 |
| BIK3 | 0.49 | 0.09 | <.0001 | 0.96 | ||
| Plant K | PIK1 | 0.7 | 0.09 | 0.0994 | 0.03 | 0.9836 |
| POPS1 | 0.51 | 0.02 | 0.0548 | 0.03 | ||
| BIK3 | 0.48 | 0 | 0.0992 | 0.01 | ||
| Consortia | 0.35 | 0.05 | <.0001 | 0.91 |
| Soil and plant characteristics | Parameters | Estimates | Standard Error | Probability | Partial R- Square | Model R- Square |
|---|---|---|---|---|---|---|
| PH | POPS1 | 0.67 | 0.08 | <.0001 | 0.92 | 0.96 |
| BIK 3 | 0.5 | 0.03 | 0.0367 | 0.04 | ||
| EC | BIK 3 | 0.69 | 0.09 | <.0001 | 0.96 | 0.9571 |
| OC | PIK 1 | 0.77 | 0.01 | <.0001 | 0.96 | 0.9608 |
| Available N | TAIK 1 | 0.26 | 0.02 | <.0001 | 0.96 | 0.9643 |
| Available P | PIK 1 | 0.49 | 0.03 | <.0001 | 0.97 | 0.973 |
| Available K | PIK 1 | 0.25 | 0.06 | 0.0011 | 0.58 | 0.9169 |
| Consortia | 0.97 | 0.05 | 0.0104 | 0.34 | ||
| Urease | TAIK 1 | 0.65 | 0.1 | <.0001 | 0.97 | 0.9685 |
| Acid Phosphatase | POPS1 | 0.12 | 0.06 | <.0001 | 0.98 | 0.9785 |
| Alkaline Phosphatase | POPS1 | 0.96 | 0.02 | 0.1215 | 0.04 | 0.9753 |
| BIK3 | 0.57 | 0.03 | 0.0001 | 0.86 | ||
| TAIK1 | 0.43 | 0.03 | 0.0059 | 0.07 | ||
| Dehydrogenase | POPS1 | 0.68 | 0.03 | <.0001 | 0.97 | 0.9726 |
| Plant N | BIK3 | 0.43 | 0.02 | 0.0191 | 0.52 | 0.7677 |
| Consortia | 0.59 | 0.06 | 0.0285 | 0.25 | ||
| Plant P | PIK 1 | 0.57 | 0.04 | <.0001 | 0.94 | 0.9412 |
| Plant K | PIK1 | 0.55 | 0.05 | 0.0527 | 0.03 | 0.9757 |
| TAIK1 | 0.7 | 0.05 | 0.0752 | 0.02 | ||
| Consortia | 0.49 | 0.06 | <.0001 | 0.92 |
| Soil and plant characteristics | Parameters | Estimates | Standard Error | Probability | Partial R- Square | Model R- Square |
|---|---|---|---|---|---|---|
| PH | POPS1 | 0.88 | 0.05 | <.0001 | 0.9 | 0.9383 |
| BIK 3 | 0.67 | 0.05 | 0.0748 | 0.04 | ||
| EC | BIK 3 | 0.82 | 0.03 | <.0001 | 0.94 | 0.9403 |
| OC | PIK 1 | 0.65 | 0.07 | <.0001 | 0.93 | 0.9332 |
| Available N | TAIK 1 | 0.29 | 0.03 | <.0001 | 0.94 | 0.935 |
| Available P | POPS1 | 0.83 | 0.07 | <.0001 | 0.94 | 0.9432 |
| Available K | BIK 3 | 0.08 | 0.03 | 0.1465 | 0.32 | 0.9712 |
| consortia | 0.58 | 0.02 | <.0001 | 0.65 | ||
| Urease | TAIK 1 | 0.28 | 0.05 | <.0001 | 0.94 | 0.9367 |
| Acid Phosphatase | POPS1 | 0.66 | 0.01 | <.0001 | 0.96 | 0.9731 |
| consortia | 0.36 | 0.02 | 0.0929 | 0.01 | ||
| Alkaline Phosphatase | POPS1 | 0.12 | 0.04 | 0.1 | 0.07 | 0.9657 |
| BIK3 | 0.67 | 0.06 | 0.0005 | 0.8 | ||
| TAIK1 | 0.07 | 0.01 | 0.0057 | 0.1 | ||
| Dehydrogenase | PIK 1 | 0.61 | 0.07 | <.0001 | 0.96 | 0.9641 |
| Plant N | BIK3 | 0.76 | 0.03 | 0.0206 | 0.51 | 0.738 |
| Consortia | 0.8 | 0.06 | 0.0424 | 0.23 | ||
| Plant P | BIK3 | 0.25 | 0.03 | <.0001 | 0.93 | 0.9349 |
| Plant K | PIK1 | 0.45 | 0.05 | 0.0438 | 0.06 | 0.9822 |
| POPS1 | 0.72 | 0.07 | 0.0343 | 0.04 | ||
| BIK3 | 0.67 | 0.05 | 0.1244 | 0.01 | ||
| Consortia | 0.72 | 0.1 | <.0001 | 0.88 |
| Soil and plant characteristics | Parameters | Estimates | Standard Error | Probability | Partial R- Square | Model R- Square |
|---|---|---|---|---|---|---|
| PH | POPS1 | 0.07 | 0.09 | 0.0877 | 0.9 | 0.93 |
| BIK 3 | 0.05 | 0.07 | <.0001 | 0.04 | ||
| EC | BIK 3 | 0.06 | 0.06 | <.0001 | 0.95 | 0.9624 |
| Consortia | 0.06 | 0.02 | 0.1458 | 0.01 | ||
| OC | PIK 1 | 0.67 | 0.07 | <.0001 | 0.94 | 0.9381 |
| Available N | TAIK 1 | 0.10 | 0.01 | <.0001 | 0.94 | 0.9432 |
| Available P | PIK 1 | 0.07 | 0.01 | <.0001 | 0.95 | 0.9483 |
| Available K | BIK 3 | 0.07 | 0.04 | 0.0965 | 0.58 | 0.9398 |
| Consortia | 0.18 | 0.03 | 0.0113 | 0.36 | ||
| Urease | Consortia | 0.14 | 0.07 | <.0001 | 0.95 | 0.9494 |
| Acid Phosphatase | POPS1 | 0.13 | 0.09 | <.0001 | 0.97 | 0.9827 |
| Consortia | 0.81 | 0.05 | 0.0726 | 0.01 | ||
| Alkaline Phosphatase | POPS1 | 0.68 | 0.01 | 0.0983 | 0.06 | 0.9716 |
| BIK 3 | 0.45 | 0.08 | 0.0003 | 0.82 | ||
| TAIK 1 | 0.52 | 0.07 | 0.0044 | 0.09 | ||
| Dehydrogenase | PIK 1 | 0.25 | 0.02 | <.0001 | 0.97 | 0.9699 |
| Plant N | PIK1 | 0.40 | 0.06 | 0.0472 | 0.21 | 0.7497 |
| BIK3 | 0.70 | 0.10 | 0.015 | 0.54 | ||
| Plant P | POPS1 | 0.51 | 0.03 | 0.0928 | 0.02 | 0.9673 |
| BIK3 | 0.59 | 0.01 | <.0001 | 0.95 | ||
| Plant K | PIK1 | 0.65 | 0.07 | 0.0944 | 0.04 | 0.9807 |
| POPS1 | 0.86 | 0.01 | 0.0702 | 0.03 | ||
| BIK3 | 0.73 | 0.05 | 0.0665 | 0.02 | ||
| Consortia | 0.96 | 0.01 | <.0001 | 0.89 |
Disclaimer/Publisher’s Note: The statements, opinions and data contained in all publications are solely those of the individual author(s) and contributor(s) and not of MDPI and/or the editor(s). MDPI and/or the editor(s) disclaim responsibility for any injury to people or property resulting from any ideas, methods, instructions or products referred to in the content. |
© 2023 by the authors. Licensee MDPI, Basel, Switzerland. This article is an open access article distributed under the terms and conditions of the Creative Commons Attribution (CC BY) license (http://creativecommons.org/licenses/by/4.0/).


