1. Introduction
The European Union is a complex of rural and urban regions, with people having very different lifestyles, but facing common challenges. The populations of cities and countryside are mutually dependent, making it necessary to promote more lasting interrelationships between these regions for a more sustainable future. For this reason, more than a third of the European Commission's (EC) budget is invested in promoting smart, sustainable and inclusive development through its cohesion policy [
1]. The EC aim is that all European regions, urban or rural, have equal access to the benefits of growth.
In European Union, at the most various levels—political, environmental, social, and economic—the need to promote new and/or renewed relationships between rural and urban regions is evident (e.g., ROBUST project [
2]). Traditional agri-food products, anchored in different regions, are an example of this type of promotion. These form an integral part of cultural, regional and even national identity, contributing mainly to the dynamization of rural regions [
3]. Its production is sustained by endogenous resources, deeply associated with the characteristics of each region [
4]. Currently, there is a growing trend toward the consumption of traditional agri-food products [
5]. This increase in consumer interest is motivated by several factors, including the transparency of the food chain and growing environmental awareness, and, above all, health-related concerns, highlighting the perception of these products as a fresher, more nutritious, and safer [
6].
According to [
6], consumers seem to prefer traditional markets due to the possibility of establishing more direct and personal relationships with producers. Urban stores specializing in the sale of these traditional agri-food products have also seen this consumer interest and preferences as a business opportunity. In fact, recent changes in consumer preferences and practices regarding food quality have created opportunities for both retailers and producers who tend to focus on quality and product differentiation. On the other hand, the potential of these stores is also associated with the growth of tourism over the last few years. These aspects represent an opportunity for retailers and producers to stand out in an extremely competitive market dominated by large retail and food distribution surfaces [
7].
Although the scientific literature has focused more on the transformations that have occurred in alternative food supply chains – such as alternative supply networks and short circuits [
7,
8], the role of urban stores specialized in the commercialization of agri-food products in the promotion of interrelations between the countryside and the cities and of the national agriculture must not be neglected. Recognizing the importance of these stores in publicizing and promoting rural regions among the urban populations and tourists [
9,
10], there is the need to understand and characterize the growth of these stores, since they promote products and contribute to the attractiveness of rural regions among a growing number of urban consumers (e.g., [
10,
11]).
The emphasis of this paper is on the spatial analysis and mapping agri-food products from their production (in rural regions) to their commercialization and consumption (in urban regions) in two of the main urban and tourist centers of Portugal: Oporto and Lisbon. The focus drives to Portugal, a country in southern Europe, where the asymmetries between rural and urban have not ceased to increase over the last decades. The coastalisation of the population and the concentration of population in cities together with the persistent rural exodus have both contributed to an imbalance of economic, social, and territorial dimensions between regions. In order to counter this trend, policies to attract the population and tourism have been promoted but have not been sufficient to promote territorial cohesion. This makes it necessary to rethink the capacity and the potential of rural territories [
12] in terms of mobilising their resources and, through them, promoting new and/or renewed relations with urban territories. For this purpose, we developed an analytical framework with the support of a spatial analysis using geographic information systems (GIS) to analyze the characteristics of specialized and/ or gourmet shops [
13], as such: i) spatial organization of the shops as well as their spatiotemporal evolution across different urban regions; ii) its area of influence taking into account the resident population, the existing dwellings, as well as the density of housing; iii) the geographical patterns of the supply chains of marketed agri-food products; and iv) the spatial relationships between the producers and the stores selling the products.
This paper's main contribution is to better understand the insertion of these stores in the analyzed urban regions and, on the other hand, the relationships that they can promote with the rural regions where the products are more frequently produced.
The remaining of the paper is organized as follows:
Section 2 presents the data and methods used for conducting this study.
Section 3 introduces the results and discussion, while
Section 4 highlights challenges and future directions for such systems, and presents some conclusions.
2. Data and Methods
2.1. Oporto and Lisbon Case Studies
In Portugal, the national food trade maintained until the 1980s the characteristics that had marked it since the Industrial Revolution, with a predominance of small companies located in urban centers and an offer very marked by specialization and quality [
14]. In general, in the notebooks of traditional commerce in an urban context [
15], associated with each of these types of companies, there are also merchants with very different profiles, as supermarkets first and hypermarkets later, which revolutionized the panorama of national agri-food trade (e.g., [
15]). More recently, incentive and protection programs were created for more traditional stores, especially historic stores [
16]. Lisbon city was a pioneer in this matter through the approval by the City Council, in 2015, of the Program for the Protection of Traditional Commerce. Also in the city of Oporto, a project entitled “
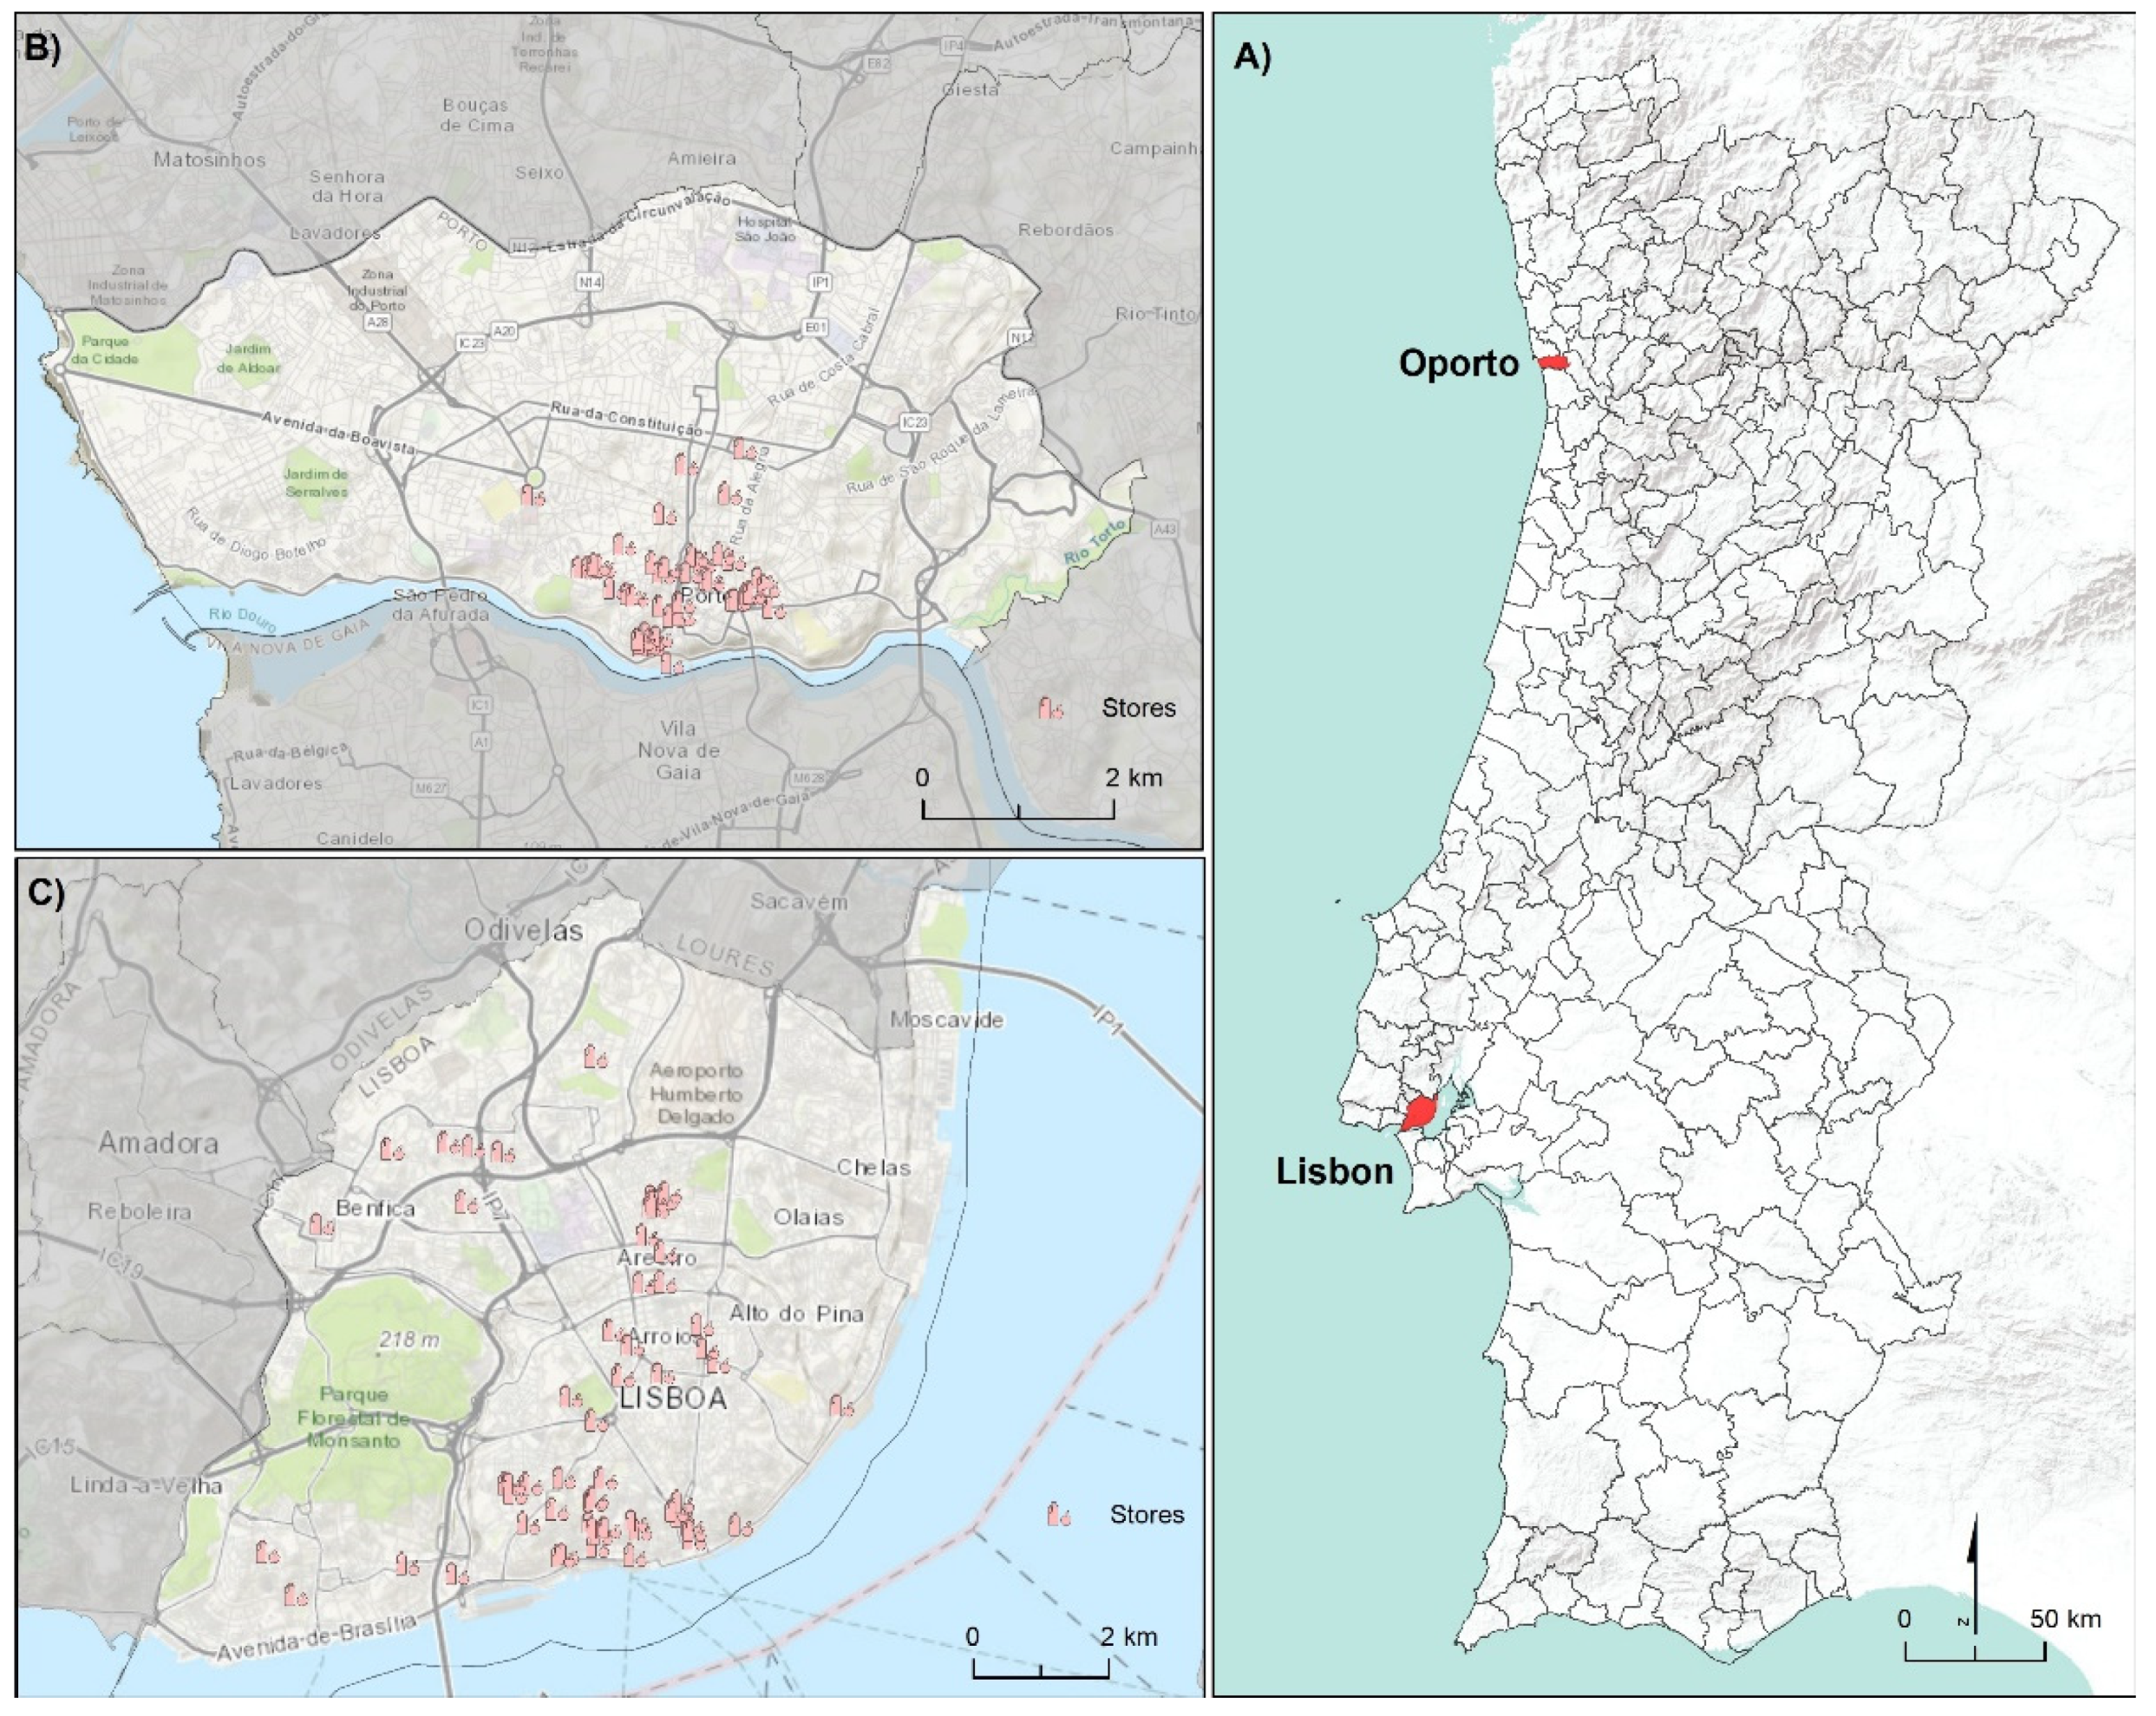
Porto com Tradição” (Oporto with history), was created in 2017, which aims to classify and promote traditional stores based on their age. We selected both cities as cases study (
Figure 1) not only because they were pioneers in these projects, but also because they first recognized the need to preserve and protect this type of trade.
Despite promoting the appreciation of traditional forms of commerce and 'with history', these initiatives also emphasize the differentiating nature of these commercialization models, especially given the more global panorama of agri-food commerce today, recognizing their relevance in the dissemination and promotion of products traditions and their role as linking agents between consumers, producers and regions of origin and consumption (e.g., [
9,
17,
18]). In addition, Lisbon and Oporto where characterized by a recent growth in the flow of tourism and tourism-related activities and by an increase in the number of stores specializing in the sale of agro-food products of rural origin.
2.2. Analytical Framework
The model framework was developed to understand the characteristics of specialized and/ or gourmet shops from their production (in rural regions) to their commercialization and consumption (in urban regions). The framework includes two main stages: (1) collection and pre-processing of spatial data, (2) analysis of information using GIS tools. The workflow of the process is shown in
Figure 2.
2.2.1. Data Collection and Pre-Processing
The spatial location of the specialized/gourmet stores in Lisbon and Oporto was first collected through different sources (i.e., Google Maps, newspapers, trade magazines and information websites). Then, we compare the results with the ones present in the commercial database of Portuguese companies filtered through the primary classification of activity codes (Portuguese Classification of Economic Activities - CAE, Rev.3), place of contact (Lisbon or Oporto) and set a limit of up to 10 employees. Finally, three main elements were considered to identify the total universe of stores in the two cities: (i) only stores selling agri-food products from rural origin; (ii) only small stores providing interaction and relationship between merchants and consumers; (iii) only stores located in urban areas selling products of national origin. Considering these three elements, for 2020 were identified a total of 70 and 101 stores in Oporto and Lisbon, respectively (
Figure 3 (A) and (B)).
As second step, we applied a survey to typify the specialized/gourmet stores based on their main characteristics. This survey was based on an extensive review of the literature and included questions related to: (i) the general characterization of the store and the owner company; (ii) the types of products and services marketed; (iii) the most sold products of certified origin; (iv) the way of acquiring the products (whether through a distributor or directly from the producer) and (v) the profiles of customers (e.g., nationality, age and gender) The response rate reached 61.9% (119 stores) [
18].
As third step, we used the cluster analysis performed by [
18]. As a basis for segmentation for cluster analysis, the survey question “What are the best-selling Portuguese rural food products?” was used as dependent variable. The different answers to this question were then recoded into seven binary variables, corresponding to the different types of products: "Vegetables and subproducts", "Olive oil", "Honey, jams and canned products", "Cheese and other dairy products", "Wine and other drinks ", "Meat, sausages, and other subproducts of animal origin” [
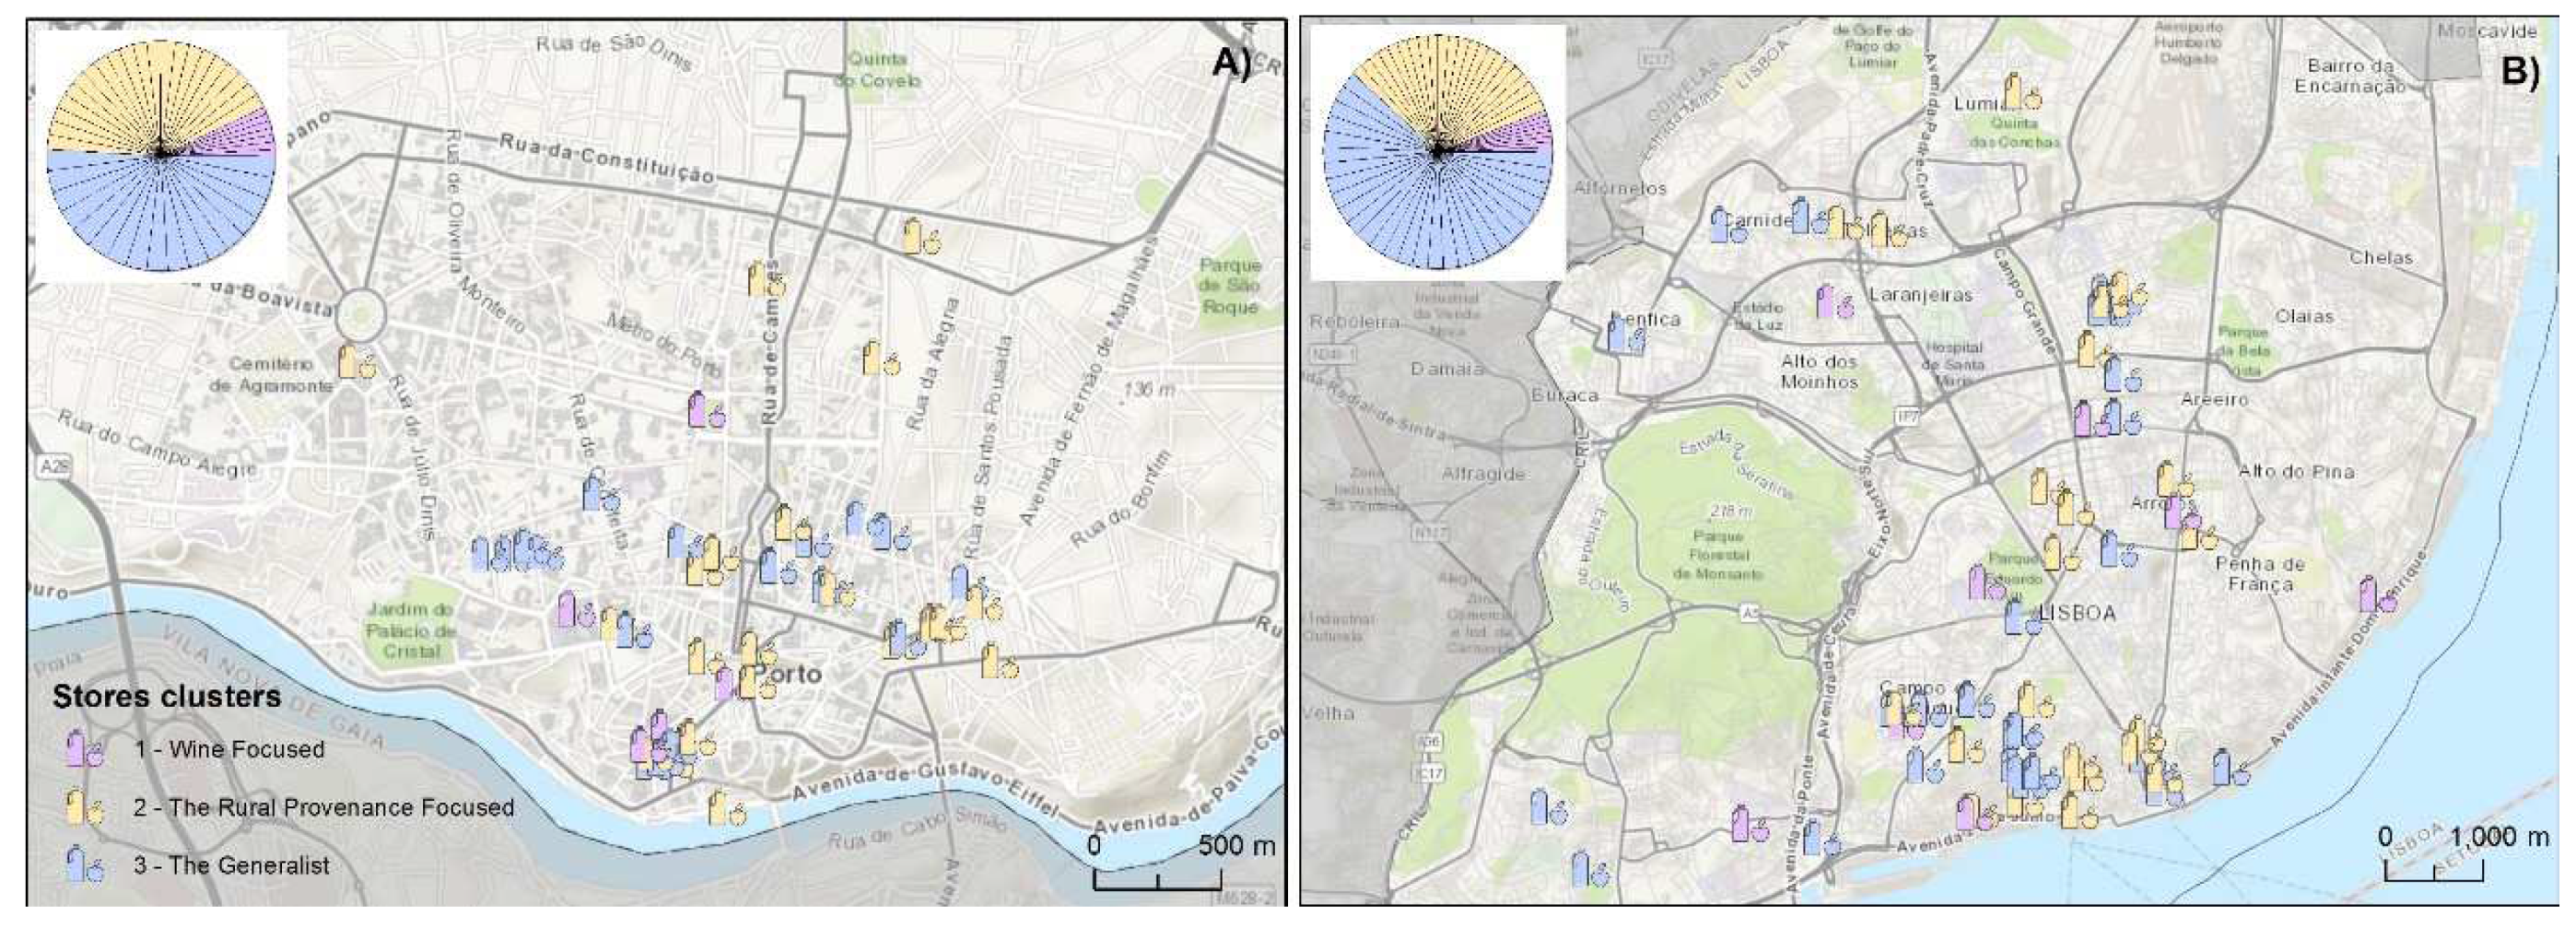
10]. Based on the agglomeration schemes and dendrograms obtained from the cluster analysis, we choose the 3-cluster solution. Each cluster is characterized as follows:
Cluster 1 (“Wine Focused”) includes stores (N=13, 11.5%) that almost exclusively sell wines and other beverages. This is the least represented cluster in the sample. It is important to note that compared to the other two clusters, the stores in this cluster do not sell any product without a certification seal, and most wines have the Denomination of Controlled Origin (DOC) or Protected Geographical Indication (PGI) designations. Compared to the other clusters, this one tends to promote “Cooking Workshops/Courses” more often.
Cluster 2 (“The Rural Provenance Focused”) includes stores (N=49, 43.4%) that, although they sell a wide variety of food products of rural origin, sell mainly “Cheese and other dairy products” and “Meat, sausages, and other sub-products of animal origin”. This cluster is the second most representative cluster of stores. These stores, compared to the other clusters, tend to be a group of stores with a more represented family structure and opened before the year 2000. Furthermore, these stores tend to acquire their products in both ways, both directly from the producer and through the distributor.
Cluster 3 (“The Generalist”) includes stores (N= 51, 45.1%) which, compared to other clusters, are characterized by the sale of vegetables (and related products) and other products, as well as olive oil. This is the cluster with the highest representation in the sample; however, it is also the cluster with a greater variety of other sold products. In addition, the stores are more likely to sell hygiene and cleaning products (soaps, shower gel) and other foods that use raw materials from rural sources such as beeswax, honey, olive oil, goat and donkey milk. In this cluster the stores owners are part of collective companies and have a greater preference for buying directly from the producer, namely vegetables and olive oil.
In an attempt to assess the hypothesis that the Gourmet stores would be very dedicated to visitors, whether national or foreigners, it is interesting to try to understand which places are of awareness to tourists. For this, the verification of the location of the local lodgings and the analysis of the publications georeferenced photographs in cities are essential indicators (
Table 1). In this we web-scrape the geotagged photos uploaded by users of the social network Flickr between 2018 and 2021 and processed them according to the method developed by [
19,
20]. The local lodgings regularized until 2021were downloaded from the National Tourism Authority web-GIS (
https://sigtur.turismodeportugal.pt/). After, we combine both tourist and local lodging following the work of [
21,
22].
For the geodemographic analysis, we choose for population (number of residents) [
23] and housing (number of dwellings)[
24] statistics. All these data was retrieved from the Statistics Portugal (
Instituto Nacional de Estatística – INE) website (
https://mapas.ine.pt/download/index2011.phtml). The road network, necessary for modelling the stores walkable service area as developed by Here Maps and it is available in ArcGIS online through the Environmental Systems Research Institute (ESRI) GIS-Hub (
https://hub.arcgis.com/pages/d64a1177d4a146e58464aa3905ac369f).
2.2.2. Geospatial Analysis
To analyze the characteristics of specialized/gourmet stores a multivariate analysis in each city was carried out using spatial analysis tools. Firstly, the Geodemography of the cities of Oporto and Lisbon analysis was performed in order to investigate the geographic patterns that structure and are structured by the forms and functions of places [
25]. This analysis considered socioeconomic and behavioral data about the population (dwellings and resident population) as indicators to understand the potential customers of the stores under analysis and if they can be considered to be residents of nearby areas.
Secondly, we analyze the patterns of spatial organization of store locations and their temporal evaluation. This step was important to verify the possible existence of clustering phenomena amid the specialized/gourmet stores. Here, the stores were divided by each cluster (i.e., The Wine Focused, The Rural Provenance Focused and The Generalist) in each city, thus applying this procedure only among stores in the same cluster. For this analysis, the Average Nearest Neighbor (ANN) statistical spatial analysis was used [
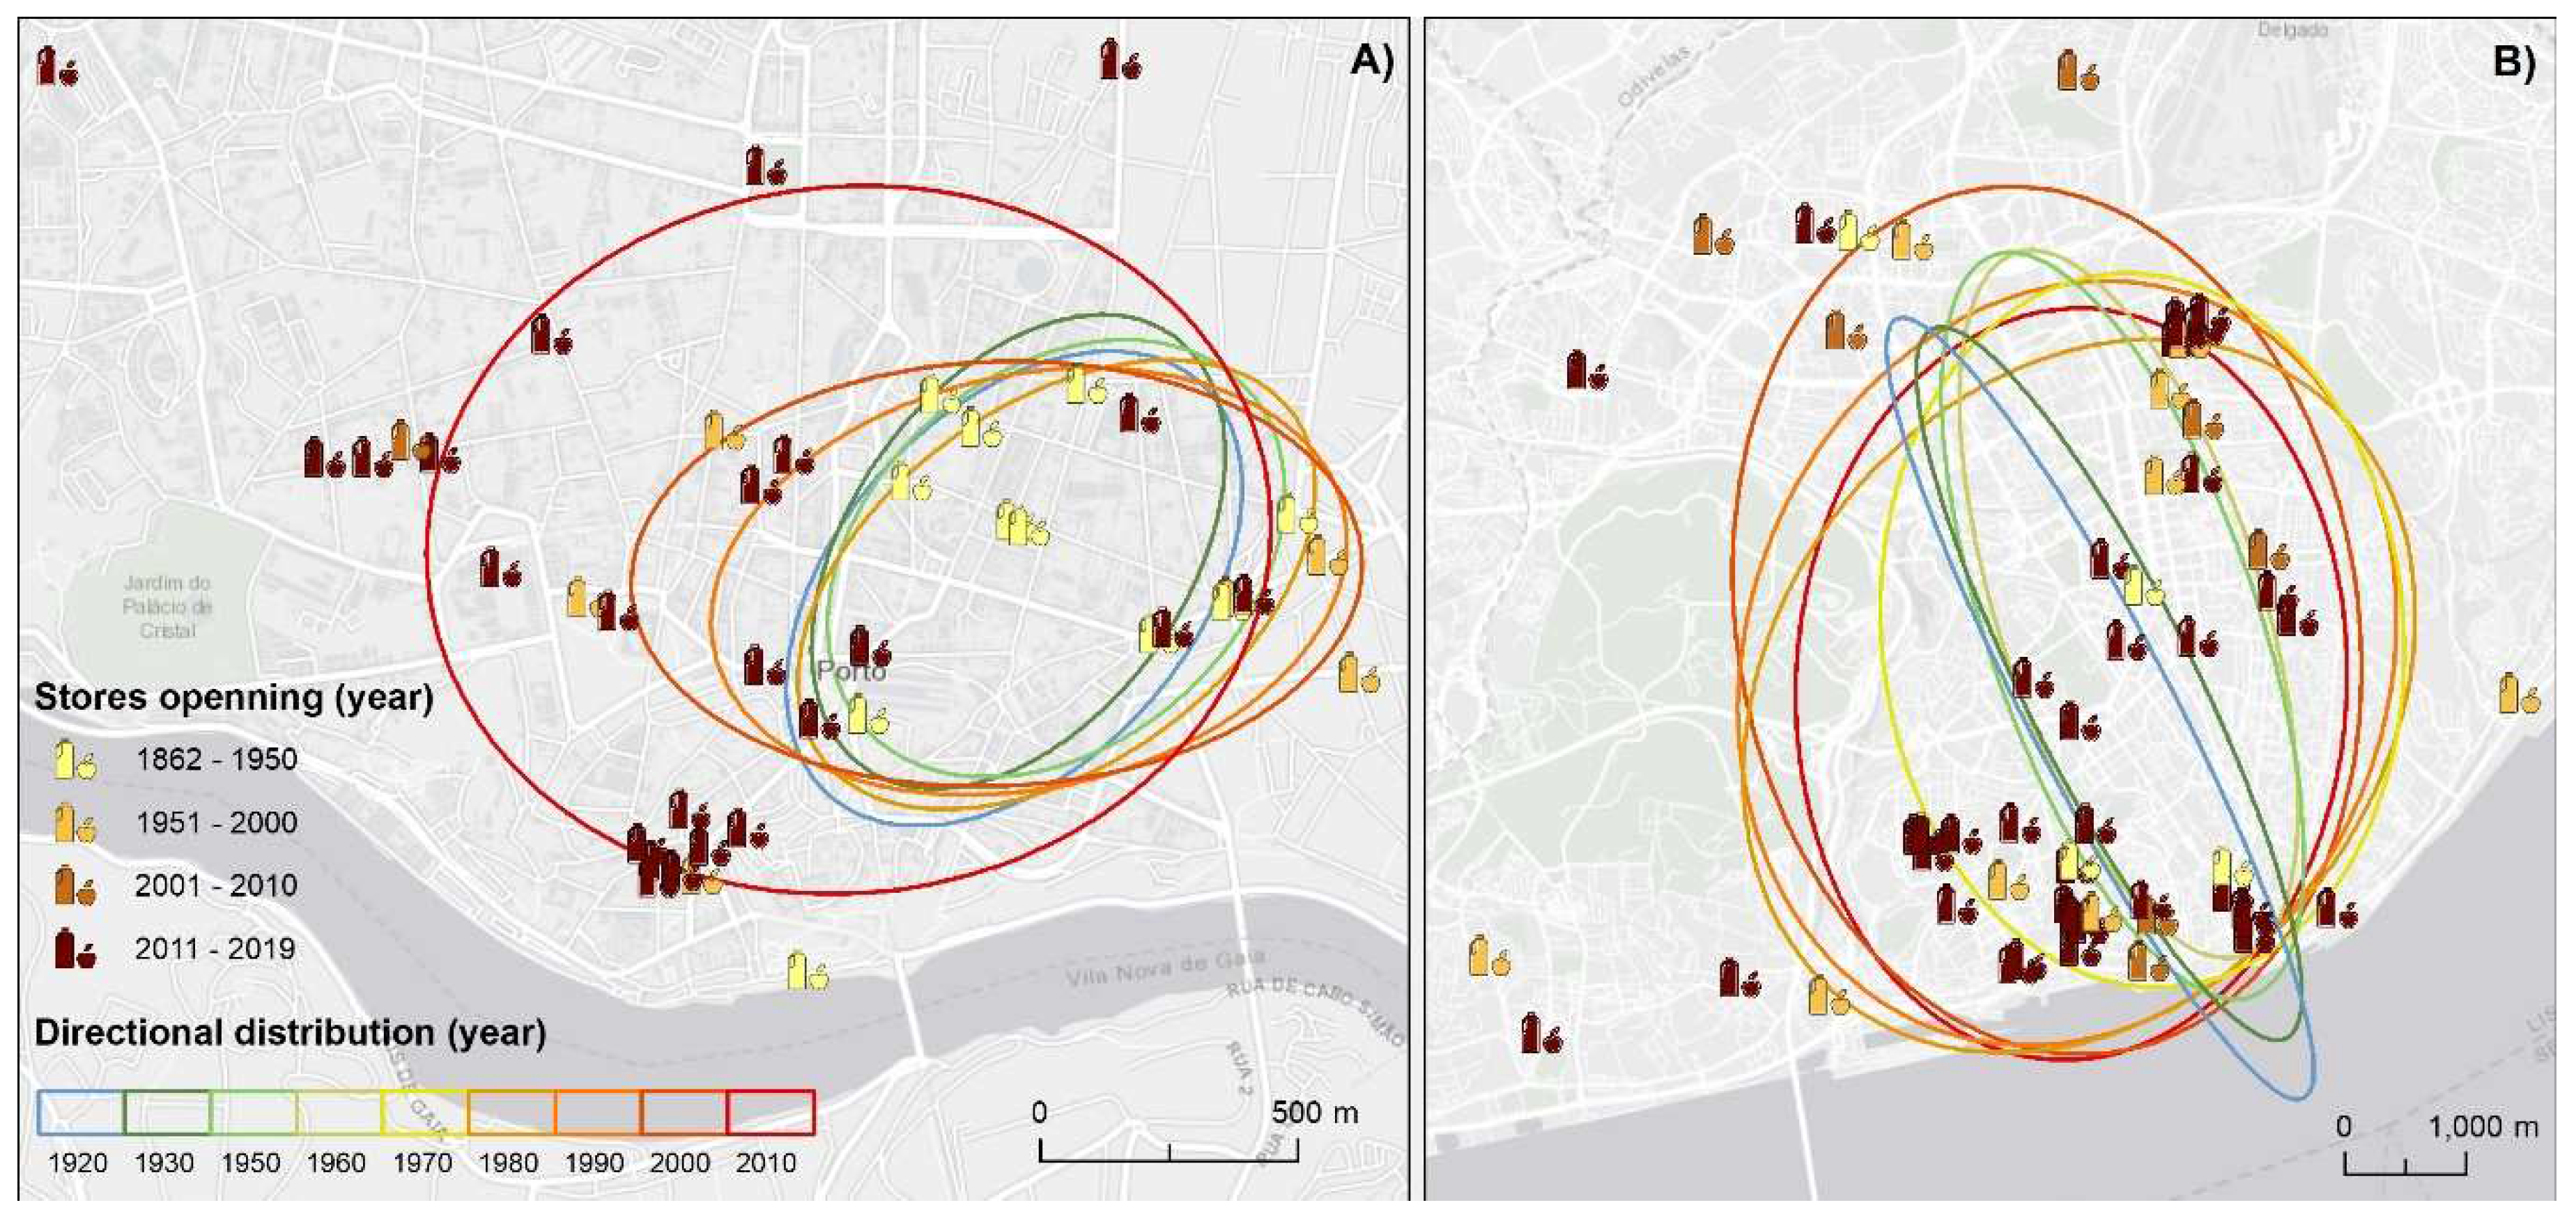
26]. The analysis of the results provided by this index proceeds as follows: If the index (average nearest neighbor ratio) is less than one, the pattern displays clustering; If the index is greater than one, the trend is towards dispersion. For the calculation of this index, the Euclidean distance was used and, we used the administrative limits of each municipality under analysis as the area parameter. Finally, directional distribution ellipses were used to analyze the spatiotemporal distribution of stores [
26]. This is a simple geoprocessing tool that provides essential information to understand different location patterns along a time scale [
27]. For the division we considered the opening decade of each store.
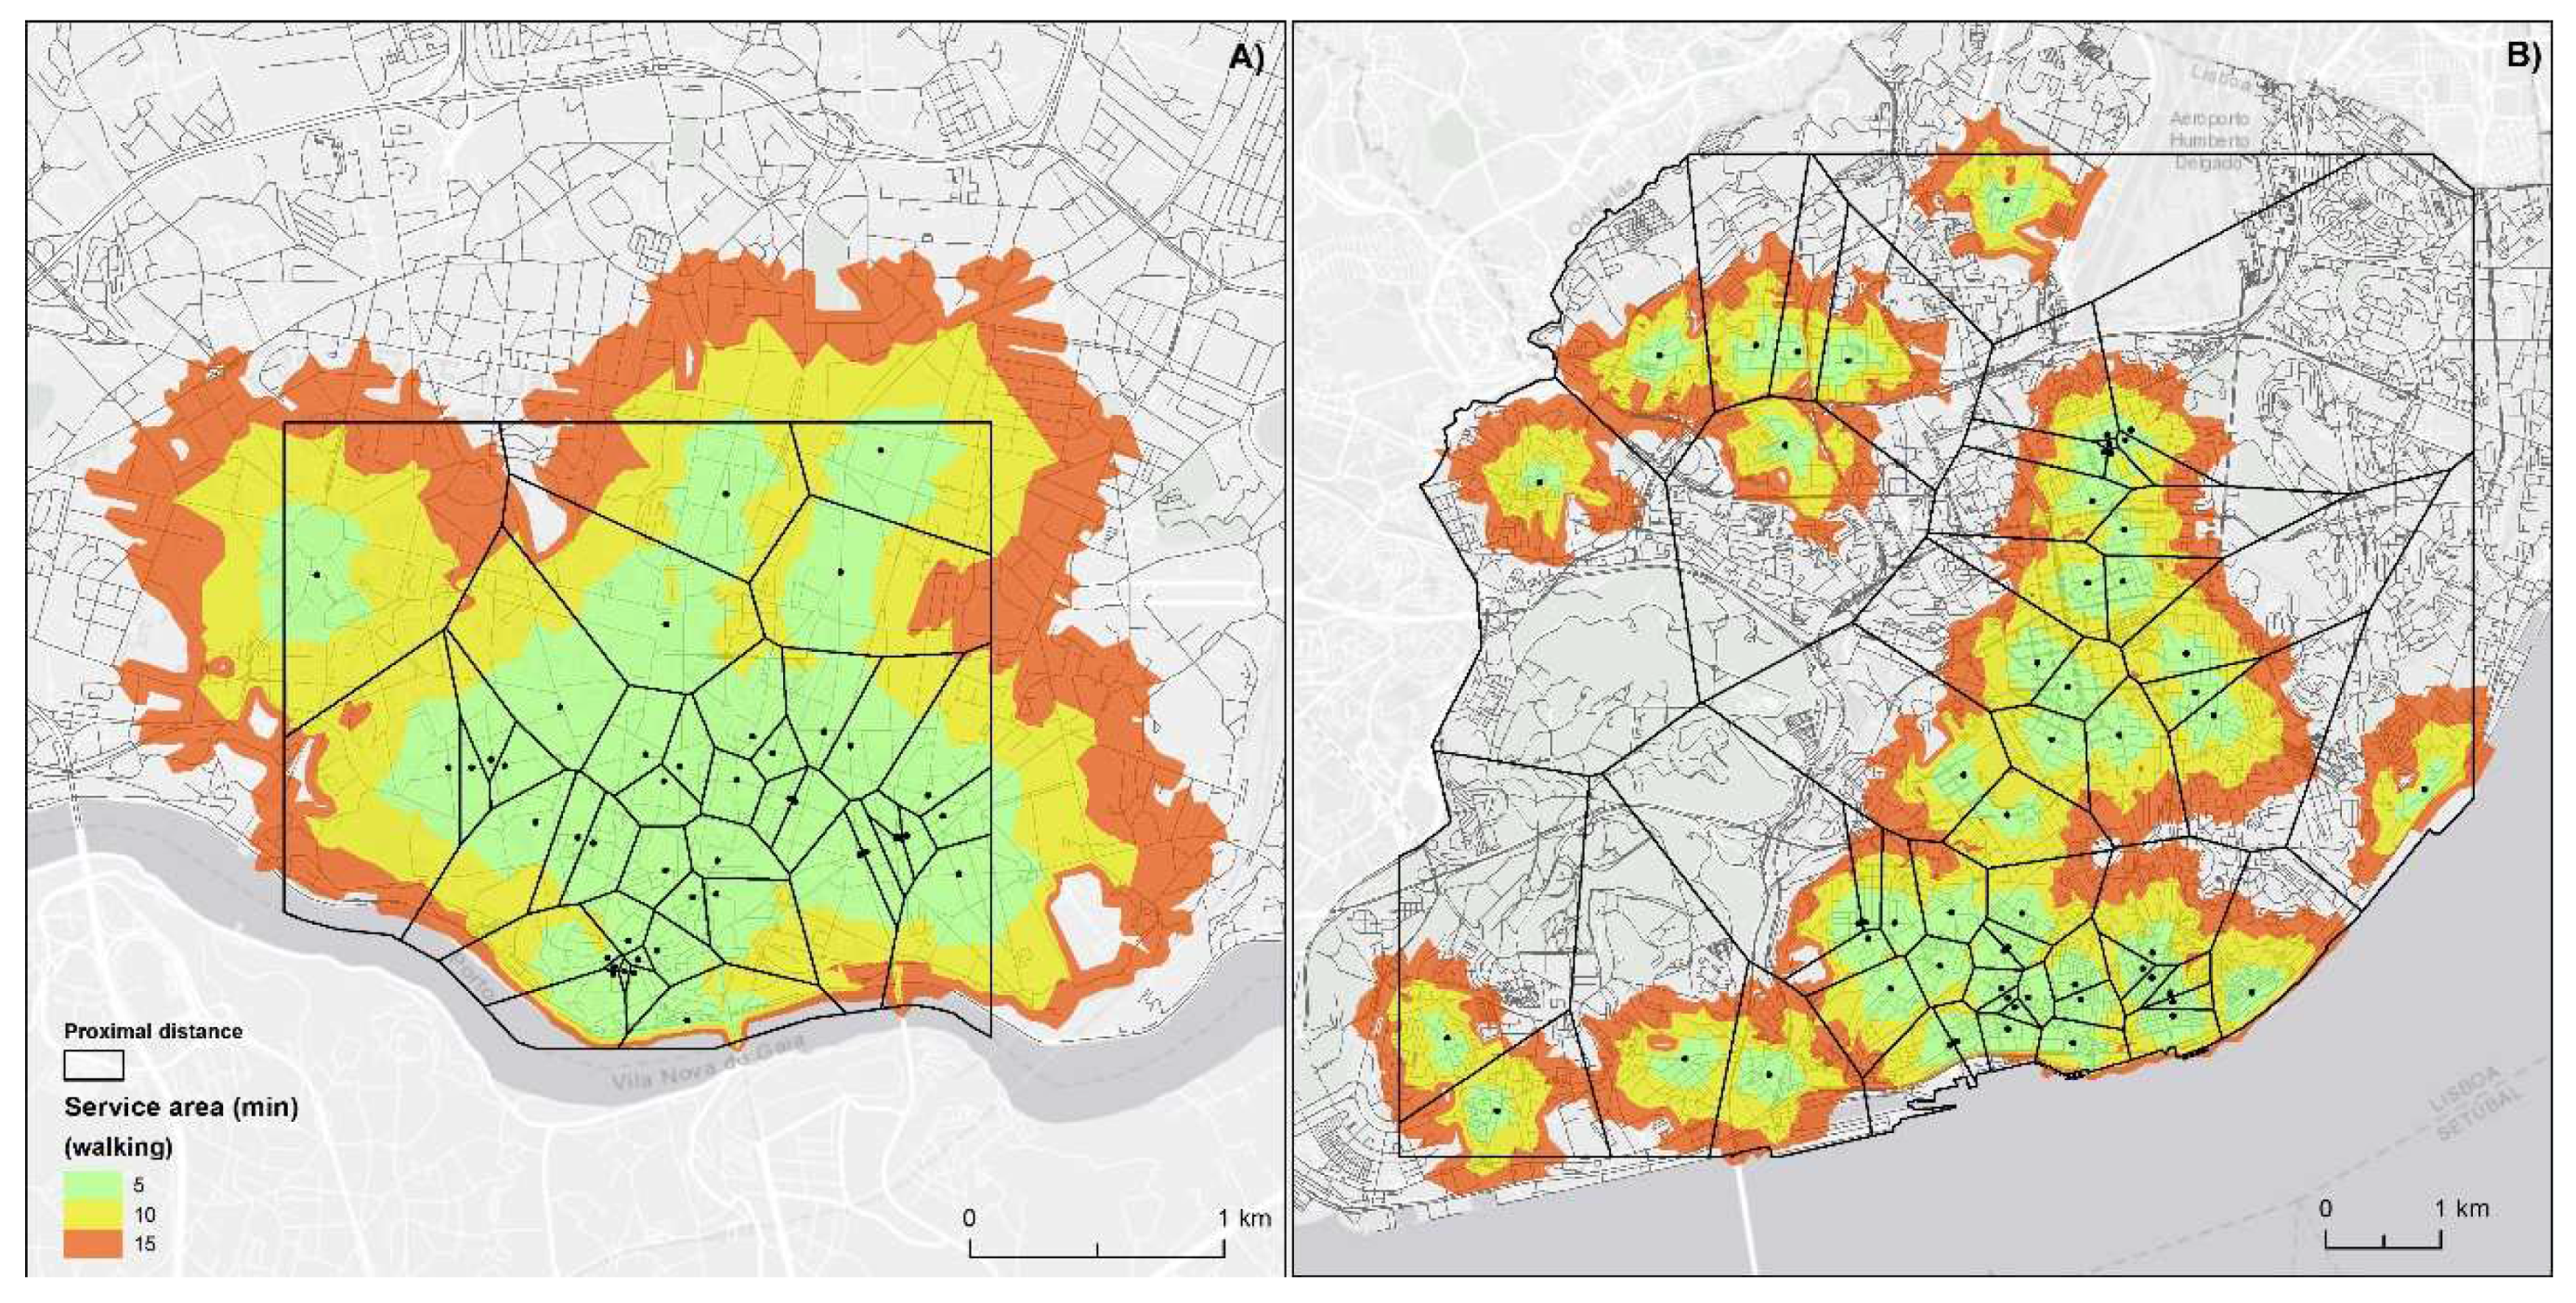
Thirdly, we analyze the influence area of the stores considering the concentric polygons method to elaborate the “travel times” to reach each store based on the shortest path algorithms [
28,
29]. Since they are specialized stores, i.e., they have a more unique and exclusive character, and due to this attribute it is considered that people are motivated to travel more to obtain these goods, which gives a greater weight, we considered the influence area through pedestrian movement within a distance of 1000 meters [
30]. According to [
31], a pedestrian moving freely has, in general, a speed that can vary from a minimum of approximately 1.04 m.s
-1 to a maximum of approximately 1.55 m.s
-1. However, [
32] considered 1.29 m.s
-1 as the appropriate value for pedestrian average speed [
32]. In order to to know the distance that can be covered in a given amount of time the road network was prepared considering the length of the road axes and a pedestrian average speed of 1.29 m.s
-1. Thus, the marking of 5, 10 and 15 minutes was determined as walking times to the store, hence creating the area of pedestrian influence. In order to design a more complete analysis, Voronoi diagrams were also used as it allow, simultaneously, to incorporate the attractiveness of the stores and the presence of nearby competition [
33,
34,
35]. Voronoi presented are in their simple form, i.e., not conjugated with other variables.
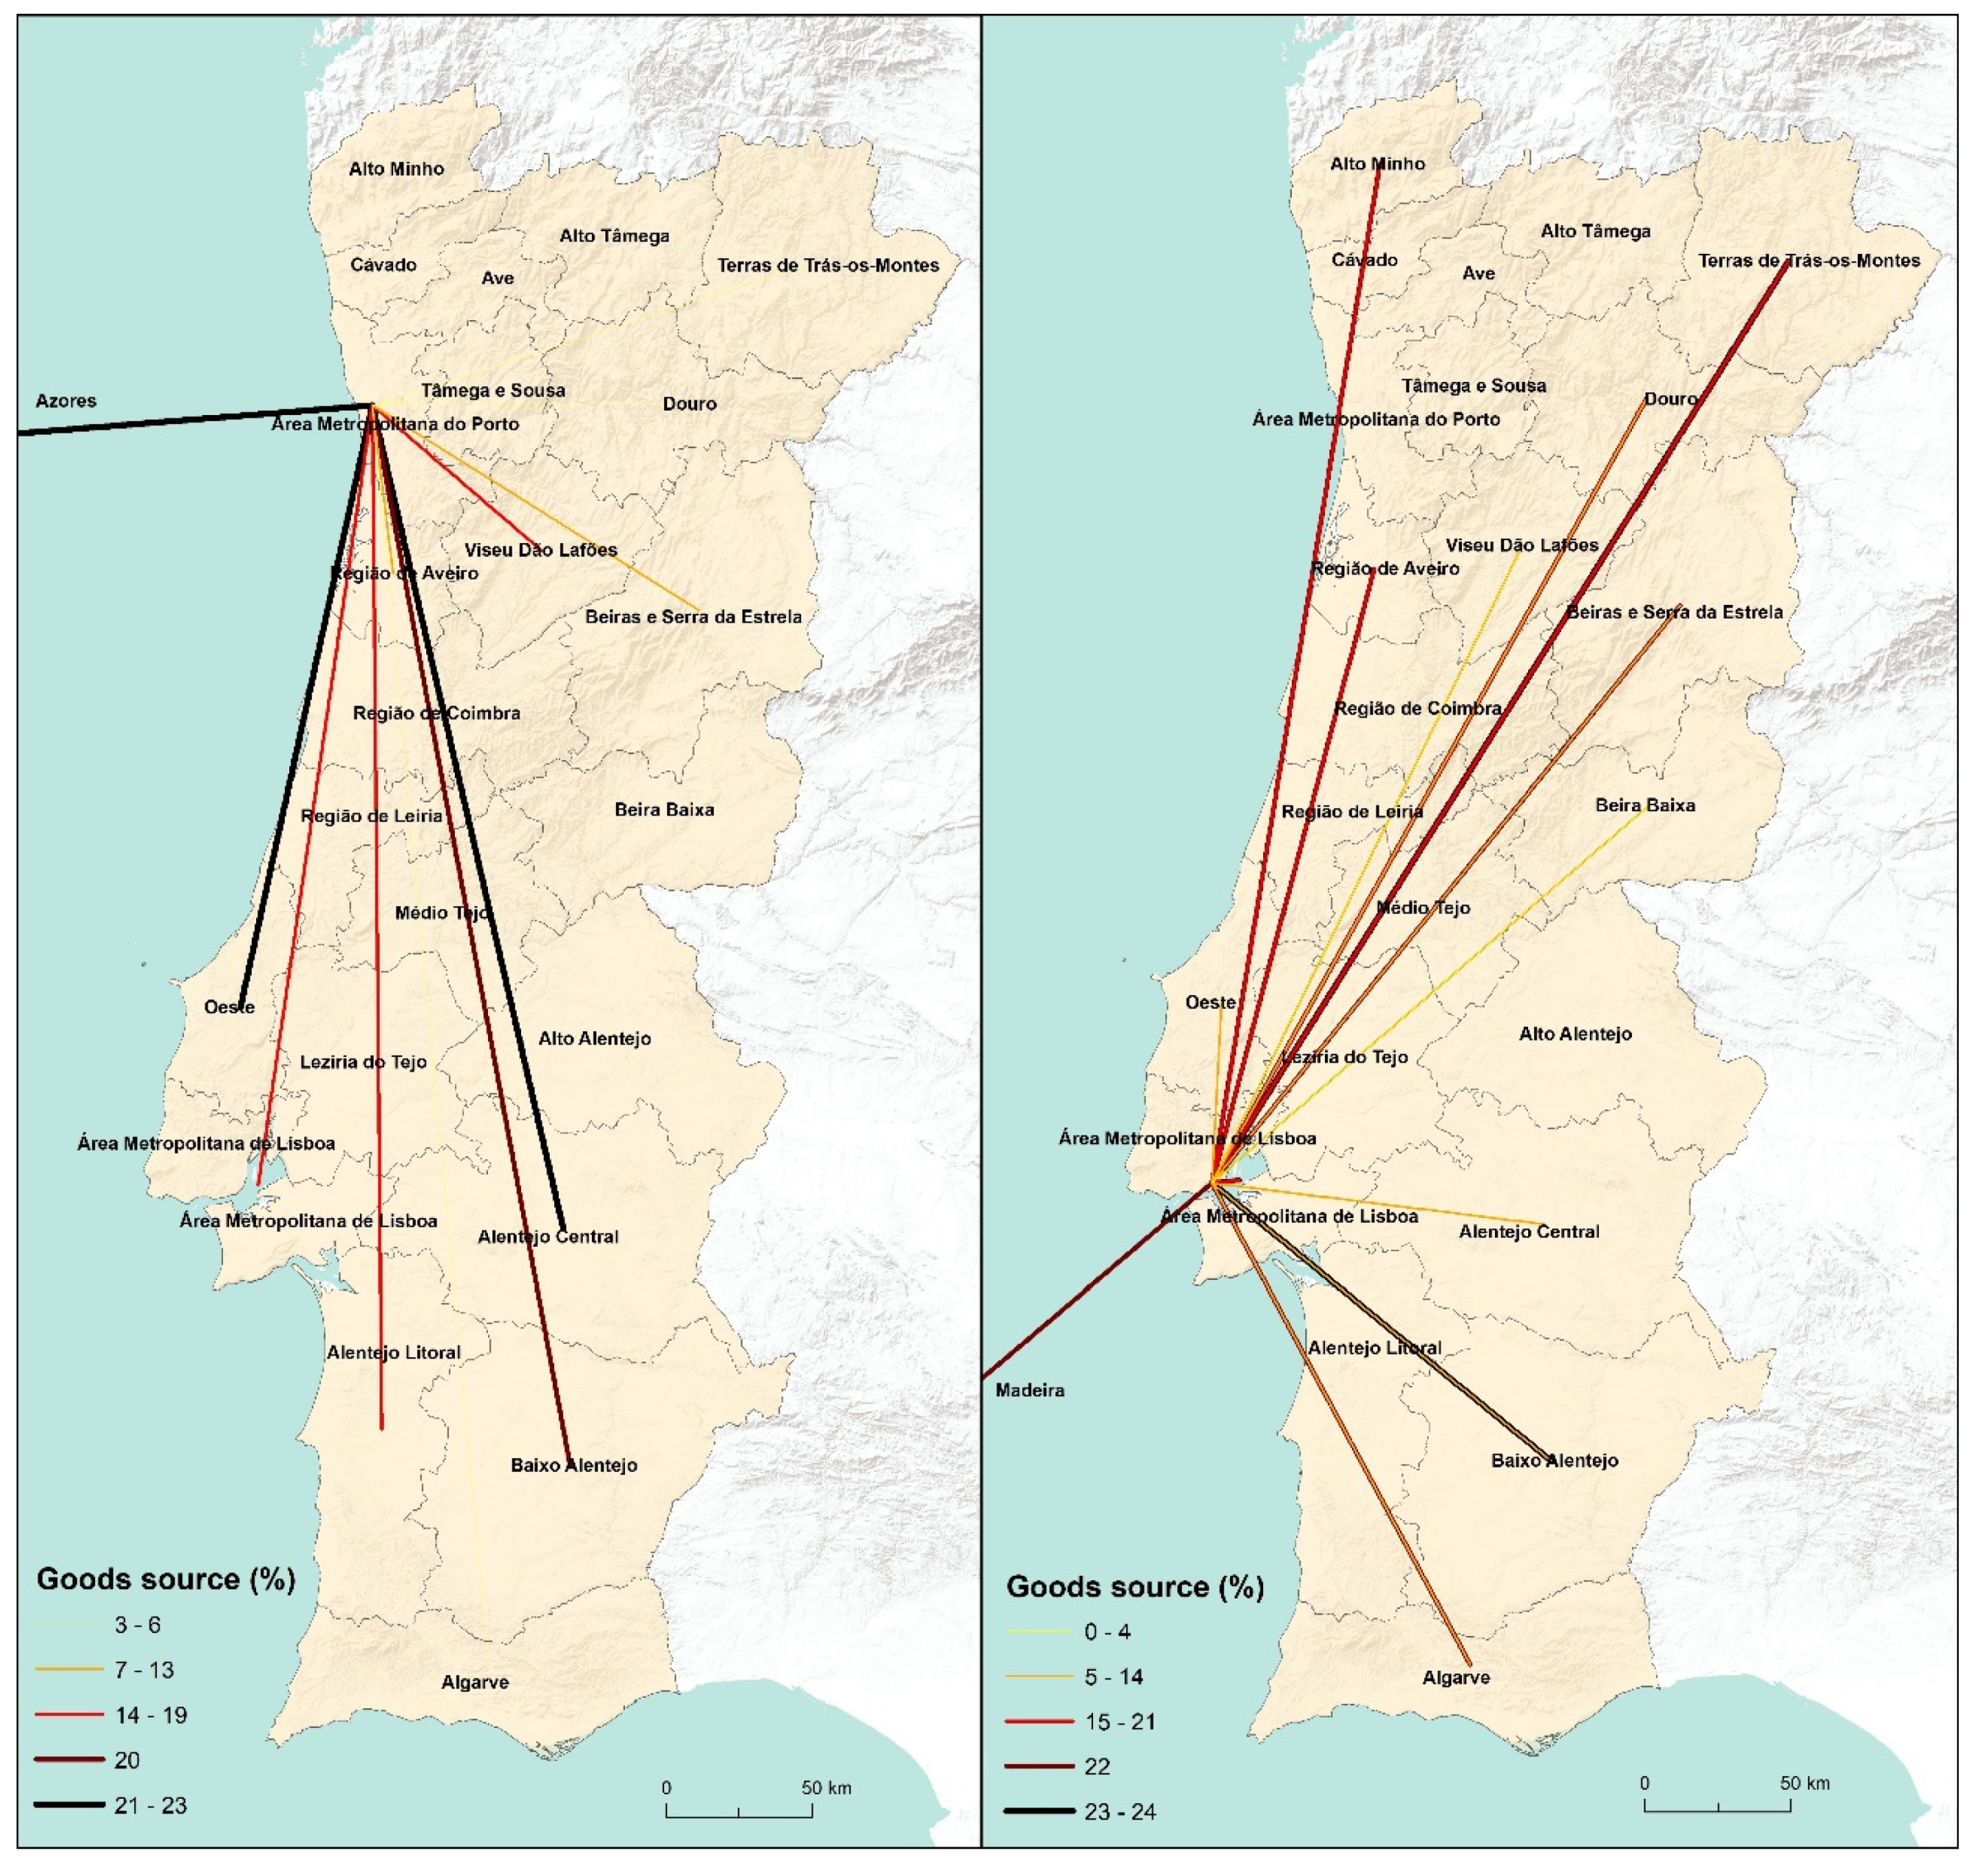
Fourthly, because one of the objectives of this study it to represent the supply chains between rural producers and stores, it was considered relevant to use flow maps as a tool to observe the relationships between the places where the products are sold (the cities of Lisbon and Oporto) and their places of origin (at NUTS III level). Flow maps are a mixture of maps and flowcharts, which show the movement of elements from one location to another, such as the number of people, the amount of goods and services traded, etc. These maps were used to understand geographical patterns in the supply chain of agri-food products, as they facilitate the interpretation and decoding of the relationship networks between production and marketing sites.
3. Results and Discussion
3.1. Geodemography of the Cities of Oporto and Lisbon
As can be seen in
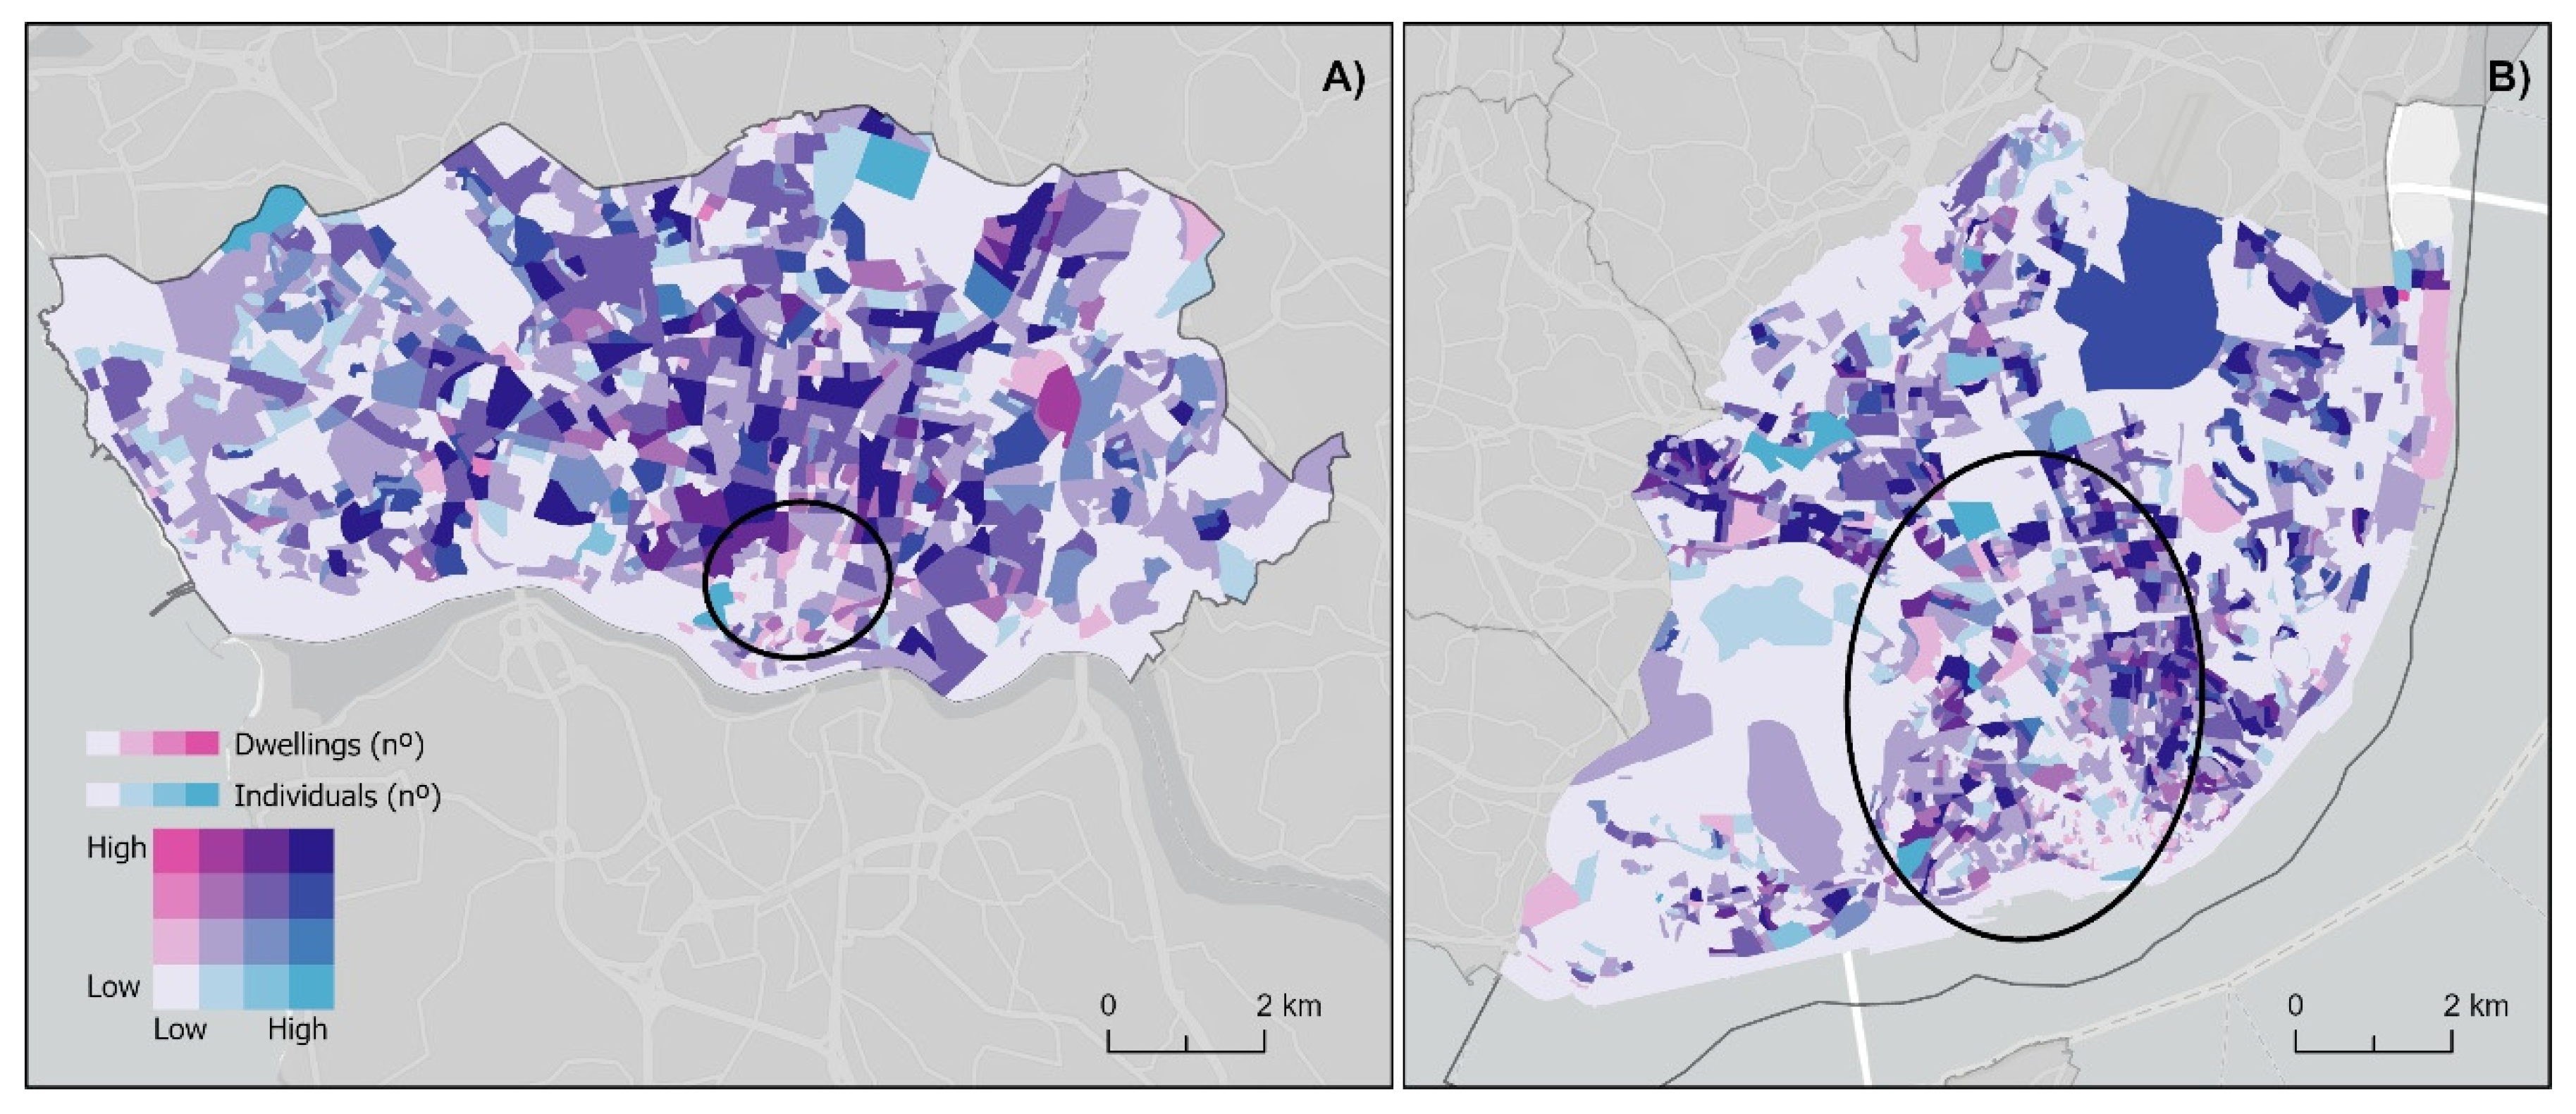
Figure 4 (A) and (B), using the directional distribution, it is possible to compare the location of the stores, respectively in the cities of Oporto and Lisbon, with the population variables (dwellings and resident population). Thus, with regard to the city of Oporto (
Figure 4A), it appears that the stores are located in subsections where the number of residents and dwellings is low compared to other areas of the city. This situation leads us to assume that the focus of most of these stores is not the marketing of rural food products to resident individuals, but to potential visitors or tourists [
36,
37]. This suggests that the dynamics of these stores is quite different from that of proximity stores, seeming to function mainly as anchor stores capable of attracting more diversified customers. In this sense, it can also be observed in
Figure 4A that at the same time that the resident population is reduced, the density of housing is high. This may mean that existing accommodation is either unoccupied or temporarily occupied (by tourists or people passing through the city), pointing to a gentrification phenomenon also seen in Lisbon [
38]. In order to objectify the visual perception, the percentage importance of each of the variables within the area of the directional distribution was calculated, varying the results between 5% and 7%. The calculated values are relatively low taking into account the number of stores analysed, reinforcing the fact that residents are not the focus of these stores, but visitors and/or tourists of the city.
In Lisbon, the directional distribution (
Figure 4B) has a slightly different behavior than in Oporto. In this city, the stores are dispersed throughout its area. This fact causes the area of the directional distribution to increase considerably, practically drawing a perfect circle of much larger dimensions. This suggests a focus on attracting customers that is different from Oporto, i.e., more diversified between residents and tourists, according to the also differentiated location in the interior of the city [
39]. Thus, we can consider that while the stores in Oporto tend to favor the historic center, which is sparsely populated or inhabited more temporarily [
36], the stores in the city of Lisbon are more dispersed throughout the urban area. Therefore, suggesting the existence of multiple 'centres' within the city (some more densely populated than others) and, eventually, a greater diversity of shops depending on their location and type of clientele [
40,
41].
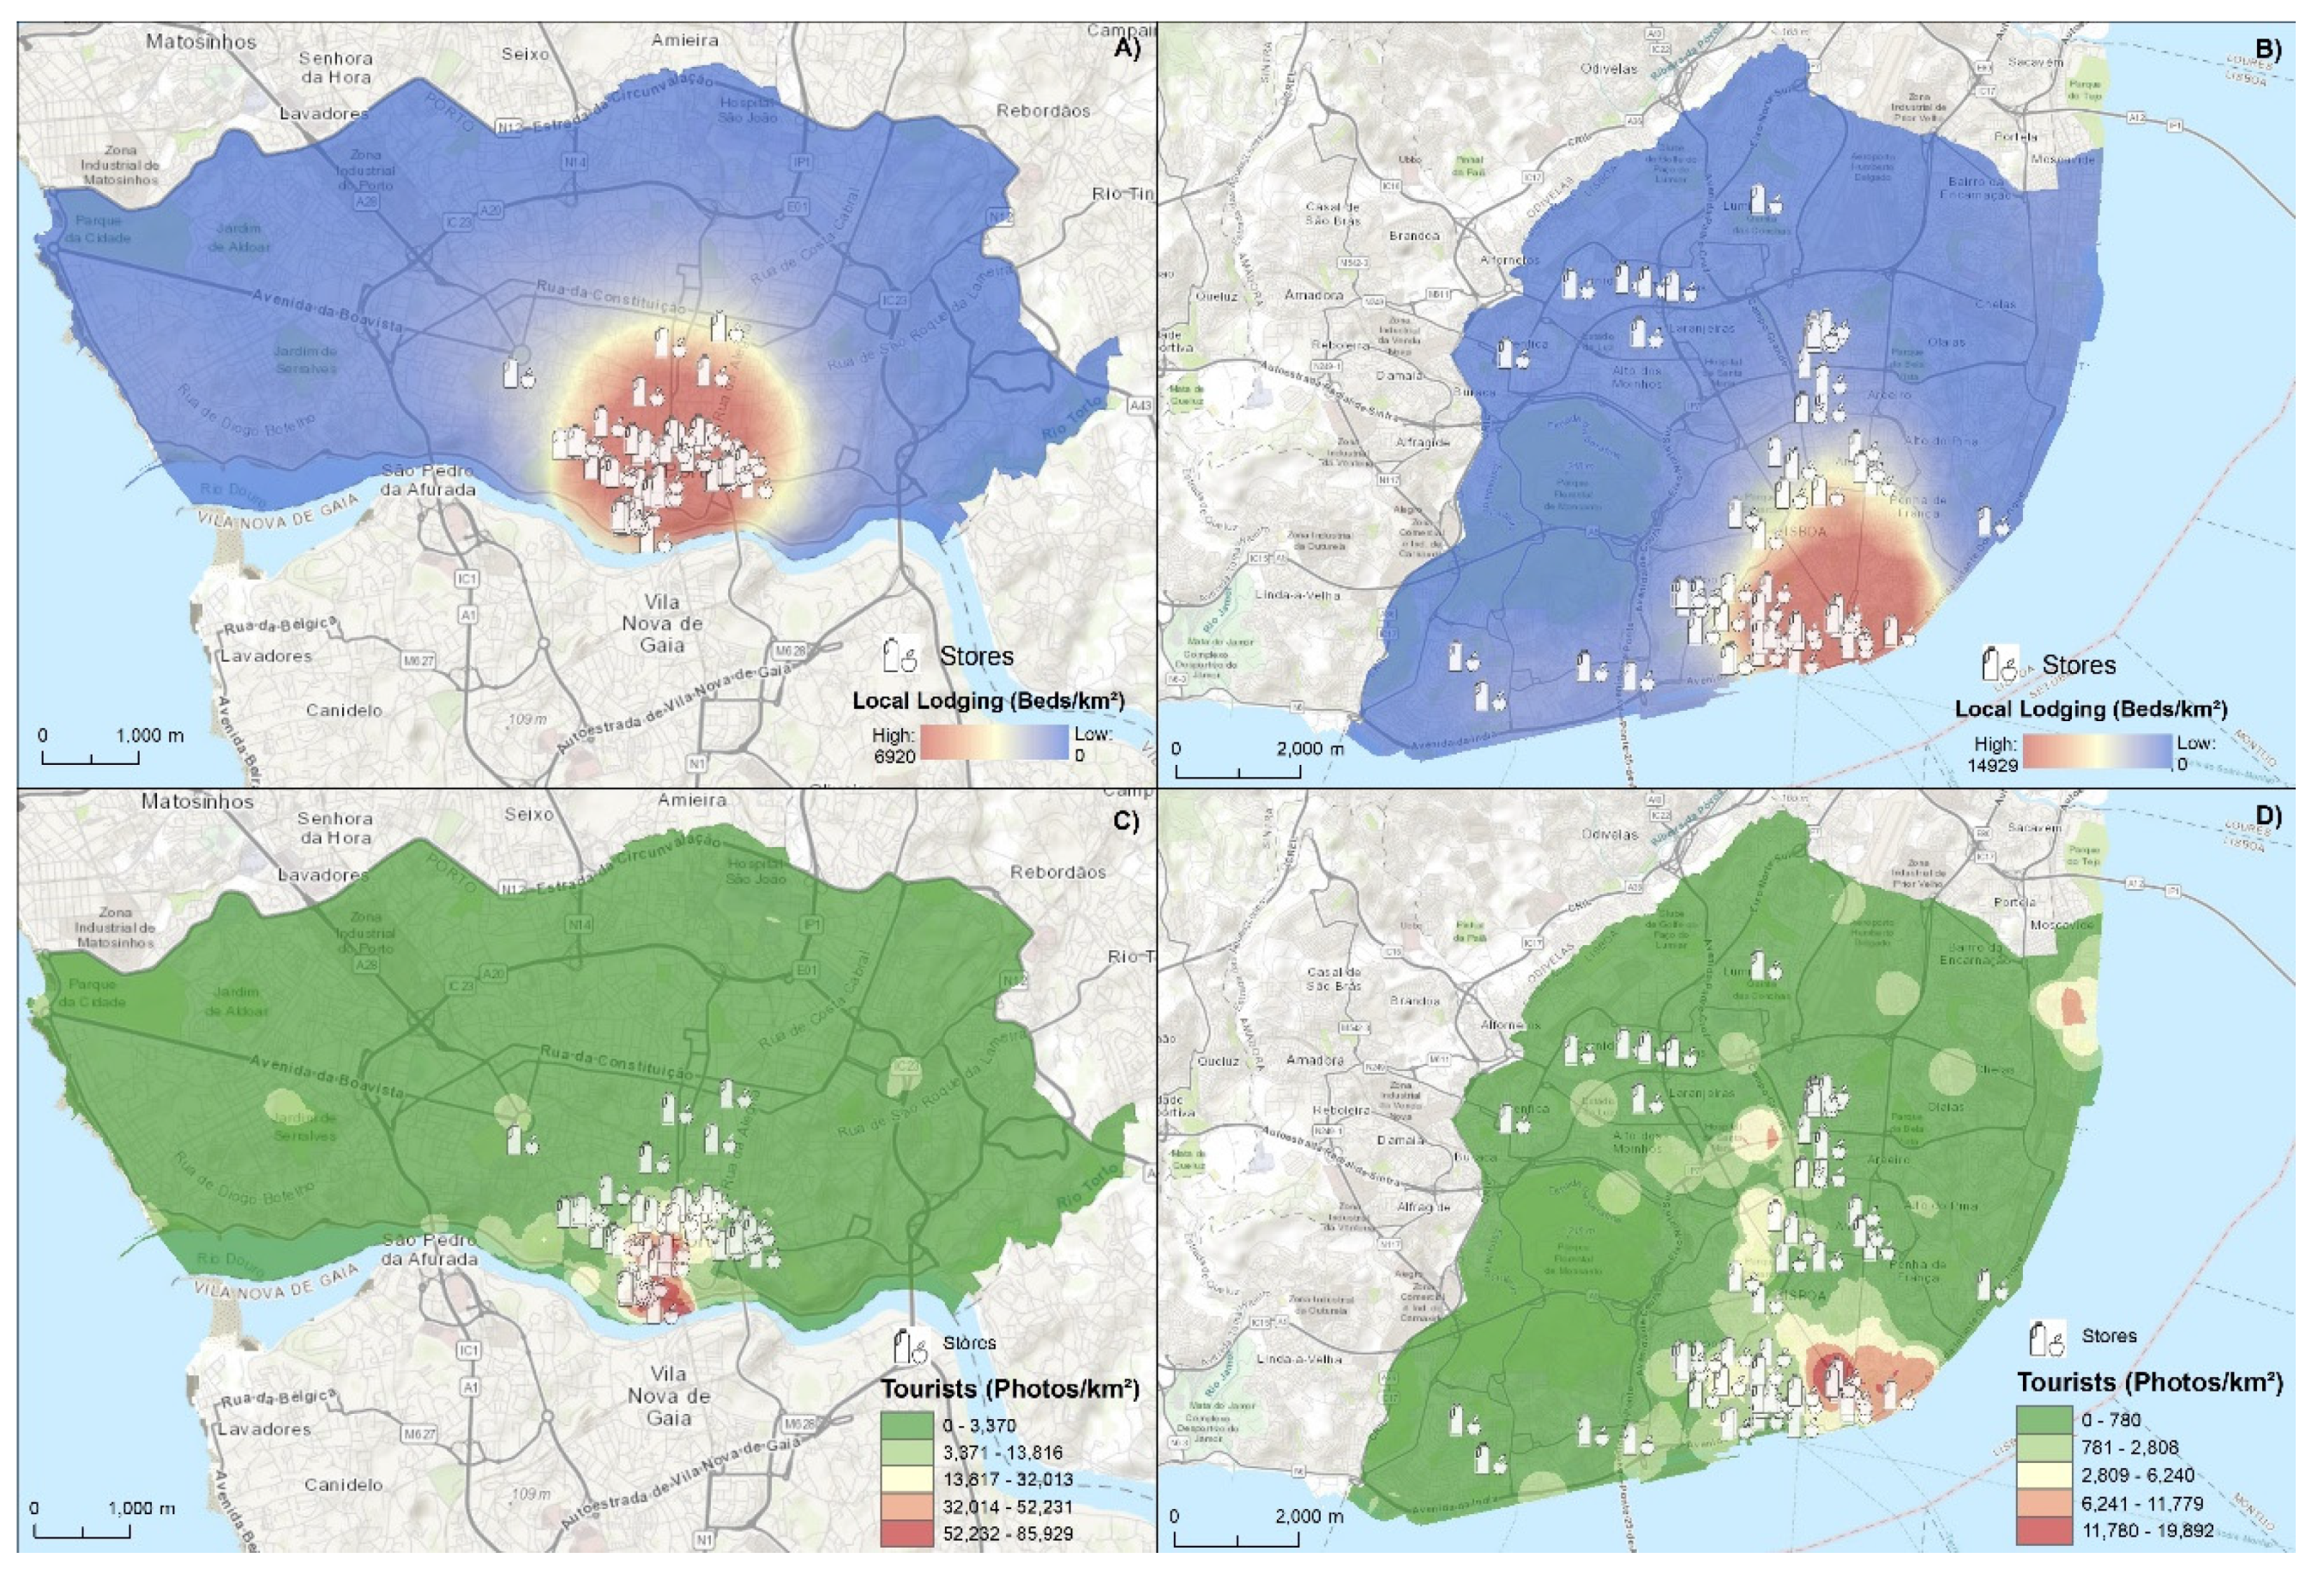
The density of accommodation compared to the area of influence of the stores (
Figure 5A and B) demonstrates the differences between Lisbon and Oporto, with the presence of stores in places with little housing and, consequently, with little potential to attract customers.
Still, regarding Figure 36 (C and D), we can see the hot spots representing the upload of geotaged photos by users of the social network Flickr between 2018 and 2021. From the analysis of the densities, it emerges that there is a high incidence of photos loaded (and consequently tourists) in the immediate vicinity of the stores. However, we have topoint out that we may be facing a cause-effect situation, that is, the stores can be located in places where there are many tourists or tourists can look for places where there are these stores
3.2. Spatial and Temporal Evolution of Store Locations in the Cities of Oporto and Lisbon
With regard to a more detailed analysis of the way stores are distributed within the two cities considered, the observed and expected average distances have quite different values. In general, the observed average distance, assuming that they are homogeneously distributed throughout the city, is different from the expected one. In the analysis of the spatial distribution of stores, not only the two cities were considered, but also the three clusters of stores, resulting from the hierarchical analysis of clusters carried out based on the type of agri-food products of rural origin sold by them.
As shown in
Table 2 and
Figure 6A, the Average Nearest Neighbor index in stores in the city of Oporto is less than 1 (that is, the observed distance is less than the expected distance) in all clusters of stores, which demonstrates its largest agglomeration. This conclusion is supported by the negative values of the Z-scores. Taking into account the different clusters, it appears that ‘The Rural Provenance Focused’ and ‘The Generalist’ have similar concentration levels, respectively -5 and -6, while the stores in ‘The Wine Focused’ cluster have a greater distribution across the territory.
In Lisbon, the characterization of the distribution is a little different from that verified in the Oporto (
Table 3 and
Figure 6B). In the city of Lisbon, The ‘Wine Focused’ cluster presents the Average Nearest Neighbor index just above one, suggesting a more dispersed distribution of stores. Here, cluster 1 has the nearest neighbor index slightly above one, that is, the stores here appear to be randomly distributed, with the same pattern of higher concentration observed for the remaining clusters.
In this sense, it can be concluded that the analyzed stores tend to have a strategy of greater agglomeration - with the exception of The ‘Wine Focused’ cluster in the city of Lisbon - probably associated with the benefits that can generally result from it, in terms essentially of capturing the interest of customers. visitors and tourists. In fact, given the p-value results – and again with the exception of the first cluster in Lisbon – there is less than a 1% probability that these clustering patterns are random.
Regarding the temporal evolution, as can be seen in
Figure 7A, in the city of Oporto there are some stores that sell agri-food products of rural origin, which were founded between the mid-nineteenth century and mid-twentieth century. It is interesting to note, in the case of the aforementioned stores, their spatial organization in a cluster, that is, their location close to each other, resulting in a directional distribution with a smaller area. It can also be seen in
Figure 7A that, over the following decades, the distribution of stores opened subsequently is dispersed throughout the city. In other words, there is a greater concentration of older stores in the historic center and a greater dispersion of newer stores in other areas of the city.
Also with regard to the evolution of stores over time, Lisbon also has some specific features (Figure 3.7B). Thus, as mentioned in the previous section on geodemography, when analyzing the evolution of store openings, greater dispersion is also observed. Thus, the directional distribution of the first stores opened in Lisbon forms an ellipse with a North-South direction in the interior of the city. However, as new stores open, this format has become rounder, occupying a larger area of the city and revealing – as mentioned – a greater dispersion. In the city of Lisbon there is a predominance of stores opened more recently. This means that most of the stores in this city opened after 2011, dispersing themselves throughout the city, although – as in Oporto – there is a greater concentration in the vicinity of the historic centre.
From the previously analyzed aspects, we can conclude that the growth of urban stores specialized in the commercialization of agri-food products is a reality in the two analyzed cities, accompanying the interest of national and international consumers. On the other hand, as we could see, there are some similarities between the two cities under analysis:
In all of them, the directional distribution increased in area, moving from an ellipsoid shape to a more harmonized circular shape and dispersed throughout the urban territory. This situation is, however, more evident in the city of Lisbon, partly due to its greater extension and the existence of several urban 'centres';
Most of the stores in the two cities opened in the last decade and a half, although there are centenary stores in the cities of Oporto and Lisbon. The recent nature of these stores draws attention to their probable relationship with the increase in tourist flows that have been observed in the three cities in recent years;
The greater concentration of stores in the historic centers or in their immediate vicinity also suggests their greater focus on marketing agri-food products of rural origin to visitors and tourists, without prejudice to the fact that in some cases, the focus is also on local residents.
3.3. Area of Influence of Stores in the Cities of Oporto and Lisbon
In
Figure 8A, it can be observed that the areas of influence corresponding to 5 minutes are generally interconnected in the city of Oporto. Such a situation, although it may generate competition between stores, can also boost economies of scale and contribute to increasing the attractive potential of stores as a whole. As can also be seen in
Figure 8B, as there is greater dispersion in the distribution of the stores analyzed in the city of Lisbon, there is a greater percentage of stores that have larger areas of influence, that is, without competition in their vicinity. There are no significant differences in these patterns when considering the different clusters of stores.
3.3. Supply Chains for Agri-Food Products in the Cities of Oporto and Lisbon
In
Figure 9, we can identify clear differences with regard to the regions of origin of the products depending on the cities where the analyzed stores are located. On the other hand, and unsurprisingly, it should be mentioned that the largest percentage of products marketed by the latter comes from NUTS III corresponding to the interior of Portugal. Thus, more than 85% of the stores located in the city of Oporto sell products from the northern region of the country, particularly from NUTS III in the Douro, Terras de Trás-os-Montes and Beiras and Serra da Estrela. With regard to the stores located in the city of Lisbon, they sell agri-food products from a greater number of NUTS III. Although the Central and West Alentejo regions are more relevant, the products from the Douro and Terras de Trás-os-Montes regions are equally important for the stores located in this city. In this sense, it is possible to conclude that even though the stores located in the two cities considered seem to essentially value products from the closest regions, the stores located in the city of Lisbon seek to sell products from almost the entire country, in line with what is referred to by [
42].
As mentioned, The Wine Focused cluster stores more often sell products from the northern region of the country, especially from the Douro sub-region. This is probably due to the fact that wine as an importante correlation with the landscape and territorial identity [
3]. The stores in The Rural Provenance Focused cluster more often sell products from the Center region – with special emphasis on the region of Beiras and Serra da Estrela – essentially due to the importance of cheese and sausages. Still for this cluster, the Center region is followed by the North region. Finally, The Generalist cluster stores, selling mainly agri-food products associated with vegetables and olive oil, also seem to value the North and Center regions of the country more.
4. Conclusions
In this study, based on the recognition of the importance of urban stores specializing in the sale of agri-food products from rural Portugal, we performed a spatial analysis of those stores, investigating their location within the cities of Lisbon and Oporto, taking into account the resident population and existing dwellings. We try to understand the spatiotemporal evolution of their locations and their distribution in different urban areas, and comprehend their area of influence and the relationship between the location and the places most frequented by tourists and visitors. In addition, we propose to analyze the relationships between urban stores and the territories where the products they sell come from. All of this with the objective of, on the one hand, better understanding the insertion of these stores in the analyzed urban territories and, on the other hand, the links they can promote with the rural territories where, more often, the products sold originate.
Despite the existence of some centuries-old stores in the cities of Oporto and Lisbon, the recent nature of most of these points of sale stands out, accompanying the growth of tourist flows, in the country and in the cities analyzed, over the last few years. The geodemographic analysis demonstrates that, in terms of directional distribution, there is a greater agglomeration of stores in the historic, less populated centres, of both cities, although the city of Lisbon presents a pattern of greater dispersion. Thus, while in Oporto historical centers seem to be favored for the location of these stores, in Lisbon, in addition to the historic center, other ‘centres’ within the city are also favored. As we mentioned earlier, these patterns also seem to indicate a greater focus on tourists and visitors as target customers, a trend corroborated by their spatiotemporal evolution within the urban territories considered. In fact, the indicators of this evolution and its direction show some similarities in the two cities. First, it was observed that the directional distribution of the distribution of stores increased in area, simultaneously pointing to its growth and to its greater spread within cities. Secondly, the greater concentration of older and more recent stores in or near historic centers emphasizes the tendency to sell products to a more temporary audience, such as visitors and tourists.
The spatial distribution of stores taking into account the Average Nearest Neighbor index shows that the stores analyzed in the three cities – but especially in Oporto – have precisely a location strategy associated with greater crowding, probably related to the benefits that may result from this situation. This result corroborates the data relating to the analysis of the area of influence of the stores, which point to the existence of a concentration of stores (once again, above all in the city of Oporto). As we have seen, this situation, although it may generate some competition between stores that sell similar agri-food products, can also encourage the benefits of economies of scale and contribute to promoting the attractiveness of the stores. In the city of Lisbon, due to a greater dispersion of stores, it was possible to observe that a greater percentage of stores have larger areas of influence, also suggesting less competition among themselves.
Finally, the flow maps relating to the relationships between the stores located in the two cities under analysis and the places where the agri-food products that are marketed come from, demonstrate the appreciation – by retailers – of products originating from closer regions. This is especially true for stores located in Oporto, which tend, as we have seen, to sell products from the Aveiro region and the Douro and Terras de Trás-os-Montes regions, respectively. Lisbon stores, although also following a pattern of preference for products produced in closer regions (such as Central and West Alentejo), are more dispersed in terms of the regions of origin of the products they sell.
In short, this article demonstrates the importance of spatial analysis and geographic information systems in understanding the similarities and differences between stores depending on their location. We are, however, aware that a good part of this analysis must be carried out in greater detail, taking into account the variables associated with the history of the different urban contexts considered, their demographic, social, economic and territorial dynamics, as well as the evolution of tourist flows and also the supply chains and relations with the regions of origin of the products that are marketed.
Author Contributions
Conceptualization, E.F. and J.R.; methodology, J.R.; validation, C.R., J.R. and E.F.; formal analysis, C.R., I.G. and C.V.; investigation, C.R.; resources, I.G. and C.V.; data curation, I.G. and C.V.; writing—original draft preparation, C.R, J.R. and E.F.; writing—review and editing, I.G., C.V., J.R. and E.F.; supervision, J.R. and E.F.; project administration, E.F.; funding acquisition, E.F. All authors have read and agreed to the published version of the manuscript.
Funding
This research was funded by the Foundation for Science and Technology (FCT), grant number PTDC/GES-OUT/29281/2017/ POCI-01-0145-FEDER-02928 (E.F. and J.R.). Cláudia M.Viana was funded by the Foundation for Science and Technology (FCT), grant number 2022.09372.PTDC and Inês Girão was funded by the Foundation for Science and Technology (FCT), grant number SFRH/BD/138979/2018.
Data Availability Statement
Acknowledgments
We would like to thank the GEOMODLAB - Laboratory for Remote Sensing, Geographical Analysis and Modelling—of the Center of Geographical Studies/IGOT for providing the required equipment and software.
Conflicts of Interest
The authors declare no conflict of interest.
References
- Nishimura, A.Z.F.C.; Moreira, A.; Au-Yong-Oliveira, M.; Sousa, M.J. Effectiveness of the Portugal 2020 Programme: A Study from the Citizens’ Perspective. Sustainability 2021, 13. [Google Scholar] [CrossRef]
- O’Connell, V. Synthesised Policy Recommendations relevant to rural-urban interactionsand interdependencies; 2021.
- Lavrador, A.; Rocha, J. The Role of Landscape in the Representation of Portuguese Wine Producing Regions. In Geospatial Intelligence; IGI Global, 2019; pp. 1602–1623.
- Pacciani, A.; Belletti, G.; Marescotti, A.; Scaramuzzi, S. The Role of Typical Products in Fostering Rural Development and the Effects of Regulation (EEC). In; 2001.
- Fonte, M. Knowledge, Food and Place. A Way of Producing, a Way of Knowing. Sociol. Ruralis 2008, 48, 200–222. [Google Scholar] [CrossRef]
- Bianchi, C.; Mortimer, G. Drivers of local food consumption: a comparative study. Br. Food J. 2015, 117, 2282–2299. [Google Scholar] [CrossRef]
- Renting, H.; Marsden, T.K.; Banks, J. Understanding Alternative Food Networks: Exploring the Role of Short Food Supply Chains in Rural Development. Environ. Plan. A Econ. Sp. 2003, 35, 393–411. [Google Scholar] [CrossRef]
- Kneafsey, M.; Venn, L.; Bos, E. Consuming Rural Connections: Tracing Leeks Back to Their Roots. In Transforming the Rural; Research in Rural Sociology and Development; Emerald Publishing Limited, 2017; Vol. 24, pp. 221–243 ISBN 978-1-78714-823-9, 978-1-78714-824-6.
- Figueiredo, E. Rural Provenance Food as Cultural Heritage: A Way of Promoting Territorial Development. In Handbook of Research on Cultural Heritage and Its Impact on Territory Innovation and Development; Oliveira, L., Amaro, A.C., Melro, A., Eds.; IGI Global: Hershey, PA, USA, 2021; pp. 114–137. ISBN 9781799867012. [Google Scholar]
- Silva, A.; Figueiredo, E.; Truninger, M.; Eusébio, C.; Forte, T. A typology of urban speciality shops selling rural provenance food products – a contribution from Portugal. Br. Food J. 2021, 123, 3902–3917. [Google Scholar] [CrossRef]
- Hinrichs, C.C. Embeddedness and local food systems: notes on two types of direct agricultural market. J. Rural Stud. 2000, 16, 295–303. [Google Scholar] [CrossRef]
- Viana, C.M.; Freire, D.; Abrantes, P.; Rocha, J. Evolution of agricultural production in Portugal during 1850–2018: A geographical and historical perspective. Land 2021, 10. [Google Scholar] [CrossRef]
- Kavita, K.M.; Patil, G. Geographic information system (GIS)–for business analytics. Int. J. Sci. Eng. Res. 2011, 2, 1–6. [Google Scholar]
- Cachinho, H.A. P. O comércio retalhista português: pós-modernidade, consumidores e espaço; 2002; ISBN 9728170815.
- Fernandes, J.A. R.; Cachinho, H.; Ribeiro, C.V.; Fernandes, M.G.; Gomes, F.A. R.; Marques, T.S.; Martins, L.P. S.; Mealha, R.P.; Moreira, P.; Pereira, V.B. Comércio tradicional em contexto urbano: dinâmicas de modernização e políticas públicas: relatório final. 2000.
- Chamusca, P.; Fernandes, J.A. R.; Lopes, R.M. R.; Tavares, F. O comércio como património: o projeto Lojas com História. In As dimensões e a responsabilidade social da Geografia: XI Congresso da Geografia Portuguesa: livro de atas; 2017.
- Singer, A.E. Strategies of distinction: Aesthetic materiality and restrained discourse. Poetics 2018, 67, 26–38. [Google Scholar] [CrossRef]
- Espinosa Seguí, A. La especialización del sector minorista de alimentación en Dortmund (Alemania). Investig. Geográficas. Núm. 56, 2011.
- Encalada, L.; Ferreira, C.C.; Rocha, J.; Boavida-Portugal, I. Geographical Patterns in the Tourist City: GIS for Spatiotemporal Analysis. In GIS Applications in the Tourism and Hospitality Industry; Chaudhuri, S., Ray, N., Eds.; IGI Global: Hershey, PA, USA, 2018; pp. 76–97. ISBN 9781522550884. [Google Scholar]
- Encalada, L.; Boavida-Portugal, I.; Cardoso Ferreira, C.; Rocha, J. Identifying Tourist Places of Interest Based on Digital Imprints: Towards a Sustainable Smart City. Sustain. 2017, 9. [Google Scholar] [CrossRef]
- Encalada-Abarca, L.; Ferreira, C.C.; Rocha, J. Revisiting city tourism in the longer run: an exploratory analysis based on LBSN data. Curr. Issues Tour. 2023, 1–16. [Google Scholar] [CrossRef]
- Encalada-Abarca, L.; Ferreira, C.C.; Rocha, J. Measuring Tourism Intensification in Urban Destinations: An Approach Based on Fractal Analysis. J. Travel Res. 2022, 61, 394–413. [Google Scholar] [CrossRef]
- Berry, T.; Newing, A.; Davies, D.; Branch, K. Using workplace population statistics to understand retail store performance. Int. Rev. Retail. Distrib. Consum. Res. 2016, 26, 375–395. [Google Scholar] [CrossRef]
- Rokseth, L.S.; Heinen, E.; Hauglin, E.A.; Nordström, T.; Manum, B. Reducing private car demand, fact or fiction? A study mapping changes in accessibility to grocery stores in Norway. Eur. Transp. Res. Rev. 2021, 13. [Google Scholar] [CrossRef]
- Harris, L.C.; Ogbonna, E. Competitive advantage in the UK food retailing sector: past, present and future. J. Retail. Consum. Serv. 2001, 8, 157–173. [Google Scholar] [CrossRef]
- Ebdon, D. Statistics in geography second edition: A practical approach. Malden, MA Blackwell Publ.
- Fernández-Peña, E.; Castellano, J.; Amatori, S.; Rocchi, M.B. L.; Sisti, D. A directional ellipse to describe directional behavior and player activity area in soccer. Proc. Inst. Mech. Eng. Part P J. Sport. Eng. Technol. 2021, 236, 341–350. [Google Scholar] [CrossRef]
- Cowen, D.J.; Jensen, J.R.; Shirley, W.L.; Zhou, Y.; Remington, K. Commercial real estate GIS site evaluation models: Interfaces to ArcView GIS. In Proceedings of the 20o Annual ESRI International User Conference; 2000; pp. 140–145. [Google Scholar]
- Salvaneschi, L. Location, Location, Location: How to select the best site for your business; Oasis Press/PSI Research, 1996; ISBN 1555713769.
- Burton, E.; Mitchell, L. Inclusive urban design: Streets for life; Elsevier, 2006; ISBN 0750664584.
- Forde, A.; Daniel, J. Pedestrian walking speed at un-signalized midblock crosswalk and its impact on urban street segment performance. J. Traffic Transp. Eng. (English Ed. 2021, 8, 57–69. [Google Scholar] [CrossRef]
- Bohannon, R.W.; Williams Andrews, A. Normal walking speed: a descriptive meta-analysis. Physiotherapy 2011, 97, 182–189. [Google Scholar] [CrossRef] [PubMed]
- Ohyama, T. Some Voronoi diagrams that consider consumer behavior analysis. Jpn. J. Ind. Appl. Math. 2005, 22, 279–290. [Google Scholar] [CrossRef]
- Boots, B.; South, R. Modeling retail trade areas using higher-order, multiplicatively weighted voronoi diagrams. J. Retail. 1997, 73, 519–536. [Google Scholar] [CrossRef]
- Boots, B.; Shiode, N. Recursive Voronoi Diagrams. Environ. Plan. B Plan. Des. 2003, 30, 113–124. [Google Scholar] [CrossRef]
- Fernandes, J.; Chamusca, P.; Pinto, J.; Tenreiro, J.; Figueiredo, P. Urban Rehabilitation and Tourism: Lessons from Porto (2010-2020). Sustainability 2023, 15. [Google Scholar] [CrossRef]
- Fernandes, J.R.; Chamusca, P. Urban policies, planning and retail resilience. Cities 2014, 36, 170–177. [Google Scholar] [CrossRef]
- Mendes, L. Bye Bye Lisbon: Tourism Gentrification Impacts on Lisbon´s Inner-City Housing Market. In Handbook of Research on the Impacts, Challenges, and Policy Responses to Overtourism; Ribeiro de Almeida, C., Quintano, A., Simancas, M., Huete, R., Breda, Z., Eds.; IGI Global: Hershey, PA, USA, 2020; pp. 136–155. ISBN 9781799822240. [Google Scholar]
- Guimarães, P. Tourism and Authenticity: Analyzing Retail Change in Lisbon City Center. Sustainability 2022, 14. [Google Scholar] [CrossRef]
- Guimarães, P.P. Tracing the path to retail gentrification: Insights from Marvila, Lisbon. J. Urban Regen. Renew. 2022, 15, 406–424. [Google Scholar]
- Guimarães, P.P. C. Unfolding authenticity within retail gentrification in Mouraria, Lisbon. J. Tour. Cult. Chang. 2022, 20, 221–240. [Google Scholar] [CrossRef]
- Forte, T.; Figueiredo, E.; Silva, A. “An incredible voyage through Portugal” – the promotion of rural provenance foods by urban specialty shops. Food, Cult. Soc. 2022; 1–22. [Google Scholar] [CrossRef]
|
Disclaimer/Publisher’s Note: The statements, opinions and data contained in all publications are solely those of the individual author(s) and contributor(s) and not of MDPI and/or the editor(s). MDPI and/or the editor(s) disclaim responsibility for any injury to people or property resulting from any ideas, methods, instructions or products referred to in the content. |
© 2023 by the authors. Licensee MDPI, Basel, Switzerland. This article is an open access article distributed under the terms and conditions of the Creative Commons Attribution (CC BY) license (http://creativecommons.org/licenses/by/4.0/).
