Submitted:
27 June 2023
Posted:
28 June 2023
You are already at the latest version
Abstract
Keywords:
1. Introduction
2. Materials and Methods
2.1. Multifractal measures
2.2. Temporal evolution of multifractal measures
- If D+∞ rises faster than D-∞, then ΔD decreases and 0 < DGR < 1. This type of change indicates that the growth of built-up areas is primarily due to filling in central areas, leading to a decrease in spatial heterogeneity. This direction of urban evolution is commonly observed in empirical research.
- If D-∞ rises faster than D+∞, then ΔD rises and DGR > 1. This type of change indicates that the growth of built-up areas is dominated by filling in marginal areas, leading to an increase in spatial heterogeneity. This marks the beginning of expansion of marginal areas, where the fractal dimension has rapidly increased.
- If D-∞ decreases, then ΔD decreases and DGR < 0. This type of change indicates that the original low-density areas are rapidly filled into medium- to high-density areas, resulting in fewer new low-density areas, reduced dimensions and spatial heterogeneity. This marks the transformation of original marginal areas into new sub-central areas.
2.3. Study area and data processing
3. Results
- 1.
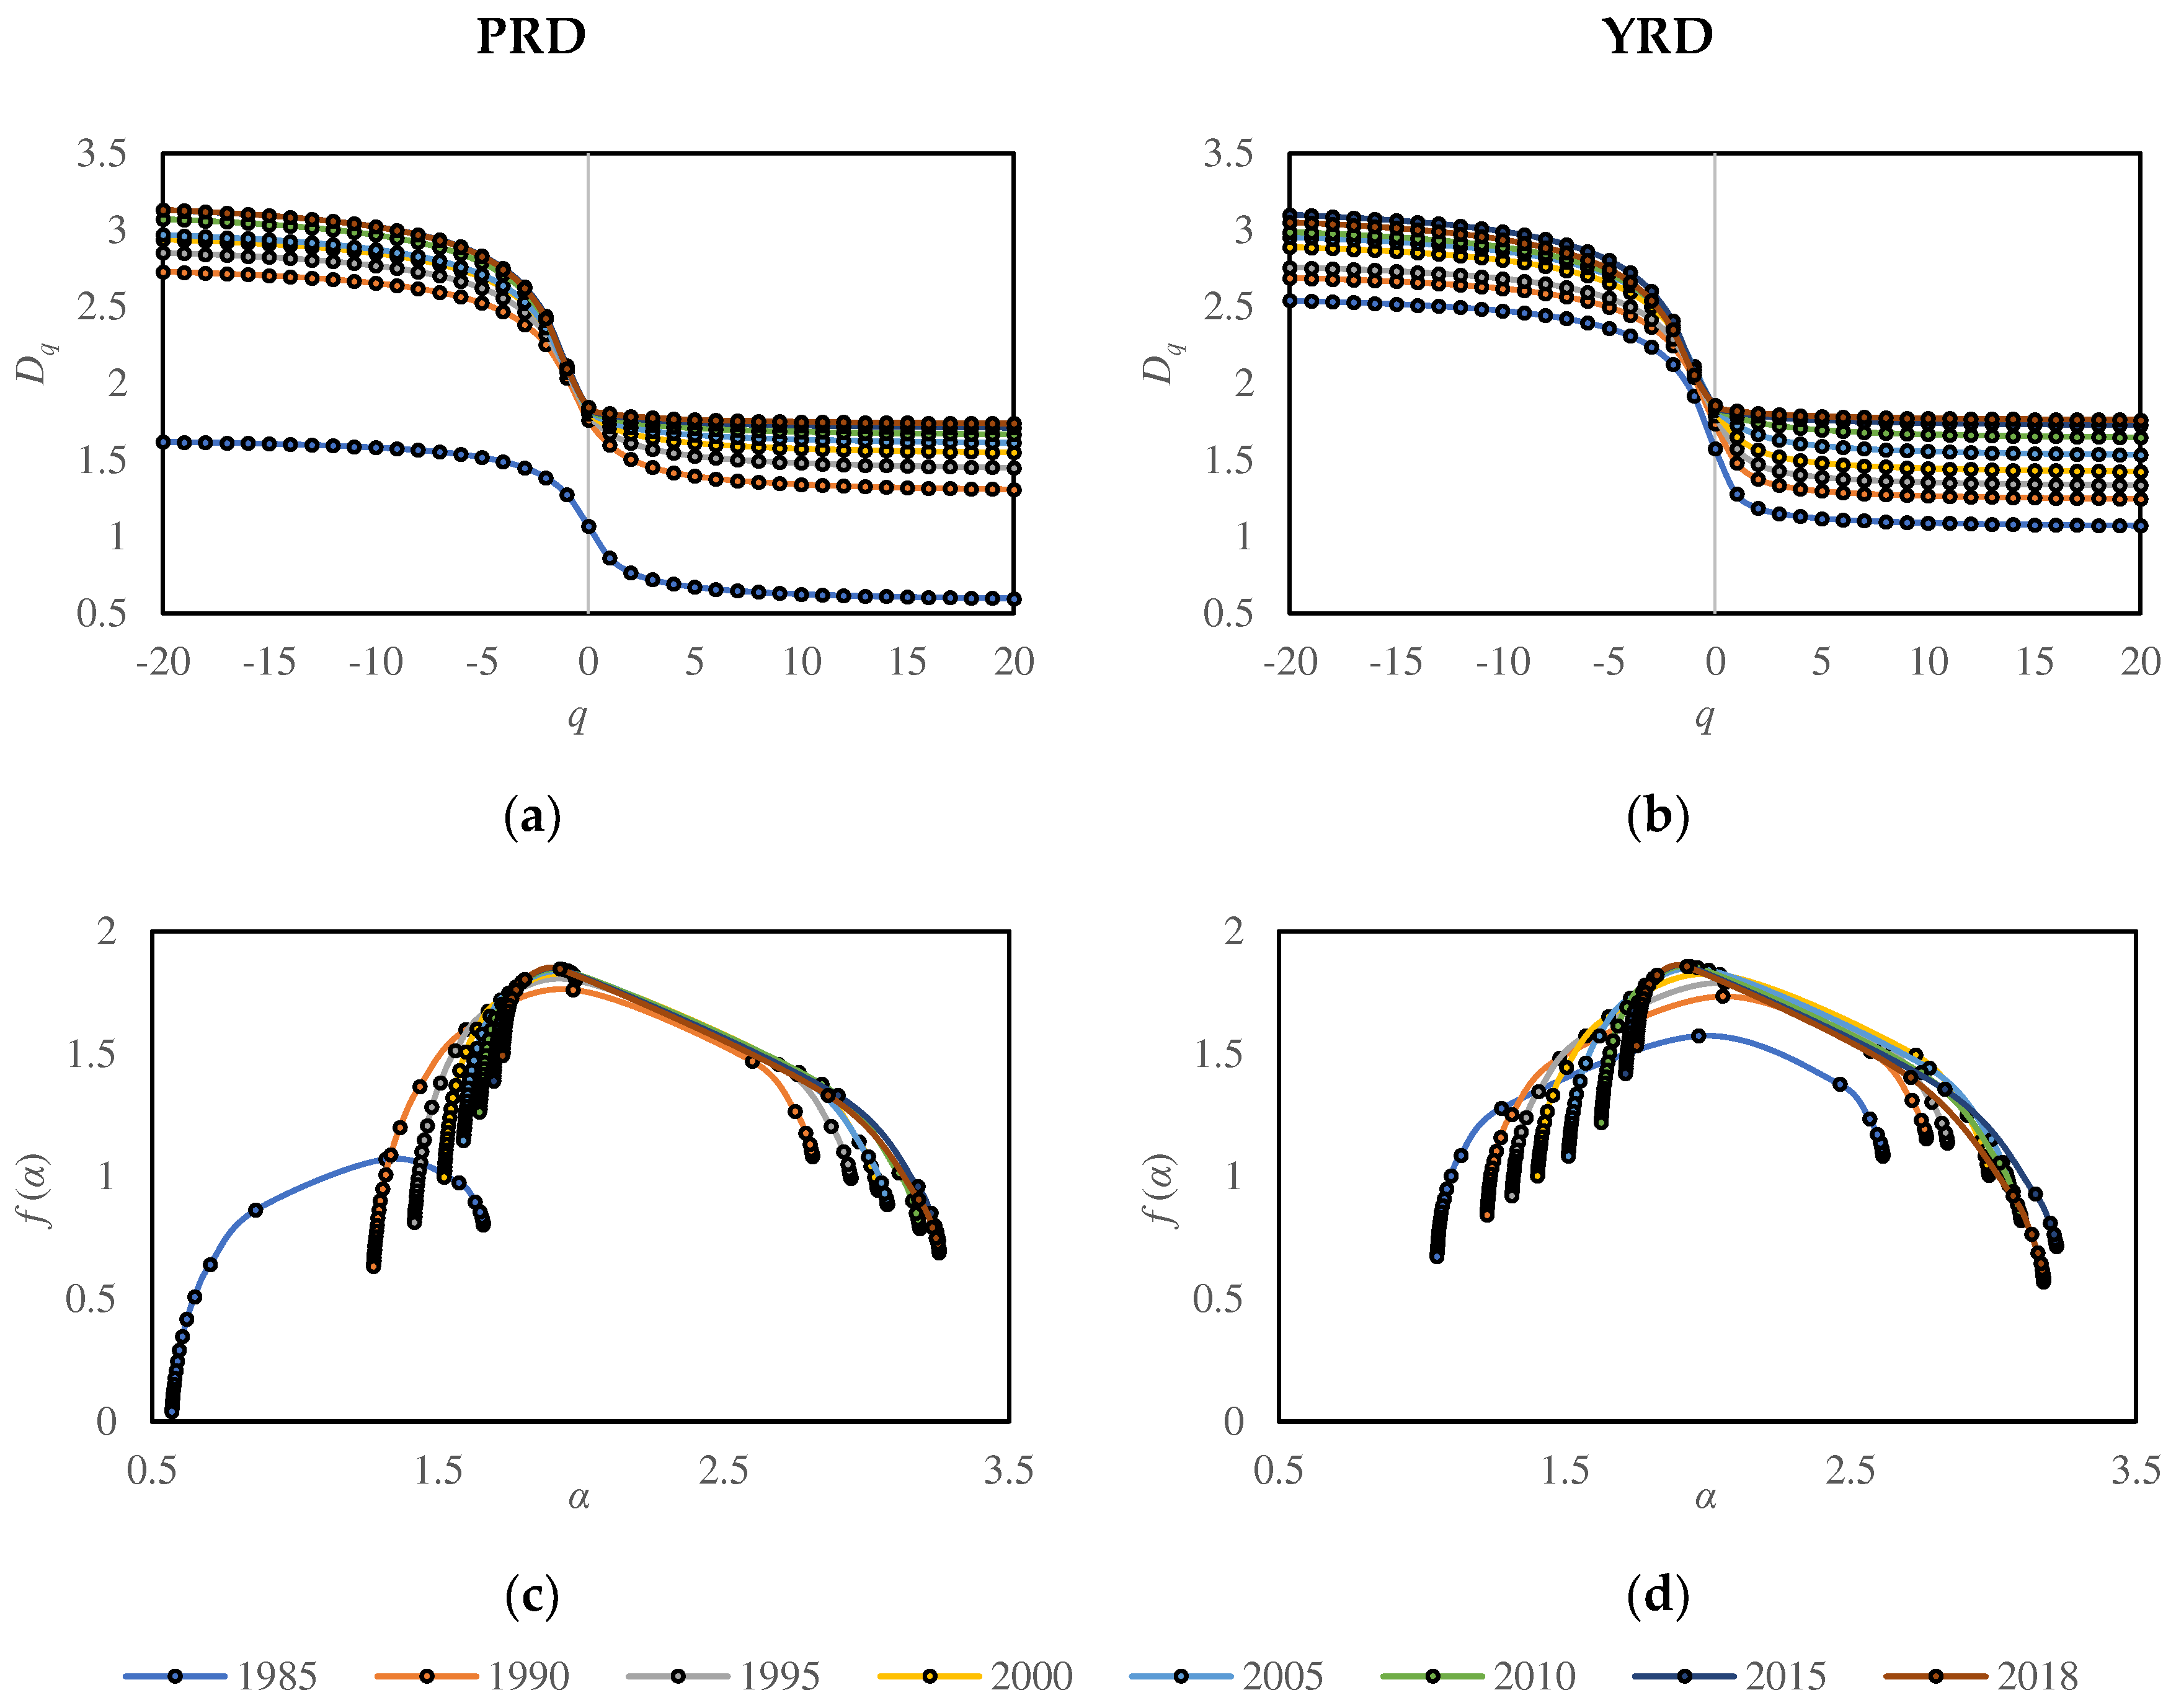
- Generalized correlation dimension Dq, as shown in Figure 2a,b:
- The spectrums continue to rise, indicating ongoing filling of PRD and YRD.
- The right side of the spectrum (q→+∞) converges rapidly, with an even faster convergence over time. While the left side of the spectrum (q→-∞) does not exhibit a clear convergence trend. This suggests that the central areas have reached a state of saturation in terms of development and filling, and there is still potential for expansion in marginal areas.
- 2.
- The maximum value, f(α0) = D0, keeps increasing, signifying an increasing degree of spatial filling.
- The left side of the spectrum (q→+∞) shows a rapid rise, while the right side (q→-∞) experiences a gradual decline. This implies that the central areas are rapidly being filled, the marginal areas are expanding and transforming into new sub-centers, resulting in a relatively reduced dimension.
- In the early stages of the study, the heights of the right side of the spectrums for PRD and YRD are similar, but the left side of YRD is higher. By the end of the research period, the heights of the left side of the spectrums for both regions become similar, but the right side of YRD is lower. This indicates that the central areas in YRD developed earlier compared to PRD, with a higher degree of spatial filling and more advanced development. Moreover, the expansion of marginal areas in YRD has been faster, leading to a lower dimension and more new sub-centers formed during the research period. Although the central areas in PRD started their development later, they progressed rapidly and approached the filling degree observed in YRD by the end of the research period.
- The height difference between the left and right side of the spectrum, Δf, changed from negative to positive in PRD and YRD in 2000 and 2001, respectively. This shift indicates that the fractal growth pattern of the study areas shifted from concentration to deconcentration during those corresponding years.
4. Discussion
5. Conclusions
Supplementary Materials
Funding
Data Availability Statement
Conflicts of Interest
References
- Mandelbrot, B.B. The fractal geometry of nature; WH freeman: New York, 1982. [Google Scholar]
- Batty, M.; Longley, P.A. Fractal cities: a geometry of form and function; Academic press: London, 1994. [Google Scholar]
- Batty, M. Cities and Complexity: Understanding Cities with Cellular Automata, Agent- Based Models, and Fractals; The MIT Press: London, 2005. [Google Scholar]
- Chen, Y. The solutions to the uncertainty problem of urban fractal dimension calculation. Entropy 2019, 21, 453. [Google Scholar] [CrossRef] [PubMed]
- Chen, Y.; Wang, J. Multifractal characterization of urban form and growth: the case of Beijing. Environment and Planning B: Planning and Design 2013, 40, 884–904. [Google Scholar] [CrossRef]
- Ariza-Villaverde, A.B.; Jiménez-Hornero, F.J.; de Ravé, E.G. Multifractal analysis of axial maps applied to the study of urban morphology. Computers, Environment and Urban Systems 2013, 38, 1–10. [Google Scholar] [CrossRef]
- Murcio, R.; Masucci, A.P.; Arcaute, E.; Batty, M. Multifractal to monofractal evolution of the London street network. Physical Review E 2015, 92, 62130. [Google Scholar] [CrossRef] [PubMed]
- Pavón-Domínguez, P.; Rincón-Casado, A.; Ruiz, P.; Camacho-Magriñán, P. Multifractal approach for comparing road transport network geometry: The case of Spain. Physica A: Statistical Mechanics and its Applications 2018, 510, 678–690. [Google Scholar] [CrossRef]
- Appleby, S. Multifractal characterization of the distribution pattern of the human population. Geographical Analysis 1996, 28, 147–160. [Google Scholar] [CrossRef]
- Cavailhès, J.; Frankhauser, P.; Peeters, D.; Thomas, I. Residential equilibrium in a multifractal metropolitan area. The Annals of regional science 2010, 45, 681–704. [Google Scholar] [CrossRef]
- Sémécurbe, F.; Tannier, C.; Roux, S.G. Spatial Distribution of Human Population in France: Exploring the Modifiable Areal Unit Problem Using Multifractal Analysis. Geographical Analysis 2016, 48, 292–313. [Google Scholar] [CrossRef]
- Ito, M.I.; Ohnishi, T. Evaluation of the Heterogeneous Spatial Distribution of Population and Stores/Facilities by Multifractal Analysis. Frontiers in Physics 2020, 8, 291. [Google Scholar] [CrossRef]
- Hu, S.; Cheng, Q.; Wang, L.; Xie, S. Multifractal characterization of urban residential land price in space and time. Applied Geography 2012, 34, 161–170. [Google Scholar] [CrossRef]
- Haag, G. The rank-size distribution of settlements as a dynamic multifractal phenomenon. Chaos, Solitons & Fractals 1994, 4, 519–534. [Google Scholar] [CrossRef]
- Chen, Y.; Zhou, Y. Multi-fractal measures of city-size distributions based on the three-parameter Zipf model. Chaos, Solitons & Fractals 2004, 22, 793–805. [Google Scholar] [CrossRef]
- Long, Y.; Chen, Y. Multifractal scaling analyses of urban street network structure: The cases of twelve megacities in China. PloS one 2021, 16, e0246925. [Google Scholar] [CrossRef] [PubMed]
- Sato, Y.; Munakata, F. Morphological characteristics of self-assembled aggregate textures using multifractal analysis: Interpretation of Multifractal τ (q) Using Simulations. Physica A: Statistical Mechanics and its Applications 2022, 603, 127771. [Google Scholar] [CrossRef]
- Man, W.; Nie, Q.; Li, Z.; Li, H.; Wu, X. Using fractals and multifractals to characterize the spatio-temporal pattern of impervious surfaces in a coastal city: Xiamen, China. Physica A: Statistical Mechanics and its Applications 2019, 520, 44–53. [Google Scholar] [CrossRef]
- Song, S.; Zeng, L.; Wang, Y.; Li, G.; Deng, X. The response of river network structure to urbanization: A multifractal perspective. Journal of cleaner production 2019, 221, 377–388. [Google Scholar] [CrossRef]
- Xiang, J.; Xu, Y.; Yuan, J.; Wang, Q.; Wang, J.; Deng, X. Multifractal Analysis of River Networks in an Urban Catchment on the Taihu Plain, China. Water 2019, 11, 2283. [Google Scholar] [CrossRef]
- Nie, Q.; Shi, K.; Gong, Y.; Ran, F.; Li, Z.; Chen, R.; Hua, L. Spatial–temporal variability of land surface temperature spatial pattern: Multifractal detrended fluctuation analysis. IEEE Journal of Selected Topics in Applied Earth Observations and Remote Sensing 2020, 13, 2010–2018. [Google Scholar] [CrossRef]
- Wang, J.; Qin, Z.; Shi, Y.; Yao, J. Multifractal Analysis of River Networks under the Background of Urbanization in the Yellow River Basin, China. Water 2021, 13, 2347. [Google Scholar] [CrossRef]
- Kimothi, S.; Thapliyal, A.; Gehlot, A.; Aledaily, A.N.; Bilandi, N.; Singh, R. .Akram, S.V. Spatio-temporal fluctuations analysis of land surface temperature (LST) using Remote Sensing data (LANDSAT TM5/8) and multifractal technique to characterize the urban heat Islands (UHIs). Sustainable Energy Technologies and Assessments 2023, 55, 102956. [Google Scholar] [CrossRef]
- Chen, Y.; Huang, L. Modeling growth curve of fractal dimension of urban form of Beijing. Physica A: Statistical Mechanics and its Applications 2019, 523, 1038–1056. [Google Scholar] [CrossRef]
- Grassberger, P. Generalized dimensions of strange attractors. Physics Letters A 1983, 97, 227–230. [Google Scholar] [CrossRef]
- Hentschel, H.G.E.; Procaccia, I. The infinite number of generalized dimensions of fractals and strange attractors. Physica D: Nonlinear Phenomena 1983, 8, 435–444. [Google Scholar] [CrossRef]
- Stošić, D.; Stošić, D.; Stošić, T.; Stanley, H.E. Multifractal properties of price change and volume change of stock market indices. Physica A: Statistical Mechanics and its Applications 2015, 428, 46–51. [Google Scholar] [CrossRef]
- Halsey, T.C.; Jensen, M.H.; Kadanoff, L.P.; Procaccia, I.; Shraiman, B.I. Fractal measures and their singularities: The characterization of strange sets. Physical review A 1986, 33, 1141–1151. [Google Scholar] [CrossRef] [PubMed]
- Chen, Y. Multifractals of central place systems: Models, dimension spectrums, and empirical analysis. Physica A: Statistical Mechanics and its Applications 2014, 402, 266–282. [Google Scholar] [CrossRef]
- Frisch, U.; Parisi, G. On the singularity structure of fully developed turbulence. In Turbulence and Predictability in Geophysical Fluid Dynamics and Climate Dynamics; Ghil, M., Benzi, R., Parisi, G., Eds.; North-Holland: New York, 1985; pp. 84–88. [Google Scholar]
- Chhabra, A.B.; Meneveau, C.; Jensen, R.V.; Sreenivasan, K.R. Direct determination of the f(α) singularity spectrum and its application to fully developed turbulence. Physical Review A 1989, 40, 5284. [Google Scholar] [CrossRef]
- Lovejoy, S.D.A.A.; Schertzer, D.; Tsonis, A.A. Functional box-counting and multiple elliptical dimensions in rain. Science 1987, 235, 1036–1038. [Google Scholar] [CrossRef]
- Chen, T. Studies on Fractal Systems of Cities and Towns in the Central Plains of China. Master Dissertation, Department of Geography, Northeast Normal University, Changchun, 1995. [In Chinese]. [Google Scholar]
- Huang, L.S.; Chen, Y.G. A comparison between two OLS-based approaches to estimating urban multifractal parameters. Fractals 2018, 26, 1850019. [Google Scholar] [CrossRef]
- Gong, P.; Li, X.; Wang, J.; Bai, Y.; Chen, B.; Hu, T. .Zhou, Y. Annual maps of global artificial impervious area (GAIA) between 1985 and 2018. Remote Sensing of Environment 2020, 236, 111510. [Google Scholar] [CrossRef]
- Li, X.; Gong, P.; Zhou, Y.; Wang, J.; Bai, Y.; Chen, B. .Zhu, Z. Mapping global urban boundaries from the global artificial impervious area (GAIA) data. Environmental Research Letters 2020, 15, 094044. [Google Scholar] [CrossRef]


| Change of Dq | Change of related measurements | Spatio-temporal information |
|---|---|---|
| ∆(D+∞)t > ∆(D-∞)t > 0 | ΔD decreases 0 < DGR < 1 |
Dominated by filling in central areas, spatial heterogeneity decreased: common direction of urban evolution. |
| ∆(D-∞)t > ∆(D+∞)t > 0 | ΔD rises DGR > 1 |
Dominated by filling in marginal areas, spatial heterogeneity increased: the beginning of expansion of marginal areas. |
| ∆(D+∞)t > 0 > ∆(D-∞)t | ΔD decreases DGR < 0 |
The original low-density areas filled rapidly, new low-density areas reduced and fractal dimension decreased, spatial heterogeneity decreased: the transformation of original marginal areas into new sub-central areas. |
| Measurement | Meaning in spectrum | Spatio-temporal information |
|---|---|---|
| ΔD = D-∞ –D +∞ Δα = α-∞ – α+∞ |
Height difference between the upper and lower Dq, α(q) spectrum. | Differences between high- and low-density areas: the higher, the stronger spatial heterogeneity. |
| F(α0) = D0 | Maximum value of f(α). | Degree of spatial filling: the larger, the higher level of spatial filling and the more complex spatial structure. |
| Δf = f(α+∞) – f(α-∞) | Height difference between left and right side of f(α): >0, higher on the left; <0, higher on the right. | Fractal growth pattern: >0, high-density areas dominate and fractal growth mainly extends outward; <0, low-density areas dominate and fractal growth is mainly centered. |
| DGR = ∆(D-∞)t / ∆(D+∞) | Ratio of growth rate of Dq at extreme positive and negative moment orders. | Variation details in the spatio-temporal evolution of urban morphology: if the curve exhibits steadiness over time, central areas grow steadily; if the curve exhibits abnormal fluctuations, marginal areas expand actively. |
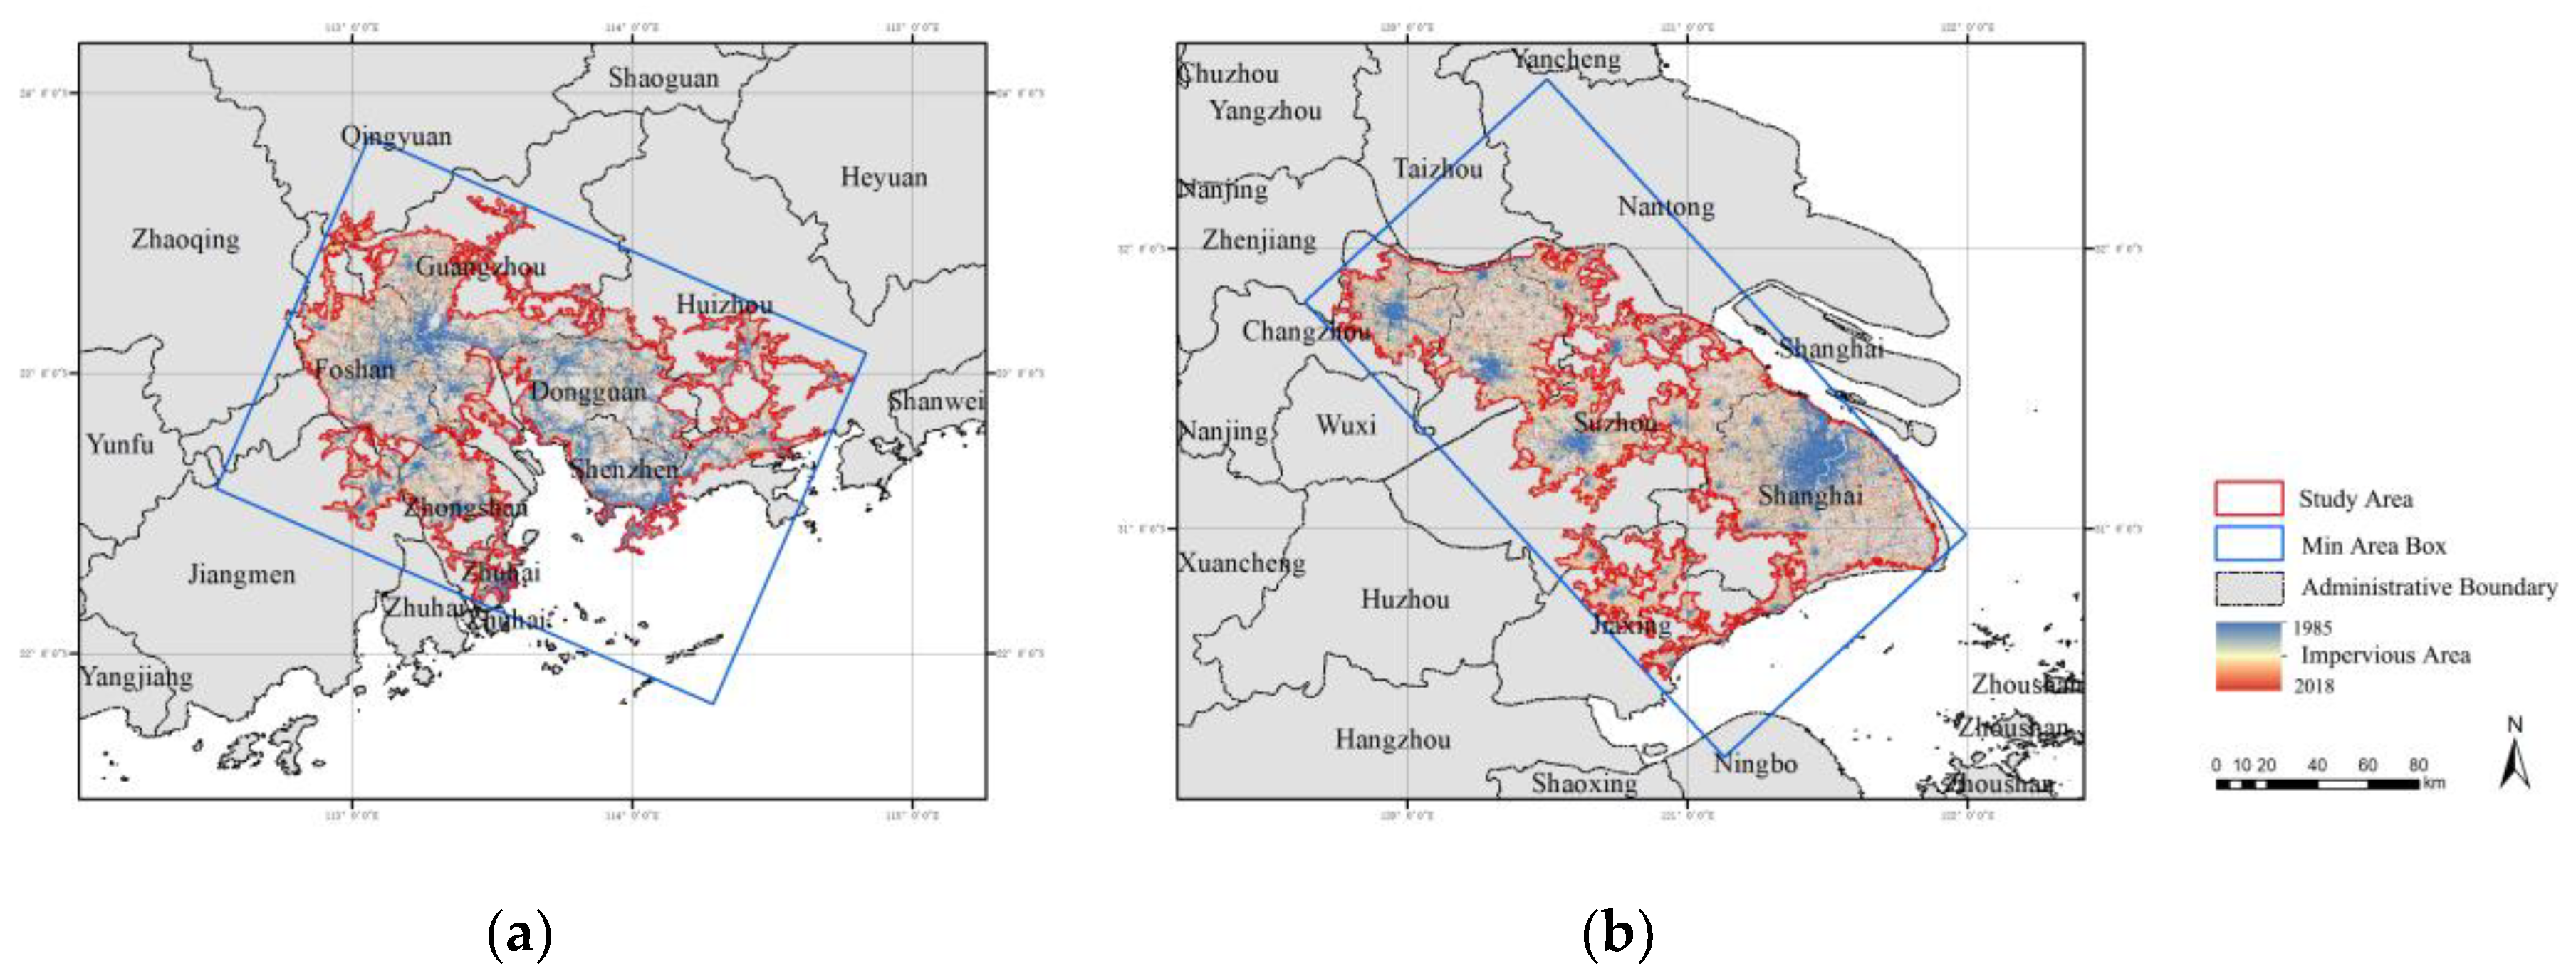
| Research objects | the Pearl River Delta (PRD) | the Yangtze River Delta (YRD) | |
|---|---|---|---|
| Cities included | 10 prefecture cities: Guangzhou, Shenzhen, Foshan, Dongguan, Zhongshan, Zhuhai, Huizhou, Qingyuan, Jiangmen, Zhaoqing. | 1 municipality: Shanghai; 6 prefecture cities: Suzhou, Wuxi, Jiaxing, Changzhou, Nantong, Zhenjiang. | |
| Area/ km2 | 10711.8 | 10480.2 | |
| Historical background and development characteristics | The central cities, Guangzhou in PRD and Shanghai in YRD, have long histories. But the entire region only started to develop rapidly since the reform and opening up. The period between 1985 to 2018 was notable for its significant and speedy progress. | ||
| Temporal evolution of multifractal spectrums and related measurements | Spatio-temporal information in the evolution of urban morphology | |
|---|---|---|
| Macroscopic laws | Dq rises, f(α0) = D0 increases. | Increasing degree of spatial filling. |
| When q→+∞, Dq converges rapidly, with an even faster convergence over time. While when q→-∞, Dq does not exhibit a clear convergence trend. | Central areas have reached saturation in terms of development and filling, and there is still potential for expansion in marginal areas. | |
| When q→+∞, f(α) shows a rapid rise, while when q→-∞, f(α) experiences a gradual decline. | Central areas were rapidly being filled, marginal areas were expanding and transforming into new sub-centers, resulting in a relatively reduced dimension. | |
| In the early stages of the study, f(α-∞) for PRD and YRD are similar, but f(α+∞) for YRD is larger. By the end of the research period, f(α+∞) for both regions become similar, but f(α-∞) for YRD is smaller. | The central areas in YRD developed earlier compared to PRD, with a higher degree of spatial filling and more advanced development. The expansion of marginal areas in YRD has been faster, leading to more new sub-centers formed during the research period. Although the central areas in PRD started their development later, they progressed rapidly and approached the filling degree observed in YRD by the end of the research period. | |
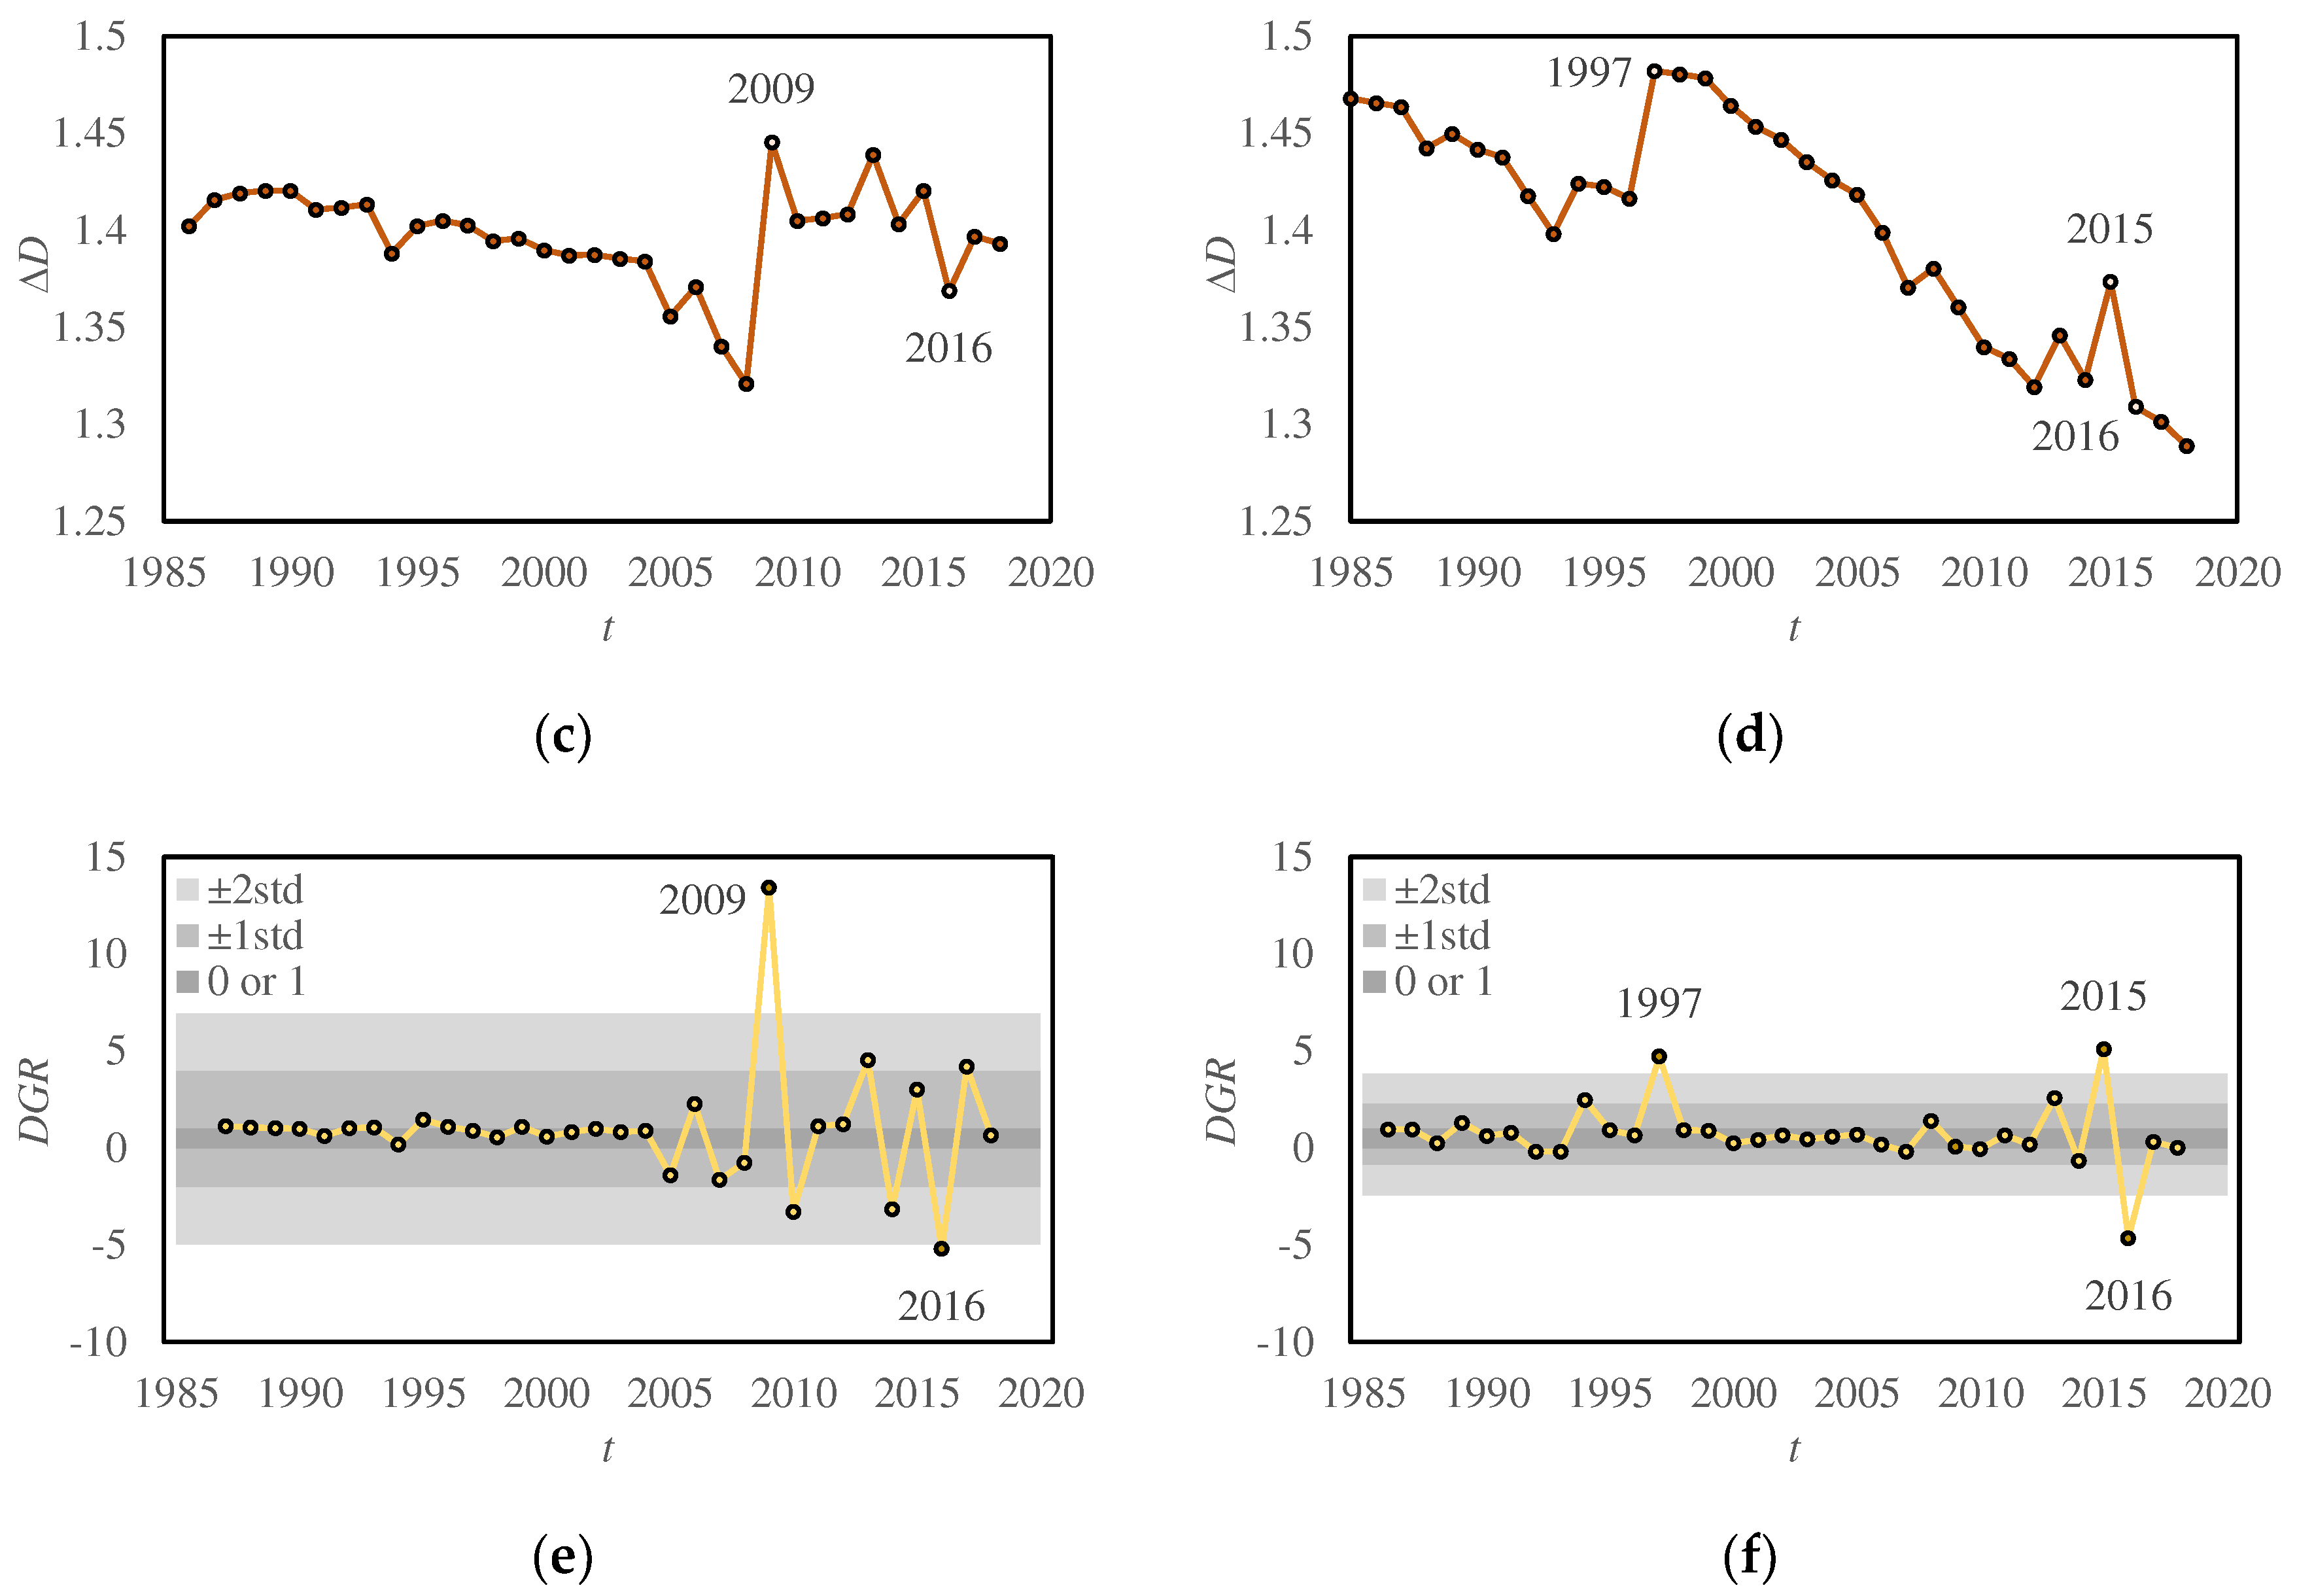
| ΔD and Δα decrease overall. | A decreasing trend in spatial heterogeneity. | |
| Δf changed from negative to positive in 2000 in PRD, and in 2001 in YRD. | Fractal growth pattern shifted from concentration to deconcentration in 2000 in PRD, and in 2001 in YRD. | |
| Microscopic variations | Dq>0 increase steadily over time, stabilize in the later stages, and exhibit similarities between PRD and YRD. Dq<0 generally increases, but fluctuates sometimes. | Central areas were steadily filled and tended to saturation, marginal areas expanded actively. |
| DGR surpassing 0 or 1: 2005-2010, 2013-2017 in PRD; 1994, 1997, 2013-2016 in YRD. | Marginal areas expanded actively in the corresponding years, leading to the interconnection of urban boundaries among multiple cities. | |
| DGR exceeds one-standard-deviation bands, the value is an outlier with a 68% confidence level: 2009, 2010, 2013, 2014, 2016, 2017 in PRD; 1994, 1997, 2013, 2015, 2016 in YRD. | The marginal areas witnessed substantial expansion during those specific years, which might be attributed to regional or national policies. YRD has started rapid growth in its marginal areas since 1994, whereas PRD encountered a similar situation only in 2009. The urban development in YRD generally preceded that of PRD. Despite PRD being known as a window for China's reform and opening up policies, YRD holds a longstanding position as an established economic region within China. | |
| DGR exceeds two-standard-deviation bands, the value is an outlier with a 95% confidence level: 2009 and 2016 in PRD; 1997, 2015, 2016 in YRD. |
Disclaimer/Publisher’s Note: The statements, opinions and data contained in all publications are solely those of the individual author(s) and contributor(s) and not of MDPI and/or the editor(s). MDPI and/or the editor(s) disclaim responsibility for any injury to people or property resulting from any ideas, methods, instructions or products referred to in the content. |
© 2023 by the authors. Licensee MDPI, Basel, Switzerland. This article is an open access article distributed under the terms and conditions of the Creative Commons Attribution (CC BY) license (http://creativecommons.org/licenses/by/4.0/).


