Submitted:
27 June 2023
Posted:
28 June 2023
You are already at the latest version
Abstract
Keywords:
1. Introduction
2. Methodology
2.1. Simulation of the benefits of grey and green facilities
2.2. Evaluation of the benefits of grey and green infrastructure
2.2.1. Runoff control benefits
2.2.2. Flood control benefits
2.2.3. Water quality benefits
2.2.4. Benefit of hydrological regulation and water quality
2.2.5. Resource utilization benefits
2.2.6. Energy saving benefits
2.2.7. Soil and water sequestration benefits
2.2.8. Carbon sequestration and oxygen release benefits
2.2.9. Biodiversity benefits
2.3. Accounting for the benefit–cost ratio of grey and green infrastructure
2.3.1. Benefit accounting in the life cycle
2.3.2. Cost accounting in the life cycle
2.3.3. Benefit–cost ratio accounting
3. Study Case
3.1. Overview of the study area
3.2. Rainfall data collection
3.2.1. Rainfall in Beijing
3.2.2. Rainfall monitoring in the field
3.3. Model construction
3.4. Cost-effectiveness evaluation
4. Results and Discussion
4.1. Quantitative analysis of the benefit indicators
4.2. Cost monetization analysis
4.3. Benefit monetization analysis
4.4. Cost-benefit ratio analysis
4.5. Uncertainty and applicability analysis
4.6. Risk analysis
5. Conclusion
Author Contributions
Funding
Declaration of Competing Interest
References
- Qi, B.; Xu, P.; Wu, C. Analysis of the Infiltration and Water Storage Performance of Recycled Brick Mix Aggregates in Sponge City Construction. Water 2023, 15, 363. [Google Scholar] [CrossRef]
- Lyu, H.-M.; Xu, Y.-S.; Cheng, W.-C.; Arulrajah, A. Flooding Hazards across Southern China and Prospective Sustainability Measures. Sustainability 2018, 10, 1682. [Google Scholar] [CrossRef]
- Fletcher, T.D.; Andrieu, H.; Hamel, P. Understanding, Management and Modelling of Urban Hydrology and Its Consequences for Receiving Waters: A State of the Art. Advances in Water Resources 2013, 51, 261–279. [Google Scholar] [CrossRef]
- Vinck, E.; De Bock, B.; Wambecq, T.; Liekens, E.; Delgado, R. A New Decision Support Tool for Evaluating the Impact of Stormwater Management Systems on Urban Runoff Pollution. Water 2023, 15, 931. [Google Scholar] [CrossRef]
- Godyń, I.; Bodziony, M.; Grela, A.; Muszyński, K.; Pamuła, J. Determination of Pollution and Environmental Risk Assessment of Stormwater and the Receiving River, Case Study of the Sudół River Catchment, Poland. International Journal of Environmental Research and Public Health 2023, 20, 504. [Google Scholar] [CrossRef]
- Kshirsagar, M.P.; Khare, K.C. Support Vector Regression Models of Stormwater Quality for a Mixed Urban Land Use. Hydrology 2023, 10, 66. [Google Scholar] [CrossRef]
- Qi, W.; Ma, C.; Xu, H.; Chen, Z.; Zhao, K.; Han, H. A Review on Applications of Urban Flood Models in Flood Mitigation Strategies. Nat Hazards 2021, 108, 31–62. [Google Scholar] [CrossRef]
- Hou, J.; Mao, H.; Li, J.; Sun, S. Spatial Simulation of the Ecological Processes of Stormwater for Sponge Cities. Journal of Environmental Management 2019, 232, 574–583. [Google Scholar] [CrossRef]
- Nguyen, T.T.; Ngo, H.H.; Guo, W.; Wang, X.C.; Ren, N.; Li, G.; Ding, J.; Liang, H. Implementation of a Specific Urban Water Management - Sponge City. Science of The Total Environment 2019, 652, 147–162. [Google Scholar] [CrossRef]
- Wang, Z.; Qi, F.; Liu, L.; Chen, M.; Sun, D.; Nan, J. How Do Urban Rainfall-Runoff Pollution Control Technologies Develop in China? A Systematic Review Based on Bibliometric Analysis and Literature Summary. Sci Total Environ 2021, 789, 148045. [Google Scholar] [CrossRef]
- Wang, K.; Zhang, L.; Zhang, L.; Cheng, S. Coupling Coordination Assessment on Sponge City Construction and Its Spatial Pattern in Henan Province, China. Water 2020, 12, 3482. [Google Scholar] [CrossRef]
- Qiao, X.-J.; Liao, K.-H.; Randrup, T.B. Sustainable Stormwater Management: A Qualitative Case Study of the Sponge Cities Initiative in China. Sustainable Cities and Society 2020, 53, 101963. [Google Scholar] [CrossRef]
- Zhang, J.; Han, Y.; Qiao, X.-J.; Randrup, T.B. Citizen Willingness to Pay for the Implementation of Urban Green Infrastructure in the Pilot Sponge Cities in China. Forests 2023, 14, 474. [Google Scholar] [CrossRef]
- Sample, D.J.; Heaney, J.P.; Wright, L.T.; Fan, C.-Y.; Lai, F.-H.; Field, R. Costs of Best Management Practices and Associated Land for Urban Stormwater Control. J. Water Resour. Plann. Manage. 2003, 129, 59–68. [Google Scholar] [CrossRef]
- Cheng, T.; Huang, B.; Yang, Z.; Qiu, J.; Zhao, B.; Xu, Z. On the Effects of Flood Reduction for Green and Grey Sponge City Measures and Their Synergistic Relationship—Case Study in Jinan Sponge City Pilot Area. Urban Climate 2022, 42, 101058. [Google Scholar] [CrossRef]
- Glick, R.; Jeong, J.; Srinivasan, R.; Arnold, J.G.; Her, Y. Adaptation of SWAT Watershed Model for Stormwater Management in Urban Catchments: Case Study in Austin, Texas. Water 2023, 15, 1770. [Google Scholar] [CrossRef]
- Abduljaleel, Y.; Demissie, Y. Identifying Cost-Effective Low-Impact Development (LID) under Climate Change: A Multi-Objective Optimization Approach. Water 2022, 14, 3017. [Google Scholar] [CrossRef]
- Quichimbo-Miguitama, F.; Matamoros, D.; Jiménez, L.; Quichimbo-Miguitama, P. Influence of Low-Impact Development in Flood Control: A Case Study of the Febres Cordero Stormwater System of Guayaquil (Ecuador). Sustainability 2022, 14, 7109. [Google Scholar] [CrossRef]
- Seo, M.; Jaber, F.; Srinivasan, R.; Jeong, J. Evaluating the Impact of Low Impact Development (LID) Practices on Water Quantity and Quality under Different Development Designs Using SWAT. Water 2017, 9, 193. [Google Scholar] [CrossRef]
- Deng, Y.; Deng, J.; Zhang, C. Sponge City and Water Environment Planning and Construction in Jibu District in Changde City. Sustainability 2022, 15, 444. [Google Scholar] [CrossRef]
- LeBleu, C.; Dougherty, M.; Rahn, K.; Wright, A.; Bowen, R.; Wang, R.; Orjuela, J.A.; Britton, K. Quantifying Thermal Characteristics of Stormwater through Low Impact Development Systems. Hydrology 2019, 6, 16. [Google Scholar] [CrossRef]
- Shen, Z. Green Roof Design of Residential Area Based on Sponge City Theory. Wireless Communications and Mobile Computing 2022, 2022, 1–8. [Google Scholar] [CrossRef]
- Lin, X.; Ren, J.; Xu, J.; Zheng, T.; Cheng, W.; Qiao, J.; Huang, J.; Li, G. Prediction of Life Cycle Carbon Emissions of Sponge City Projects: A Case Study in Shanghai, China. Sustainability 2018, 10, 3978. [Google Scholar] [CrossRef]
- Wilbers, G.-J.; de Bruin, K.; Seifert-Dähnn, I.; Lekkerkerk, W.; Li, H.; Budding-Polo Ballinas, M. Investing in Urban Blue–Green Infrastructure—Assessing the Costs and Benefits of Stormwater Management in a Peri-Urban Catchment in Oslo, Norway. Sustainability 2022, 14, 1934. [Google Scholar] [CrossRef]
- Wei, Z.; Yumiao, L.; Chengdan, W. A Discussion on the Construction Ideas of Sponge City in A Green Eco-District. IOP Conf. Ser.: Earth Environ. Sci. 2021, 657, 012058. [Google Scholar] [CrossRef]
- Li, X.-J.; Deng, J.-X.; Xie, W.-J.; Jim, C.-Y.; Wei, T.-B.; Lai, J.-Y.; Liu, C.-C. Comprehensive Benefit Evaluation of Pervious Pavement Based on China’s Sponge City Concept. Water 2022, 14, 1500. [Google Scholar] [CrossRef]
- Raei, E.; Reza Alizadeh, M.; Reza Nikoo, M.; Adamowski, J. Multi-Objective Decision-Making for Green Infrastructure Planning (LID-BMPs) in Urban Storm Water Management under Uncertainty. Journal of Hydrology 2019, 579, 124091. [Google Scholar] [CrossRef]
- Saadatpour, M.; Delkhosh, F.; Afshar, A.; Solis, S.S. Developing a Simulation-Optimization Approach to Allocate Low Impact Development Practices for Managing Hydrological Alterations in Urban Watershed. Sustainable Cities and Society 2020, 61, 102334. [Google Scholar] [CrossRef]
- Song, J.; Wang, J.; Xi, G.; Lin, H. Evaluation of Stormwater Runoff Quantity Integral Management via Sponge City Construction: A Pilot Case Study of Jinan. Urban Water Journal 2021, 18, 151–162. [Google Scholar] [CrossRef]
- Grimaldi, S.; Serinaldi, F. Asymmetric Copula in Multivariate Flood Frequency Analysis. Advances in Water Resources 2006, 29, 1155–1167. [Google Scholar] [CrossRef]
- Dong, X.; Guo, H.; Zeng, S. Enhancing Future Resilience in Urban Drainage System: Green versus Grey Infrastructure. Water Research 2017, 124, 280–289. [Google Scholar] [CrossRef] [PubMed]
- Su, J.; Li, J.; Gao, X.; Yao, Y.; Jiang, C. Comprehensive Analysis of Waterlogging Control and Carbon Emission Reduction for Optimal LID Layout: A Case Study in Campus. Environ Sci Pollut Res 2022, 29, 87802–87816. [Google Scholar] [CrossRef]
- Zhang, Z.; Gu, J.; Zhang, G.; Ma, W.; Zhao, L.; Ning, P.; Shen, J. Design of Urban Runoff Pollution Control Based on the Sponge City Concept in a Large-Scale High-Plateau Mountainous Watershed: A Case Study in Yunnan, China. Journal of Water and Climate Change 2021, 12, 201–222. [Google Scholar] [CrossRef]
- Tang, S.; Jiang, J.; Zheng, Y.; Hong, Y.; Chung, E.-S.; Shamseldin, A.Y.; Wei, Y.; Wang, X. Robustness Analysis of Storm Water Quality Modelling with LID Infrastructures from Natural Event-Based Field Monitoring. Science of The Total Environment 2021, 753, 142007. [Google Scholar] [CrossRef] [PubMed]
- Han, Y.H.; Lau, S.L.; Kayhanian, M.; Stenstrom, M.K. Correlation Analysis among Highway Stormwater Pollutants and Characteristics. Water Sci Technol 2006, 53, 235–243. [Google Scholar] [CrossRef] [PubMed]
- Xie, Z.; Xie, L.; Li, J. Direct Subsidies or Tax Credits The Effects of Different R&D Policy Tools. IJTM 2021, 86, 25. [Google Scholar] [CrossRef]
- Xu, Y.-S.; Shen, S.-L.; Lai, Y.; Zhou, A.-N. Design of Sponge City: Lessons Learnt from an Ancient Drainage System in Ganzhou, China. Journal of Hydrology 2018, 563, 900–908. [Google Scholar] [CrossRef]
- Ma, J.; Liu, D.; Wang, Z. Sponge City Construction and Urban Economic Sustainable Development: An Ecological Philosophical Perspective. IJERPH 2023, 20, 1694. [Google Scholar] [CrossRef]
- Zhao, J.; Fonseca, C.; Zeerak, R. Stormwater Utility Fees and Credits: A Funding Strategy for Sustainability. Sustainability 2019, 11, 1913. [Google Scholar] [CrossRef]
- Zhu, Y.; Xu, C.; Yin, D.; Xu, J.; Wu, Y.; Jia, H. Environmental and Economic Cost-Benefit Comparison of Sponge City Construction in Different Urban Functional Regions. Journal of Environmental Management 2022, 304, 114230. [Google Scholar] [CrossRef]
- Hotchkiss, J.L.; Rupasingha, A. Individual Social Capital and Migration. Growth and Change 2021, 52, 808–837. [Google Scholar] [CrossRef]
- Gao, Z.; Zhang, Q.H.; Xie, Y.D.; Wang, Q.; Dzakpasu, M.; Xiong, J.Q.; Wang, X.C. A Novel Multi-Objective Optimization Framework for Urban Green-Gray Infrastructure Implementation under Impacts of Climate Change. Science of The Total Environment 2022, 825, 153954. [Google Scholar] [CrossRef] [PubMed]
- Zhu, Y.; Xu, C.; Liu, Z.; Yin, D.; Jia, H.; Guan, Y. Spatial Layout Optimization of Green Infrastructure Based on Life-Cycle Multi-Objective Optimization Algorithm and SWMM Model. Resources, Conservation and Recycling 2023, 191, 106906. [Google Scholar] [CrossRef]
- Souza, C.R.B.; Souza, S.N.M. de; Secco, D.; Lenz, A.M.; Cruz Siqueira, J.A. <b>Green Roofs and Their Contribution for the Reduction of Room Temperature in Buildings in Cascavel-State Paraná/Green Roofs and Energy Efficiency. Acta Sci. Technol. 2018, 40, 35267. [Google Scholar] [CrossRef]
- Cascone, S.; Leuzzo, A. Thermal Comfort in the Built Environment: A Digital Workflow for the Comparison of Different Green Infrastructure Strategies. Atmosphere 2023, 14, 685. [Google Scholar] [CrossRef]
- Ouyang, Z.; Zhu, C.; Yang, G. Xu, W.; Zheng, H.; Zhang, Y.; Xiao, Y. Accounting for Gross Ecosystem Product: Concepts, Accounting Methods and Case Studies. Journal of Ecology 2013, 33, 6747–6761. (in Chinese). [Google Scholar]
- Ouyang, Z.; Zheng, H.; Xiao, Y.; Polasky, S.; Liu, J.; Xu, W.; Wang, Q.; Zhang, L.; Xiao, Y.; Rao, E.; et al. Improvements in Ecosystem Services from Investments in Natural Capital. Science 2016, 352, 1455–1459. [Google Scholar] [CrossRef]
- Toledo-Gallegos, V.M.; My, N.H.D.; Tuan, T.H.; Börger, T. Valuing Ecosystem Services and Disservices of Blue/Green Infrastructure. Evidence from a Choice Experiment in Vietnam. Economic Analysis and Policy 2022, 75, 114–128. [Google Scholar] [CrossRef]
- Xie, G.; Zhang, C.; Zhang L; Chen, W. ; Li, S. Gross ecosystem product: Concept, accounting framework and case study. Journal of Natural Resources 2015, 30, 1243–1254. (in Chinese). [Google Scholar]
- Wang, M.; Zhang, D.; Adhityan, A.; Ng, W.J.; Dong, J.; Tan, S.K. Assessing Cost-Effectiveness of Bioretention on Stormwater in Response to Climate Change and Urbanization for Future Scenarios. Journal of Hydrology 2016, 543, 423–432. [Google Scholar] [CrossRef]
- Xie, J.; Chen, H.; Liao, Z.; Gu, X.; Zhu, D.; Zhang, J. An Integrated Assessment of Urban Flooding Mitigation Strategies for Robust Decision Making. Environmental Modelling & Software 2017, 95, 143–155. [Google Scholar] [CrossRef]
- Jiayu, H.; Jiewei, X.; Qiaohui, T.; Yang, S. Application of the Technology in Sponge Campus in China. International Journal of Architecture, Arts and Applications 2019, 5, 105. [Google Scholar] [CrossRef]
- Hung, F.; Harman, C.J.; Hobbs, B.F.; Sivapalan, M. Assessment of Climate, Sizing, and Location Controls on Green Infrastructure Efficacy: A Timescale Framework. Water Resour. Res. 2020, 56. [Google Scholar] [CrossRef]
- Cao, Q.; Cao, J.; Xu, R. Optimizing Low Impact Development for Stormwater Runoff Treatment: A Case Study in Yixing, China. Water 2023, 15, 989. [Google Scholar] [CrossRef]
- Sidek, L.M.; Chua, L.H.C.; Azizi, A.S.M.; Basri, H.; Jaafar, A.S.; Moon, W.C. Application of PCSWMM for the 1-D and 1-D–2-D Modeling of Urban Flooding in Damansara Catchment, Malaysia. Applied Sciences 2021, 11, 9300. [Google Scholar] [CrossRef]
- Li, W.; Wang, H.; Zhou, J.; Yan, L.; Liu, Z.; Pang, Y.; Zhang, H.; Huang, T. Simulation and Evaluation of Rainwater Runoff Control, Collection, and Utilization for Sponge City Reconstruction in an Urban Residential Community. Sustainability 2022, 14, 12372. [Google Scholar] [CrossRef]
- Munir, B.A.; Ahmad, S.R.; Hafeez, S. Integrated Hazard Modeling for Simulating Torrential Stream Response to Flash Flood Events. ISPRS International Journal of Geo-Information 2020, 9, 1. [Google Scholar] [CrossRef]
- Krebs, G.; Kokkonen, T.; Valtanen, M.; Setälä, H.; Koivusalo, H. Spatial Resolution Considerations for Urban Hydrological Modelling. Journal of Hydrology 2014, 512, 482–497. [Google Scholar] [CrossRef]
- Zhang, D.; Mei, C.; Ding, X.; Liu, J.; Fu, X.; Wang, J.; Wang, D. Impacts of Rainstorm Characteristics on Runoff Quantity and Quality Control Performance Considering Integrated Green Infrastructures. Sustainability 2022, 14, 11284. [Google Scholar] [CrossRef]
- Yang, Y.; Zhang, W.; Liu, Z.; Liu, D.; Huang, Q.; Xia, J. Coupling a Distributed Time Variant Gain Model into a Storm Water Management Model to Simulate Runoffs in a Sponge City. Sustainability 2023, 15, 3804. [Google Scholar] [CrossRef]
- Guo, X.; Guo, Q.; Zhou, Z.; Du, P.; Zhao, D. Degrees of Hydrologic Restoration by Low Impact Development Practices under Different Runoff Volume Capture Goals. Journal of Hydrology 2019, 578, 124069. [Google Scholar] [CrossRef]
- Cheng, T.; Xu, Z.; Hong, S.; Song, S. Flood Risk Zoning by Using 2D Hydrodynamic Modeling: A Case Study in Jinan City. Mathematical Problems in Engineering 2017, 2017, 1–8. [Google Scholar] [CrossRef]
- Wilkerson, B.; Romanenko, E.; Barton, D.N. Modeling Reverse Auction-Based Subsidies and Stormwater Fee Policies for Low Impact Development (LID) Adoption: A System Dynamics Analysis. Sustainable Cities and Society 2022, 79, 103602. [Google Scholar] [CrossRef]
- Yoo, J.; Park, K. Stormwater Utility Fee Estimation Method for Individual Land Use Areas. Sustainability 2022, 14, 10211. [Google Scholar] [CrossRef]
- Godyń, I. Economic Incentives in Stormwater Management: A Study of Practice Gaps in Poland. Water 2022, 14, 3817. [Google Scholar] [CrossRef]
- Qiu, D.; Deng, X. Does RMB purchasing power parity hold? --A multi-country cointegration analysis based on the RMB-EUR. Financial Theory and Practice 2020, 41–51. (in Chinese).
- Li, H.; Zhao, W.; Gu, R.; Li, Y.; Chen, Z.; Zhang, X. Effects of three different green-lands in plantation structure on the O2-emitting,CO2-fixing,heat-absorbing and temperature-decreasing in residential quarters. Environmental Science 1999, 41–44. (in Chinese). [Google Scholar] [CrossRef]
- Li, H.; Wang, J.; Ge, C. A cost-benefit analysis of the pollution reduction during the eleventh five-year period in China. Journal of Environmental Science 2013, 33, 2270–2276. (in Chinese). [Google Scholar] [CrossRef]
- She, J. Cost analysis of grooving construction of reinforced concrete drainage pipeline in loess area. Construction Economy 2019, 40, 70–72. (in Chinese). [Google Scholar] [CrossRef]
- Li, J.; Jiang, Y.; Zhai, M.; Gao, J.; Yao, Y.; Li, Y. Construction and Application of Sponge City Resilience Evaluation System: A Case Study in Xi’an, China. Environ Sci Pollut Res 2023, 30, 62051–62066. [Google Scholar] [CrossRef]
- She, L.; Wei, M.; You, X. Multi-Objective Layout Optimization for Sponge City by Annealing Algorithm and Its Environmental Benefits Analysis. Sustainable Cities and Society 2021, 66, 102706. [Google Scholar] [CrossRef]
- Guan, Y.; Shan, Y.; Huang, Q.; Chen, H.; Wang, D.; Hubacek, K. Assessment to China’s Recent Emission Pattern Shifts. Earth’s Future 2021, 9. [Google Scholar] [CrossRef]
- Escobedo, F.; Varela, S.; Zhao, M.; Wagner, J.E.; Zipperer, W. Analyzing the Efficacy of Subtropical Urban Forests in Offsetting Carbon Emissions from Cities. Environmental Science & Policy 2010, 13, 362–372. [Google Scholar] [CrossRef]
- Casal-Campos, A.; Sadr, S.M.K.; Fu, G.; Butler, D. Reliable, Resilient and Sustainable Urban Drainage Systems: An Analysis of Robustness under Deep Uncertainty. Environ. Sci. Technol. 2018, 52, 9008–9021. [Google Scholar] [CrossRef]
- Wang, Y.; Zhang, Z.; Zhao, Z.; Sagris, T.; Wang, Y. Prediction of Future Urban Rainfall and Waterlogging Scenarios Based on CMIP6: A Case Study of Beijing Urban Area. Water 2023, 15, 2045. [Google Scholar] [CrossRef]
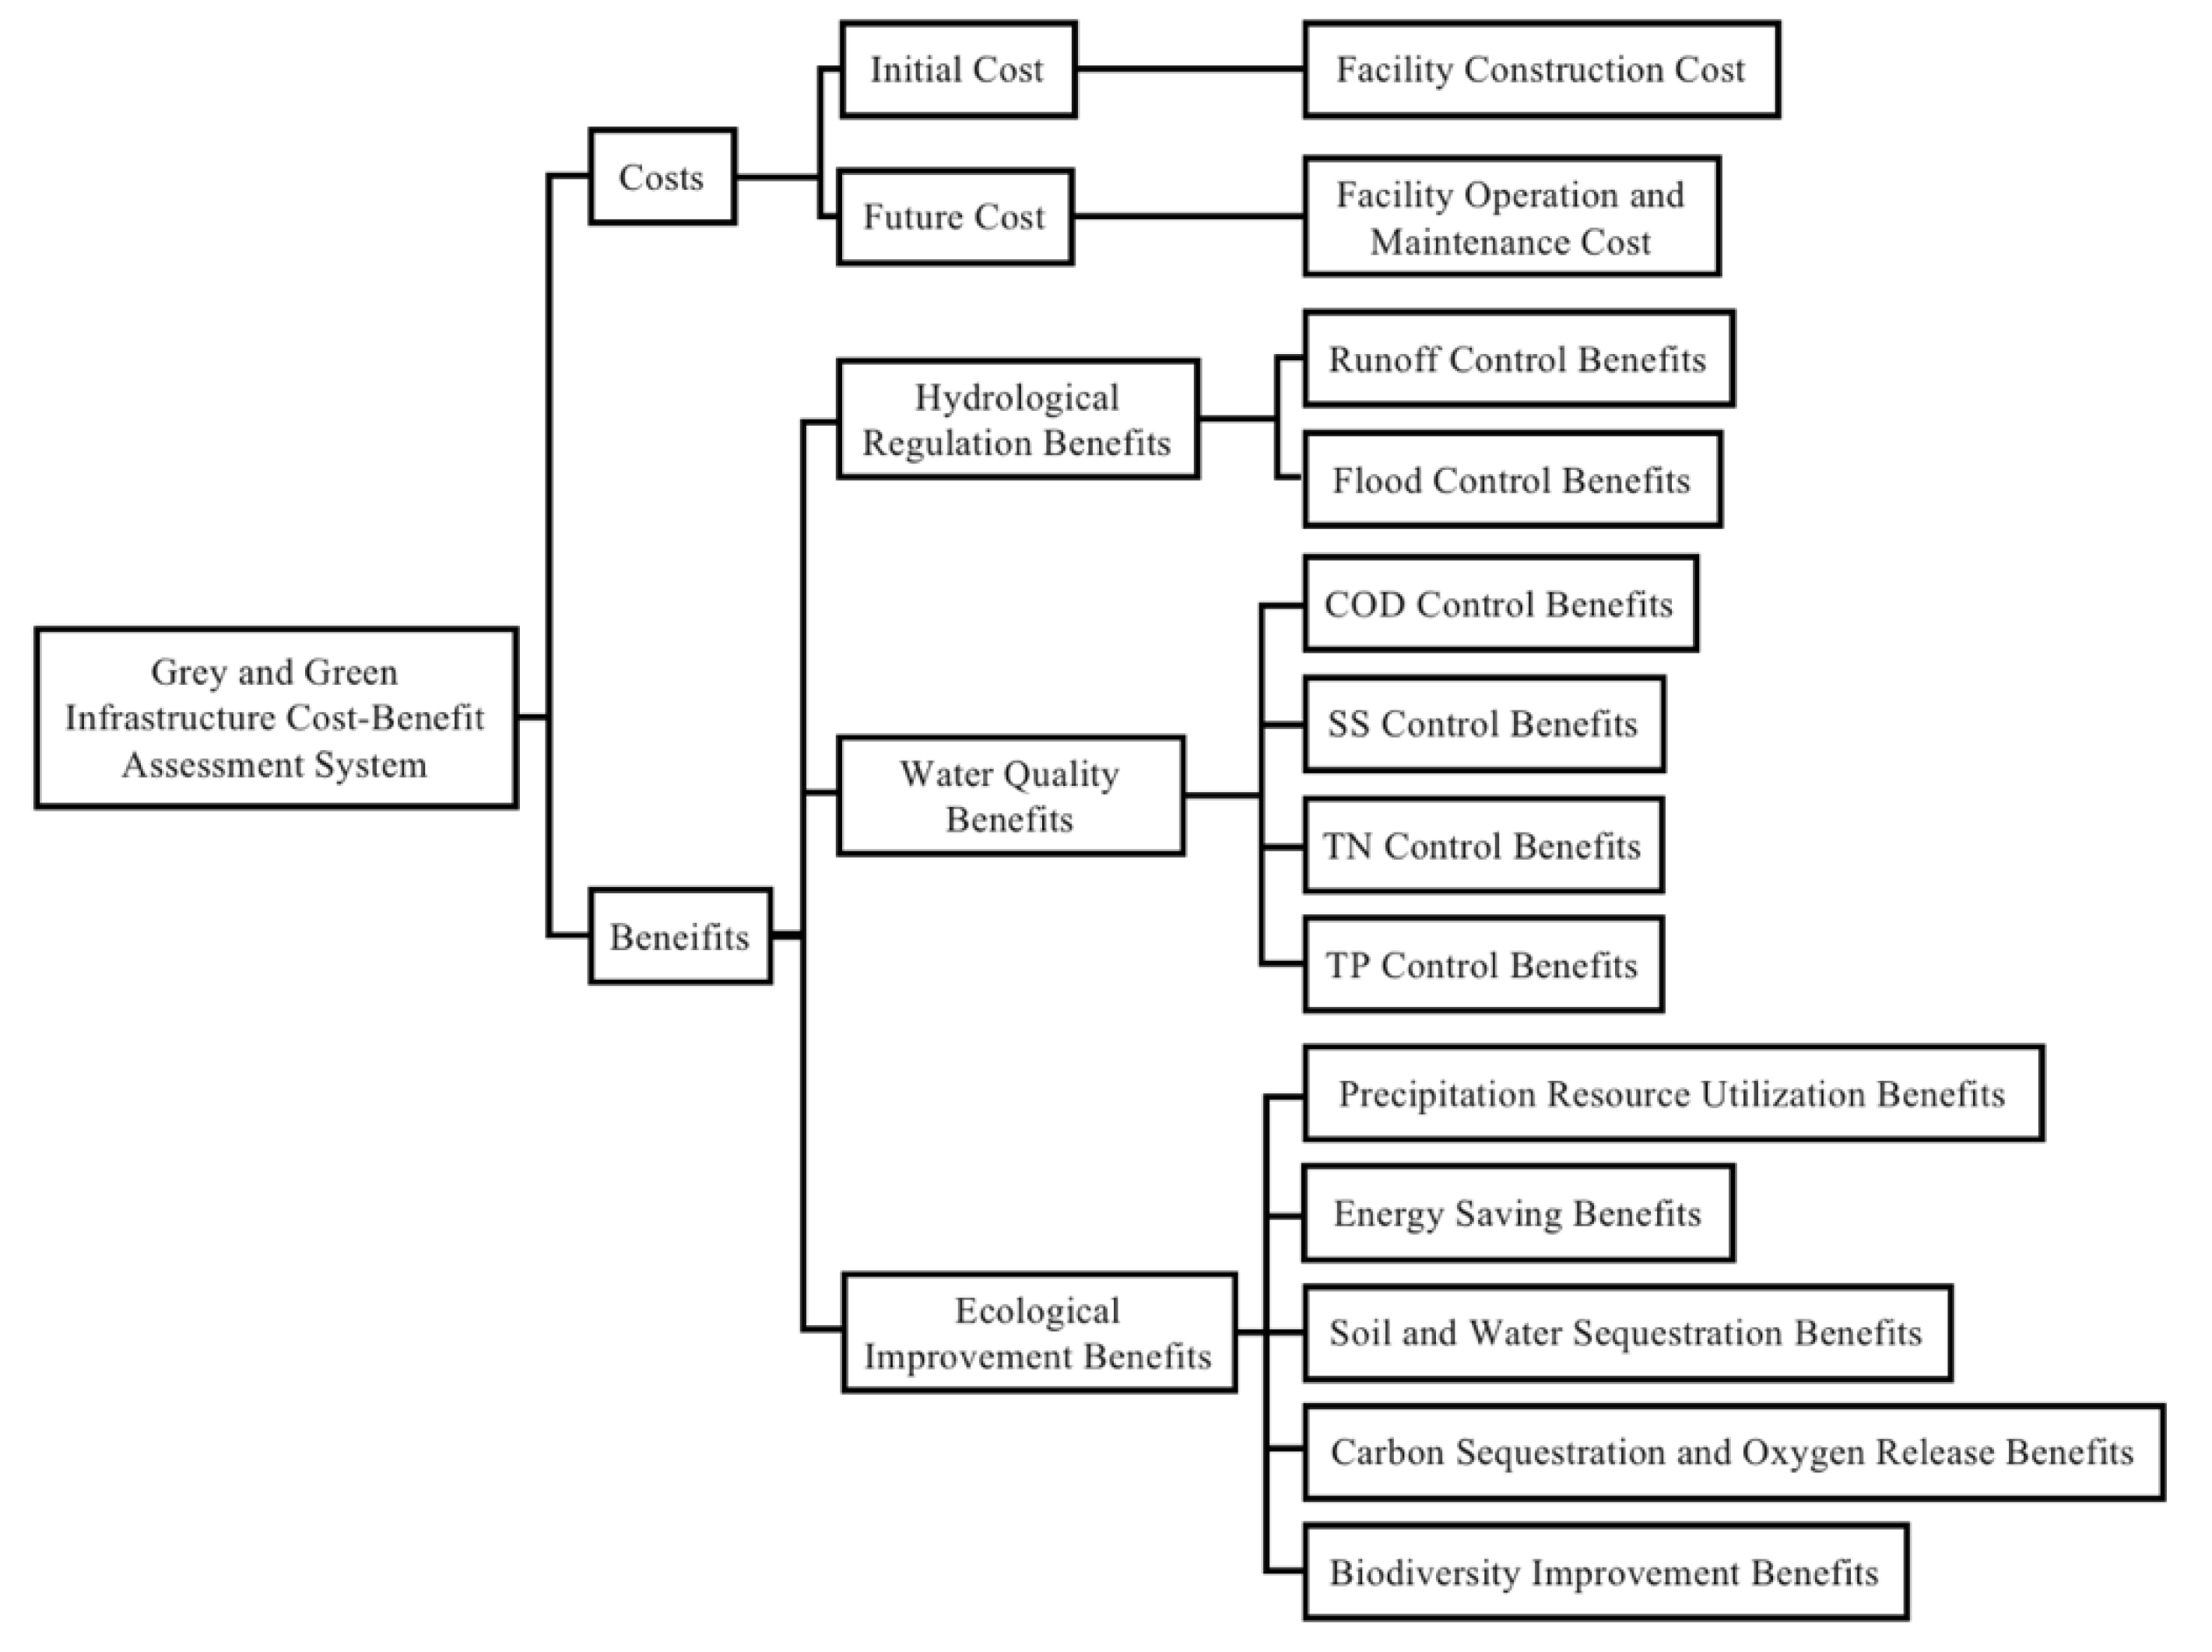
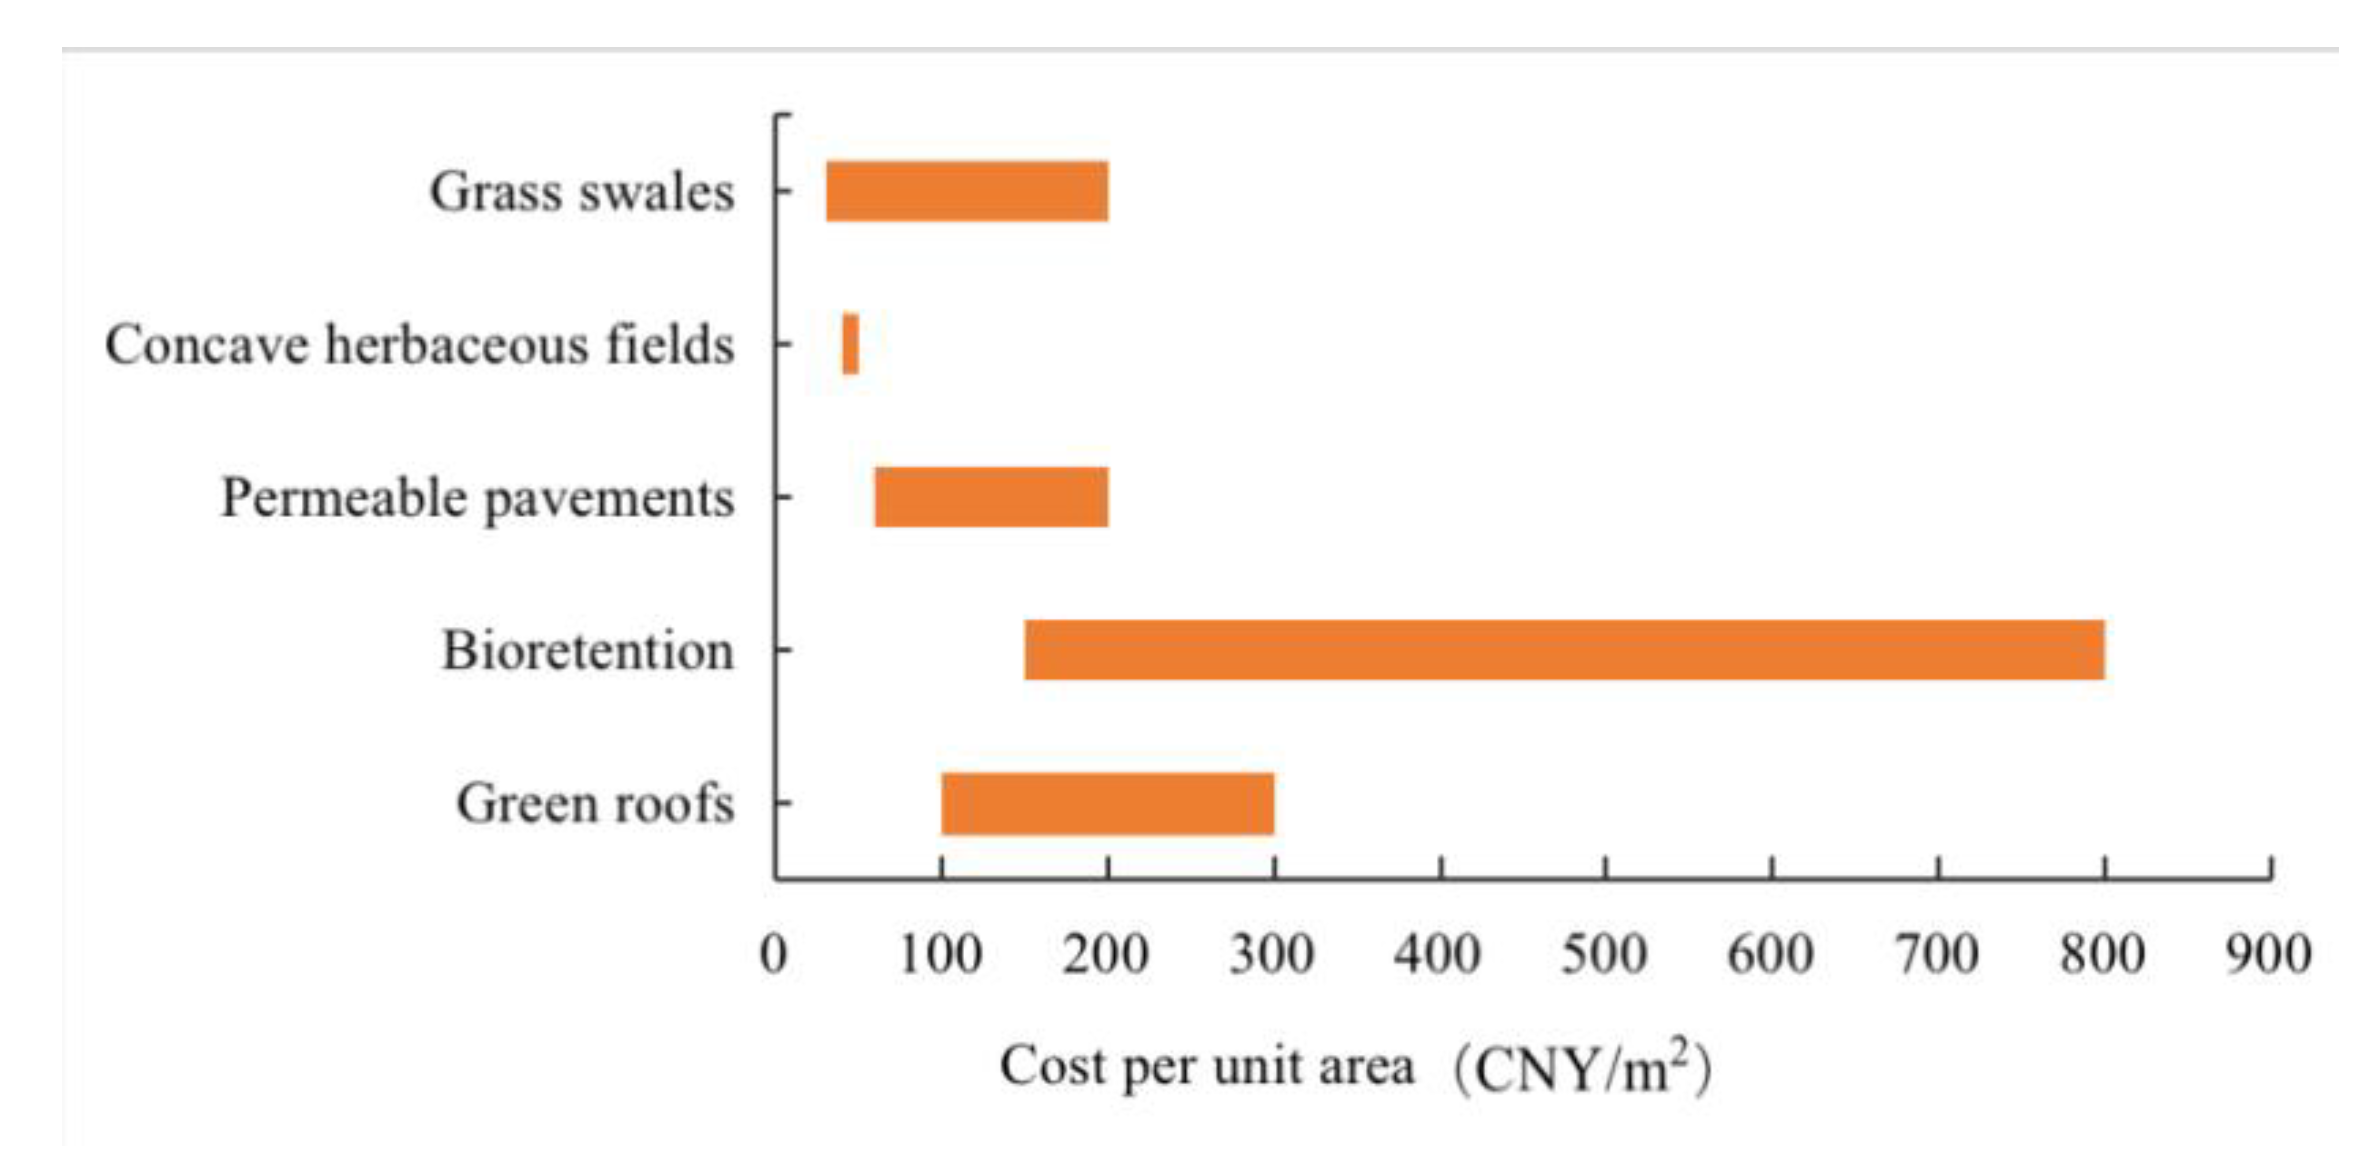
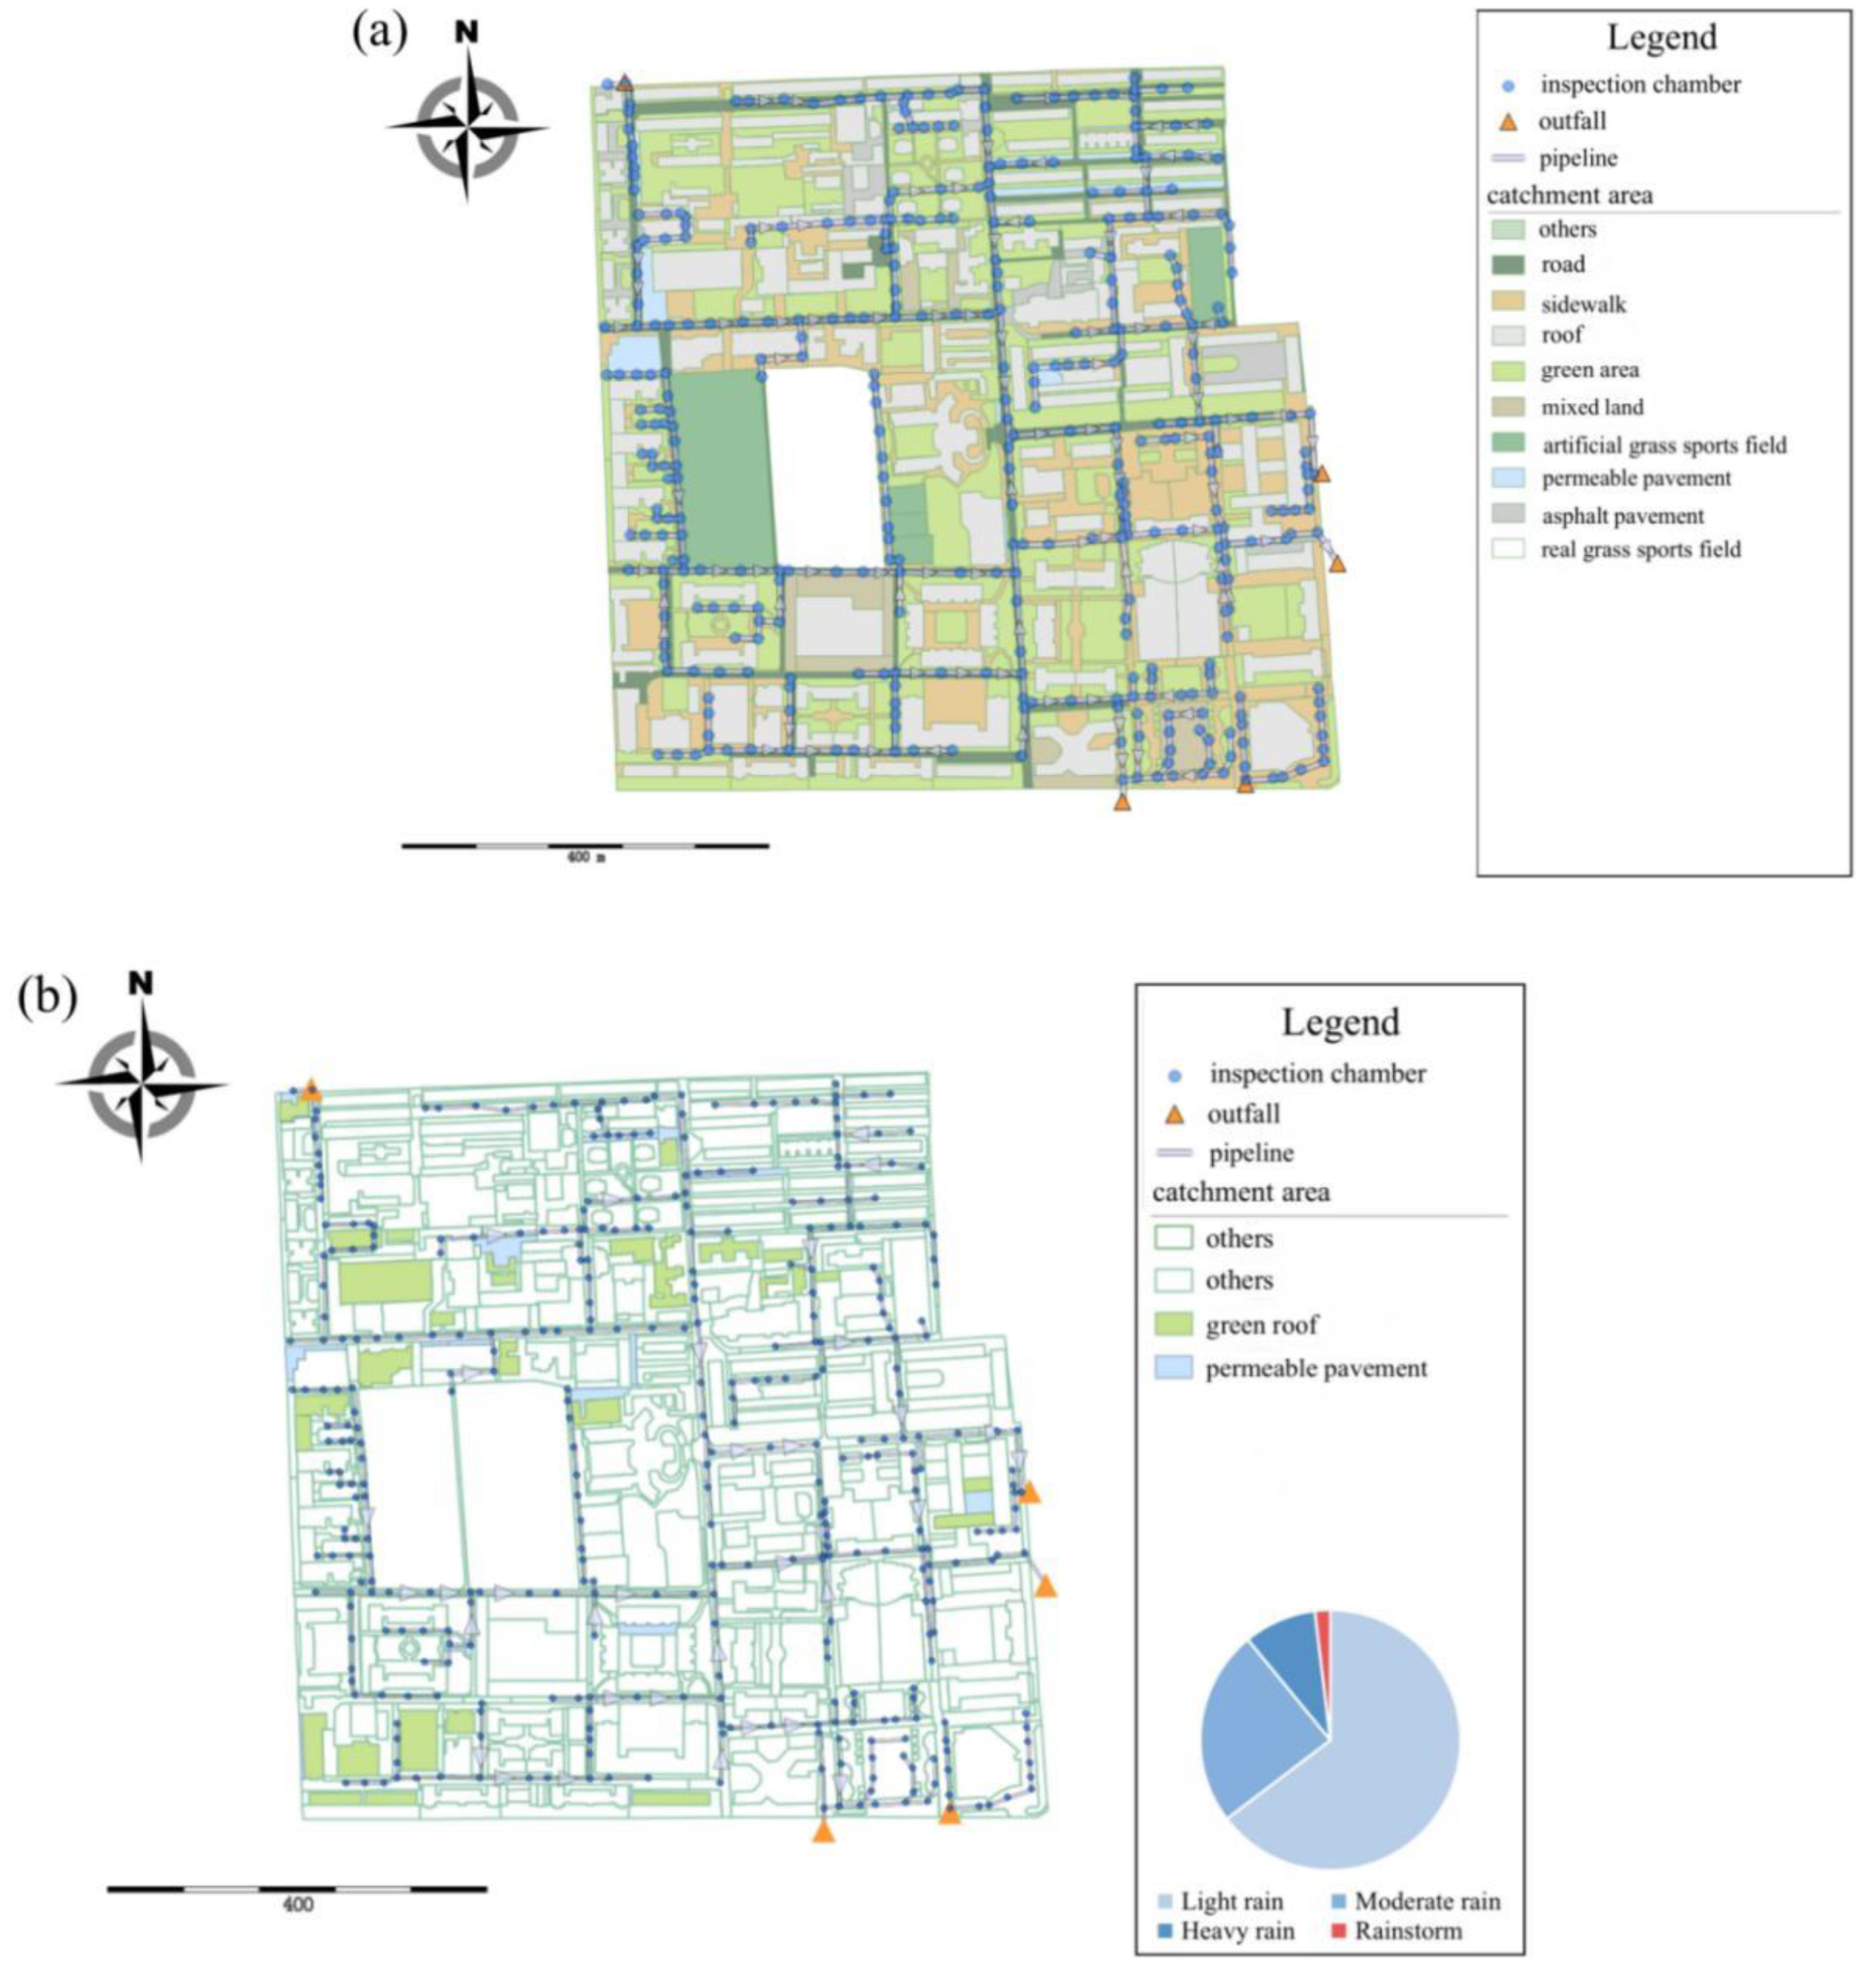
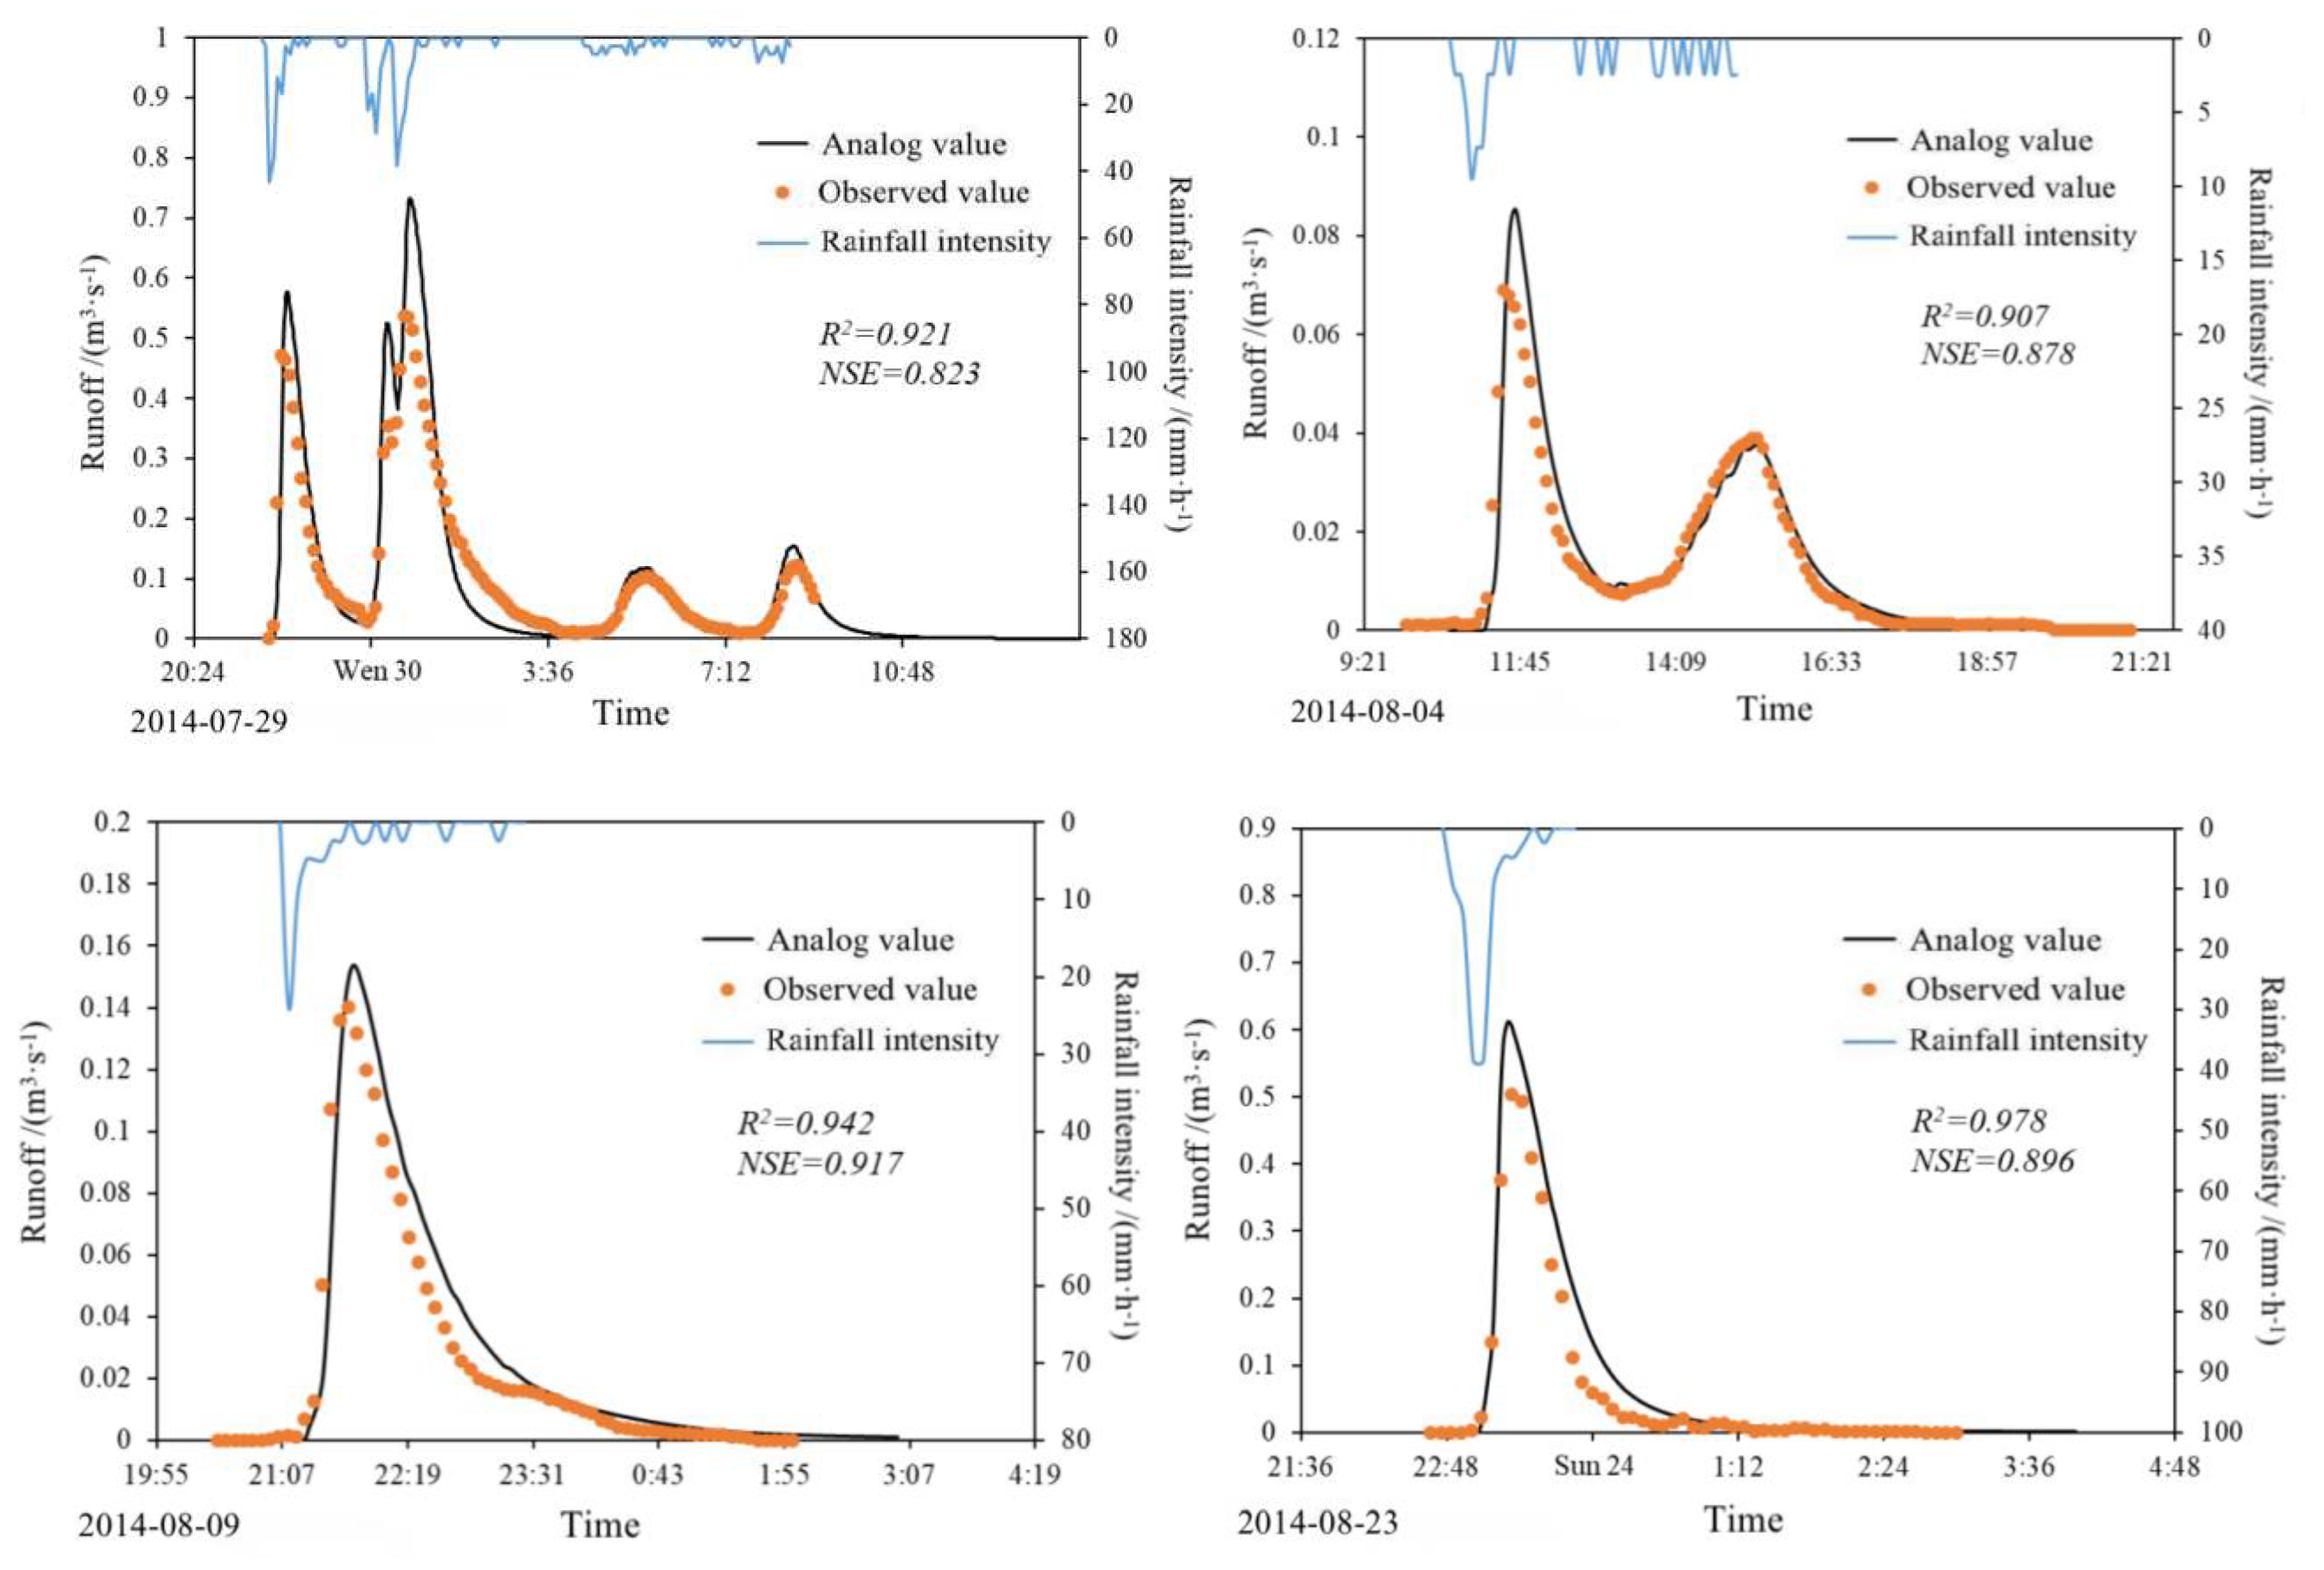
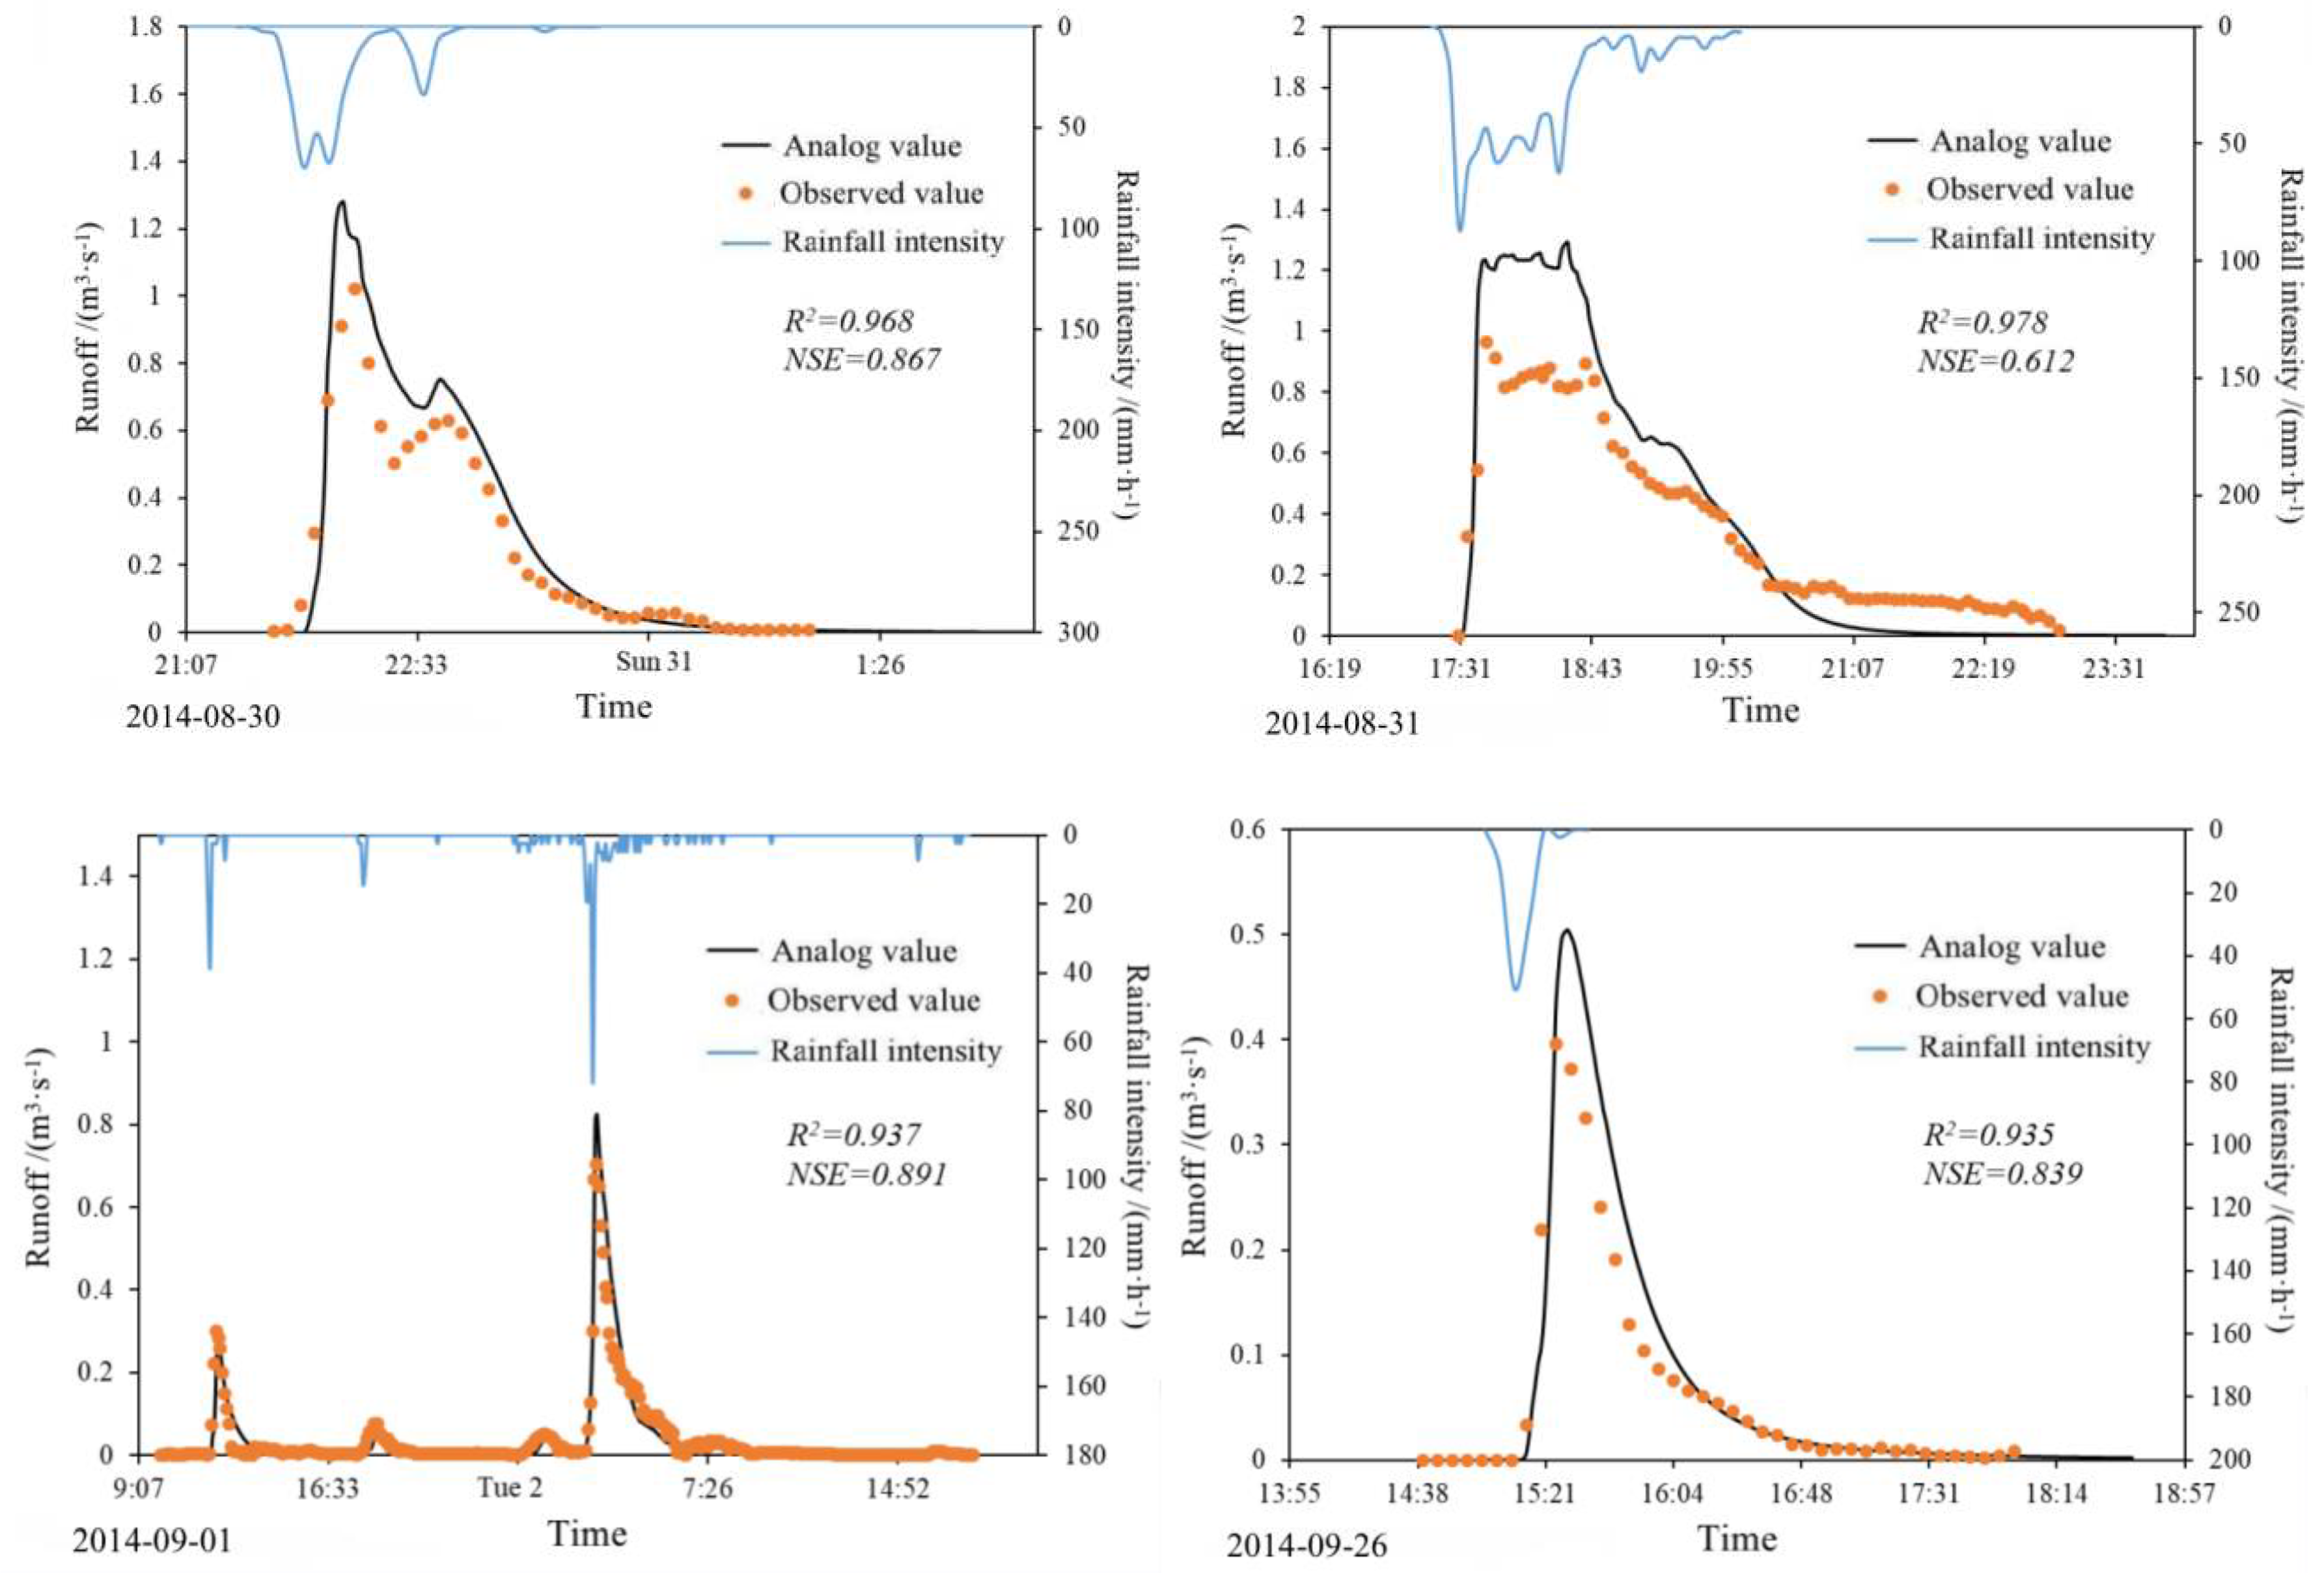
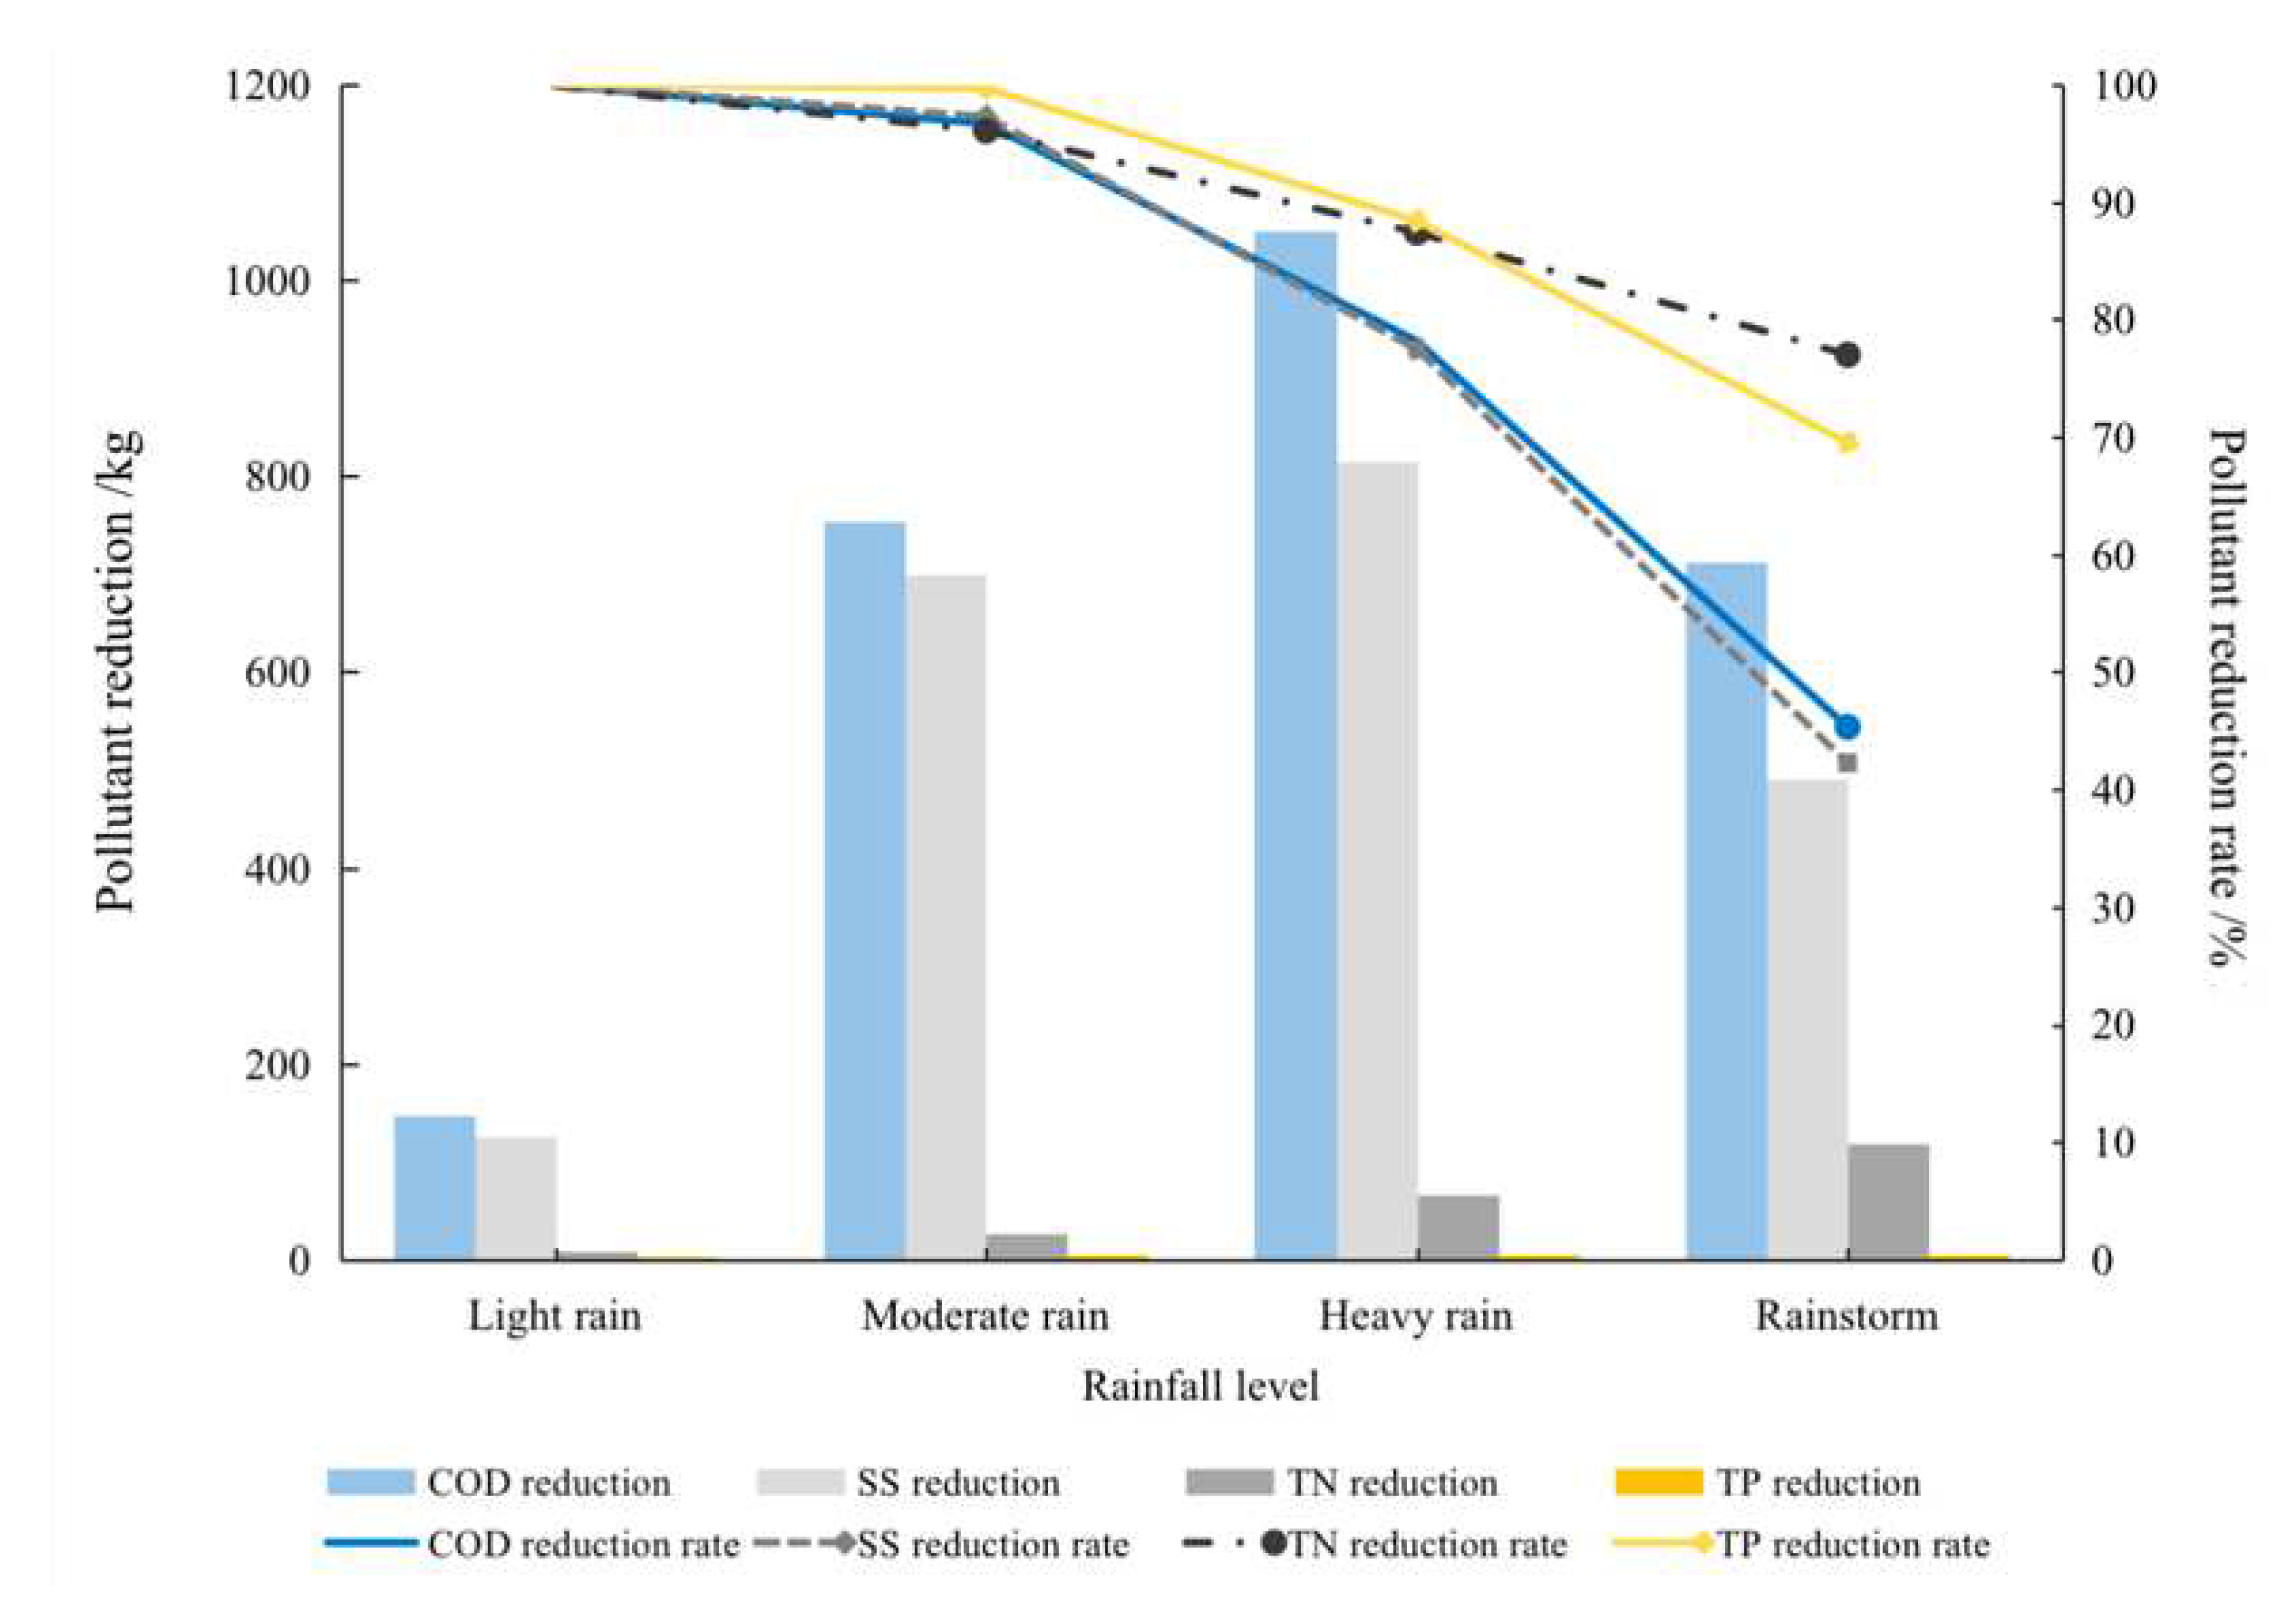
| Authors | Aspects |
|---|---|
| Glick et al. [16] | Runoff reduction rates were 77% for rain gardens, 29% for porous pavements and 15% for both green roofs and cisterns. |
| In realistic scenarios where all LIDs were implemented simultaneously, stormwater runoff was reduced by 30%. | |
| Peak flow rate reduced by 24%. | |
| Yasir Abduljaleel et al. [17] | The total runoff reduction rate is 80% under current conditions and 29% under future climate change conditions. |
| The total peak reduction rate is 62% under current conditions and 13% under future climate change conditions. | |
| The optimum combination of LIDs in the city could reduce the peak flow and total runoff volume by up to 62.25% and 80% for past storms and by13% and 29% for future storms, respectively. | |
| Infiltration trenches are the most effective in reducing peak and runoff flows, with rain gardens and bioretention ponds being less effective in reducing peak and total flows. | |
| The combined use of rain barrels, bioretention basins and infiltration trenches was the most effective LID for reducing peak flows and volumes in our study area. | |
| Quichimbo-Miguitama et al. [18] | The peak flows are reduced to 22% for general rainfall events and 15% for extreme rainfall events. |
| The total runoff reduction rate is approximately 20%. | |
| Flooded nodes were reduced to 27% in short-term events and 4% in extreme events. | |
| The reduction in flood overflow points was 27% for events with a rainfall return period of 2 years, 23% for events with a return period of 5 years and 13% for events with a return period of 10 years. | |
| Seo et al. [19] | The total land runoff reduction rate is 29% in conventional medium density cities and 25% in conservation medium density cities. |
| Nitrate loads from land use were reduced by 24%, 31% and 30% for different urban types. | |
| TP loads in land use fell by 11%, 25% and 22% for different urban types. | |
| Deng et al. [20] | The total runoff reduction rate is 35.08%. |
| The peak flow reduction rate is 26.82%. | |
| The nonpoint source pollution reduction rate is 45.18%. | |
| LeBleu et al. [21] | The average leachate temperature in permeable paving is approximately 2 degrees Celsius lower than in pavement runoff. |
| Shen [22] | Before 8 a.m., the temperature difference between the green roof and the concrete roof is 1 degree Celsius. |
| 2 p.m. is the point at which the temperature difference between the green roof and the concrete roof is greatest, with a difference of 18 degrees Celsius. | |
| Lin et al. [23] | The carbon sequestration of green land is 5450 kg carbon dioxide equivalent·a-1. |
| The carbon sequestration of rainwater utilization is 15379 kg carbon dioxide equivalent·a-1. | |
| The carbon sequestration of runoff pollutant removal is 19552 kg carbon dioxide equivalent·a-1. | |
| Saadatpour et al. [28] | The peak flow reduction rate is 80%. |
| The SS reduction rate is 81.86%. |
| Green Roof | Indexes | Value | Permeable Pavement | Indexes | Value |
|---|---|---|---|---|---|
| Surface | Height of the berm/mm | 250 | Surface | Height of the berm/mm | 20 |
| Vegetation coverage | 0.9 | Vegetation coverage | 0.15 | ||
| Surface roughness | 0.1 | Surface roughness | 0.02 | ||
| Surface slope | 1 | Surface slope | 1 | ||
| Soil | Thickness/mm | 100 | Pavement | Thickness/mm | 150 |
| Porosity | 0.463 | Voids ratio | 0.21 | ||
| Actual water content volume | 0.232 | Permeability /(mm·h-1) | 2000 | ||
| Withering point | 0.116 | Blockage coefficient | 83 | ||
| Conductivity /(mm·h-1) | 3.6 | Soil | Thickness/mm | 100 | |
| Conductivity slope | 10 | Porosity | 0.463 | ||
| Suction head/mm | 88.9 | Actual water content volume | 0.232 | ||
| Drainage mat | Thickness/mm | 100 | Withering point | 0.116 | |
| Voids ratio | 0.5 | Conductivity /(mm·h-1) | 3.6 | ||
| Manning roughness | 0.02 | Conductivity slope | 10 | ||
| Suction head/mm | 88.9 | ||||
| Storage | Thickness/mm | 300 |
| Rainfall Events | Duration of Rainfall/min | Precipitation/mm | volume Capture Ratio of Annual Rainfall/% | Average Concentration of COD /(mg·L-1) |
Average Concentration of SS /(mg·L-1) |
Average Concentration of TN /(mg·L-1) |
Average Concentration of TP /(mg·L-1) |
|---|---|---|---|---|---|---|---|
| 0804 Light rain |
266.00 | 5.66 | 0.79 | 5.06 | 2.67 | 0.28 | 0.01 |
| 0809 Light rain |
125.00 | 5.64 | 0.76 | 7.96 | 4.47 | 0.36 | 0.01 |
| 0823 Moderate rain |
50.00 | 10.40 | 0.69 | 39.63 | 23.47 | 1.36 | 0.11 |
| 0926 Moderate rain |
25.00 | 7.80 | 0.71 | 35.08 | 21.14 | 1.10 | 0.09 |
| 0729 Heavy rain |
640.00 | 35.74 | 0.65 | 64.10 | 33.41 | 3.73 | 0.22 |
| 0830 Heavy rain |
115.00 | 29.00 | 0.67 | 62.06 | 29.97 | 3.37 | 0.25 |
| 0901 Heavy rain |
1885.00 | 33.60 | 0.70 | 76.06 | 36.67 | 3.54 | 0.25 |
| 0831 Rainstorm |
170.00 | 70.56 | 0.68 | 63.05 | 31.05 | 5.76 | 0.30 |
| Parameter | Calibration Result | Parameter | Calibration Result |
|---|---|---|---|
| N-Imperv | 1.20E-02 | Dstore-Asphalt Pavements/mm | 1.15 |
| N-Perv | 0.80 | Dstore-Roofs/mm | 1.23 |
| Max.Infil.Rate/(mm·h-1) | 150.00 | Dstore-Concrete Pavements/mm | 1.34 |
| Min.Infil.Rate/(mm·h-1) | 20.00 | Dstore-Sports Field 1/mm | 1.77 |
| Decay Constant/(h-1) | 2.00 | Dstore-Sports Field 2/mm | 1.68 |
| Zero-Imperv/% | 25.00 | Dstore-Mixed Land/mm | 2.22 |
| Pipe Roughness | 1.50E-02 | Dstore-Perv/mm | 10.20 |
| Determination of Model Parameters | Rainfall Events | COD | NH3-N | TP |
|---|---|---|---|---|
| Calibration | 0729 | 0.613 | 0.625 | 0.594 |
| 0830 | 0.483 | -5.420 | 0.542 | |
| 0926 | 0.507 | 0.523 | 0.341 | |
| Validation | 0804 | 0.546 | 0.487 | -0.344 |
| 0831 | 0.669 | 0.373 | 0.477 |
| Parameter | Value | Parameter | Value |
|---|---|---|---|
| 30a | 5% | ||
| 1.23 CNY/(m3) | 6.11 CNY/(m3) | ||
| 0.013kg/(m2·d) | 0.018kg/(m2·d) | ||
| 141 CNY/t | 1108 CNY/t | ||
| 4.14 CNY/kg | 52.4 CNY/kg | ||
| 23 CNY/kg | 4.96 CNY/kg | ||
| 1.24 CNY/kg | 0.176 CNY/kg | ||
| 0.996 CNY/kg |
| Rainfall Level | Total Runoff Reduction/m3 | Total Runoff Reduction Rate/% | Peak Flow Reduction/(m3·s-1) | Peak Flow Reduction Rate/% |
|---|---|---|---|---|
| Light rain | 7.53E-07 | 99.69 | 0.12 | 99.61 |
| Moderate rain | 1.59E-06 | 97.96 | 0.55 | 99.17 |
| Heavy rain | 5.58E-06 | 90.52 | 0.84 | 89.80 |
| Rainstorm | 1.07E-05 | 80.88 | 0.89 | 68.51 |
| Benefits and Costs | Indexes | Light Rain | Moderate Rain | Heavy Rain | Rainstorm |
|---|---|---|---|---|---|
| - | Average number of fields/(a-1) | 40.80 | 15.40 | 5.70 | 1.20 |
| Runoff control benefits | Runoff control benefit/(CNY·field-1) | 2492.00 | 3944.24 | 13128.96 | 25251.08 |
| Runoff control benefit/(CNY·a-1) | 101673.57 | 60741.30 | 74835.10 | 30301.30 | |
| Flood control benefits | Flood control benefit/(CNY·field-1) | NA | NA | NA | 6812.65 |
| Flood control benefit/(CNY·a-1) | NA | NA | NA | 8175.18 | |
| Water quality benefits | COD control benefit/(CNY·field-1) | 796.13 | 4055.82 | 5657.12 | 3828.30 |
| SS control benefit/(CNY·field-1) | 621.29 | 3472.64 | 4045.43 | 2432.43 | |
| TN control benefit/(CNY·field-1) | 190.76 | 634.80 | 1601.59 | 2830.35 | |
| TP control benefit/(CNY·field-1) | 14.20 | 119.35 | 251.31 | 312.30 | |
| Water quality benefit/(CNY·field-1) | 1622.37 | 8282.62 | 11555.45 | 9403.39 | |
| Water quality benefit/(CNY·a-1) | 66192.85 | 127552.27 | 65866.07 | 11284.07 | |
| Hydrological regulation and water quality benefits | Hydrological regulation and water quality benefits/(CNY·a-1) | 167866.42 | 188293.57 | 140701.17 | 49760.54 |
| Ecological benefits | Carbon sequestration benefit/(CNY·d-1) | 50.29 | |||
| Oxygen release benefit/(CNY·d-1) | 547.16 | ||||
| Ecological benefits/(CNY·a-1) | 218070.24 | ||||
| Total benefits | Total benefits/(CNY) | 11755189.30 | |||
| Construction costs of green infrastructure | Construction cost of permeable pavement/(CNY) | 723450.00 | |||
| Construction cost of green roof/(CNY) | 5487000.00 | ||||
| Total costs of green infrastructure/(CNY) | 9074545.15 | ||||
| Construction costs of grey infrastructure | Construction cost of pipe network /(CNY) | 549368.40 | |||
| Total costs of grey infrastructure/(CNY) | 802722.56 | ||||
| Total costs | Total costs/(CNY) | 9877267.72 | |||
Disclaimer/Publisher’s Note: The statements, opinions and data contained in all publications are solely those of the individual author(s) and contributor(s) and not of MDPI and/or the editor(s). MDPI and/or the editor(s) disclaim responsibility for any injury to people or property resulting from any ideas, methods, instructions or products referred to in the content. |
© 2023 by the authors. Licensee MDPI, Basel, Switzerland. This article is an open access article distributed under the terms and conditions of the Creative Commons Attribution (CC BY) license (http://creativecommons.org/licenses/by/4.0/).


