1. Introduction
During long-time service, tunnels are subjected to various adverse factors, including stress from the earth, vehicle load and new underground structure around, that result in inevitably vertical, transverse and axial deformation (three-direction deformation) of the structure [
1]. Excessive deformation of a tunnel in any direction not only affects the structural performance, but also poses a threat to its regular functionality. Therefore, monitoring serves as a crucial mechanism to guarantee the safety of long tunnels during service.
There are currently several methods for monitoring tunnel deformation, including manual visual detection, direct measurement and automatic monitoring [
1]. However, the manual visual detection method is both time-consuming and labor-intensive, while also highly dependent on the operator’s subjective assessments. In contrast, the direct measurement method involves the regular use of equipment such as levels, total stations, and cable displacement meters to measure specific target areas at fixed points. While this method can be more accurate, it also requires a significant amount of resources and infrastructure to implement effectively. These two monitoring methods are not suitable for long-term deformation monitoring during tunnel service as they cannot monitor the tunnel in real-time. Automatic monitoring technologies, such as automatic total station [
2,
3,
4], photogrammetry [
5,
6,
7,
8], ground laser scanning (TLS), etc., have been developed for long-term tunnel monitoring. Four LEICATC2003 automatic total stations were used in the monitoring of the Blue Line tunnel expansion project in Lisbon, Portugal [
9]. In Belgium, ground laser scanning (TLS) was employed to measure newly constructed concrete tunnels using an elliptic method [
10]. Although automatic monitoring technology is capable of autonomous target search, identification, tracking, and real-time data transmission, it still has its own limitations. For example, automatic total station and photogrammetry technology are difficult to be applied to tunnel deformation monitoring in poor lighting conditions, harsh weather environment and bending section [
11,
12,
13].
The above three methods are all considered as discrete "point" monitoring techniques. They have the ability to obtain the deformation values of certain points on specific tunnel sections. But these methods fall short in overall monitoring of the tunnel. To address this, advanced techniques have been developed to provide comprehensive measurement of tunnel deformation with the capability to gather and analyze data from the entire tunnel. A highly-efficient method for tunnel surface scanning used a 3D laser scanner to rapidly capture millions of coordinate points [
14,
15,
16]. Another automated approach employed moving Light Detection and Ranging (LiDAR) data to construct a subway tunnel completion model [
17]. Additionally, a technique combining laser scanning and photogrammetry was used to extract diverse tunnel feature information [
18]. Nonetheless, processing the enormous cloud data in these methods requires substantial computing resources, and expensive equipment makes it challenging to implement them in monitoring tunnel deformation. In recent years, the fiber Bragg grating sensing technology (FBG) has been introduced into tunnel deformation monitoring. In comparison to conventional electric and magnetic strain sensors, FBG sensors offer exceptional electromagnetic interference resistance, stability, and durability. Furthermore, they provide high measurement accuracy, are lightweight and slim, and allow for distributed arrangement [
19,
20,
21]. To monitor the overall deformation of a tunnel, a method involved affixing distributed optical fiber on a PVC pipe and securing it to the tunnel's side wall [
22]. In addition, a low-cost FBG sensing system was utilized for monitoring crack growth in the concrete linings of highway tunnels [
23]. To obtain the overall profile of tunnel longitudinal displacement, a set of FBG bending meter, with angle measurement and temperature compensation functions, had been developed using long-gauge FBG sensing technology [
24]. Researchers have combined distributed FBG monitoring technology with neural networks to study tunnel section deformation monitoring [
25,
26]. However, most studies based on FBG sensor technology only focus on specific directional deformations, failing to adequately estimate the structure's deformation in all three directions simultaneously.
Not only do FBG sensors have their own advantages, but long-gauge FBG sensors also possess a "long-gauge" configuration for "distributed placement," which allows for the precise measurement of average strain over a significant gauge length, spanning several centimeters or meters. This feature enables the measurement of various parts of a structure or the entire structure itself with high precision [
27]. In this study, we identify the three-direction deformation of a long tunnel using long-gauge FBG sensing. The strain of the tunnel section is analyzed using a mechanical model for the establishment of the coupled strain separation model and the three-direction deformation of the tunnel is then identified using the proposed model based on the long-gauge FBG sensor data. The remainder of the paper is organized as follows:
Section 2 describes the proposed method of three-direction deformation and the theoretical basis.
Section 3 presents the numerical example of a tunnel. The processing and analysis of the field monitoring data are presented in
Section 4. Finally, the conclusions of this paper are presented in
Section 5.
2. Method for Estimation of the Three-Direction Deformation Distribution
The strain at any point within the tunnel provides crucial information about the vertical, transverse and axial deformation of the section. To accurately determine the deformation in all three directions, this study first separates the monitored coupling strain and then uses the separated strains to estimate the deformation distribution of the structure in different directions.
2.1. Coupling Strain Separation
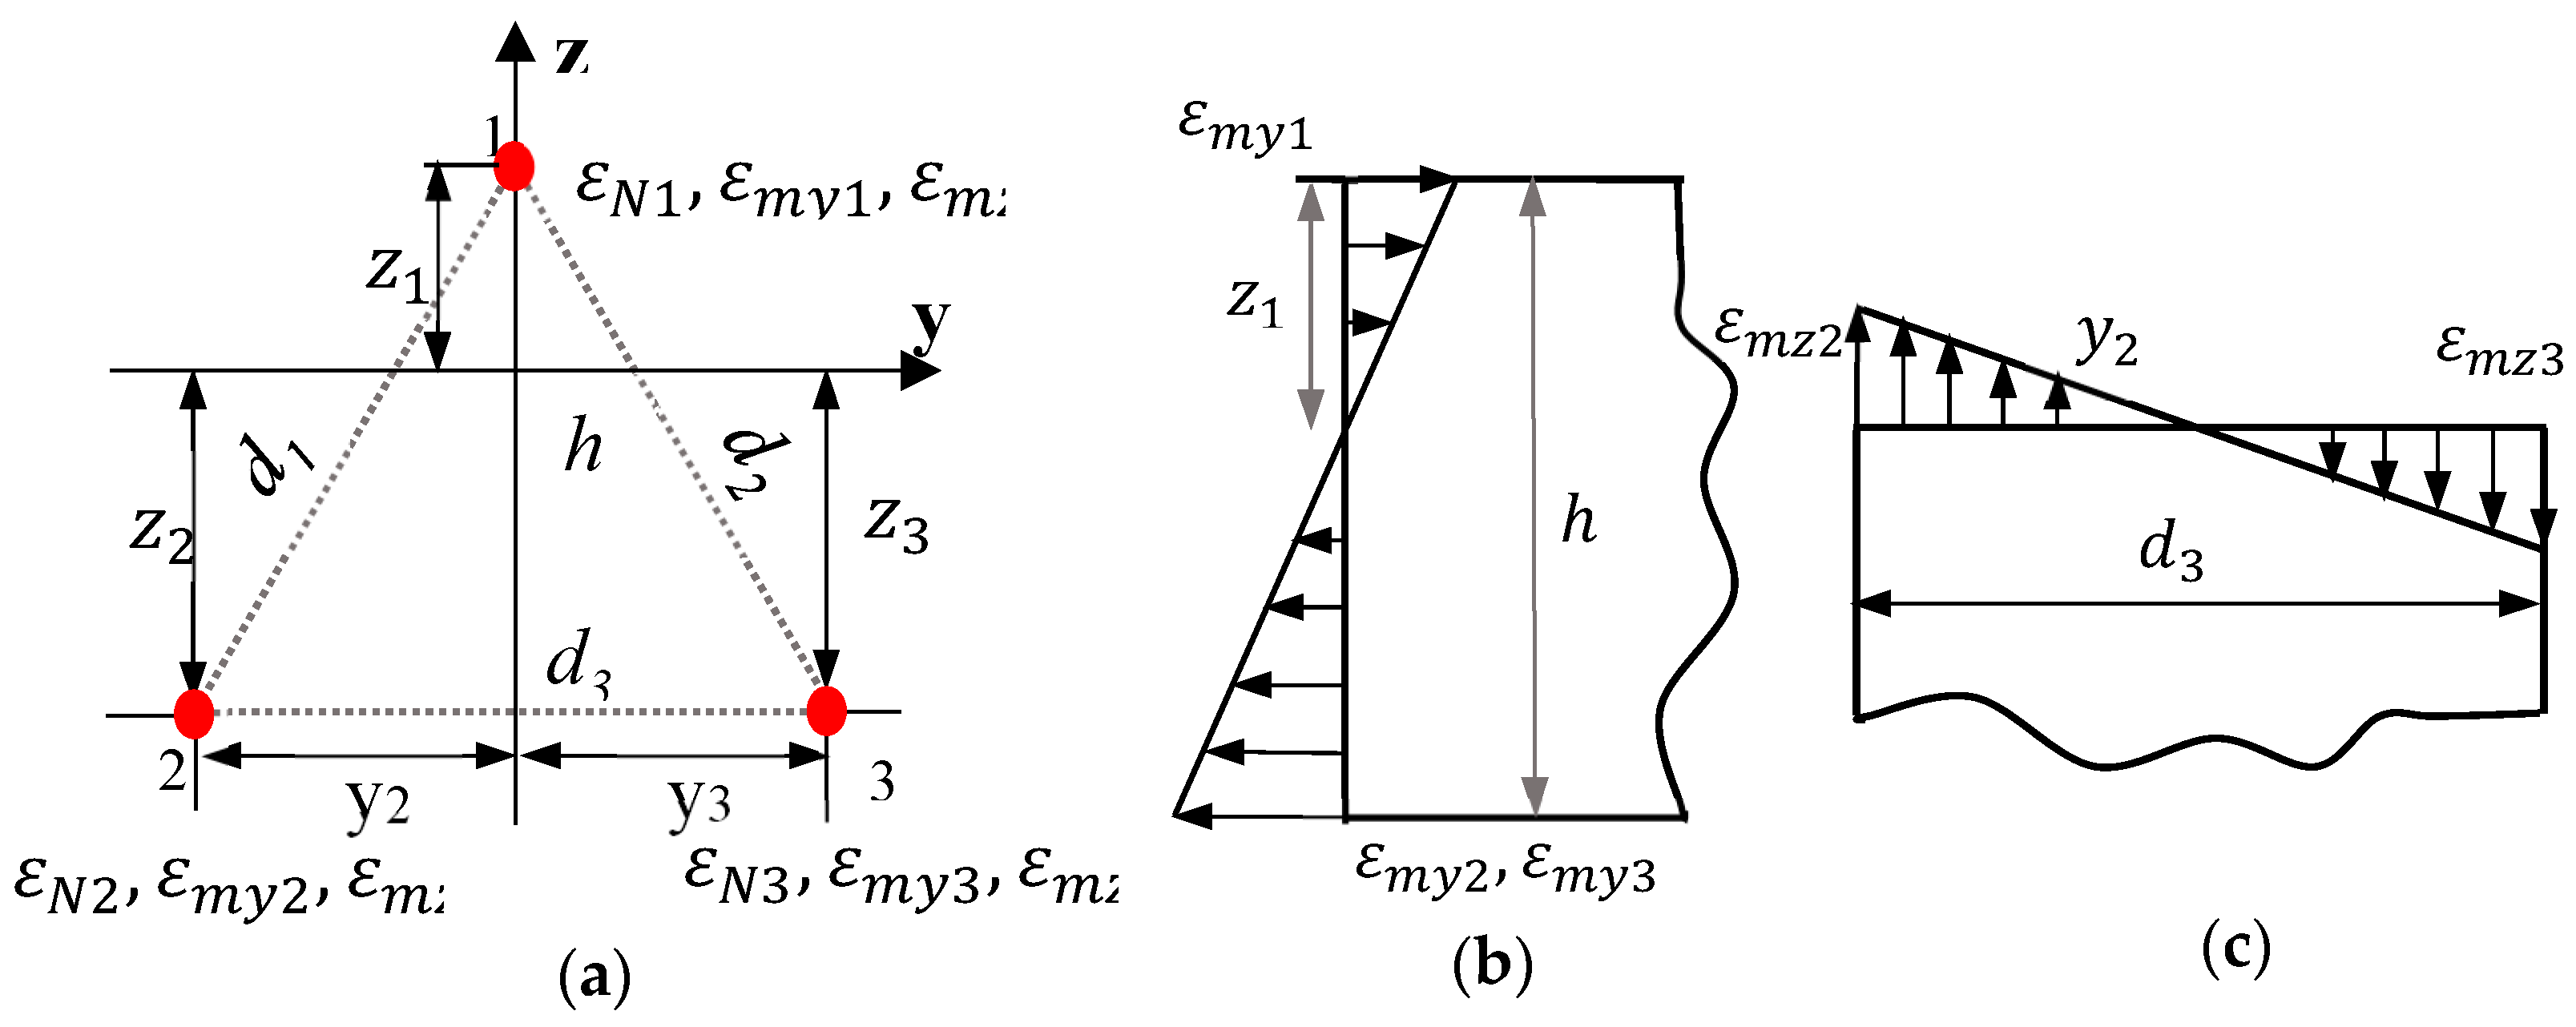
During the tunnel service process, the strain collected by the long-gauged FBG sensor includes three-direction strain: vertical and transverse bending strain as well as axial strain. To accurately calculate the deformation distribution, it is necessary to decompose the coupling strain into unidirectional strain. Material mechanics has shown that the normal stress at any point of the section is proportional to the distance from the point to the neutral axis if the material is linearly elastic. Selecting three points arranged in an isosceles triangle on the section as monitoring points enables the decoupling of the monitored coupling strain. This allows for the establishment of a relationship between the coupling and separated strain, as illustrated in
Figure 1.
In
Figure 1,
and
are the neutral axes of vertical bending strain and transverse bending strain respectively. At any given point in the section, the monitored strain is the sum of the strains in all three directions, which can be expressed as,
where
are the monitored strain of points 1, 2 and 3.
,
,
represent axial strain, vertical and transverse bending strains respectively. Axial strain on the same section is deemed to be equivalent, that is,
, which is substituted into Eq. (1). Equation (1) is further derived as,
Based on elastic theory, the vertical bending strain at point 1 can be expressed as,
where
is the vertical bending moment. E is the elastic modulus.
is the moment of inertia with respect to the y axis.
is the distance from point 1 to the neutral axis
. Because
, the vertical bending strains at points 2 and 3 are expressed as,
where
and
are the distance from points 2 and 3 to the neutral axis
, respectively.
is the vertical distance from point 1 to points 2 or 3. In combination with Eqs. (3) and (4), the vertical bending strain at points 2 and 3 can be directly correlated to the vertical bending strain at point 1, which is expressed as,
Similarly, the transverse bending strains at points 1, 2 and 3 are expressed as,
where
is the transverse bending moment.
is the moment of inertia with respect to the z axis.
are the distance from points1, 2 and 3 to the neutral axis
. Based on the geometric relationship between points 2 and 3, we can express the transverse bending strain at point 3 in terms of the corresponding strain at point 2.
where
represents the distance between points 2 and 3. The relationship between points 2 and 3 is shown in
Figure 1c. It can be inferred from
Figure 1a that
, which can be substituted into Eq. (7). Equation (7) is rewritten as,
As point 1 lies on the neutral axis z,
, the transverse bending strain at point 1 is,
Finally, Equations. (5), (7), (8) and (9) are substituted into Eq. (2), and Eq. (2) is rewritten as,
By solving Eq. (10), we can get , , . By using Eqs. (5) and (9), the vertical bending strain and transverse bending strain can be calculated at the three points. This enables the coupling strain monitored at the three points to be decomposed into three distinct directional strains.
2.2. Tunnel Three-Direction Deformation Estimation
Based on the axial strain, vertical and transverse bending strain separated from the coupling strain, this part analyzes the stress characteristics across various directions and applies distinctive methods to estimate the deformation in each direction. Given the comparable bending deformation characteristics of a tunnel in both vertical and transverse directions, it is appropriate to treat the tunnel as a semi-infinite elastic foundation beam model. Based on an improved conjugate beam method [
23], this study employs the seperated strains to accurately calculate the transverse and vertical displacement of the tunnel respectively. Taking the tunnel as a continuous beam, it is assumed that the
th span length is L and beam height is
. This span is divided into n units, the settlement of both sides of the support is
and
, then the deformation
at the demarcation point of the kth, (k+1)th unit can be calculated as,
where
is the average curvature of the ith unit. For the vertical bending deformation of the tunnel, Equation. (11) is further derived as,
where
and
are the vertical displacements of the supports on both sides respectively.
is the vertical average curvature of the ith unit and calculated as,
Similar to Eq. (12), the transverse bending deformation of the tunnel can be calculated as follows,
where
and
are the transverse displacements of the supports on both sides respectively.
the transverse average curvature of the ith unit and expressed as,
Therefore, the vertical and transverse displacement of the tunnel can be calculated by Eqs. (12) and (14). Based on the linear elastic relationship of materials, the axial deformation of the ith unit can be calculated as,
where
and
are the axial deformation and the length of the ith unit, respectively.
represents the axial strain of the ith unit, which is obtained by separating the coupling strain. By extracting the axial strain from the coupling strain of each unit, the overall axial deformation of the tunnel can be accurately identified by using Eq. (16).
3. Numerical Analysis for Verification
In this part, a tunnel structure with a length of 60m are investigated to demonstrate the validity and efficiency of the proposed method. The tunnel is a reinforced concrete three-hole frame structure, 8.4m high and 33.8m wide. The cross section of the tunnel is shown in
Figure 2. The tunnel is located 30m underwater with a 2.5m thick soil roof. The backfill soil has a floating bulk weight of 9 kN/m3, a cohesion of 24.2 kPa, and an internal friction angle of 20 degrees. In addition, the water has a density of 996.7 kg/m3. The "load-structure model" is used to calculate the load. The calculation results show that the load W0 on the top of the tunnel is 315.53kPa. The upper vertex E1 and lower vertex E2 are 293.03kPa and 389.267kPa under the trapezoidal load on both sides. The load W1 at the bottom is 375.078kPa.
In the finite element model, the structure is divided into 60 equal units connected by 61 nodes, each 1m long. The model material is C50 concrete with Poisson's ratio of 0.2 and elastic modulus of 3.45×10⁴Mpa. The foundation model adopts the model of "elastic foundation beam on semi-infinite plane foundation" and the ground spring model is used to simulate. The spring stiffness of soil is 100kN/m. The left and right frames of the structure serve as channels for vehicles to drive through. It is challenging to install and maintain sensors in these frames under normal vehicle operation. As a result, the long-gauge FBG sensors are installed in the central frame, as shown in
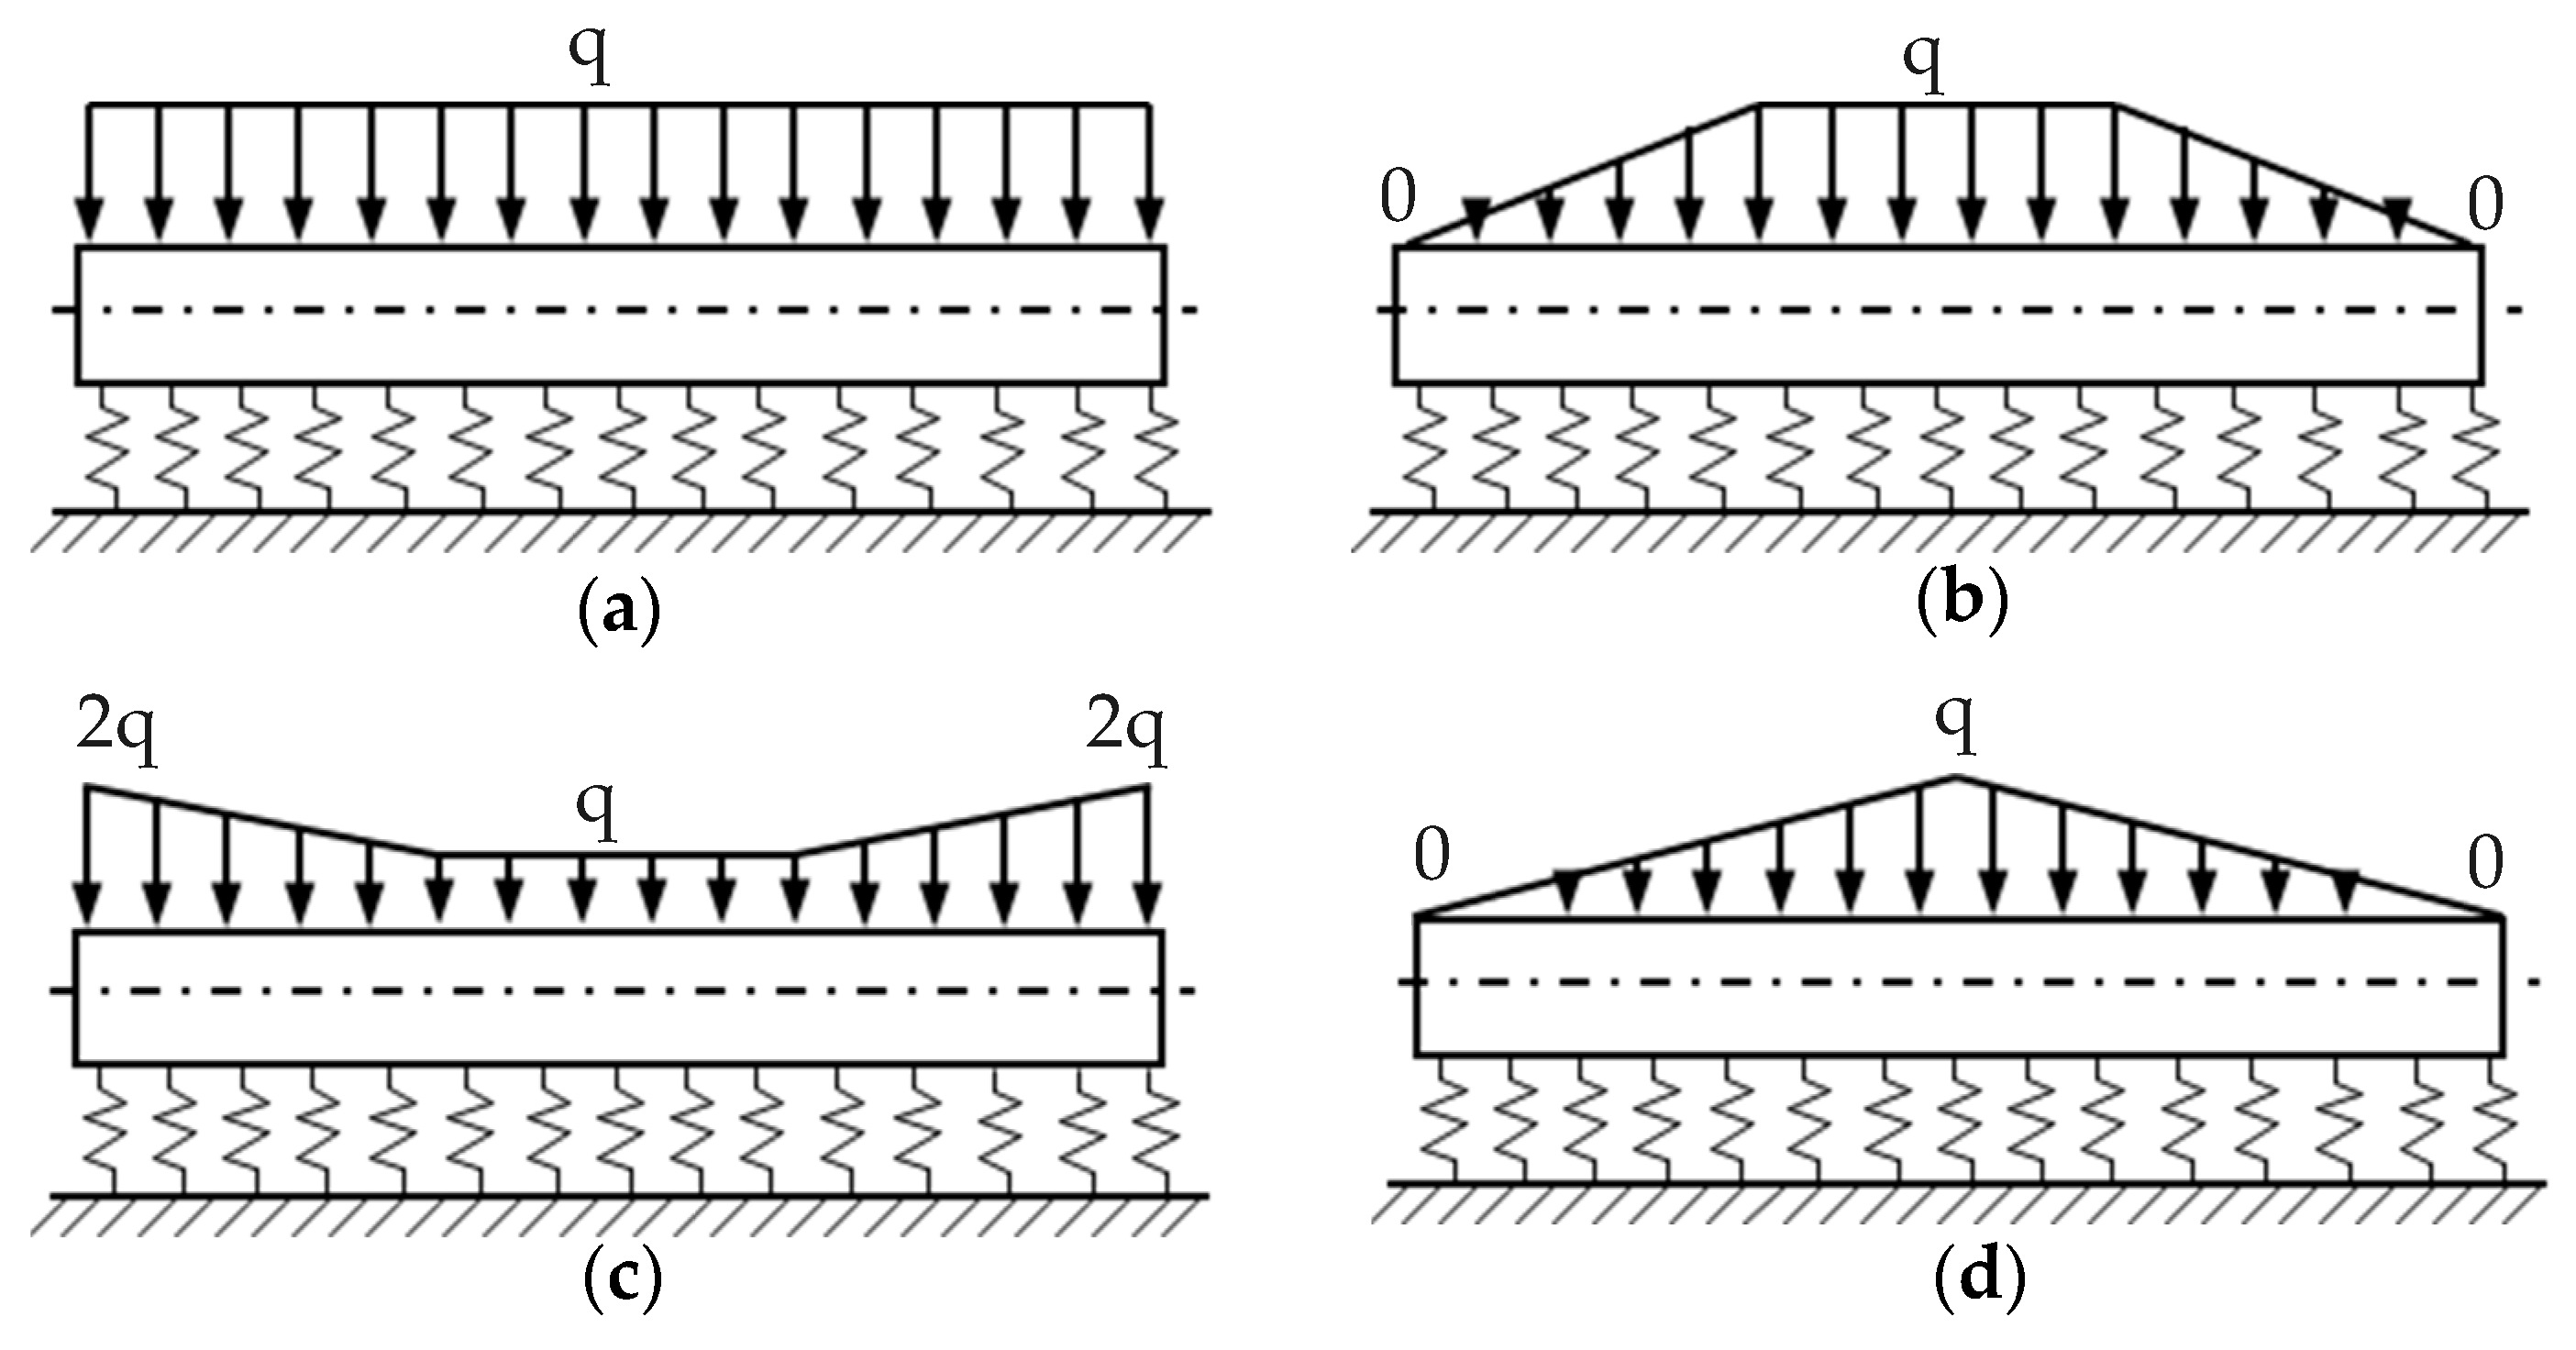
Figure 2b. Based on the coupling strain separation theory discussed above, three long-gauge FBG sensors are strategically placed in the section of the pedestrian maintenance channel. This setup is meant to effectively separate the coupling strain in this section. To verify the effectiveness of the proposed coupling strain separation and tunnel three-direction deformation identification method, four load distribution cases (C1 to C4) are applied longitudinally along the tunnel, as shown in
Figure 3. It is worth noting that the q loaded on each cross section in
Figure 3 represents the load distribution given in
Figure 2b, which includes loads W0, W1, E1, and E2.
3.1. Coupling Strain Separation
The coupling strain time history data are collected by the long-gauge FBG sensors for four load conditions. The coupling strain is then decoupled to obtain the strain in the three directions of the tunnel section by the proposed method, as shown in
Figure 4.
Taking point 1 on the section as the research object,
Figure 4a shows the vertical bending strain distribution on the entire tunnel. Taking point 2 on the section as the research object,
Figure 4b,c demonstrate the transverse and axial strain distributions on the entire tunnel respectively. As depicted in
Figure 4, the axial strain distribution along the tunnel remains relatively constant, while the vertical and transverse bending strain distributions generate significant relative strains in the mid-span when subjected to varying load distributions. To assess accuracy, the estimated three-direction strain are compared to the actual strain, resulting in the calculation of the relative error (RE). The result of the RE calculation is displayed in
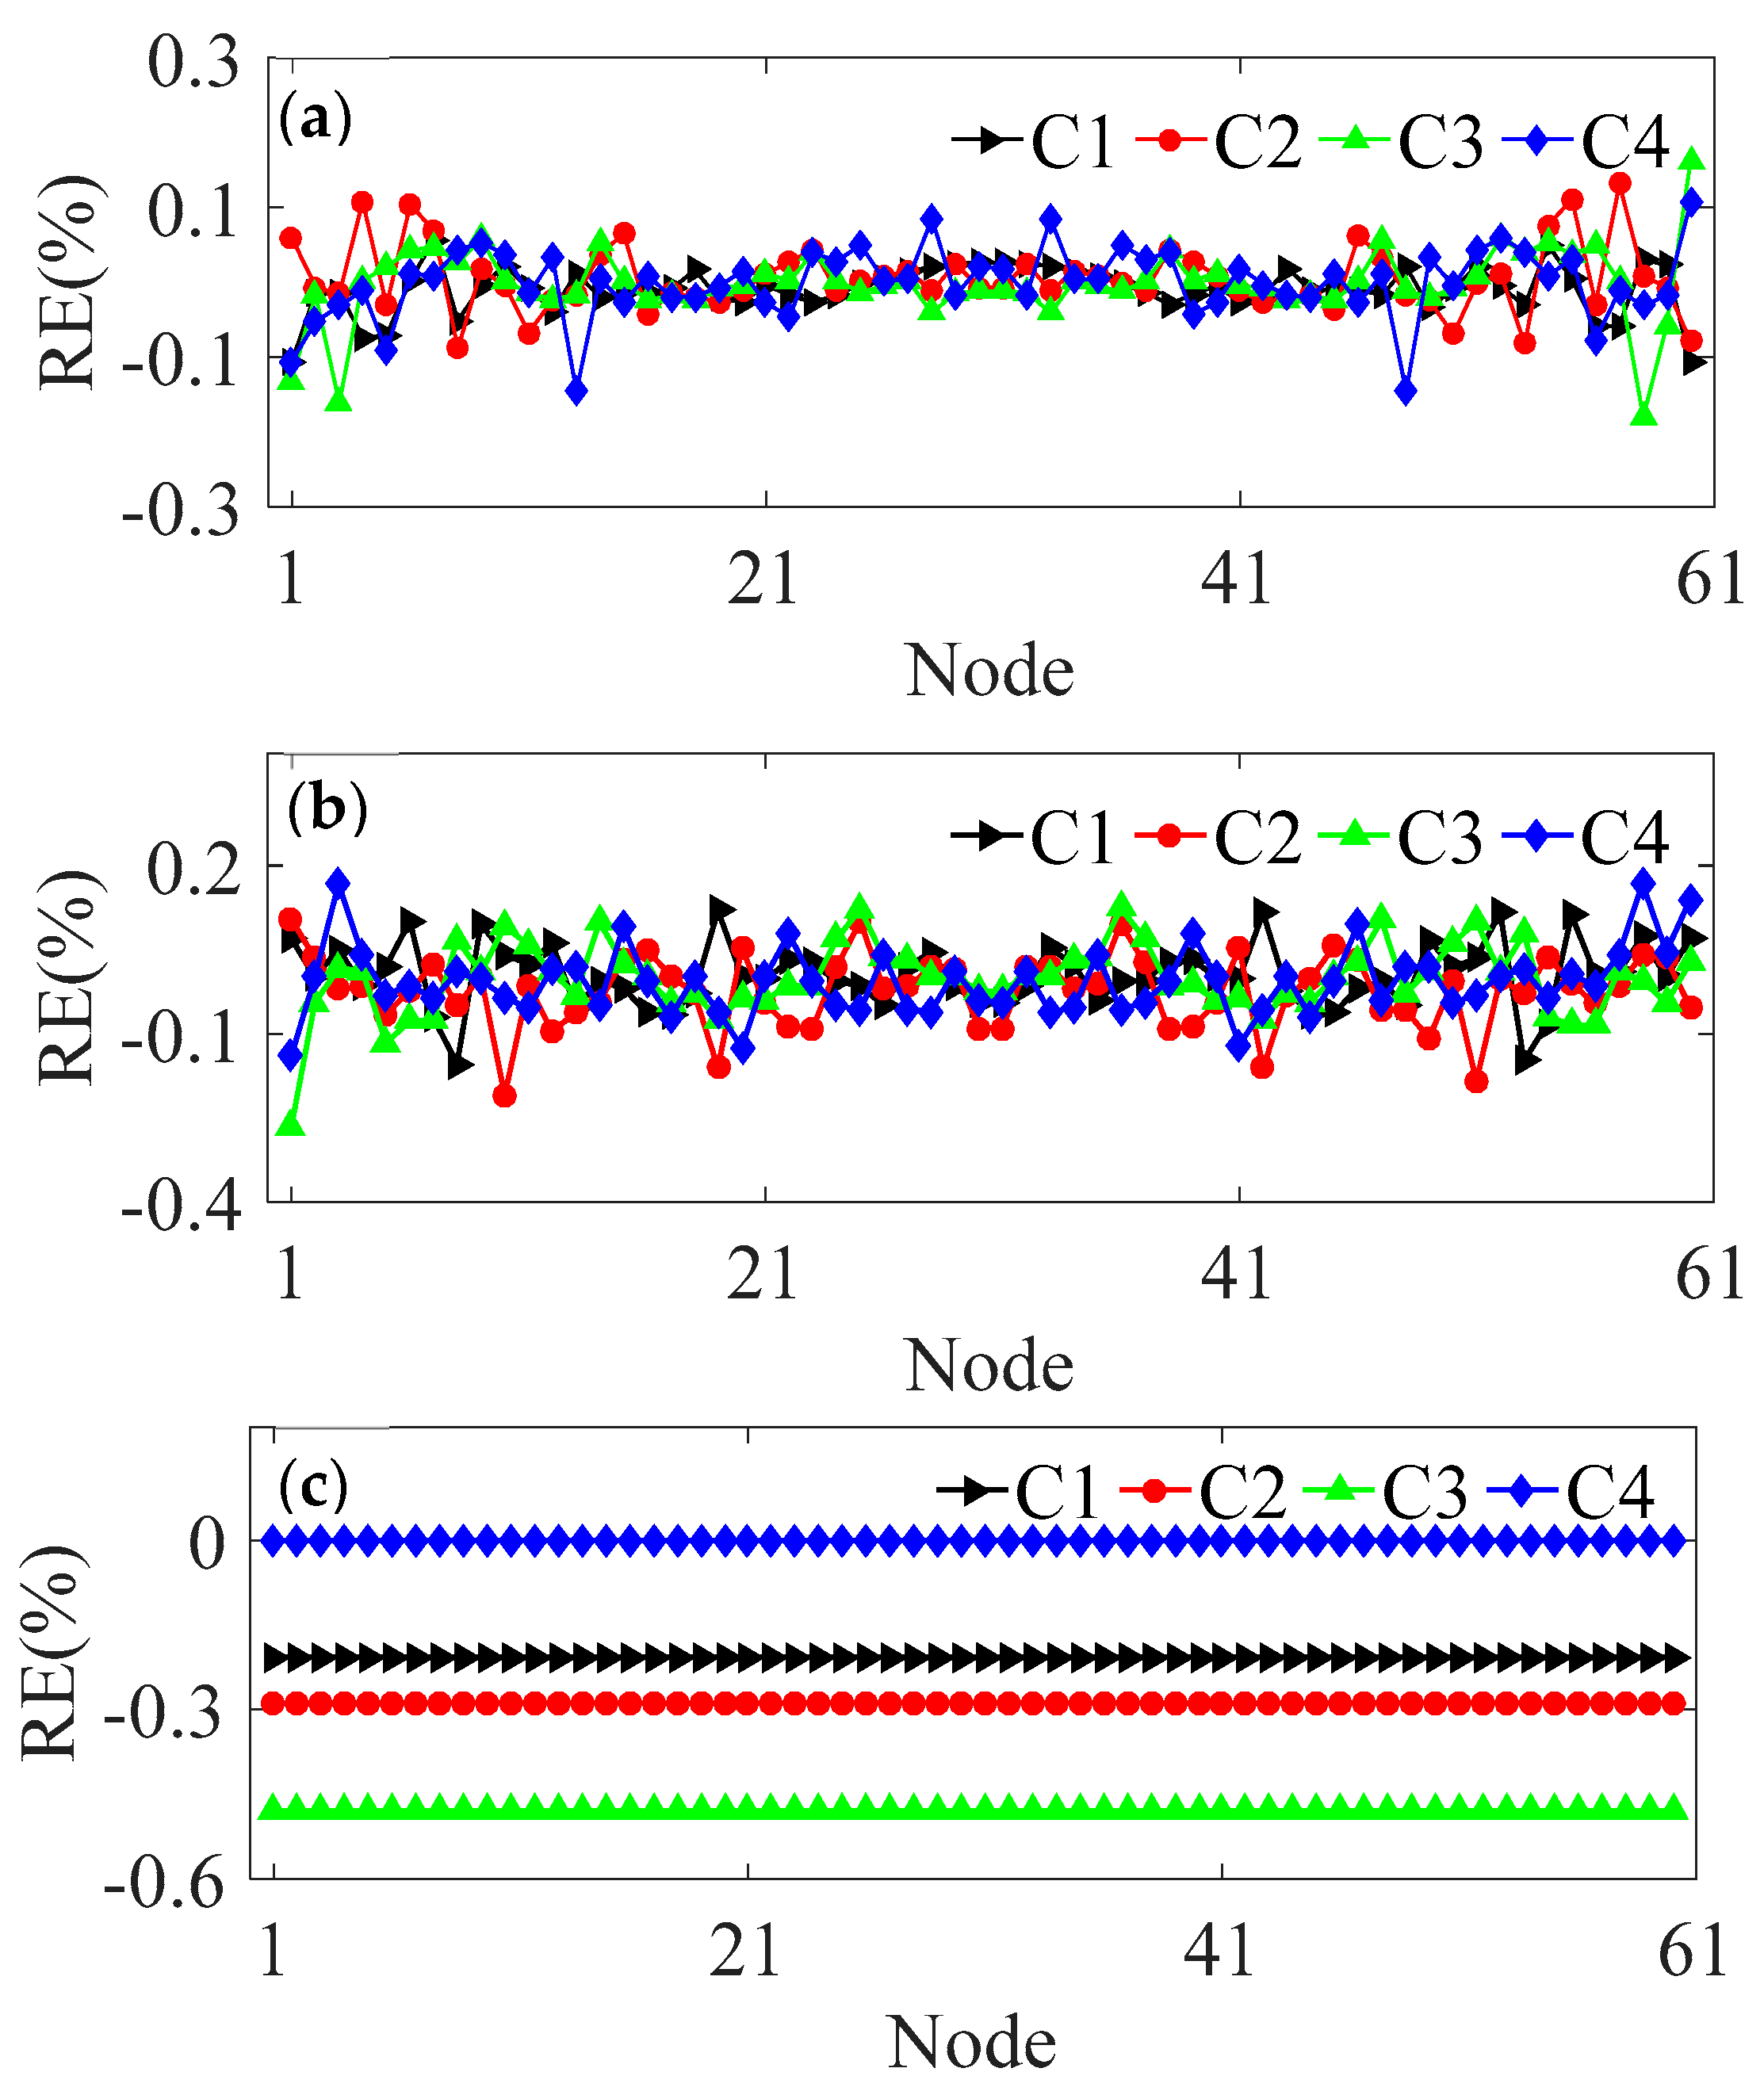
Figure 5.
Figure 5a–c demonstrate the REs of vertical, transverse and axial strain distributions separated from the measured strain, respectively. As can be seen from
Figure 5, it is evident that the separated vertical and transverse bending strains exhibit stable control within ±0.2% and ±0.3%, respectively. Notably, the highest magnitudes of the both strains are observed in case C3, with values of 0.18% and -0.26%, respectively. The RE for the separated axial strain shows stability along the entire length of the tunnel, with the highest value recorded at 0.48% for case C3. Under the four cases, the REs for each strain type are found to be less than 1%. This clearly indicates that the strain separation theory proposed in this paper is both reliable and practical in facilitating coupling strain separation calculations across a variety of load conditions.
3.2. Three-Direction Deformation Estimation
The above separated three-direction strain is used to calculate the vertical, transverse and axial deformation distributions of the tunnel respectively. The three-direction deformation distribution identified by the proposed method is shown in
Figure 6.
Focusing on point 1 in the section under study,
Figure 6a presents a comprehensive display of the vertical deformation distribution throughout the tunnel. Similarly, examining point 2 on the section,
Figure 6b,c demonstrate the transverse and axial deformation distributions across the tunnel respectively. In
Figure 6a,b, it can be observed that the vertical and transverse deformation patterns of the tunnel align with the strain distribution trends, culminating at their peak levels at the mid-span location. It is assumed that one end of the tunnel is fixed for axial displacement calculation. As a result, the axial deformation gradually increases along the length of the tunnel, reaching its maximum value at the opposite end, as shown in
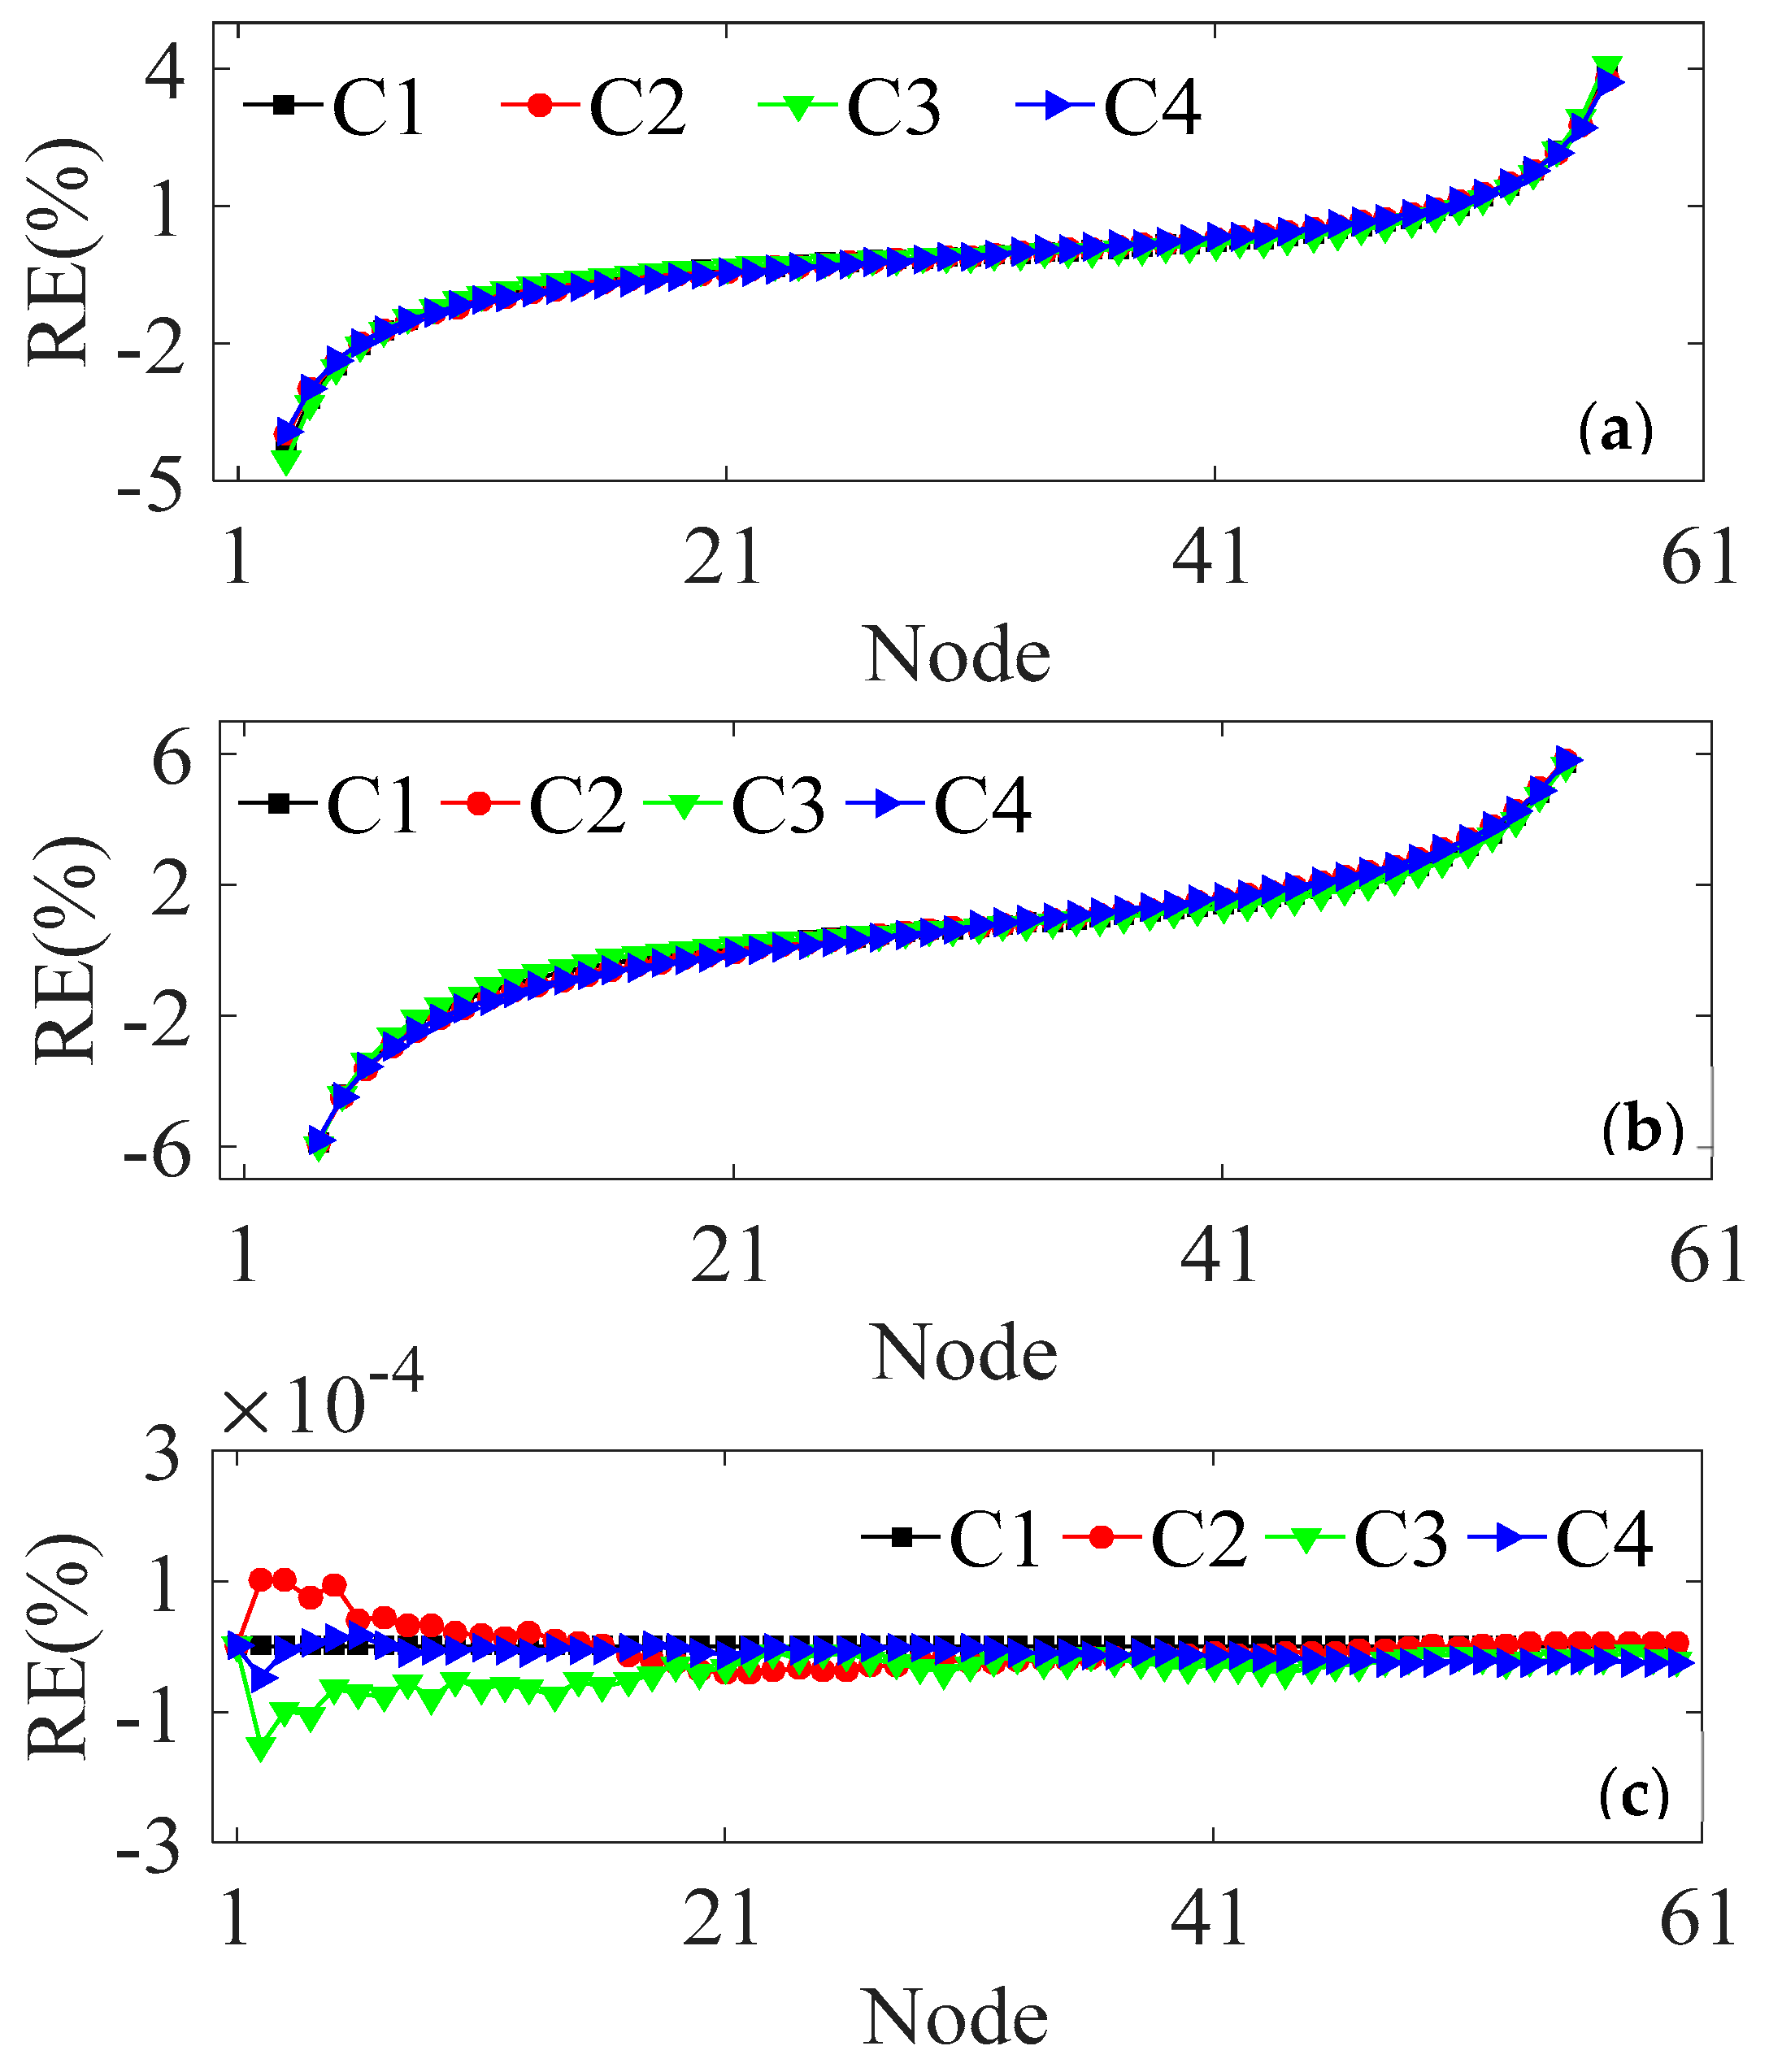
Figure 6c. The RE of the identified three-direction displacement under four cases is analyzed, and the calculated results are shown in
Figure 7.
Figure 7a–c respectively show the REs of the identified vertical, transverse and axial deformation distributions by the proposed method, respectively. The REs of the identified vertical and transverse deformation under the four cases are controlled within ±5% and ±6% respectively, and the maximum errors of these two displacements occur in case C3, which are 4.54% and 5.93% respectively. Due to the values of both ends of the two types of deformation being close to zero, the REs at both ends of the tunnel are relatively large. But they all fall within a reasonable range. The identified axial deformation has a high accuracy, and its relative error is within ±0.0002%, as shown in
Figure 7c. The above findings provide evidence for the reliability of the three-direction deformation calculation method presented in this paper, and the identification outcomes remain unaltered by the load distribution.
4. Application using Monitoring Data of a Tunnel
4.1. Sensor Layout and Field Monitoring
The investigated tunnel has been discussed in the section 3. The monitoring length of the tunnel is 1320m. The detailed dimensions of the tunnel section is shown in
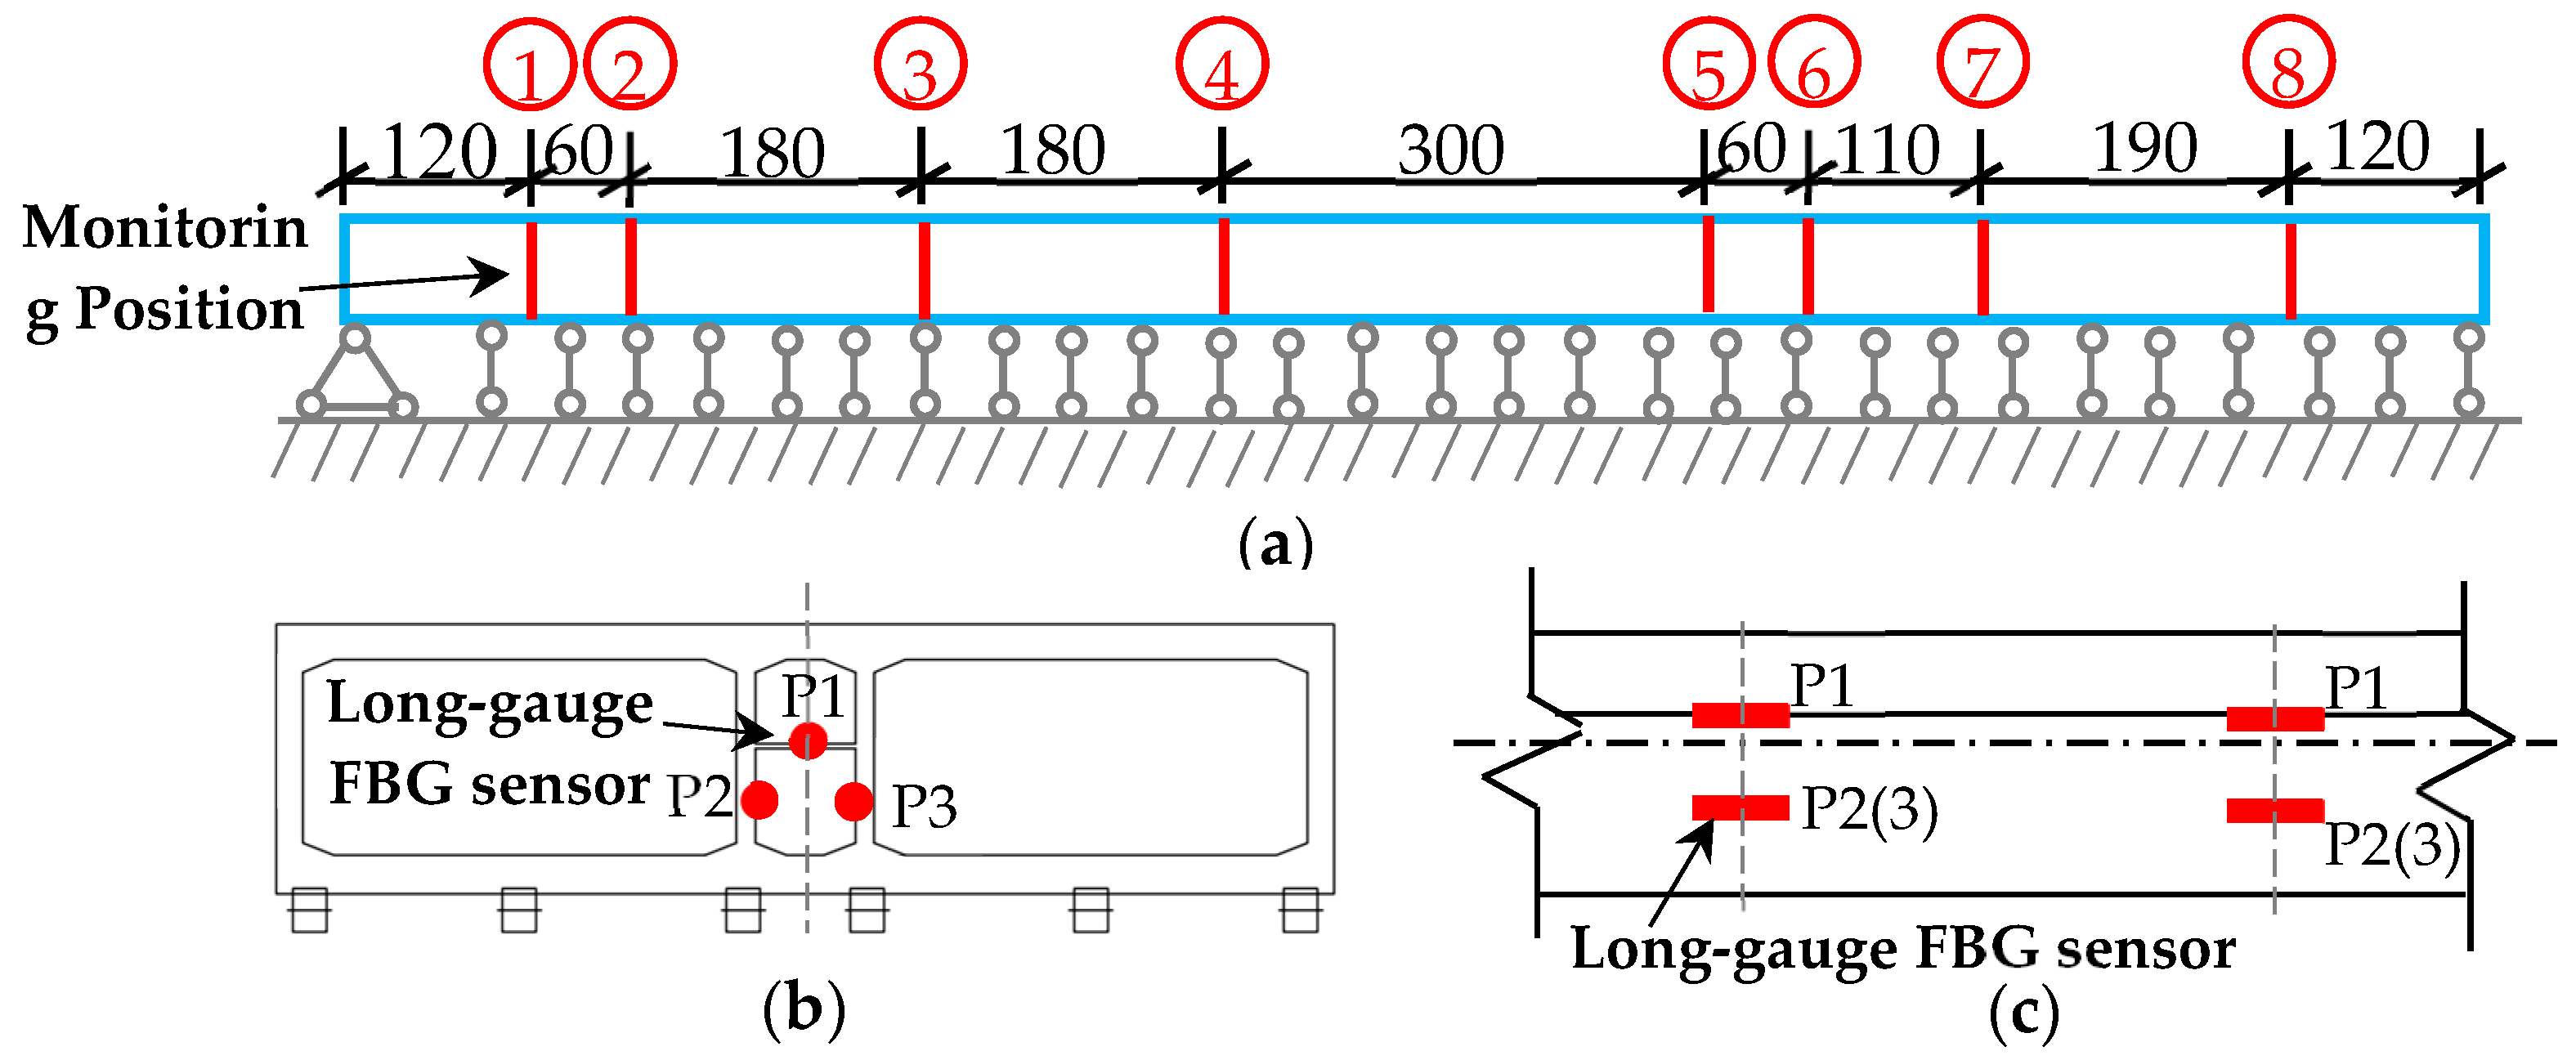
Figure 2. To monitor the three-direction deformation distribution of the tunnel, long-gauge FBG sensors are distributed throughout the structure in accordance with the on-site conditions, as shown in
Figure 8. Based on the engineering requirements and the principle of maximizing sensor distribution, a total of eight sections, denoted as M1 to M8, had been chosen for the tunnel monitoring, as shown in
Figure 8a. For each monitoring section, three long-gauge FBG sensors were arranged on the section to obtain the decoupled strain from the monitored coupling strain.
Figure 8b,c represent the lateral and side arrangement of the long-gauge FBG sensor, respectively. It is known from
Figure 8 that every monitoring section was measured at three distinct points, namely P1, P2 and P3. As the temperature throughout the tunnel remains relatively stable, a long-gauge FBG temperature compensating sensor had been installed beneath the corresponding position of P2 at monitoring sections M1, M4, M5 and M8. This compensates for any temperature variations and ensures the accuracy of the long-gauge FBG strain sensor.
During the operation of the tunnel, real-time strain and temperature compensation data were collected by the installed long-gauge FBG sensors. The monitoring process continued for a total of 26 days.
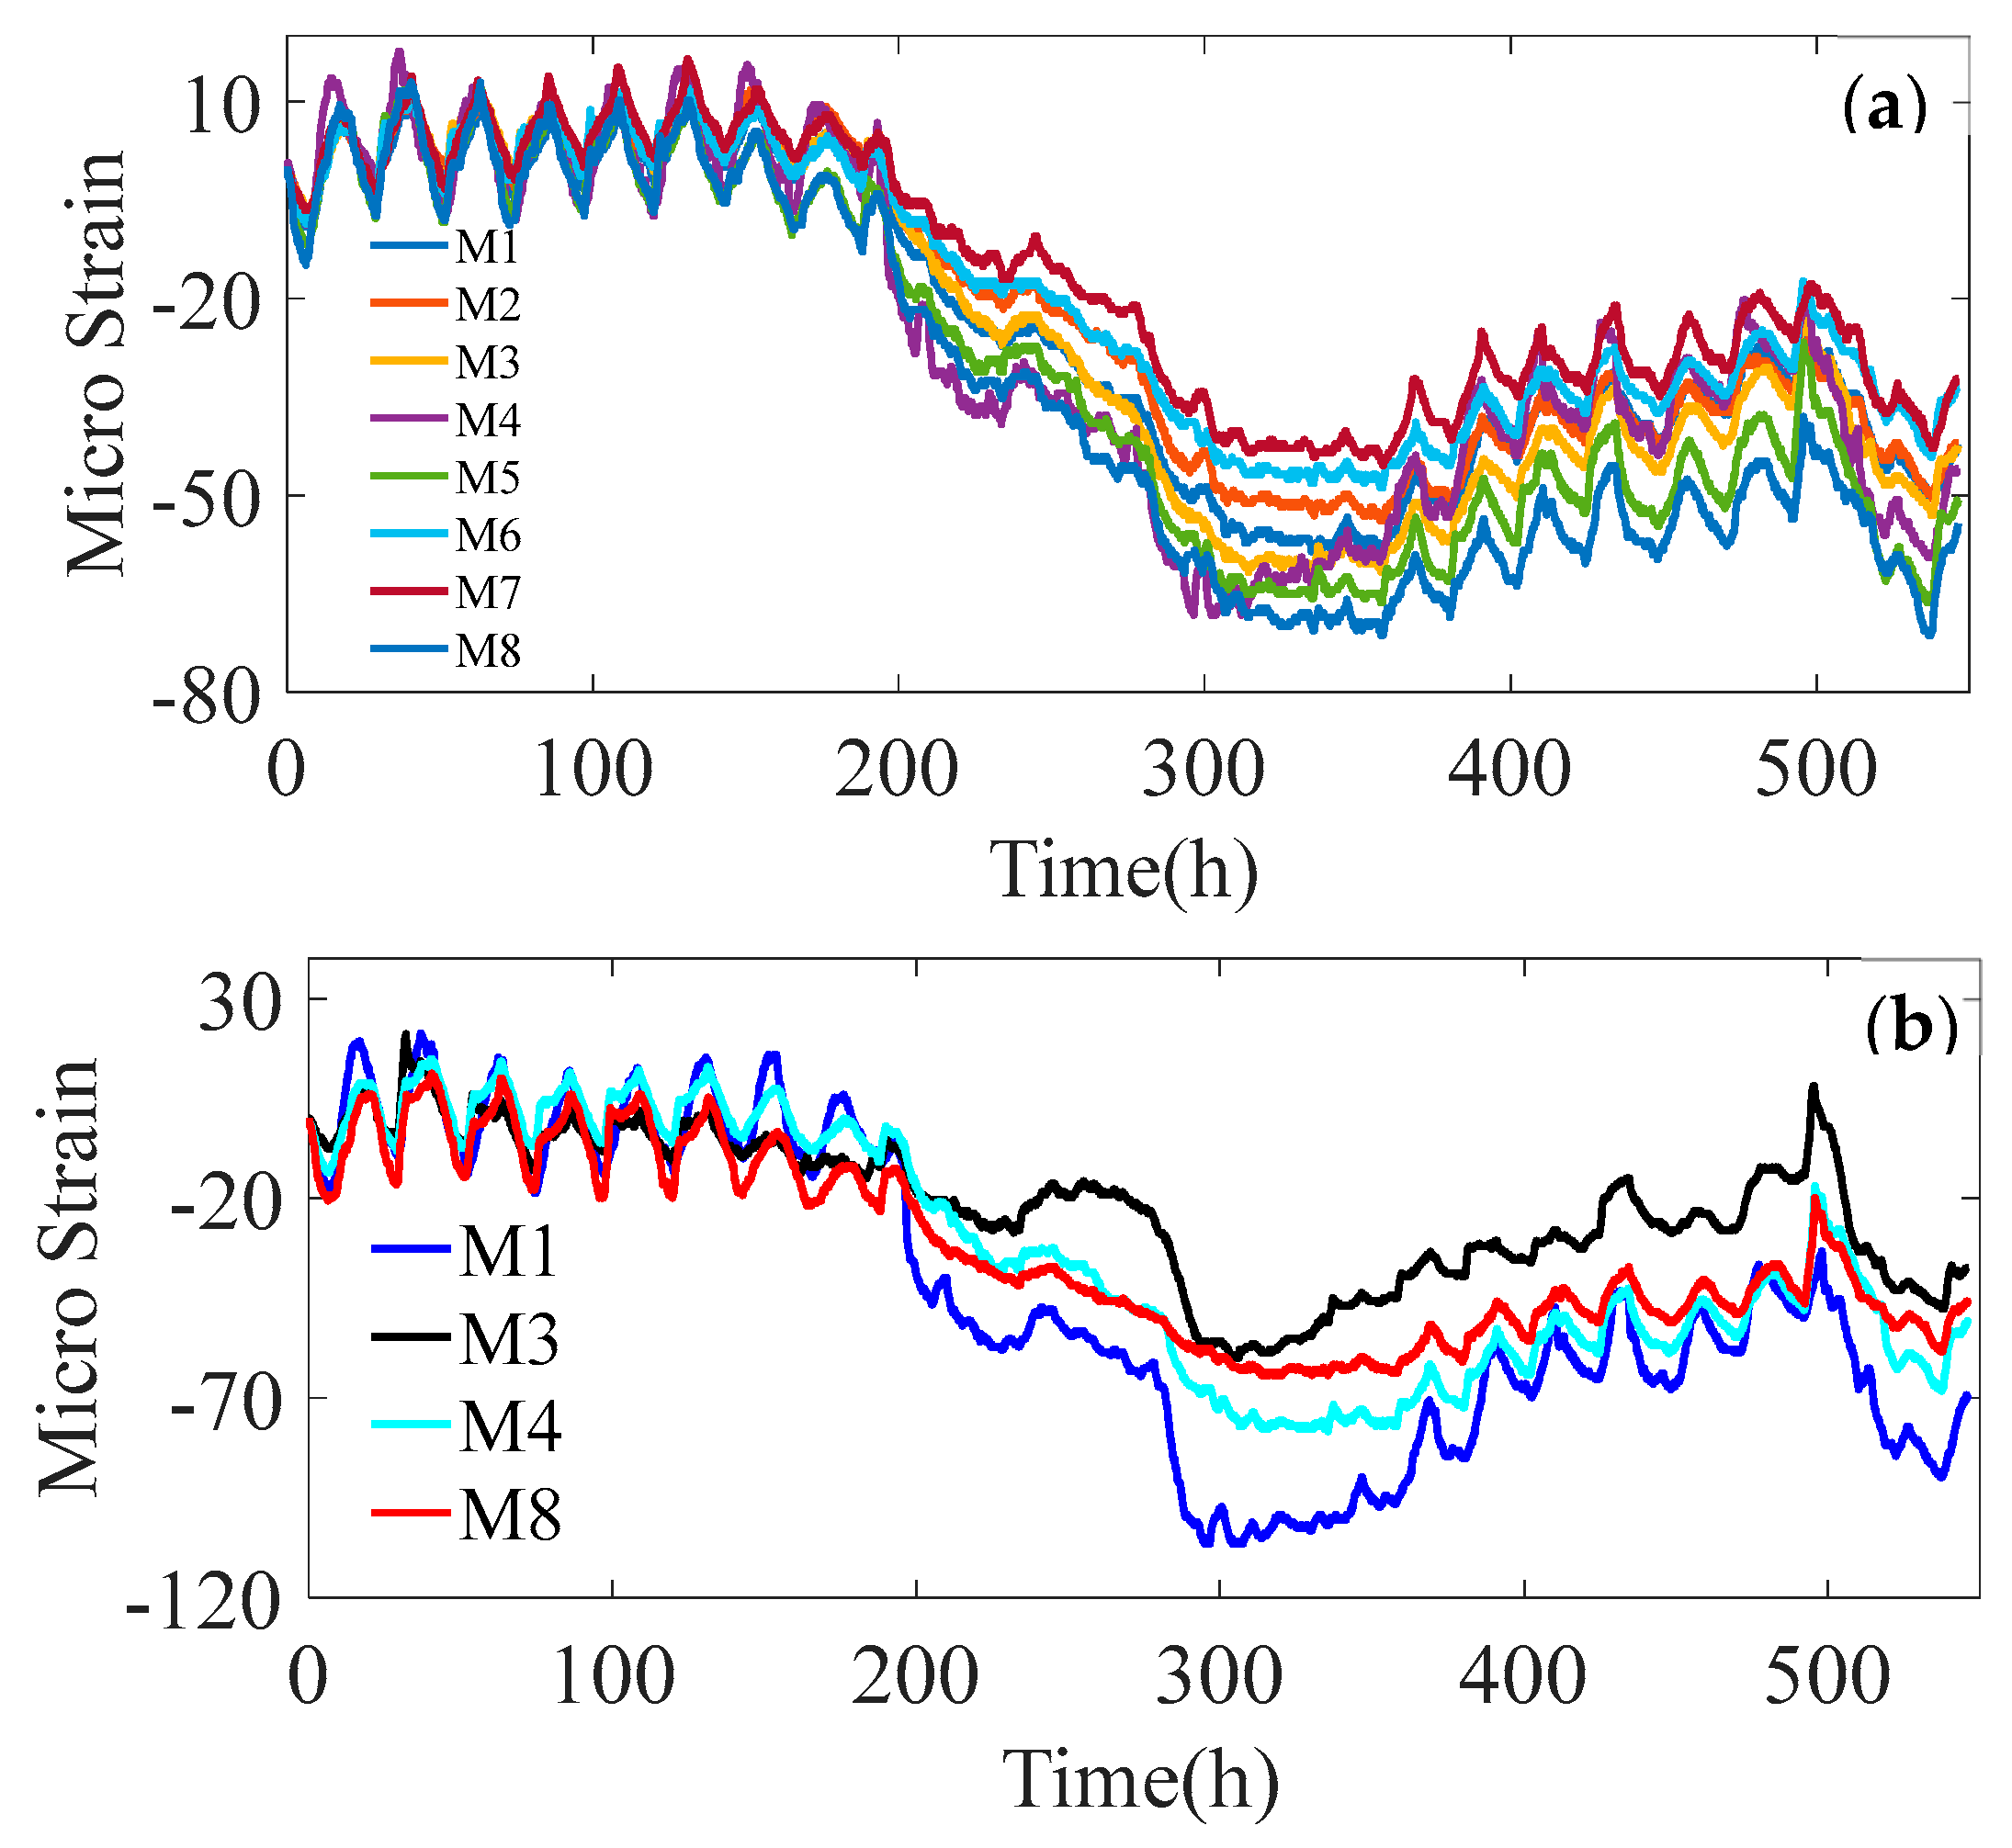
Figure 9a,b demonstrate the strain and temperature time history curves, respectively. Due to the minimal fluctuation in tunnel load, the sampling time interval was set to one hour.
Figure 9 shows the time histories of strain and temperature compensation collected at P2 on all monitored sections.
It can be observed from
Figure 9a that the structural response during the monitoring period is small, with the maximum absolute value of micro strain recorded not exceeding 80. For the temperature compensation data, the maximum absolute value of micro strain does not exceed 120, shown in
Figure 9b. Apparently, the strain response shows a variation trend that is largely consistent with the temperature compensation data. This suggests that temperature changes had a significant impact on the monitored strain data during the monitoring period. In order to accurately identify the three-direction deformation of the tunnel, it is imperative to eliminate the influence of temperature from the monitored data and obtain the true strain response of the structure.
4.2. Three-Direction Deformation Monitoring
After removing the influence of temperature, the strain response data was substituted into the proposed tunnel three-direction deformation algorithm to identify the vertical, transverse and axial deformation distributions of the tunnel in real time, as shown in
Figure 10. Taking point P2 on the tunnel section as the research object,
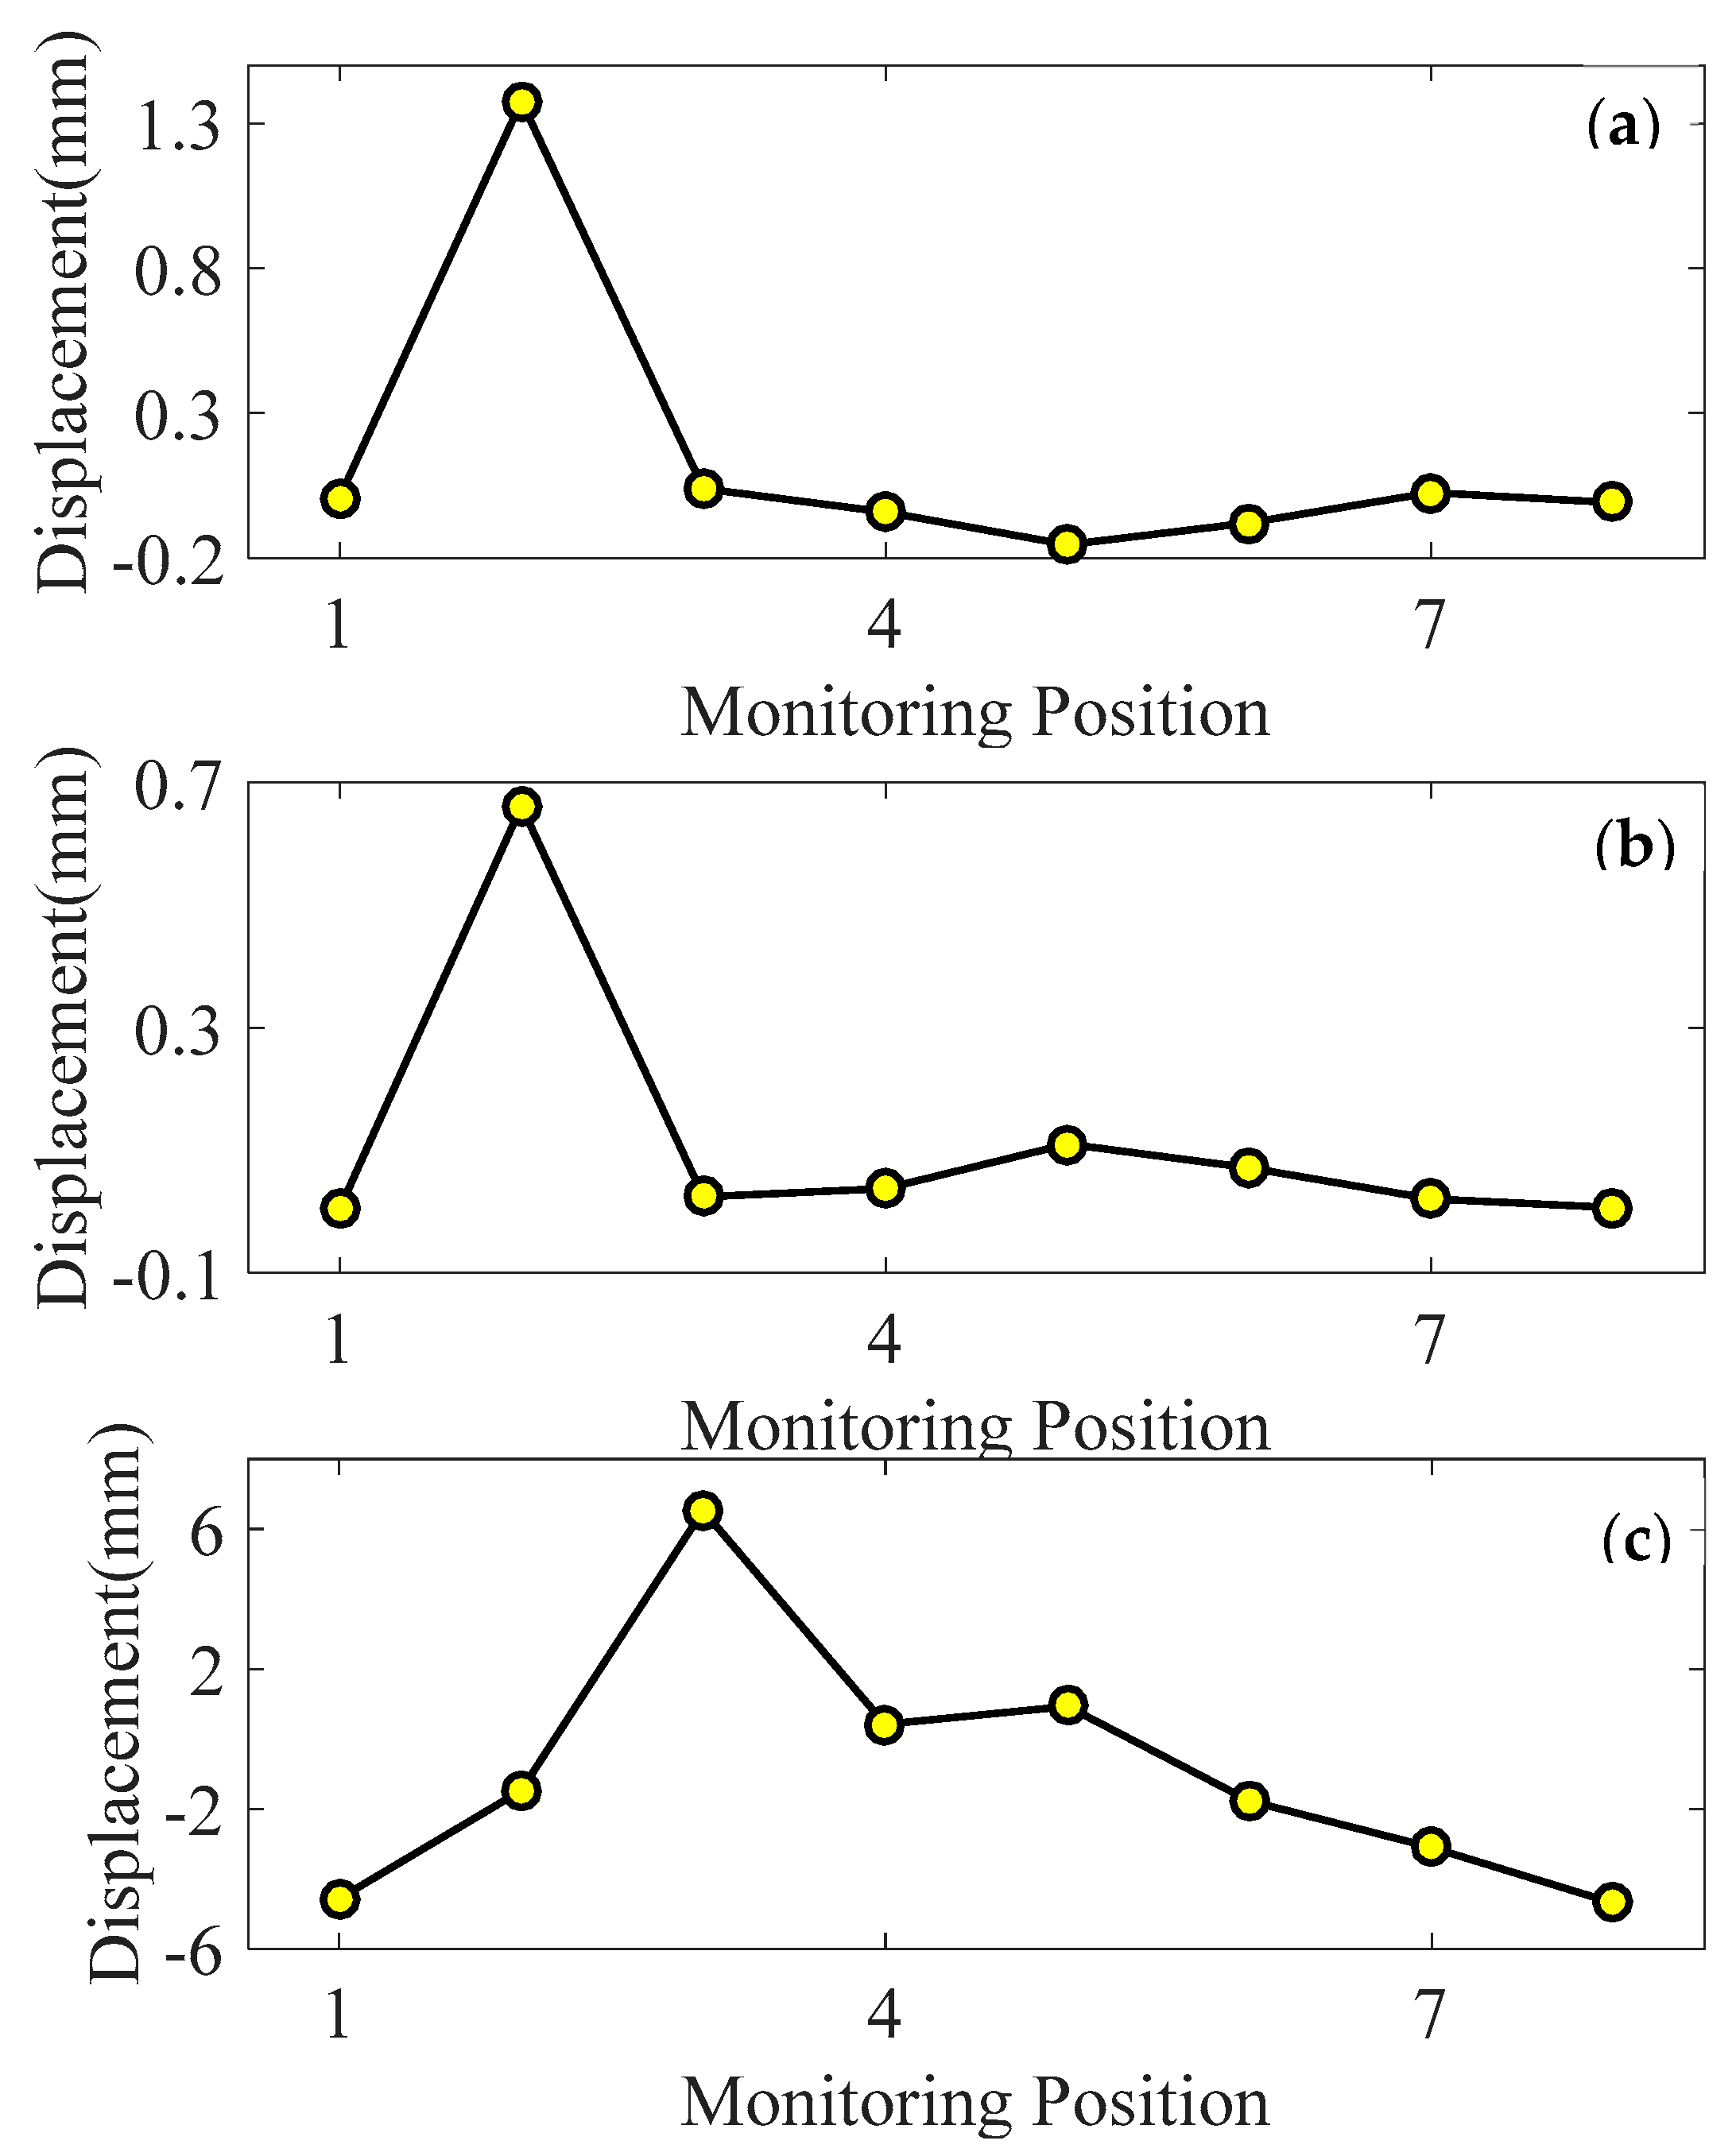
Figure 10 shows the vertical, transverse and axial deformation distribution of the tunnel at a certain time.
Figure 10a–c depict the vertical, transverse and axial deformation distributions of the tunnel identified by the proposed method, respectively. The data depicted in
Figure 10a,b clearly demonstrate that the monitoring section M2 experiences the maximum vertical and transverse displacement of the tunnel, namely 1.38mm and 0.66mm, respectively. In
Figure 10c, the maximum axial deformation is observed at the monitoring section M3, with a displacement of 6.53mm. The three-direction deformation distribution data of the tunnel indicate that the vertical and transverse displacement is considerably less than the axial displacement. This indicates that the tunnel primarily experiences axial deformation during the monitoring period. In addition, to gain insights into the displacement changes across different monitoring sections over time, the three-direction displacement time-history curves of multiple monitoring points are analyzed and illustrated in
Figure 11.
Figure 11 shows the displacement time-history curves of the monitoring sections M3, M4, M5 and M6. The identified vertical, transverse and axial displacement time-history curves of the tunnel are shown in
Figure 11a–c respectively. In
Figure 11a,b, the displacements of the four monitoring sections remains basically stable over time without significant changes. In
Figure 11c, the axial displacements of these four sections vary more than the vertical and transverse displacements. From the changing trend of axial displacement, it is evident that the first six days show a consistent pattern for all four points. However, on the seventh day, monitoring section M3 indicated axial elongation while other monitoring sections including M4, M5, and M6 showed axial compression. Subsequently, the axial displacement change of M3 showed an opposite trend compared to other monitoring sections. This pattern continued throughout the remaining time period. This indicates that the three-direction deformation of each monitoring point exhibits slight fluctuations over time, albeit within a small range, and primarily remains in a stable state.
5. Conclusions
In this paper, a monitoring and identification method of three-direction deformation distribution has been proposed to estimate the vertical, transverse and axial displacement of the tunnel. The effectiveness of the proposed method were validated through numerical simulations, and the proposed method were applied to the field deformation monitoring of a long tunnel. The main conclusions of this study are encapsulated as follows:
(1) The three-direction deformation identification method of tunnel is based on the complex mechanical characteristics of the cross section and the advanced long-gauge FBG sensing technology. A special sensor arrangement is employed to decouple the measured coupling strain responses.
(2) The reliability and applicability of the proposed method were verified by comparing the results of finite element simulations of practical engineering and the calculation results of the three-direction deformation identification method under various load conditions.
(3) The monitored three-direction deformation data of the tunnel provides evidence that the displacement amplitude of the tunnel is not large during the monitoring period, and it is basically in a stable state, and the axial deformation is the primary form of deformation in all directions.
Author Contributions
Conceptualization and methodology, Q.Z.; validation, R.L.; writing—original draft preparation, Q.Z. and H.Y.; writing—review and editing, H.Y. and H.Z. All authors have read and agreed to the published version of the manuscript.
Funding
This research was funded by the National Natural Science Foundation of China (No. 51908386).
Institutional Review Board Statement
Not applicable.
Informed Consent Statement
Informed consent was obtained from all subjects involved in the study.
Conflicts of Interest
The authors declare no conflict of interest.
References
- Wei, Z.; Jiang, Y. A simplified analysis method for the deformation response of an existing tunnel to ground surcharge based on the Pasternak model. Appl. Sci. 2021, 11, 3255. [Google Scholar]
- Zhou, J.; Xiao, H.; Jiang, W.; Bai, W.; Liu, G. Automatic subway tunnel displacement monitoring using robotic total station. Measurement. 2020, 151, 107251. [Google Scholar]
- Luo, Y.; Chen, J.; Xi, W.; Zhao, P.; Qiao, X.; Deng, X.; Liu, Q. Analysis of tunnel displacement accuracy with total station. Measurement. 2016, 83, 29–37. [Google Scholar]
- Luo, Y.; Chen, J.; Xi, W.; Zhao, P.; Li, J.; Qiao, X.; Liu, Q. Application of a total station with RDM to monitor tunnel displacement. J. Perform. Constr. Fac. 2017, 31, 04017030. [Google Scholar]
- Fukuda, Y.; Feng, M.Q.; Narita, Y.; Kaneko, S.I.; Tanaka, T. Vision-based displacement sensor for monitoring dynamic response using robust object search algorithm. IEEE Sens. J. 2013, 13, 4725–4732. [Google Scholar]
- Kohut, P.; Holak, K.; Uhl, T.; Ortyl, Ł.; Owerko, T.; Kuras, P.; Kocierz, R. Monitoring of a civil structure’s state based on noncontact measurements. Struct. Health. Monit. 2013, 12, 411–429. [Google Scholar]
- Ehrhart, M.; Lienhart, W. Image-based dynamic deformation monitoring of civil engineering structures from long ranges. In Image Processing: Machine Vision Applications VIII. 2015, February, 9405, 139-152. SPIE.
- Zhang, D.B.; Zhang, Y.; Cheng, T.; Meng, Y.; Fang, K.; Garg, A.; Garg, A. (2017). Measurement of displacement for open pit to underground mining transition using digital photogrammetry. Measurement. 2017, 109, 187–199. [Google Scholar]
- Berberan, A.; Machado, M.; Batista, S. Automatic multi total station monitoring of a tunnel. Surv. Rev. 2007, 39, 203–211. [Google Scholar]
- Nuttens, T.; Stal, C.; De Backer, H.; Schotte, K.; Van Bogaert, P.; De Wulf, A. Methodology for the ovalization monitoring of newly built circular train tunnels based on laser scanning: Liefkenshoek Rail Link (Belgium). Automat. Constr. 2014, 43, 1–9. [Google Scholar]
- Wang, W.; Zhao, W.; Huang, L.; Vimarlund, V.; Wang, Z. Applications of terrestrial laser scanning for tunnels: a review. J. Traffic Transp. Eng. 2014, 1, 325–337. [Google Scholar]
- Attard, L.; Debono, C.J.; Valentino, G.; Di Castro, M. Tunnel inspection using photogrammetric techniques and image processing: A review. ISPRS J. Photogramm. 2018, 144, 180–188. [Google Scholar]
- Alhaddad, M.; Dewhirst, M.; Soga, K.; Devriendt, M. A new photogrammetric system for high-precision monitoring of tunnel deformations. In Proceedings of the Institution of Civil Engineers-Transport. 2019, April, 2, 81-93. Thomas Telford Ltd. 172. [Google Scholar]
- Chmelina, K.; Jansa, J.; Hesina, G.; Traxler, C. A 3-d laser scanning system and scan data processing method for the monitoring of tunnel deformations. J. Appl. Geod. 2012, 6, 177–185. [Google Scholar]
- Xie, X.; Lu, X. Development of a 3D modeling algorithm for tunnel deformation monitoring based on terrestrial laser scanning. Undergr. Space. 2017, 2, 16–29. [Google Scholar]
- Mukupa, W.; Roberts, G. W.; Hancock, C.M.; Al-Manasir, K. A review of the use of terrestrial laser scanning application for change detection and deformation monitoring of structures. Surv. Rev. 2017, 49, 99–116. [Google Scholar]
- Arastounia, M. Automated as-built model generation of subway tunnels from mobile LiDAR data. Sensors-basel. 2016, 16, 1486. [Google Scholar]
- Yang, H.; Xu, X. Structure monitoring and deformation analysis of tunnel structure. Compos. Struct. 2021, 276, 114565. [Google Scholar]
- Qiu, Y.; Wang, Q.B.; Zhao, H.T.; Chen, J.A.; Wang, Y.Y. Review on composite structural health monitoring based on fiber Bragg grating sensing principle. Journal of Shanghai Jiaotong University (Science). 2013, 18, 129–139. [Google Scholar]
- Li, S.; Wu, Z. Development of distributed long-gage fiber optic sensing system for structural health monitoring. Struct. Health Monit. 2007, 6, 133–143. [Google Scholar]
- Zhang, J.; Hong, W.; Tang, Y.; Yang, C.; Wu, G.; Wu, Z. Structural health monitoring of a steel stringer bridge with area sensing. Struct. Infrastructur. E. 2014, 10, 1049–1058. [Google Scholar]
- Moffat, R.; Sotomayor, J.; Beltrán, J. F. Estimating tunnel wall displacements using a simple sensor based on a Brillouin optical time domain reflectometer apparatus. Int. J. Rock Mech. Min. 2015, 75, 233–243. [Google Scholar]
- Schenato, L.; Bossi, G.; Marcato, G.; Dwivedi, S.; Janse-Van Vuuren, D.; Ahlstedt, M.; Pasuto, A. Feasibility of crack monitoring in a road tunnel based on a low cost plastic optical fiber sensor. In 24th International Conference on Optical Fibre Sensors. 2015, September, 9634, 1088-1091, SPIE.
- Zhou, L.; Zhang, C.; Ni, Y.Q.; Wang, C.Y. Real-time condition assessment of railway tunnel deformation using an FBG-based monitoring system. Smart struct. Syst. 2018, 21, 537–548. [Google Scholar]
- Hou, G.Y.; Li, Z.X.; Hu, Z.Y.; Feng, D.X.; Zhou, H.; Cheng, C. Method for tunnel cross-section deformation monitoring based on distributed fiber optic sensing and neural network. Opt. Fiber Technol. 2021, 67, 102704. [Google Scholar] [CrossRef]
- Hou, G.Y.; Li, Z.X.; Wang, K.D.; Hu, J.X. Structural Deformation Sensing Based on Distributed Optical Fiber Monitoring Technology and Neural Network. KSCE J. Civ. Eng. 2021, 25, 4304–4313. [Google Scholar] [CrossRef]
- Zhang, Q.; Zhang, J. Internal force monitoring and estimation of a long-span ring beam using long-gauge strain sensing. Comput.-Aided Civ. Inf. 2021, 36, 109–122. [Google Scholar] [CrossRef]
|
Disclaimer/Publisher’s Note: The statements, opinions and data contained in all publications are solely those of the individual author(s) and contributor(s) and not of MDPI and/or the editor(s). MDPI and/or the editor(s) disclaim responsibility for any injury to people or property resulting from any ideas, methods, instructions or products referred to in the content. |
© 2023 by the authors. Licensee MDPI, Basel, Switzerland. This article is an open access article distributed under the terms and conditions of the Creative Commons Attribution (CC BY) license (https://creativecommons.org/licenses/by/4.0/).
