In order to ensure the uniformity of the sample, PCBs from computers, also known as motherboards, were used in this study. However, the boards may vary in terms of their basic composition, even if they are obtained from the same type of electronic equipment.
Thus, the Stemi 2000 - C Stereo Microscope was used to identify and characterize the boards by image, according to their internal structure. The analysis based on the cross section performed on the printed circuit board allowed the visualization of four copper layers inside, which are interspersed with layers of fiberglass. In the outermost regions it is possible to identify the presence of an overlay layer composed of epoxy resin. In view of the internal structure shown and the materials that compose it, it is possible to infer that the analyzed plate corresponds to the FR - 4 model, which is indicated by the literature as the type of plate used mainly in the manufacture of computers and electronics.
3.1. Physical and Mechanical Processing: Copper Concentration
After dismantling and cutting the guillotine, the sample was subjected to the comminution process, using two different models of shredders. In the first stage of the comminution process, the material was ground using an EWZ M400/I-200 hammer mill with an 8 mm diameter sieve. The process was carried out in duplicate to ensure greater homogeneity regarding the grain size of the batch. In quantitative terms, the comminution process started with the entry of approximately 4.5 kg of dismantled and guillotined material.
In sequence, the material already crushed by the hammer shredder, was submitted to the knife shredder, model RETSCH SM 200 with a 4 mm diameter sieve, which allowed the reduction of the sample grain size. The process also occurred in duplicate. The grinding in this type of mill is carried out, mainly, when the purpose is to release the materials, as in the case of copper present inside the PCBs. It is noteworthy that prior to the occurrence of fragmentation processes, the equipment used was subjected to hygiene procedures so that there was no contamination of the sample obtained.
During the crushing process it was possible to record an estimated loss of about 0.192 kg of material. Thus, in general terms, it was found that the overall losses during the comminution process correspond to about 4.3% of the total sample entering the process. These losses are associated with materials retained close to the internal structure of the equipment and materials that are easily crushed and end up dissipating in the form of dust during the process.
After the comminution process, the material was classified according to seven particle sizes, respectively, +1 mm; -1mm +0.71mm; -0.71mm +0.45mm; -0.45mm +0.25mm; -0.25mm +0.15mm; -0.15mm +0.05mm; and -0.05mm. The granulometric separation took place with the aid of the vibrating separator (RETSCH AS 200) and the corresponding sieves.
According to
Table 3, the distribution, in percentage of mass of the general sample, had its highest concentration in the particle size fraction +1mm, representing about 64% of the total sample mass. The remaining 36% are distributed in the other fractions, not exceeding the representativeness of 10% of the total mass of the general sample in each fraction.
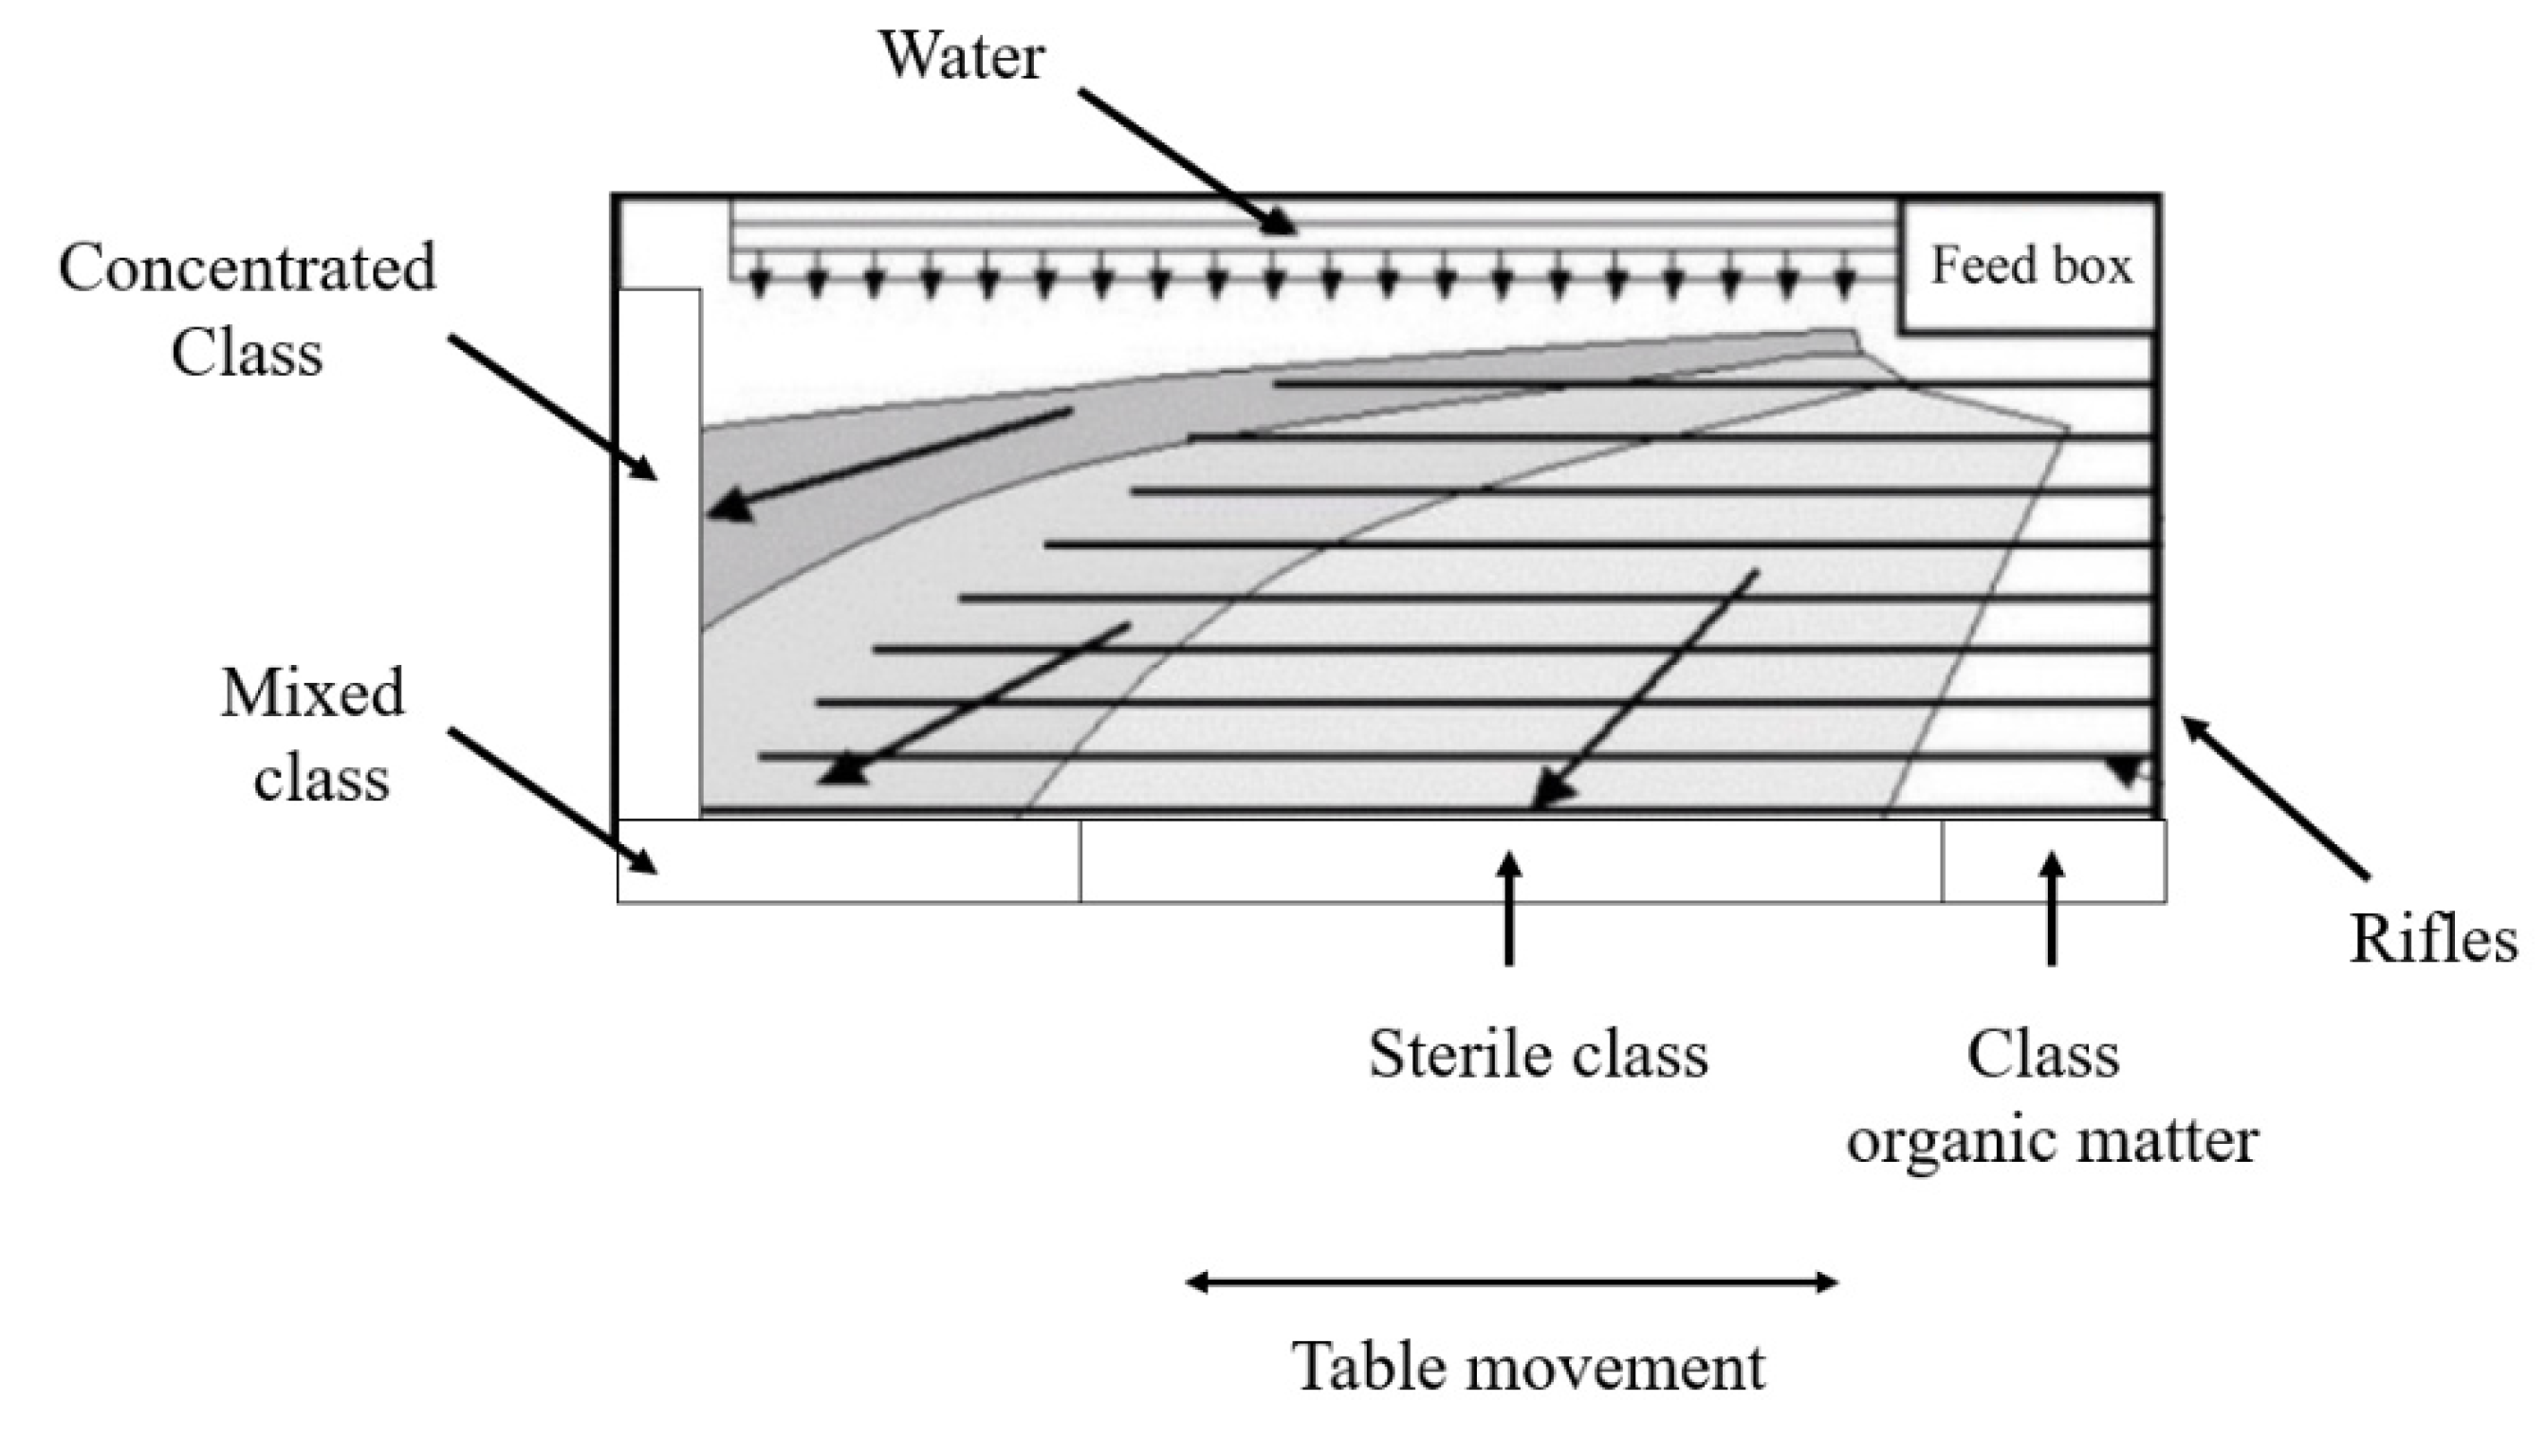
The shaker table (
Figure 2) is characterized by an inclined surface, which has small projections (rifles) positioned in parallel along its length. There is an asymmetrical movement in the longitudinal direction and a film of water that crosses the table surface transversely.
The dense liquid technique is used to separate solid particles through the difference in density. The particles that need to be separated are immersed in a liquid that has a density value between the density values of the components that are to be separated. The heavier particles go to the bottom while the lighter particles float on the surface. The process proves to be quite efficient, as it makes it possible to separate metals from polymers and ceramics.
However, to ensure greater efficiency in the density separation process, it was noticed through a pilot test that the samples of low granulometry, which had little representation in relation to the total mass of the overall sample, did not respond efficiently to the process. Thus, it was decided to group the general material into only three particle size fractions.
Thus, after separation by secondary particle size fraction, where the +1mm, -1mm +0.45mm and -0.45mm class intervals were adopted, the sample was subjected to density separation, using an shaker table, with a flow rate of 0.000009508 m3/s. Water was used as a liquid medium to carry out the density separation activity. Four product classes are obtained from this step, being named: Concentrated (C), Mixed (M), Sterile (S) and Organic Matter (OM).
The Concentrated class stands out for presenting greater potential for enriching metals through the process of separation by densities, since higher density materials, when compared to the density of the medium, follow the oscillatory movement of the table along the rifles, leading to mostly in the same compartment.
The Mixed class has some relevance regarding the presence of metals. However, it is also characterized by having polymeric and ceramic materials, which makes this class less favorable to the enrichment of metals, when compared to the Concentrated class.
The Sterile and Organic Matter classes are characterized by the intense accumulation of ceramic and polymeric materials, that is, low metal enrichment potential. In this case, the materials had a density lower than the density of water, suffering immediate fluctuation during the process.
Together, the Concentrated and Mixed Material classes corresponded to 60% of the total mass of the sample submitted to the density separation process.
Table 4 shows the mass distribution (%) of the classes obtained in the density separation.
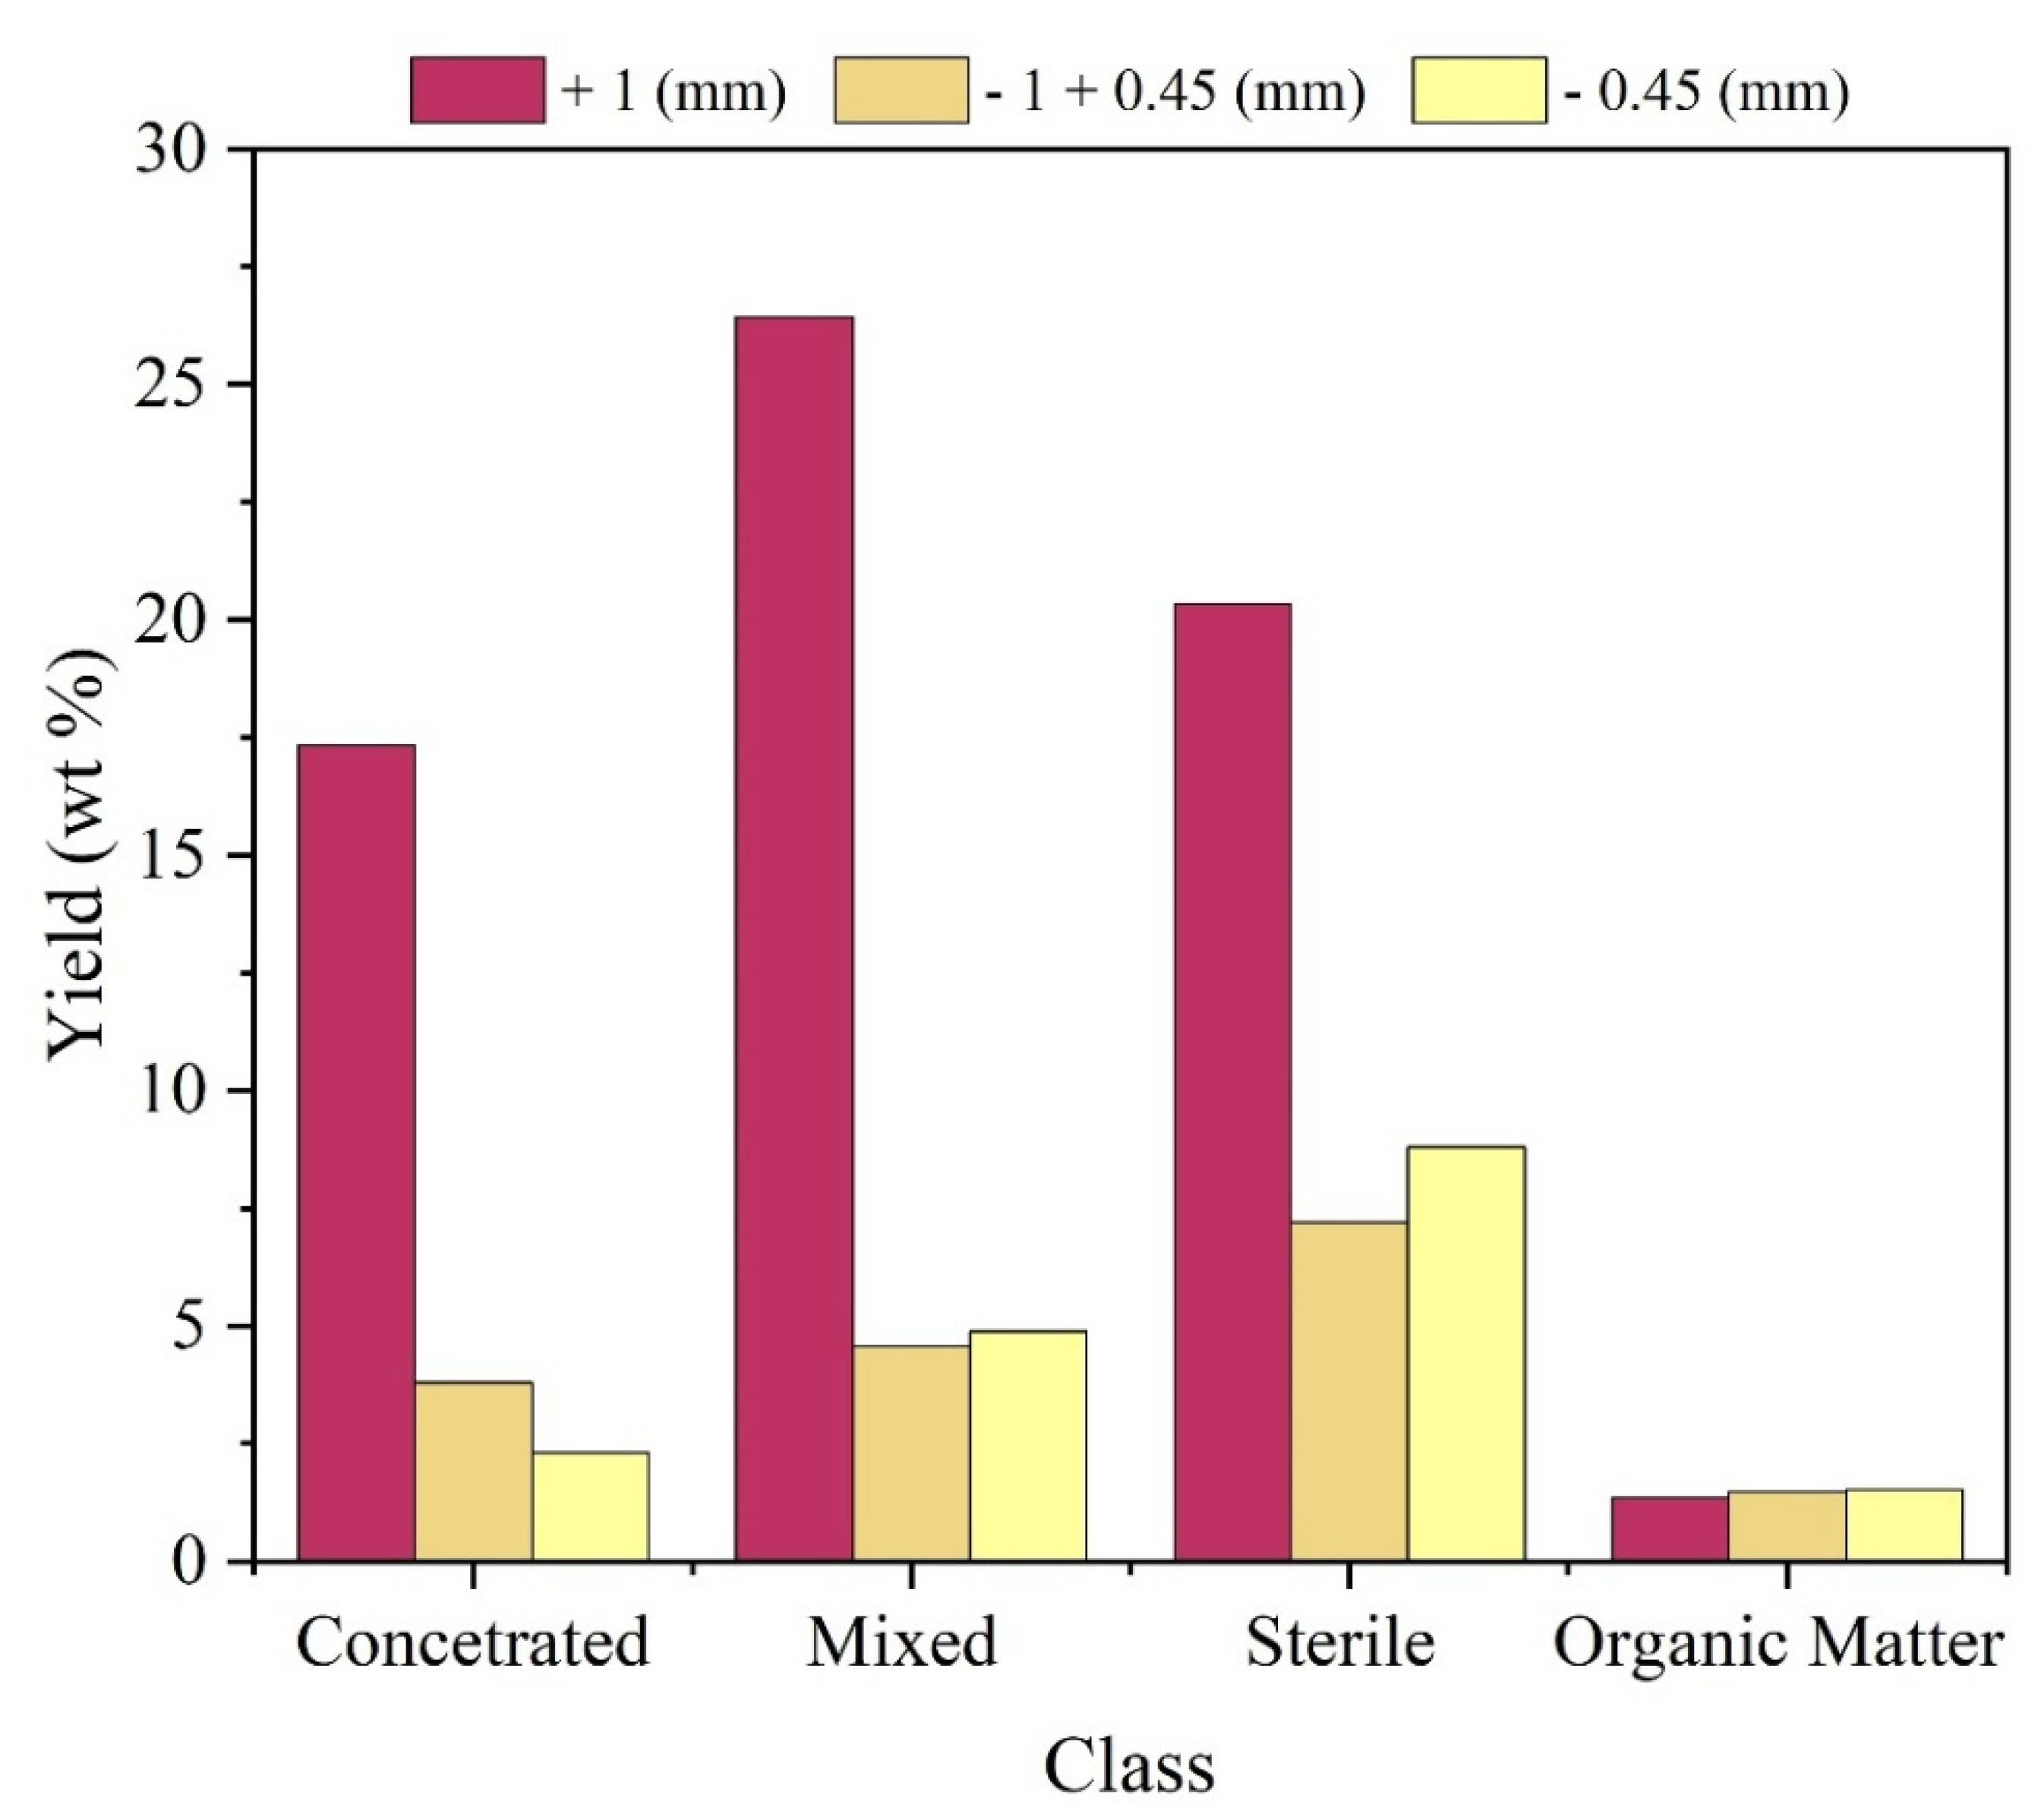
After separation by density, the general sample was segmented according to particle size fraction and class.
Figure 3 shows the mass distribution of the overall sample, in percentage. The participation of +1mm particle size in the composition of three of the four observed classes is highlighted. In addition, taking into account the Concentrated and Mixed classes with +1mm particle size, which have greater potential for metallic enrichment, it is clear that together they correspond to about 44% by mass of the overall sample.
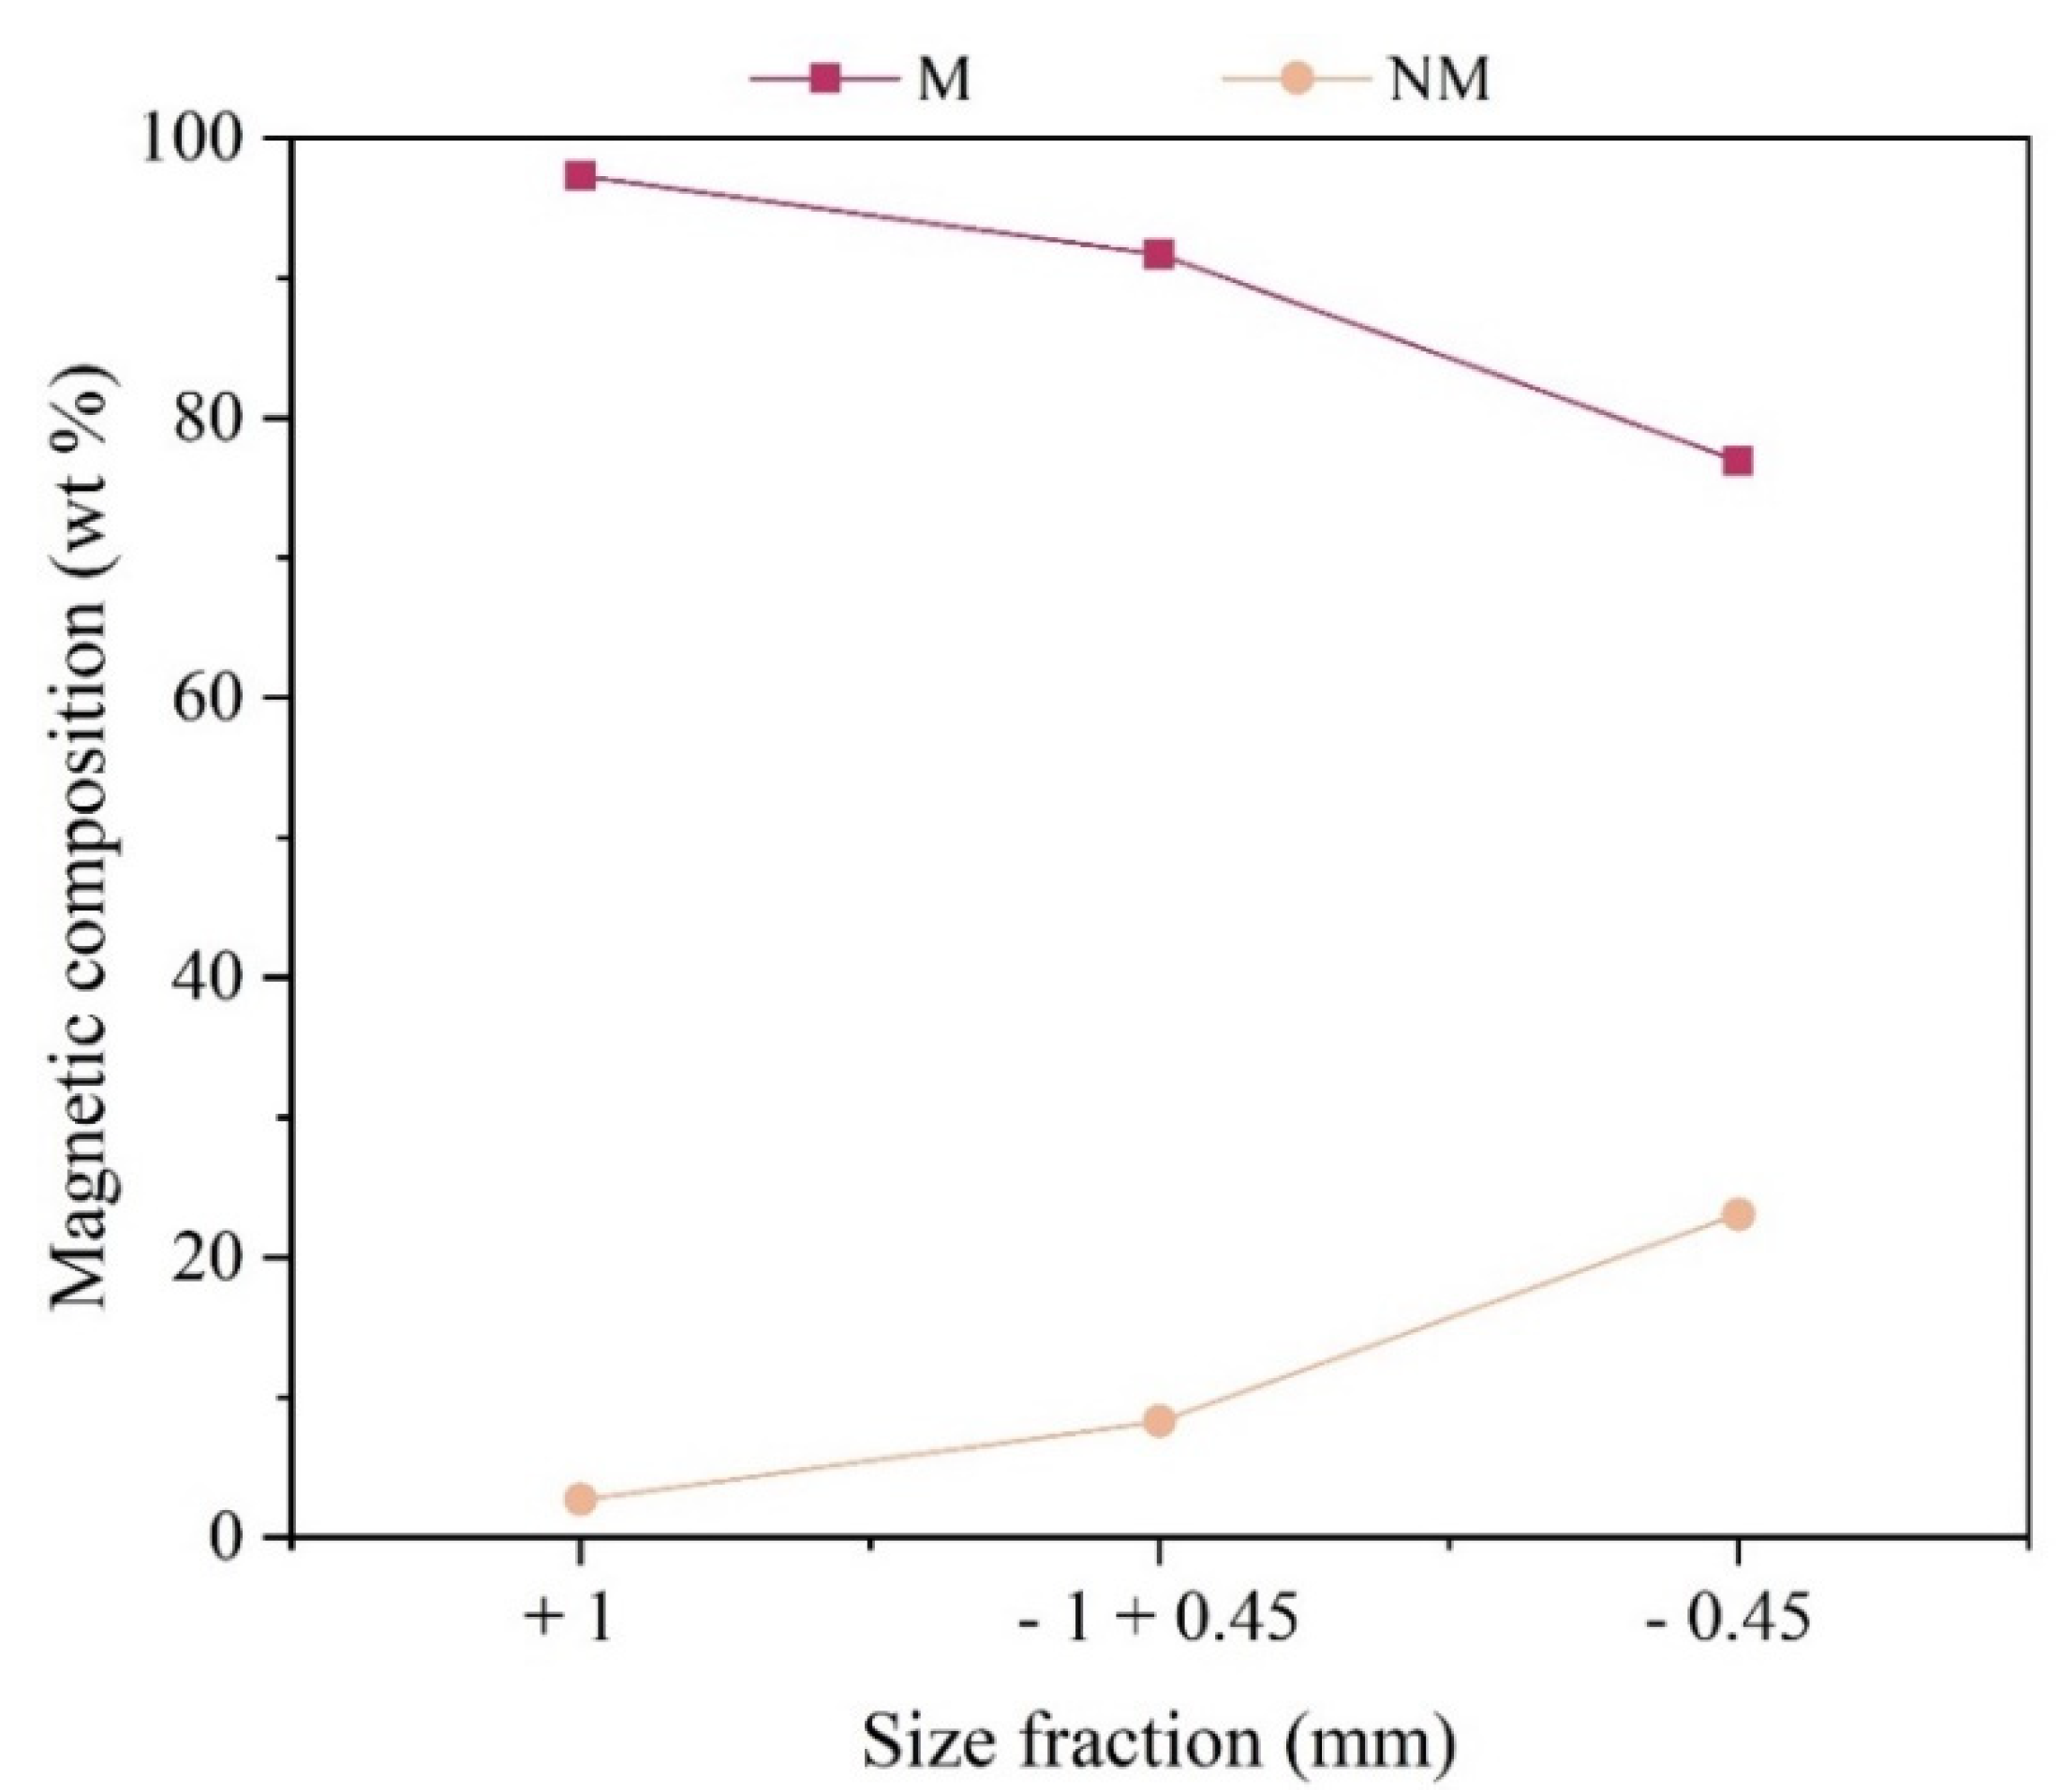
Subsequently, magnetic separation was performed, through which two groups of materials were identified: Non-Magnetic Materials (NM) and Magnetic Materials (M). About 7% of the sample corresponded to materials with magnetic characteristics (M), whereas NM materials presented values around 93% of the mass of the general sample.
Based on the information shown in
Figure 4, it was observed that the greatest presence of magnetic materials (M) was recorded in the particle size fraction – 0.45 mm, reaching the value of 23% of the total (wt) of this particle size range. The size fraction +1mm is mainly composed of non-magnetic material (NM), about 97% of the total of this sample (wt).
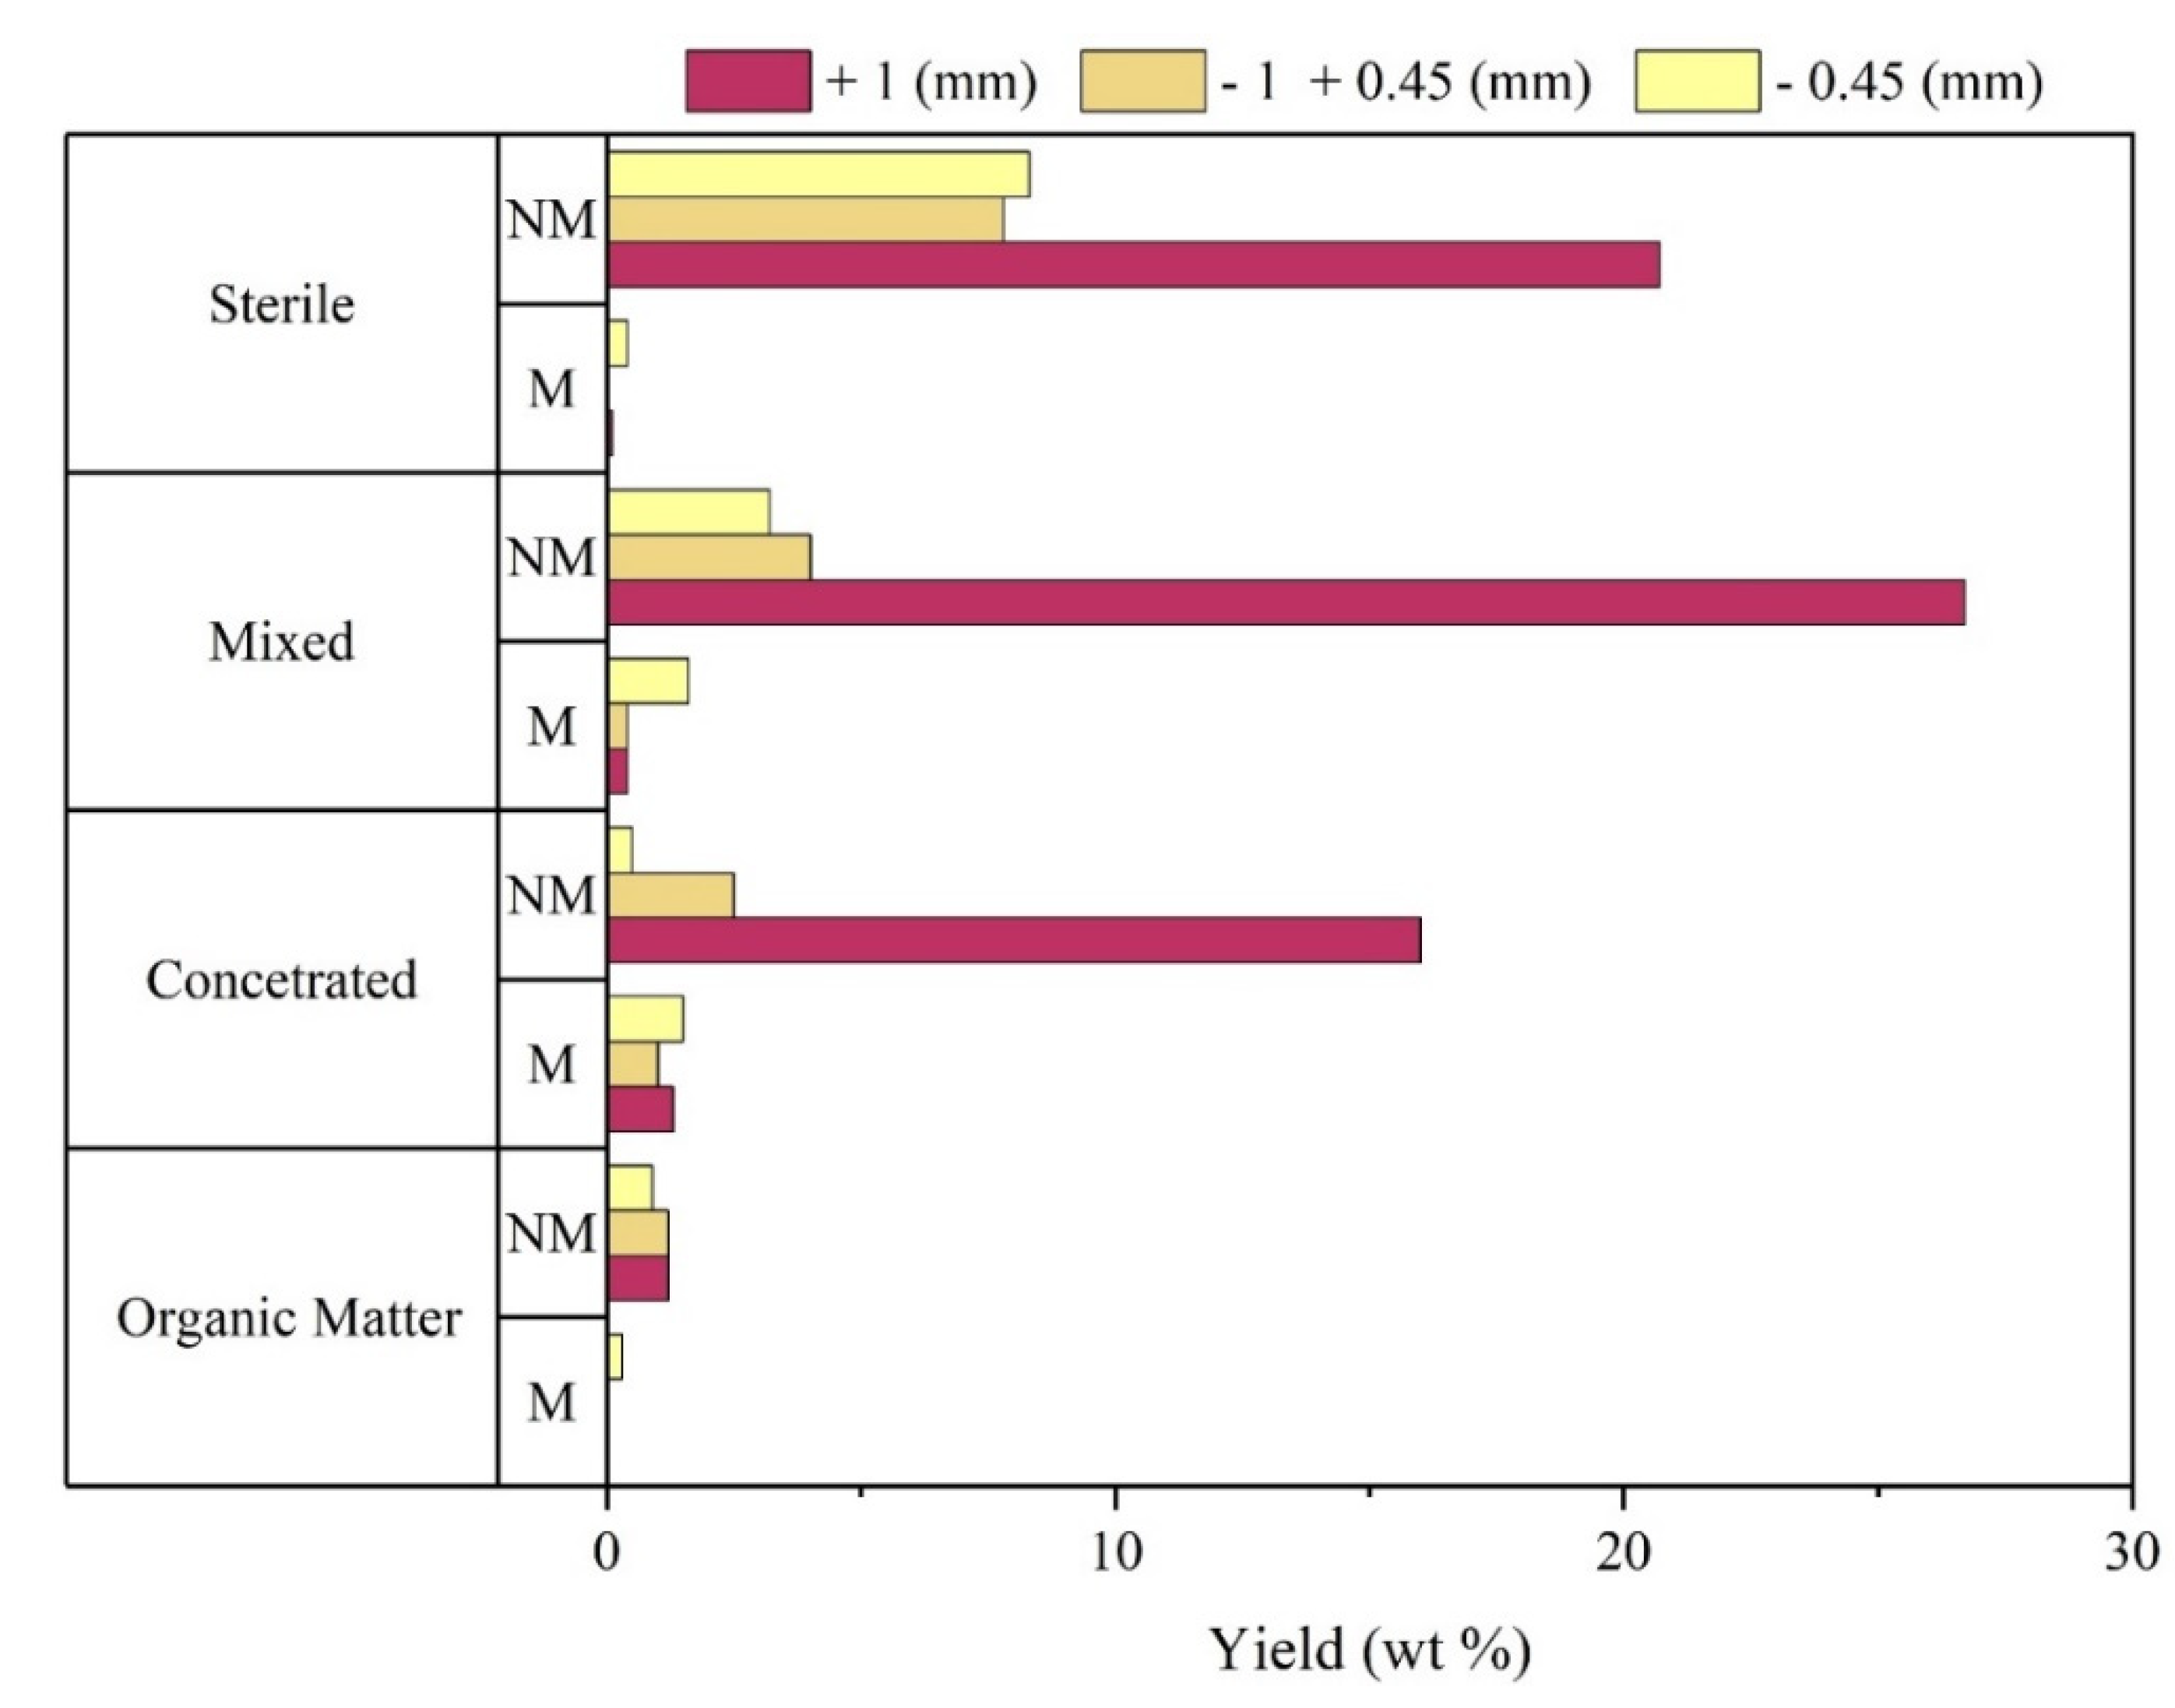
Taking into account the classes obtained after separation by density, it was found that in the Concentrated, Mixed and Sterile fraction, the NM materials of particle size +1mm predominated their composition, representing about 16%, 27% and 21% respectively, in relation to the mass of the overall sample (
Figure 5).
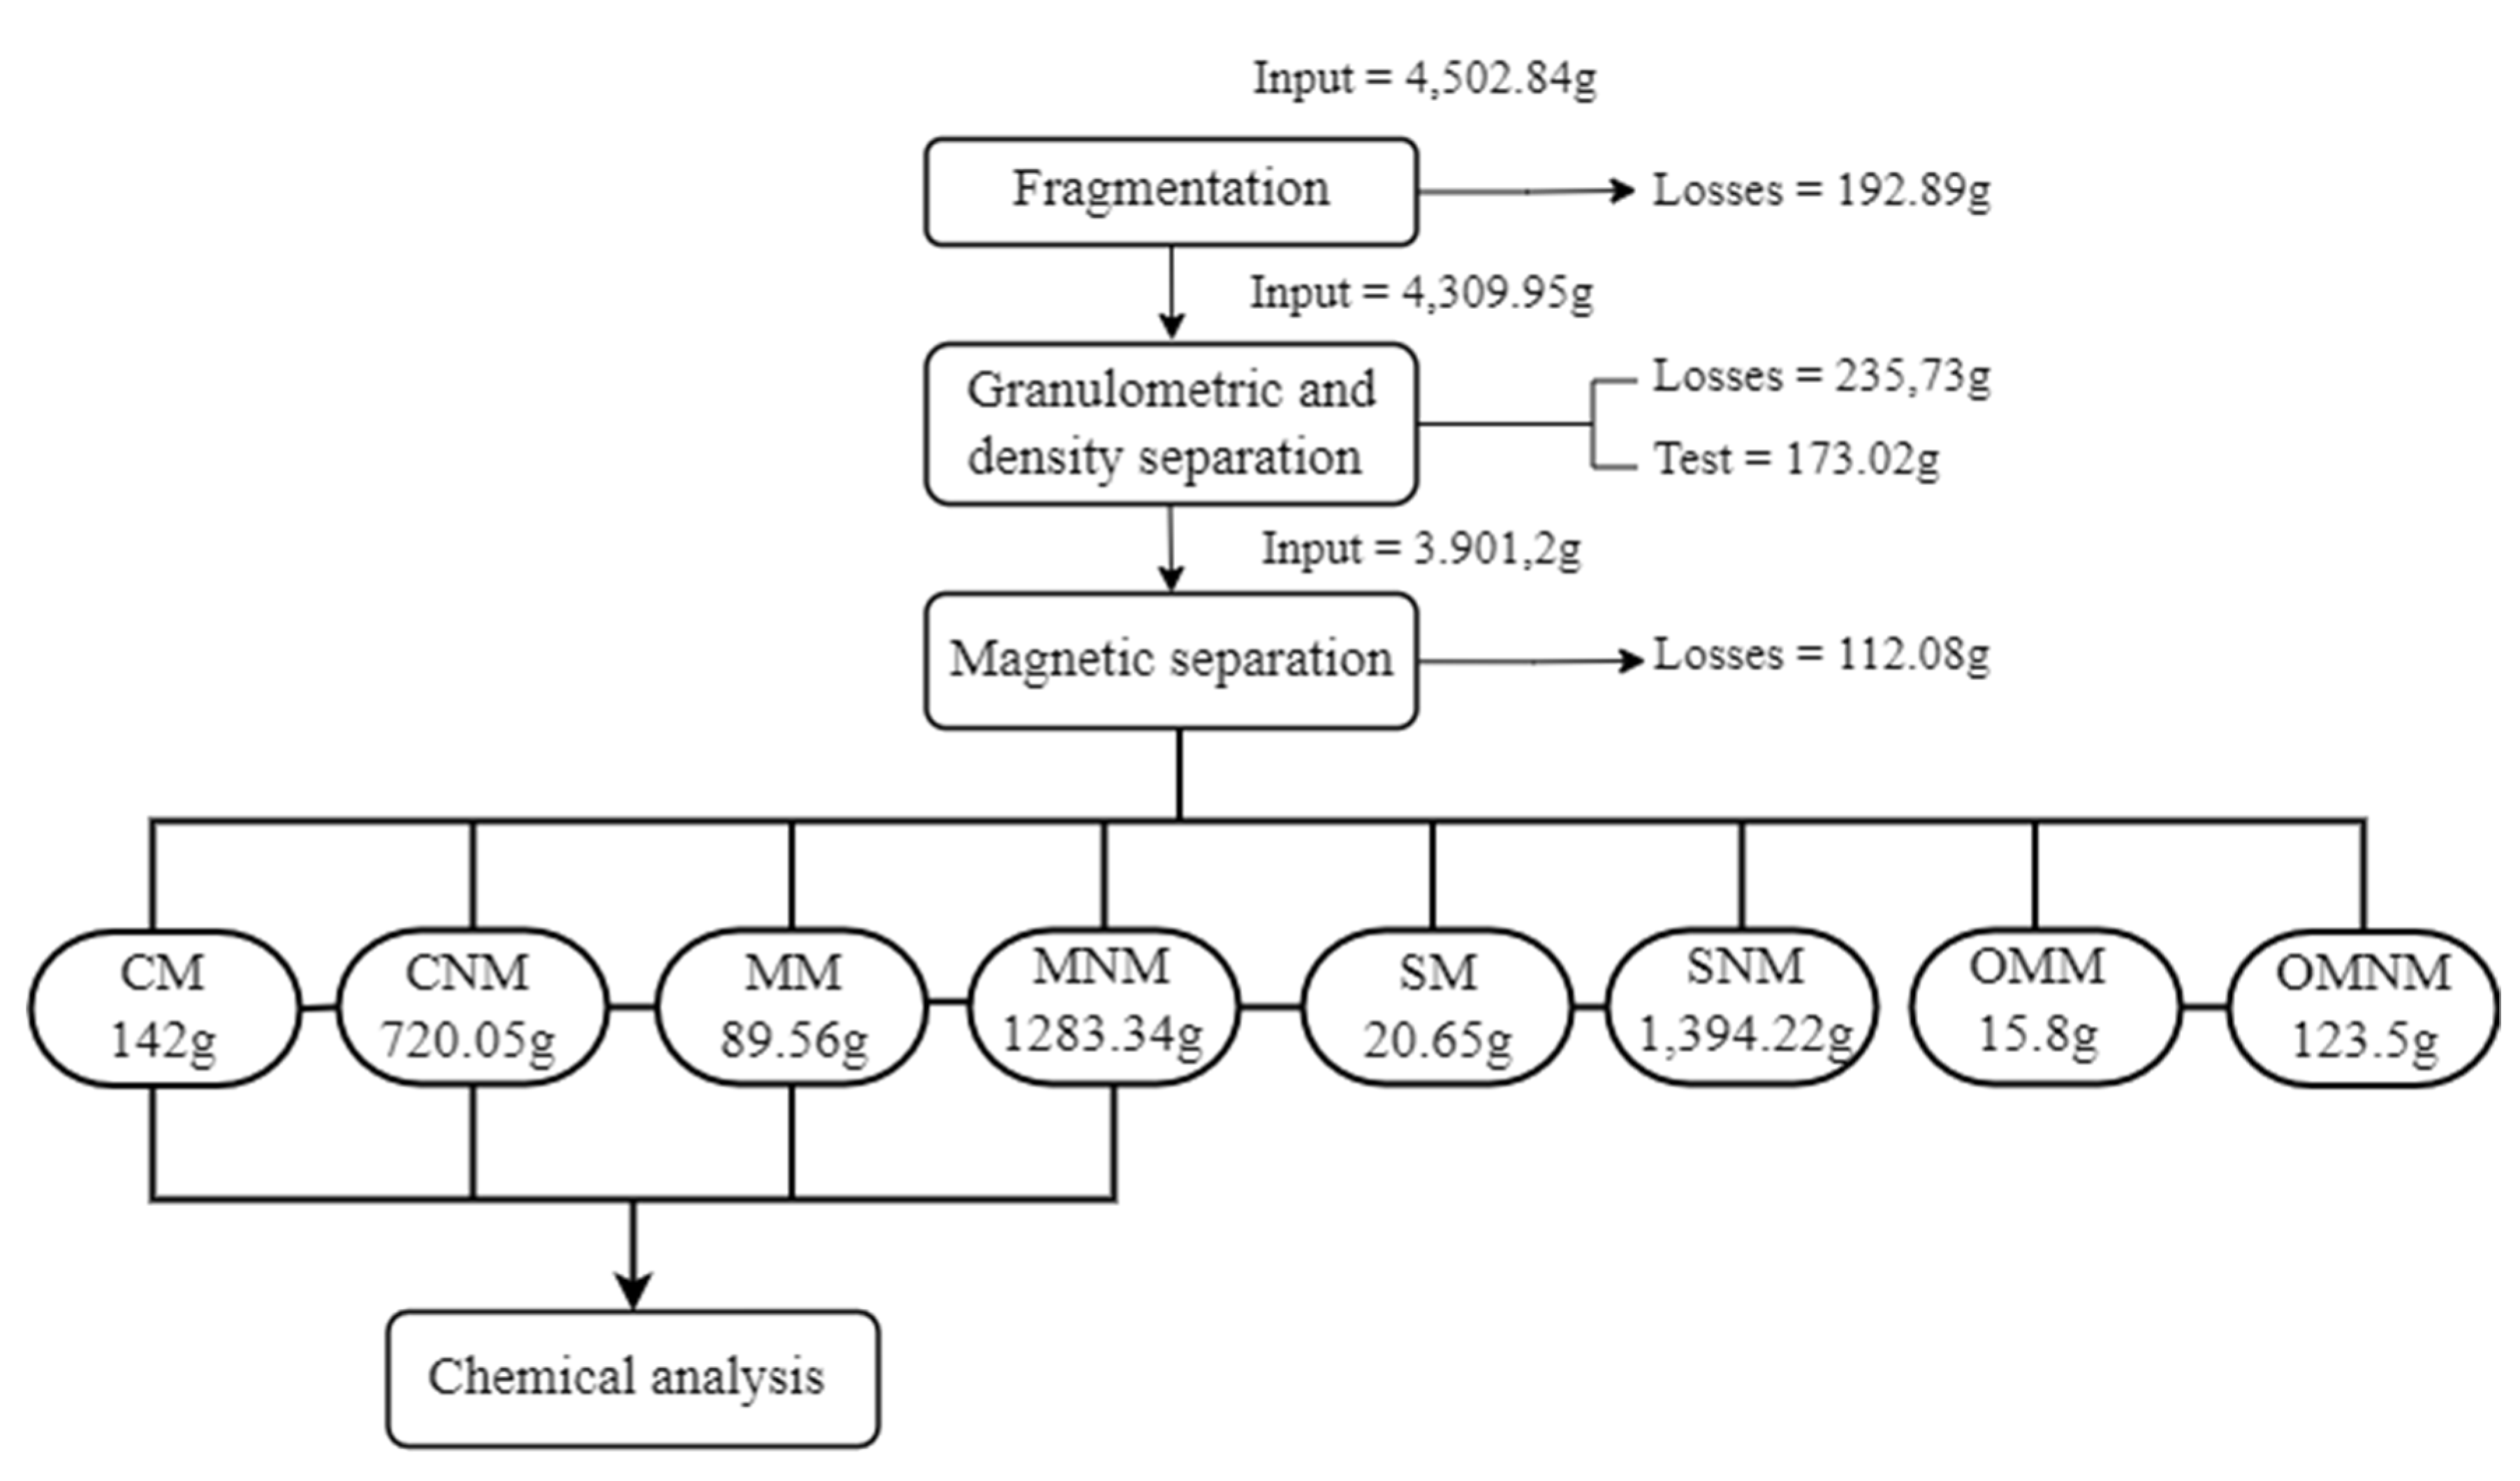
However, the Sterile and Organic Matter classes are characterized by low metal accumulation potential, according to the dynamics of the shaker table. Thus, the Concentrated and Mixed classes stand out due to the potential for accumulation of metals, including copper (Cu), and these two classes are the central target of this study. The
Figure 6 and
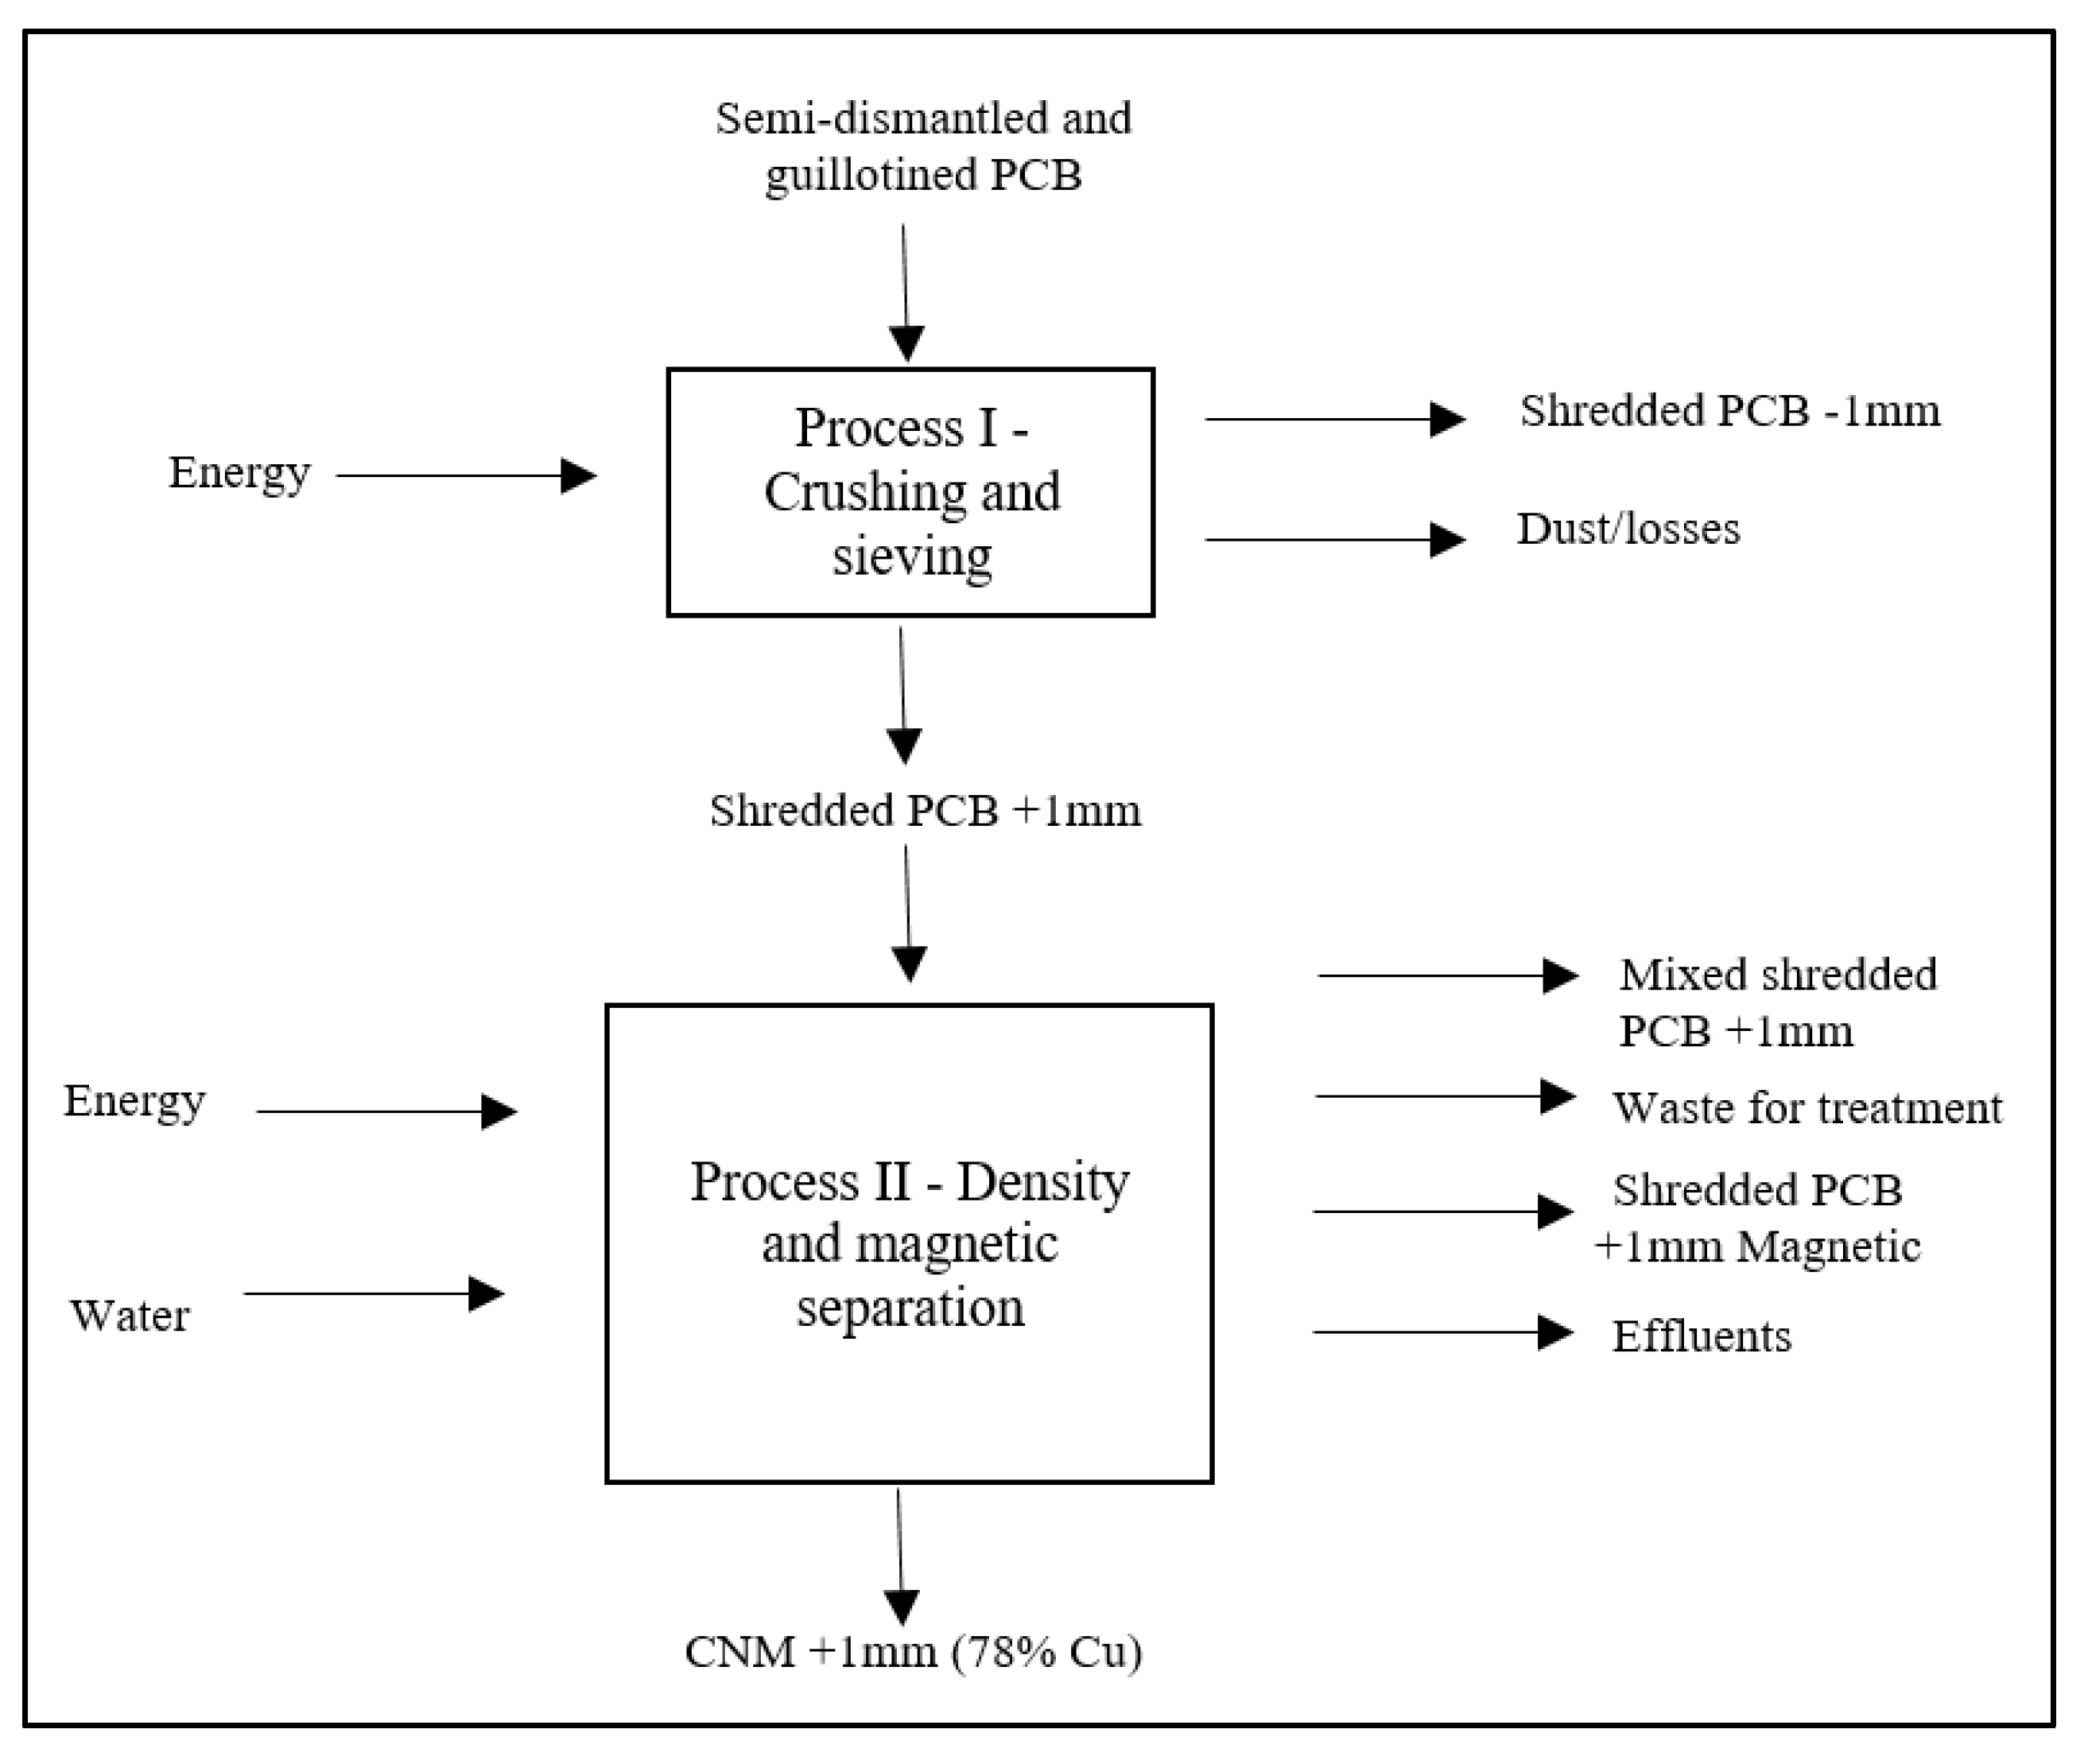
Table 5 systematizes the entire operational flow of the pre-treatment phase, showing the inventory of each operation.
The Concentrated and Mixed classes became the target of the study due to the significant presence of metals in their compositions. By selecting the Concentrated and Mixed classes, twelve different products were obtained, varying according to the particle size and the presence of magnetic property or not, as shown in
Table 6, where the total mass of the sample corresponded to 2,234.95 grams (sum of the masses of all products in the Concentrated and Mixed classes).
The samples selected for visual analysis and chemical composition were defined from the quartering process. As it is a material with great heterogeneity and with different particle sizes, the need to ensure the greatest possible uniformity in the samples to be submitted for analysis is highlighted. Manual quartering consisted of reducing the mass of the samples by dividing the global sample into aliquots with lower mass, in order to obtain the final sample according to the purpose of the assay.
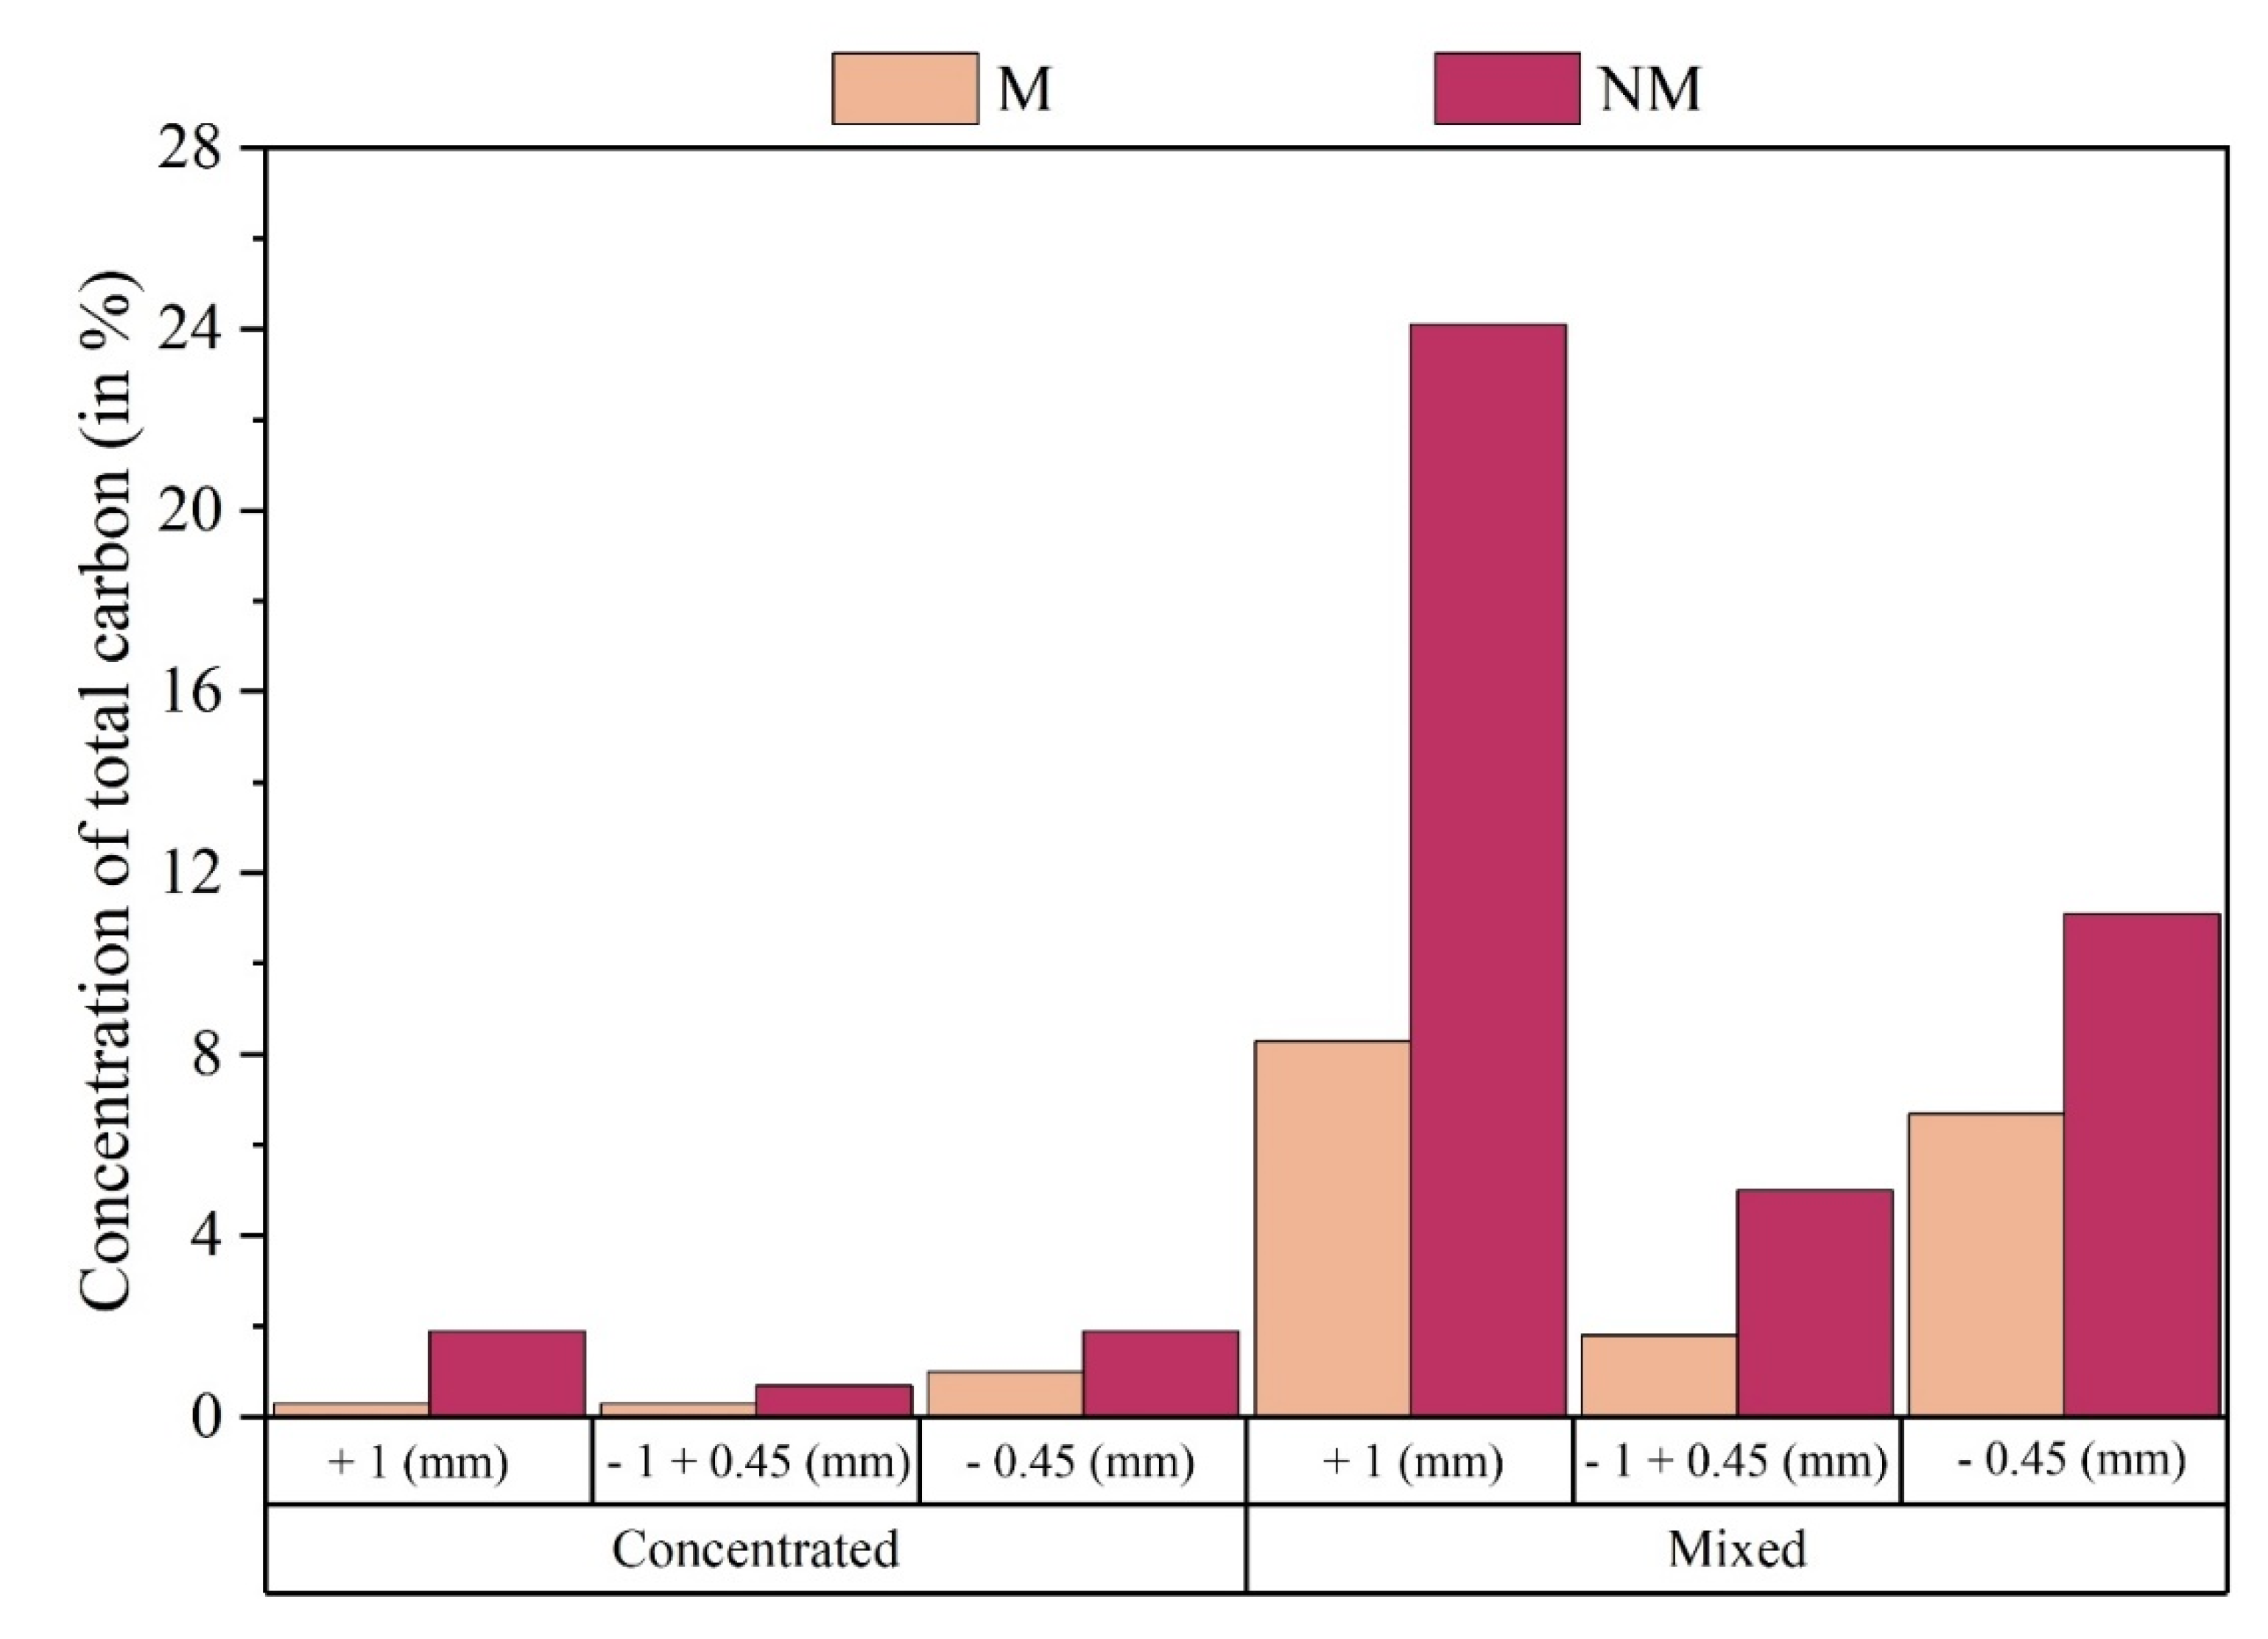
The samples were sent for three complementary analyses, namely: quantification of the Total Carbon (TC); Visual analysis of the physical structure of the constituent particles of each sample; Chemical analysis using aqua regia digestion and Atomic Absorption Spectrometry. The result of the analysis estimated a low presence of carbon in the samples of the Concentrated class, reaching its highest value, 1.9% of Total Carbon, in the product CNM +1mm and CNM -0.45mm. It is noted, as expected after the density separation process, that the Mixed class has a greater presence of Carbon in its samples, with its highest value, 24.1% of Total Carbon, in the MNM +1mm product. This is due to the greater presence of polymeric material in the Mixed class, when compared to the Concentrated class.
Figure 7 shows the values recorded for each product analyzed in relation to the concentration of Total Carbon (%) in the analyzed samples.
Thus, a significant increase in the existence of polymer and ceramic materials in the Mixed class can be seen when compared to the Concentrated Class, which are significantly recorded in the products MNM +1 mm, MM +1mm, MNM -0.45mm and MM - 0.45mm.
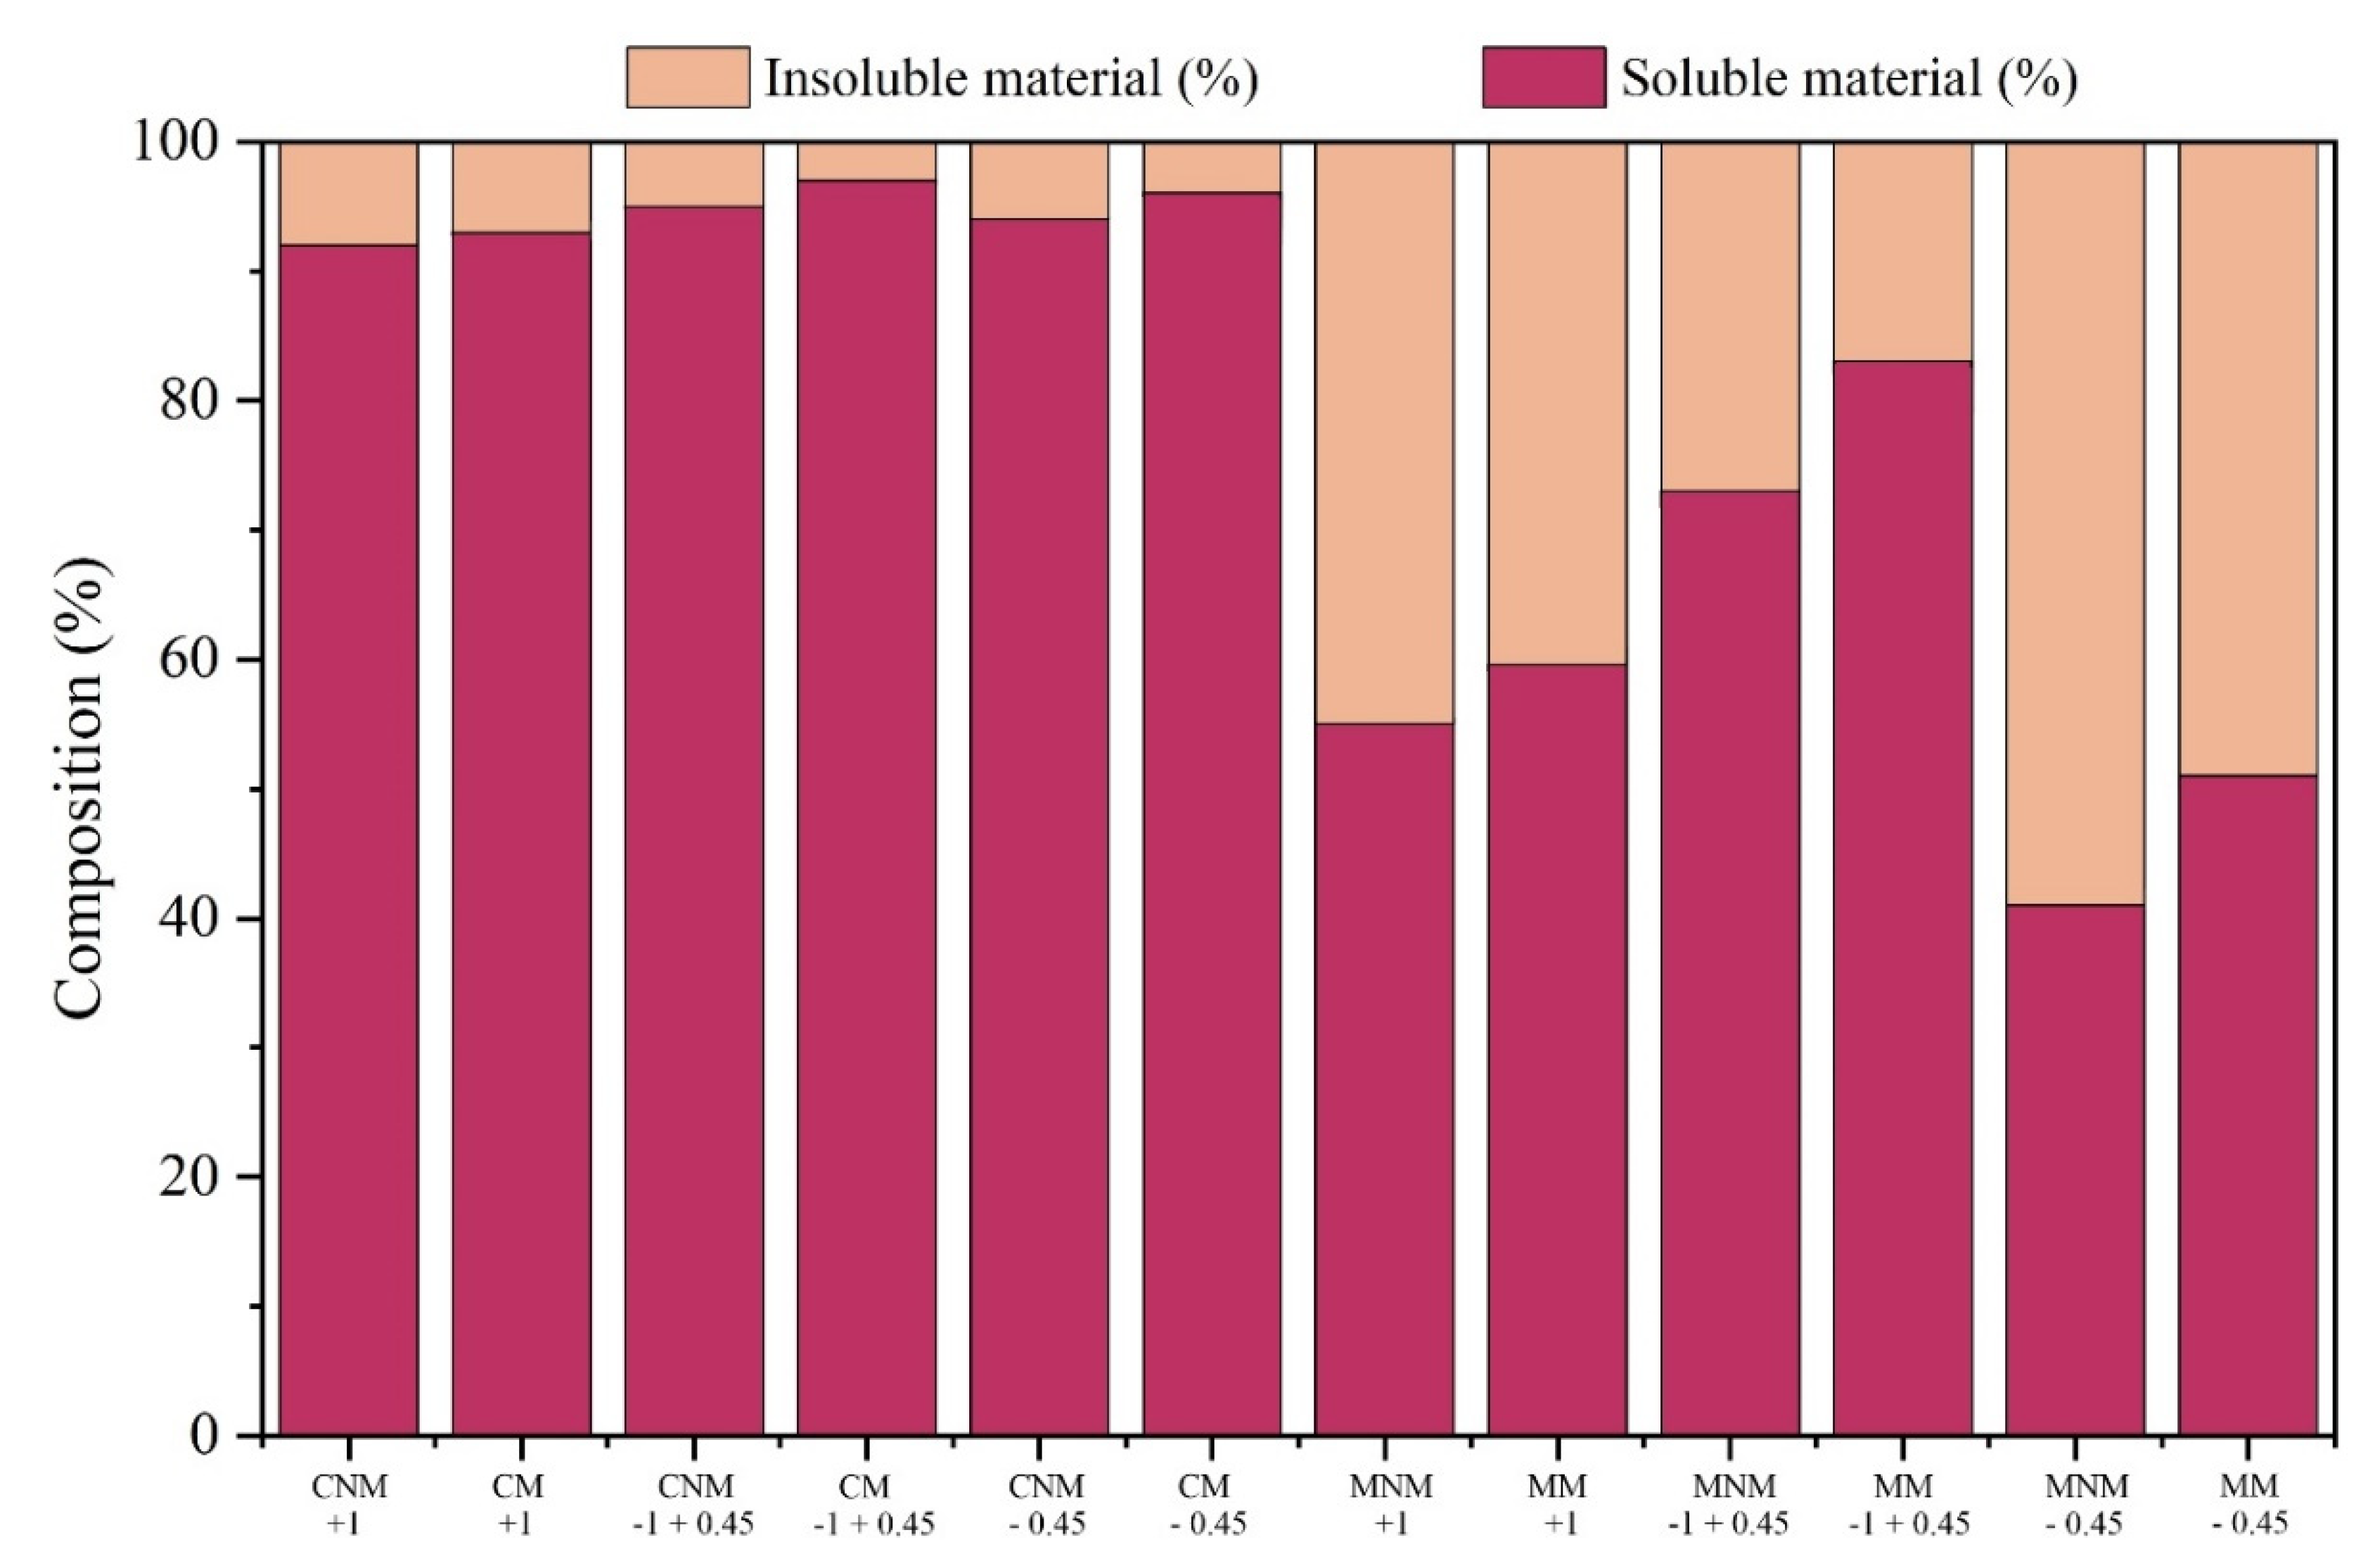
Thus, the samples considered in the study were sent to chemical studies, carried out by applying the sample in the aqua regia solution, observing their reactions and behavior
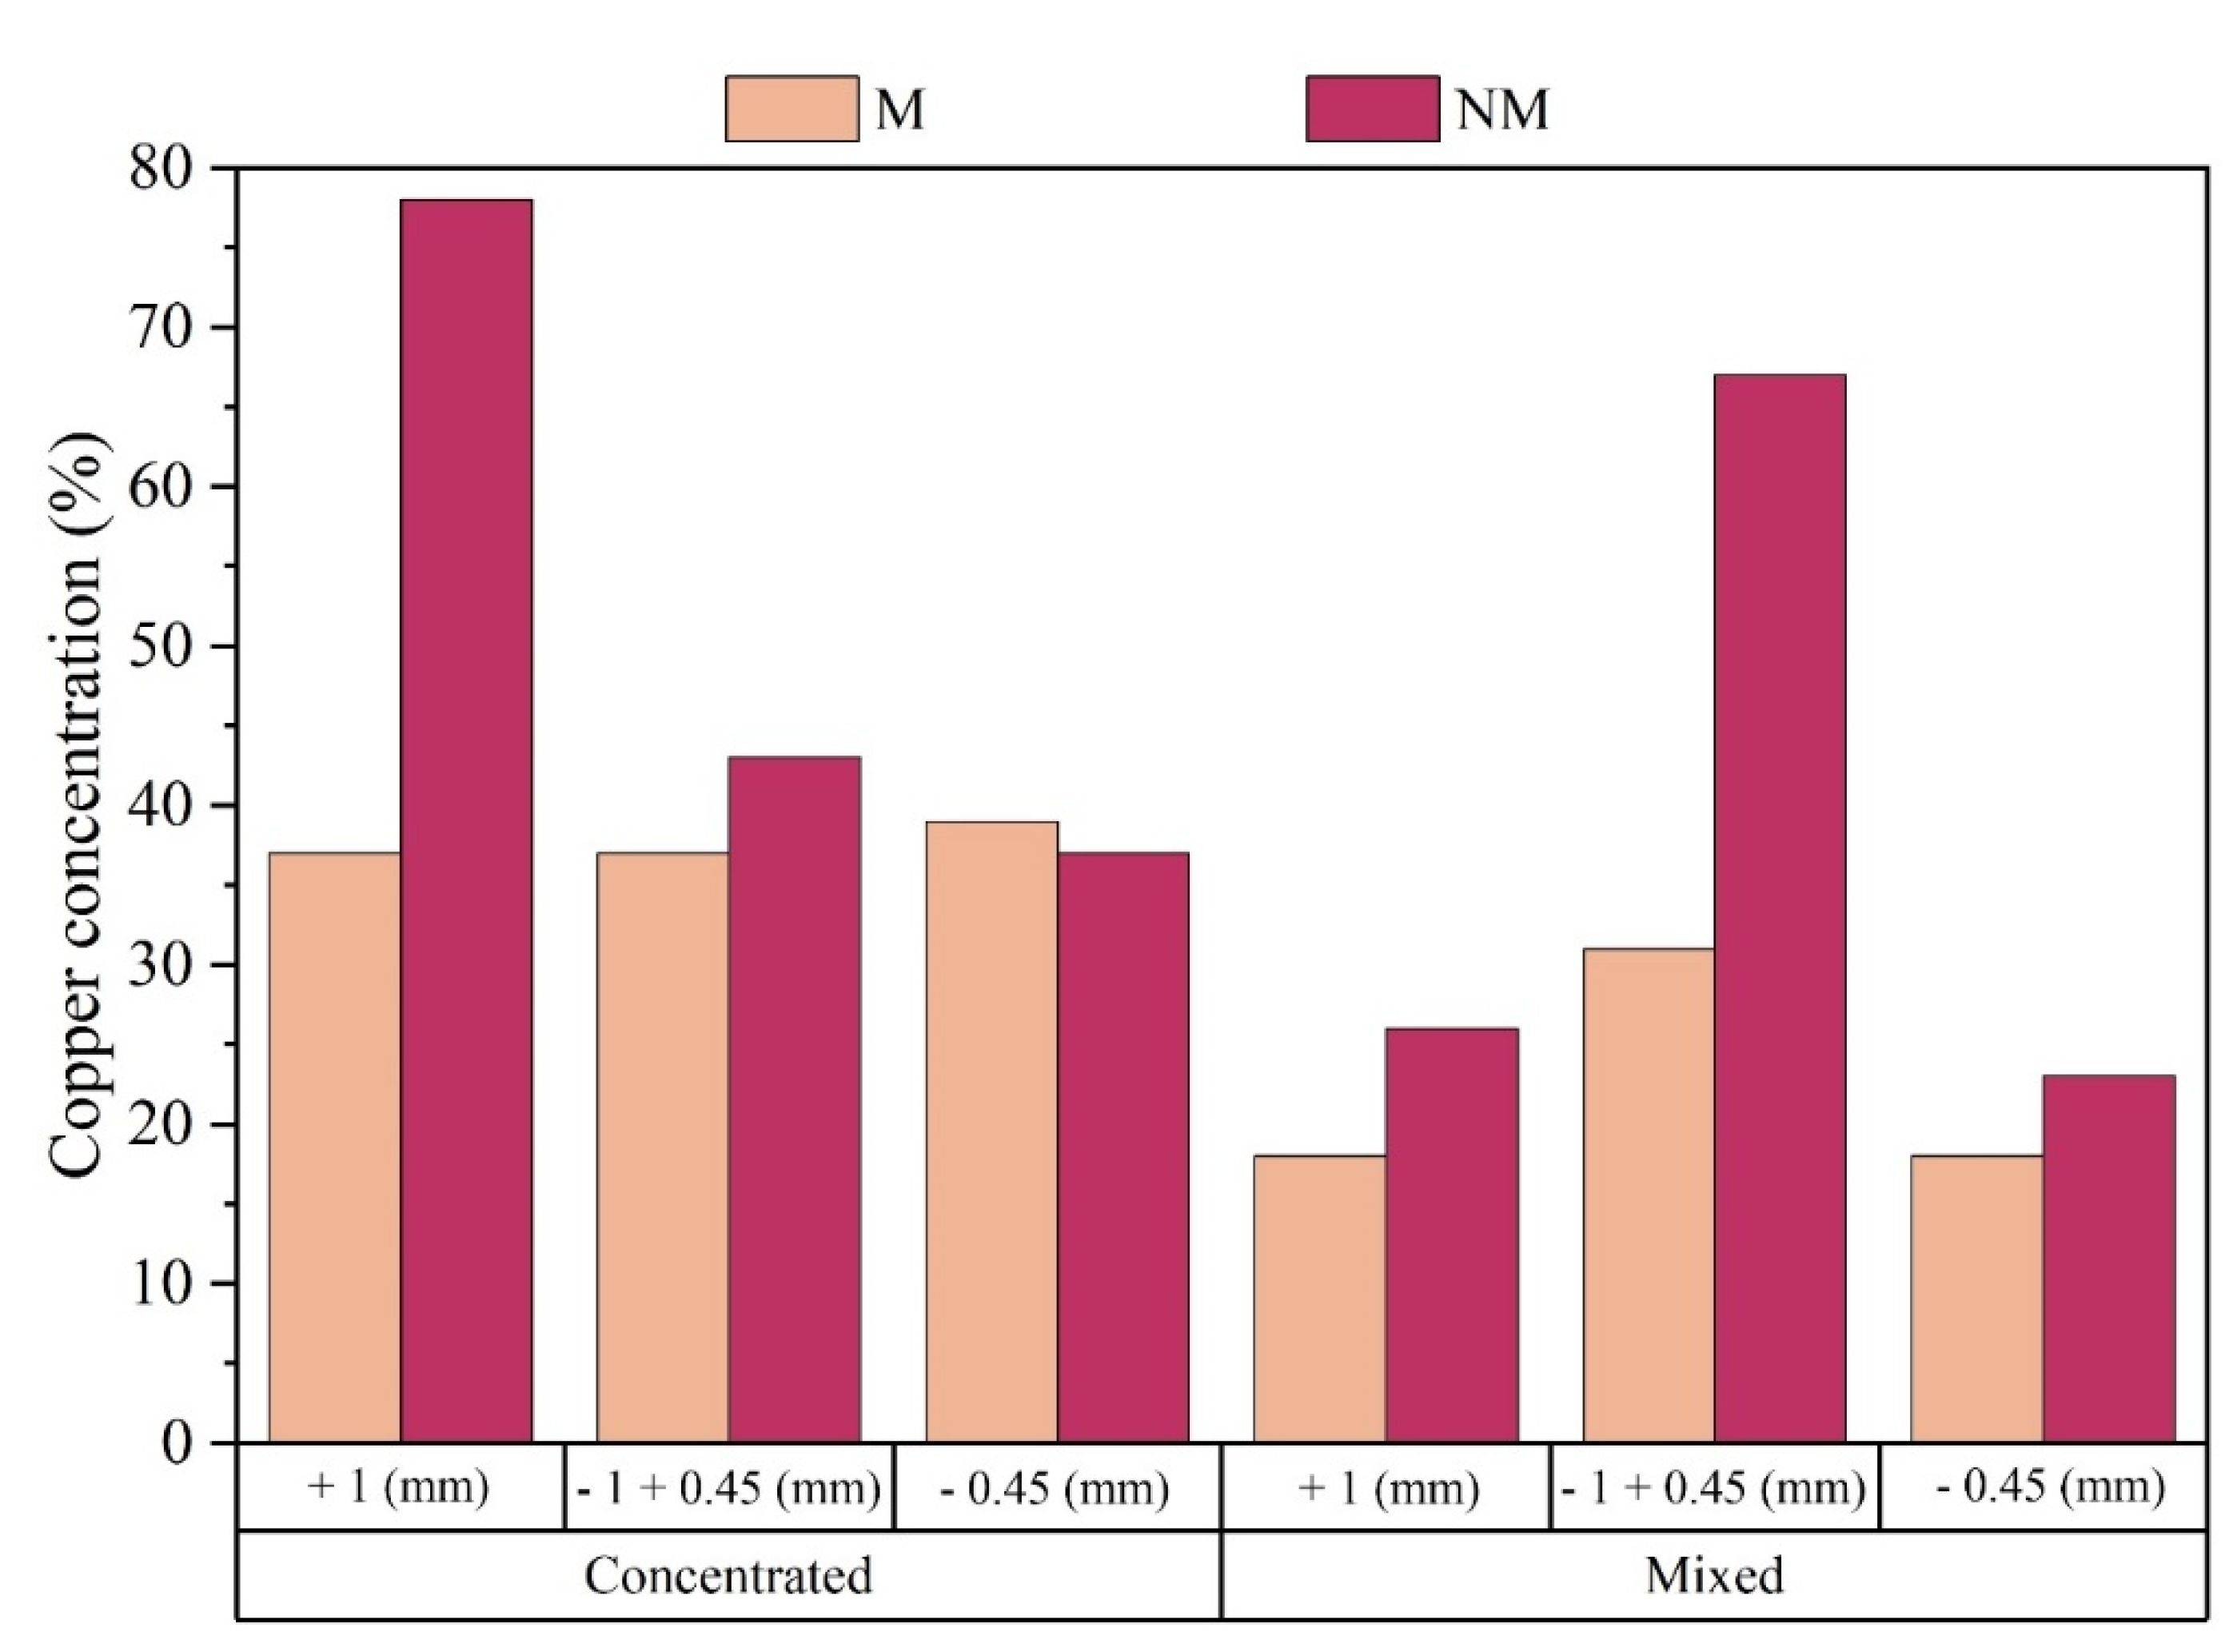
Figure 8. Then, according to the data obtained from the Atomic Absorption Spectrometry, the product Concentrated Non-magnetic (CNM) +1mm stands out, which presented 78% of Cu concentration in the studied sample, according to the solubilized metallic fraction. The Mixed Non-magnetic (MNM) -1mm + 0.45mm product also presents relevant values for the copper concentration in the composition, about 67%. As expected, based on the characteristics exhibited by metallic copper, it was confirmed that the NM fraction exhibits an enrichment of this metal.
It was also observed that the reduction in the presence of copper in the CNM fraction is associated with the sample's particle size, that is, by reducing the particle size, the presence of copper in the CNM sample also reduces. The same does not occur with the MNM product, since the MNM -1mm + 0.45mm presents the highest copper concentration value in this class. Analyzing
Figure 9, it is possible to obtain the concentrations of the samples considered in the study.
Given the representativeness of the Concentrate class for this study, the Atomic Absorption Spectrometry analysis was performed to quantify other metals in this class. Thus,
Table 7 shows the metallic composition of each product in the Concentrate class, according to the presence of the following metals: copper, iron, zinc, nickel, silver, gold, manganese and others.
Considering the quantification of existing metallic materials in each product (
Figure 7) associated with the quantification of the Cu concentration in the samples (
Figure 8), it was possible to estimate the Cu weight value, based on each product studied (
Table 4). Thus, Equation 1 was obtained to calculate the total fraction of existing copper, considering all the samples studied
The
Table 8 stratifies the Cu values by weight for each product, according to the concentration obtained according to Atomic Absorption Spectrometry. In view of these data, it became possible to infer that the Concentrated and Mixed classes, together, represent about 772 grams of copper, which in general terms, taking into account the amount of 3,789.12g of input material (eliminating losses and pilot test), represents about 20% of copper in relation to the total weight of PCB waste used in the study. It is noteworthy that the Concentrated class alone presents 14% of the copper (wt) of the input sample.
Thus, the CNM + 1mm product has become of great interest for this system due to the potential concentration of metals, especially copper.
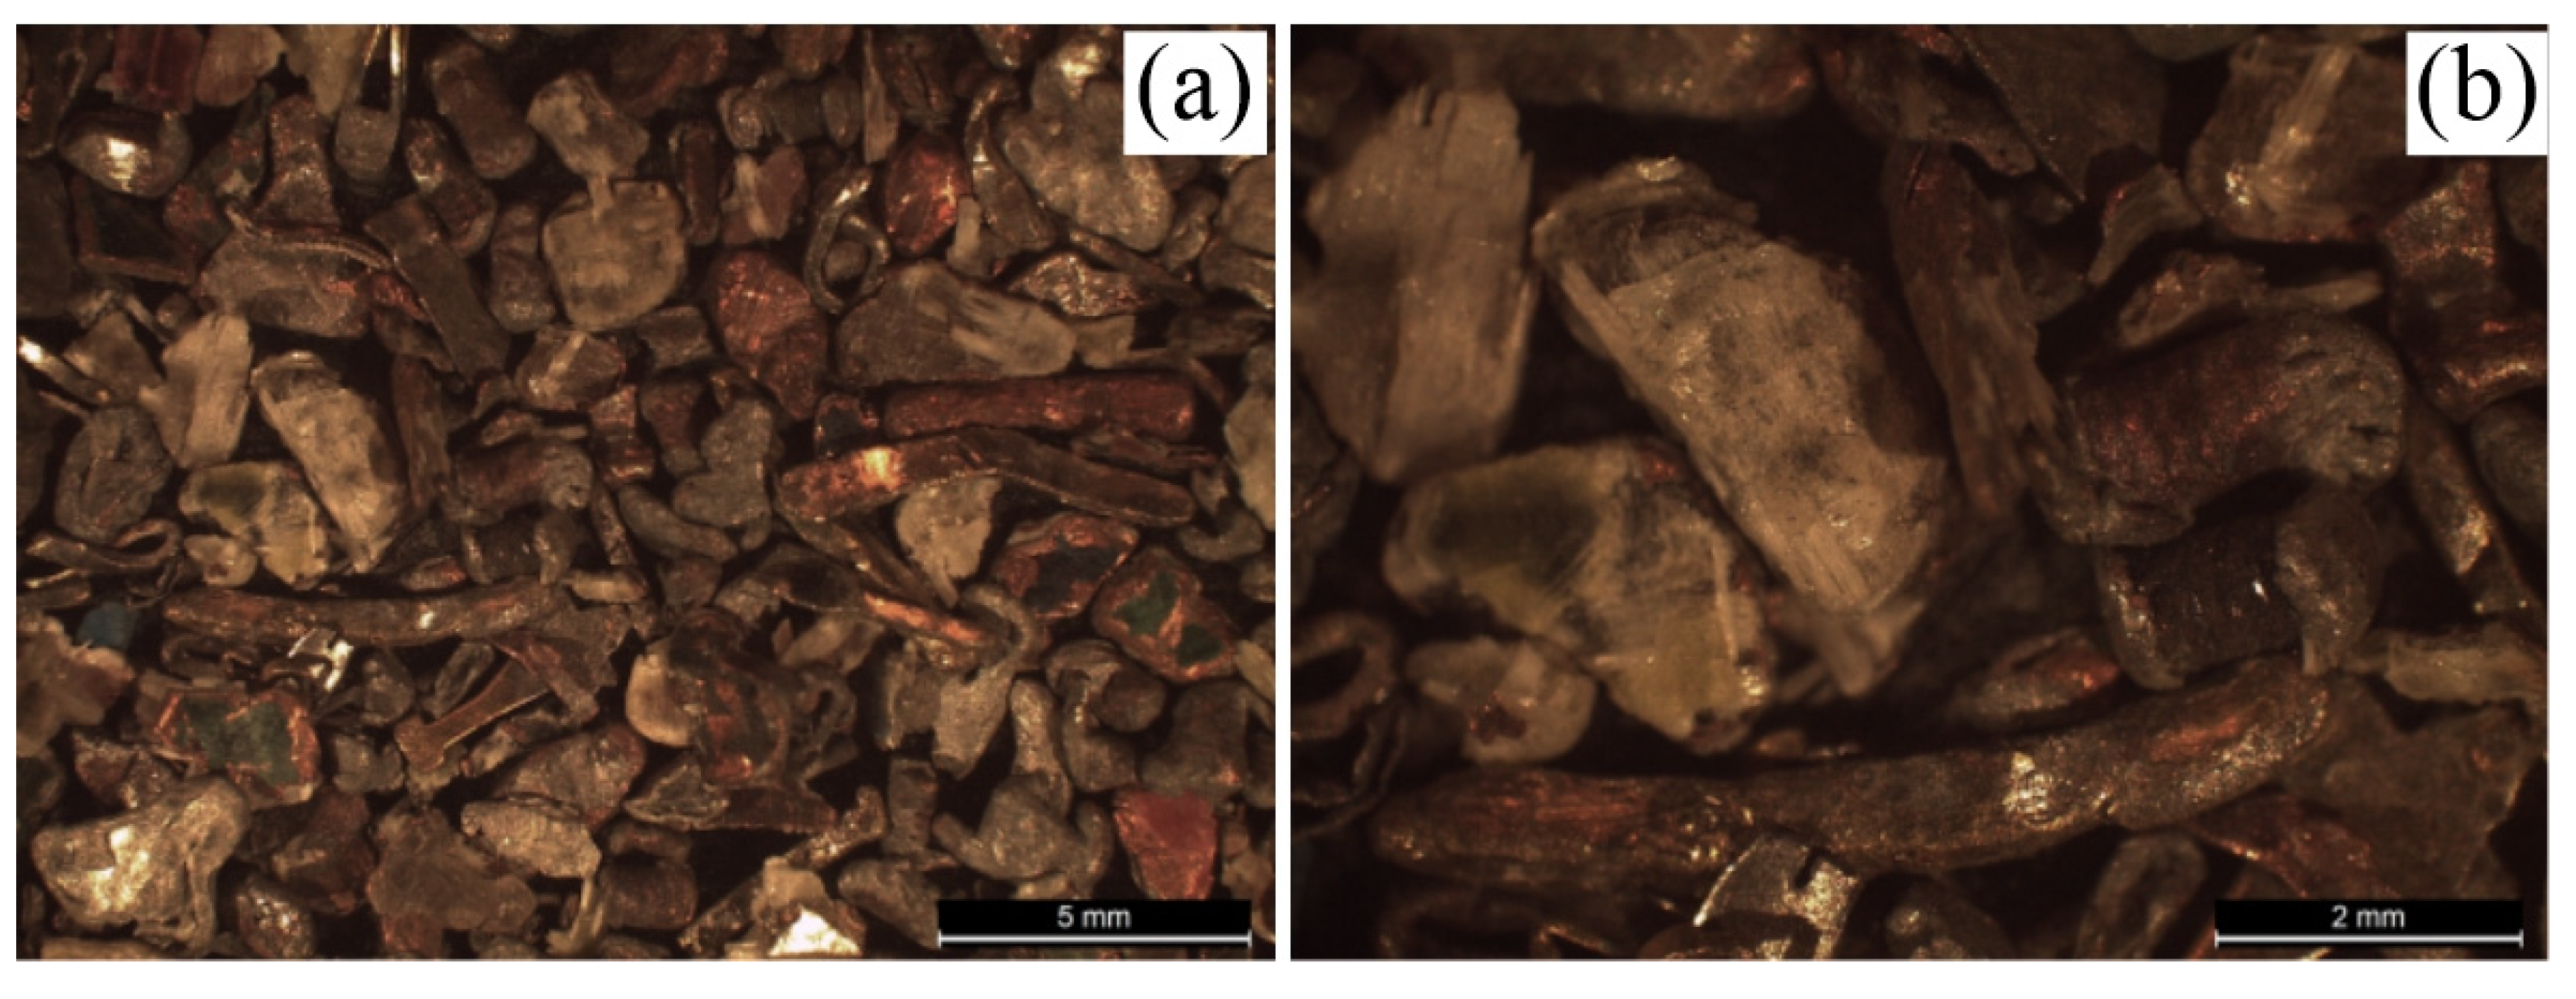
Figure 10 shows the images related to the +1mm particle size fraction, CNM (Figure A and B). In
Figure 10 a) and b) it is possible to identify the existence of particles that have a green hue on their surface, with orange edges (highlighted in red). These particles possibly originate from the PCB substrate, being summarily constituted by epoxy resin (covered by solder mask), copper layers - deposited on the substrate, and fiberglass.
By analyzing the orange colored particles, possibly copper particles, it was possible to perceive different presented geometries. In addition to the Cu particles originating from the PCB substrate, it is possible to notice (Figure b) the presence of copper from PCB inductors, in a rod shape.
Considering all losses during the physical treatment process, the input sample for the chemical analysis corresponds to 3.789 kg. In view of these data, it was possible to infer that the Concentrated and Mixed classes, together, represent about 772 grams of copper, which in general terms represents about 20 % of copper in relation to the total of PCB waste (wt%) used in the study. It is noteworthy that the Concentrated class alone presents 14 % of the copper (by mass) of the input sample.
3.2. Analysis of Dust Obteined in the Fragmentation Process
Wang et al., (2012) show, based on statistical data, that the amount of dust generated in industrial material recovery lines from PCBs corresponds, on average, to about 3.7% of the plant's processing capacity. In addition, the authors emphasize the great difficulty in disposing or properly treating the generated dust.
According to the generation of dust during the fragmentation process, which can present potential for reinsertion in the material recovery process, as well as being associated with occupational respiratory diseases when not well managed, the characterization of this material, captured during the comminution process by means of 37 mm diameter paper filters, moistened with water. The purpose of this procedure was to characterize the particulate material physically and chemically, with low granulometry, which was in suspension inside the fragmentation equipment.
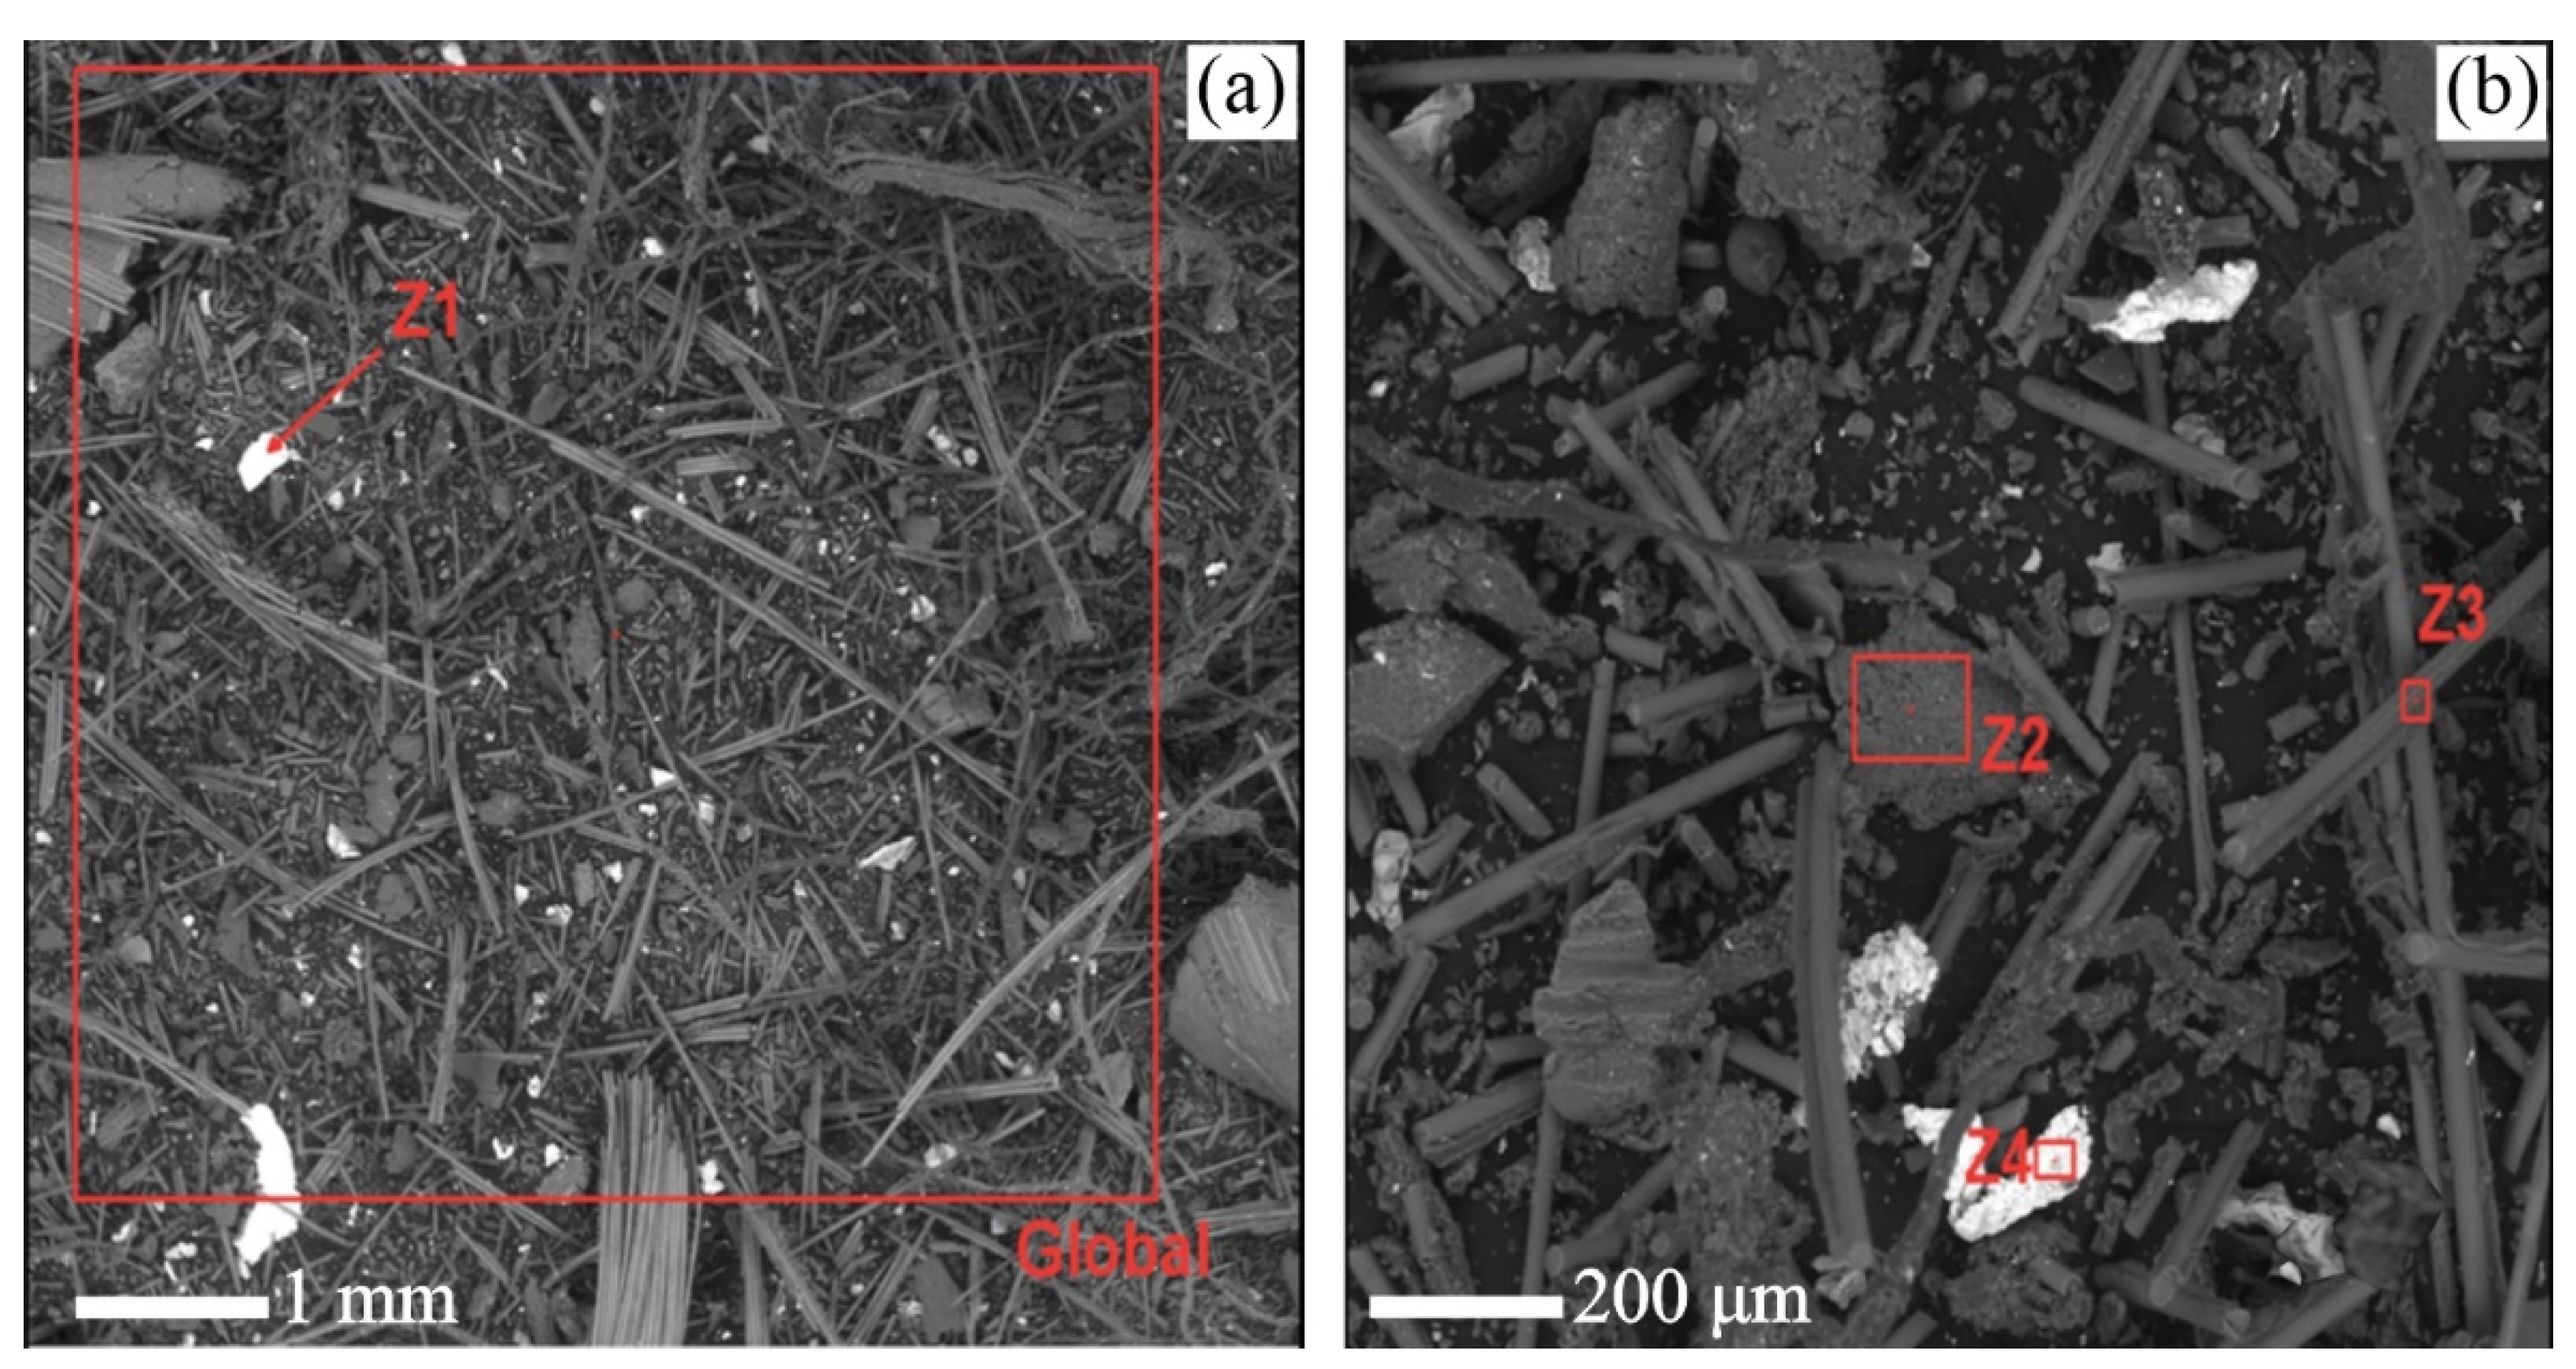
As shown in
Figure 11 a) and b), through the SEM analysis, the particles that compound the sample have diversified geometries. The elongated, rod-shaped particles are believed to be fiberglass particles, found mainly in the internal coating of the copper layers of PCBs.
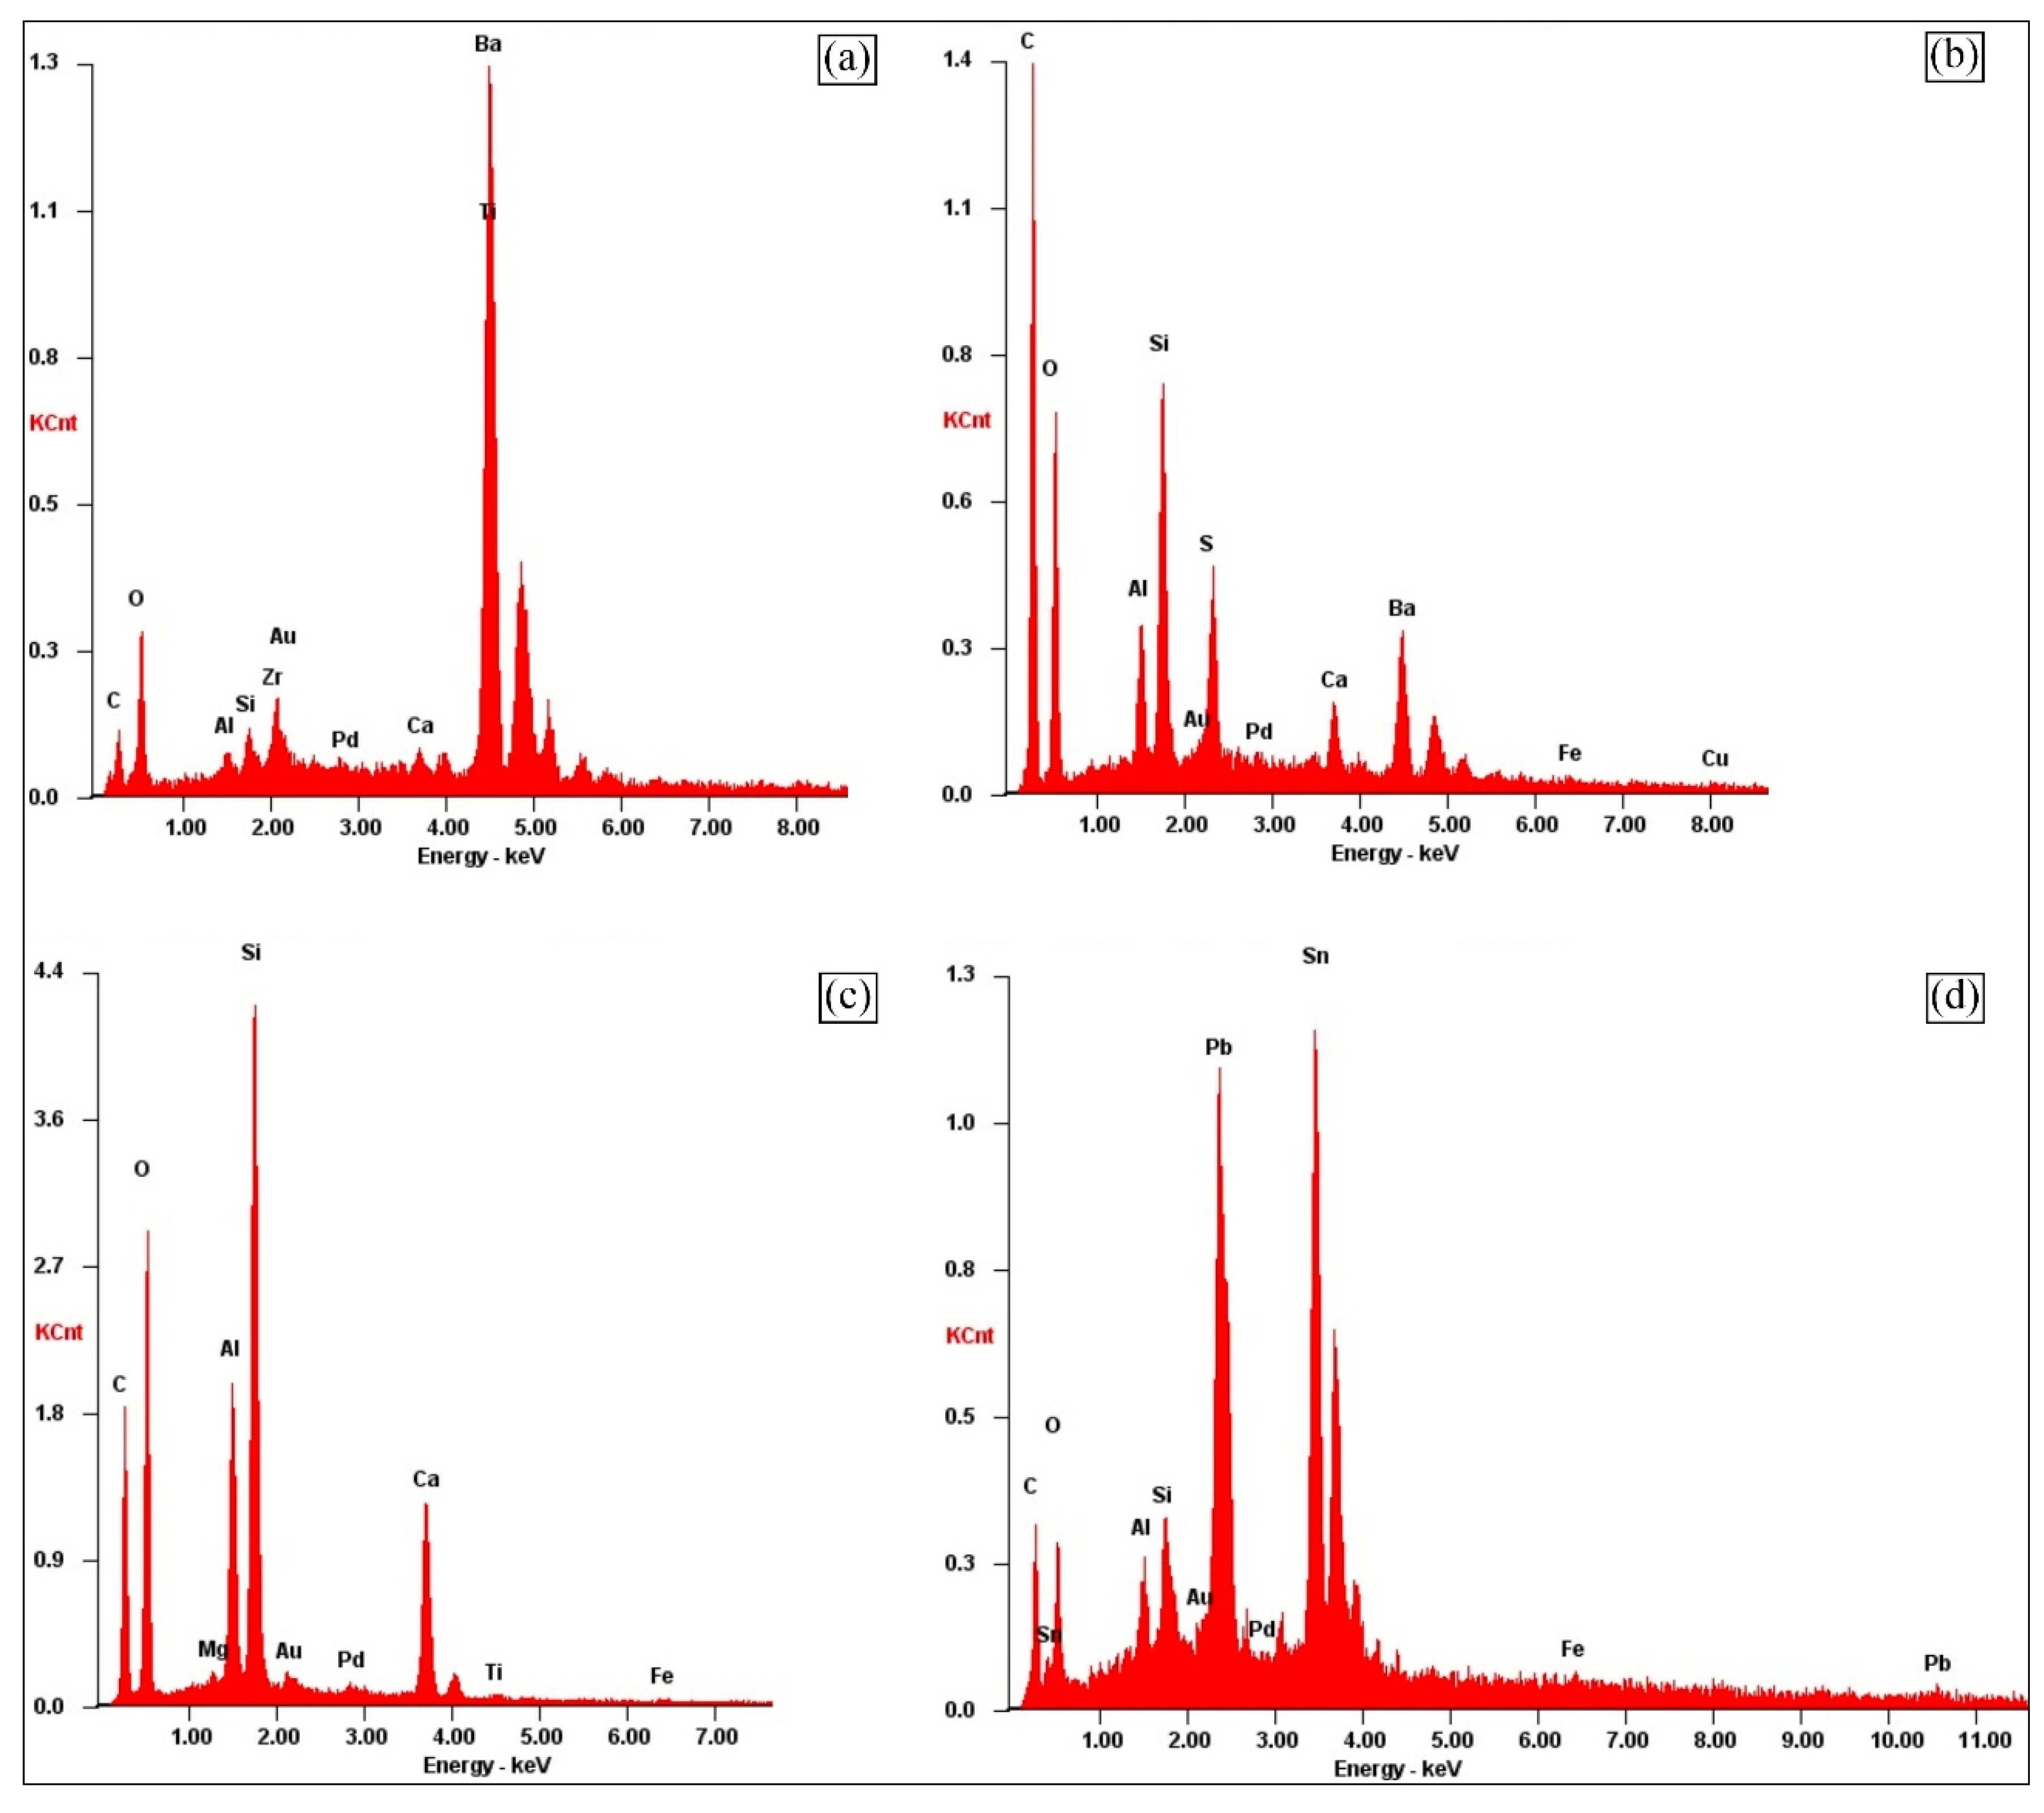
Thus, with the aid of the EDS analysis, it was possible to study the particles Z1, Z2, Z3, and Z4. The
Figure 12 a) shows the Z1 particle, which presents Ba and Ti in its composition. According to Silvas et al., (2015), this particle probably originates from a ferroelectric material that is frequently used by the electronics industry. This material is in the form of Barium Titanate (BaTiO
3), which is characterized by being a ceramic material that exhibits photorefractive effect and dielectric properties.
According to Wang et al, (2012), the substrate of the PCBs is mainly composed of C and O, in addition to metals such as Si, and Al, that are released during the grinding process. According to
Figure 12 b) obtained by the EDS test at point Z2, it is possible to infer that the analyzed particle possibly represents a part of the substrate of the PCB, since it presents the typical elementary characterization.
In view of the images obtained by the SEM (
Figure 11b), it is possible to perceive the geometric peculiarity of the Z3 particle, where it is elongated. When observing the information generated from the EDS analysis (
Figure 12 c) in the Z3 particle, the presence of the elements Si, O, C, Al and Ca is highlighted. In view of these characteristics, the Z3 particle is possibly fibers of glass, where the elements mentioned above exist in the form of oxides such as SiO
2 and Al
2O
3.
In the analysis of point Z4 (
Figure 12 d), it is noted the relevant presence of Sn and Pb in the sample, because this element is used frequently in the production of PCBs to weld other components to the surface of the board.
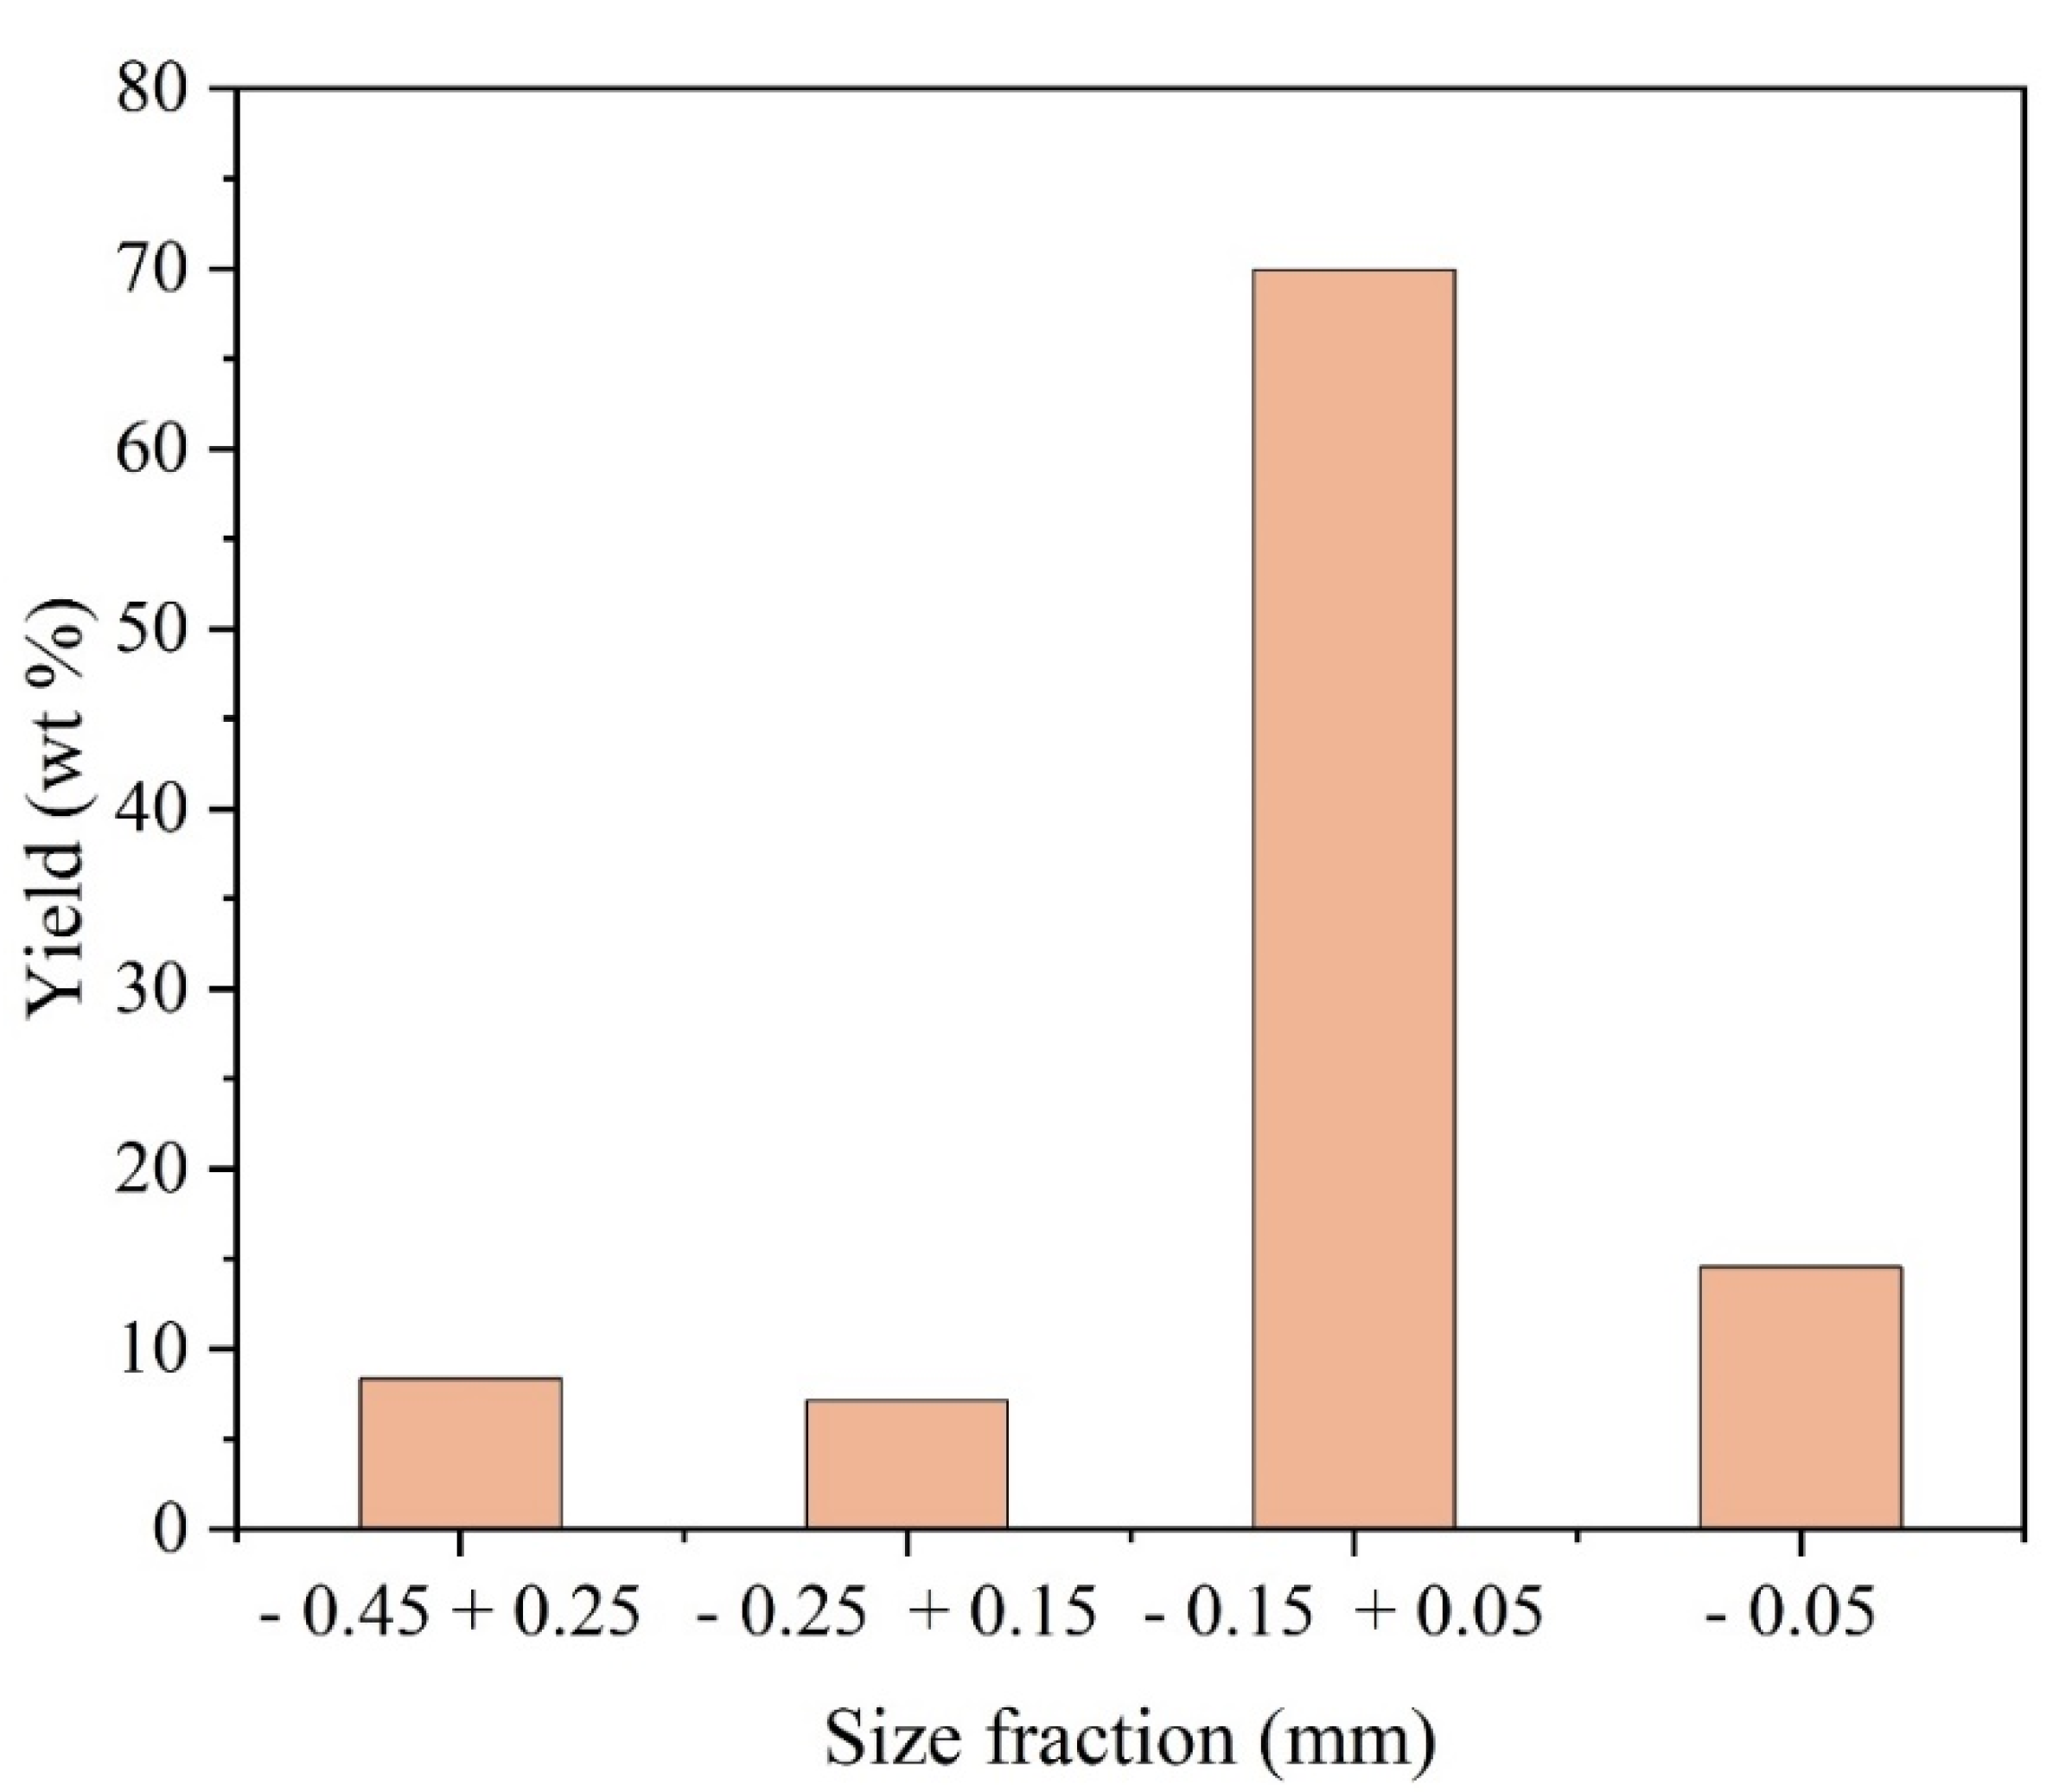
After characterization by image, the general dust sample was subjected to the separation process by granulometric fractions, where four class intervals were defined. Since the largest particle size presented by the sample was below 0.45 mm, the following classes were assigned: - 0.45 mm + 0.25 mm, - 0.25 mm + 0.15 mm, - 0.15 mm + 0.05 mm and - 0.05 mm.
Figure 13 shows the distribution of the mass, in percentage, presented by each granulometric fraction in relation to the general sample. Approximately 70% of the entire sample obtained showed an interval granulometry of - 0.15 mm + 0.05 mm.
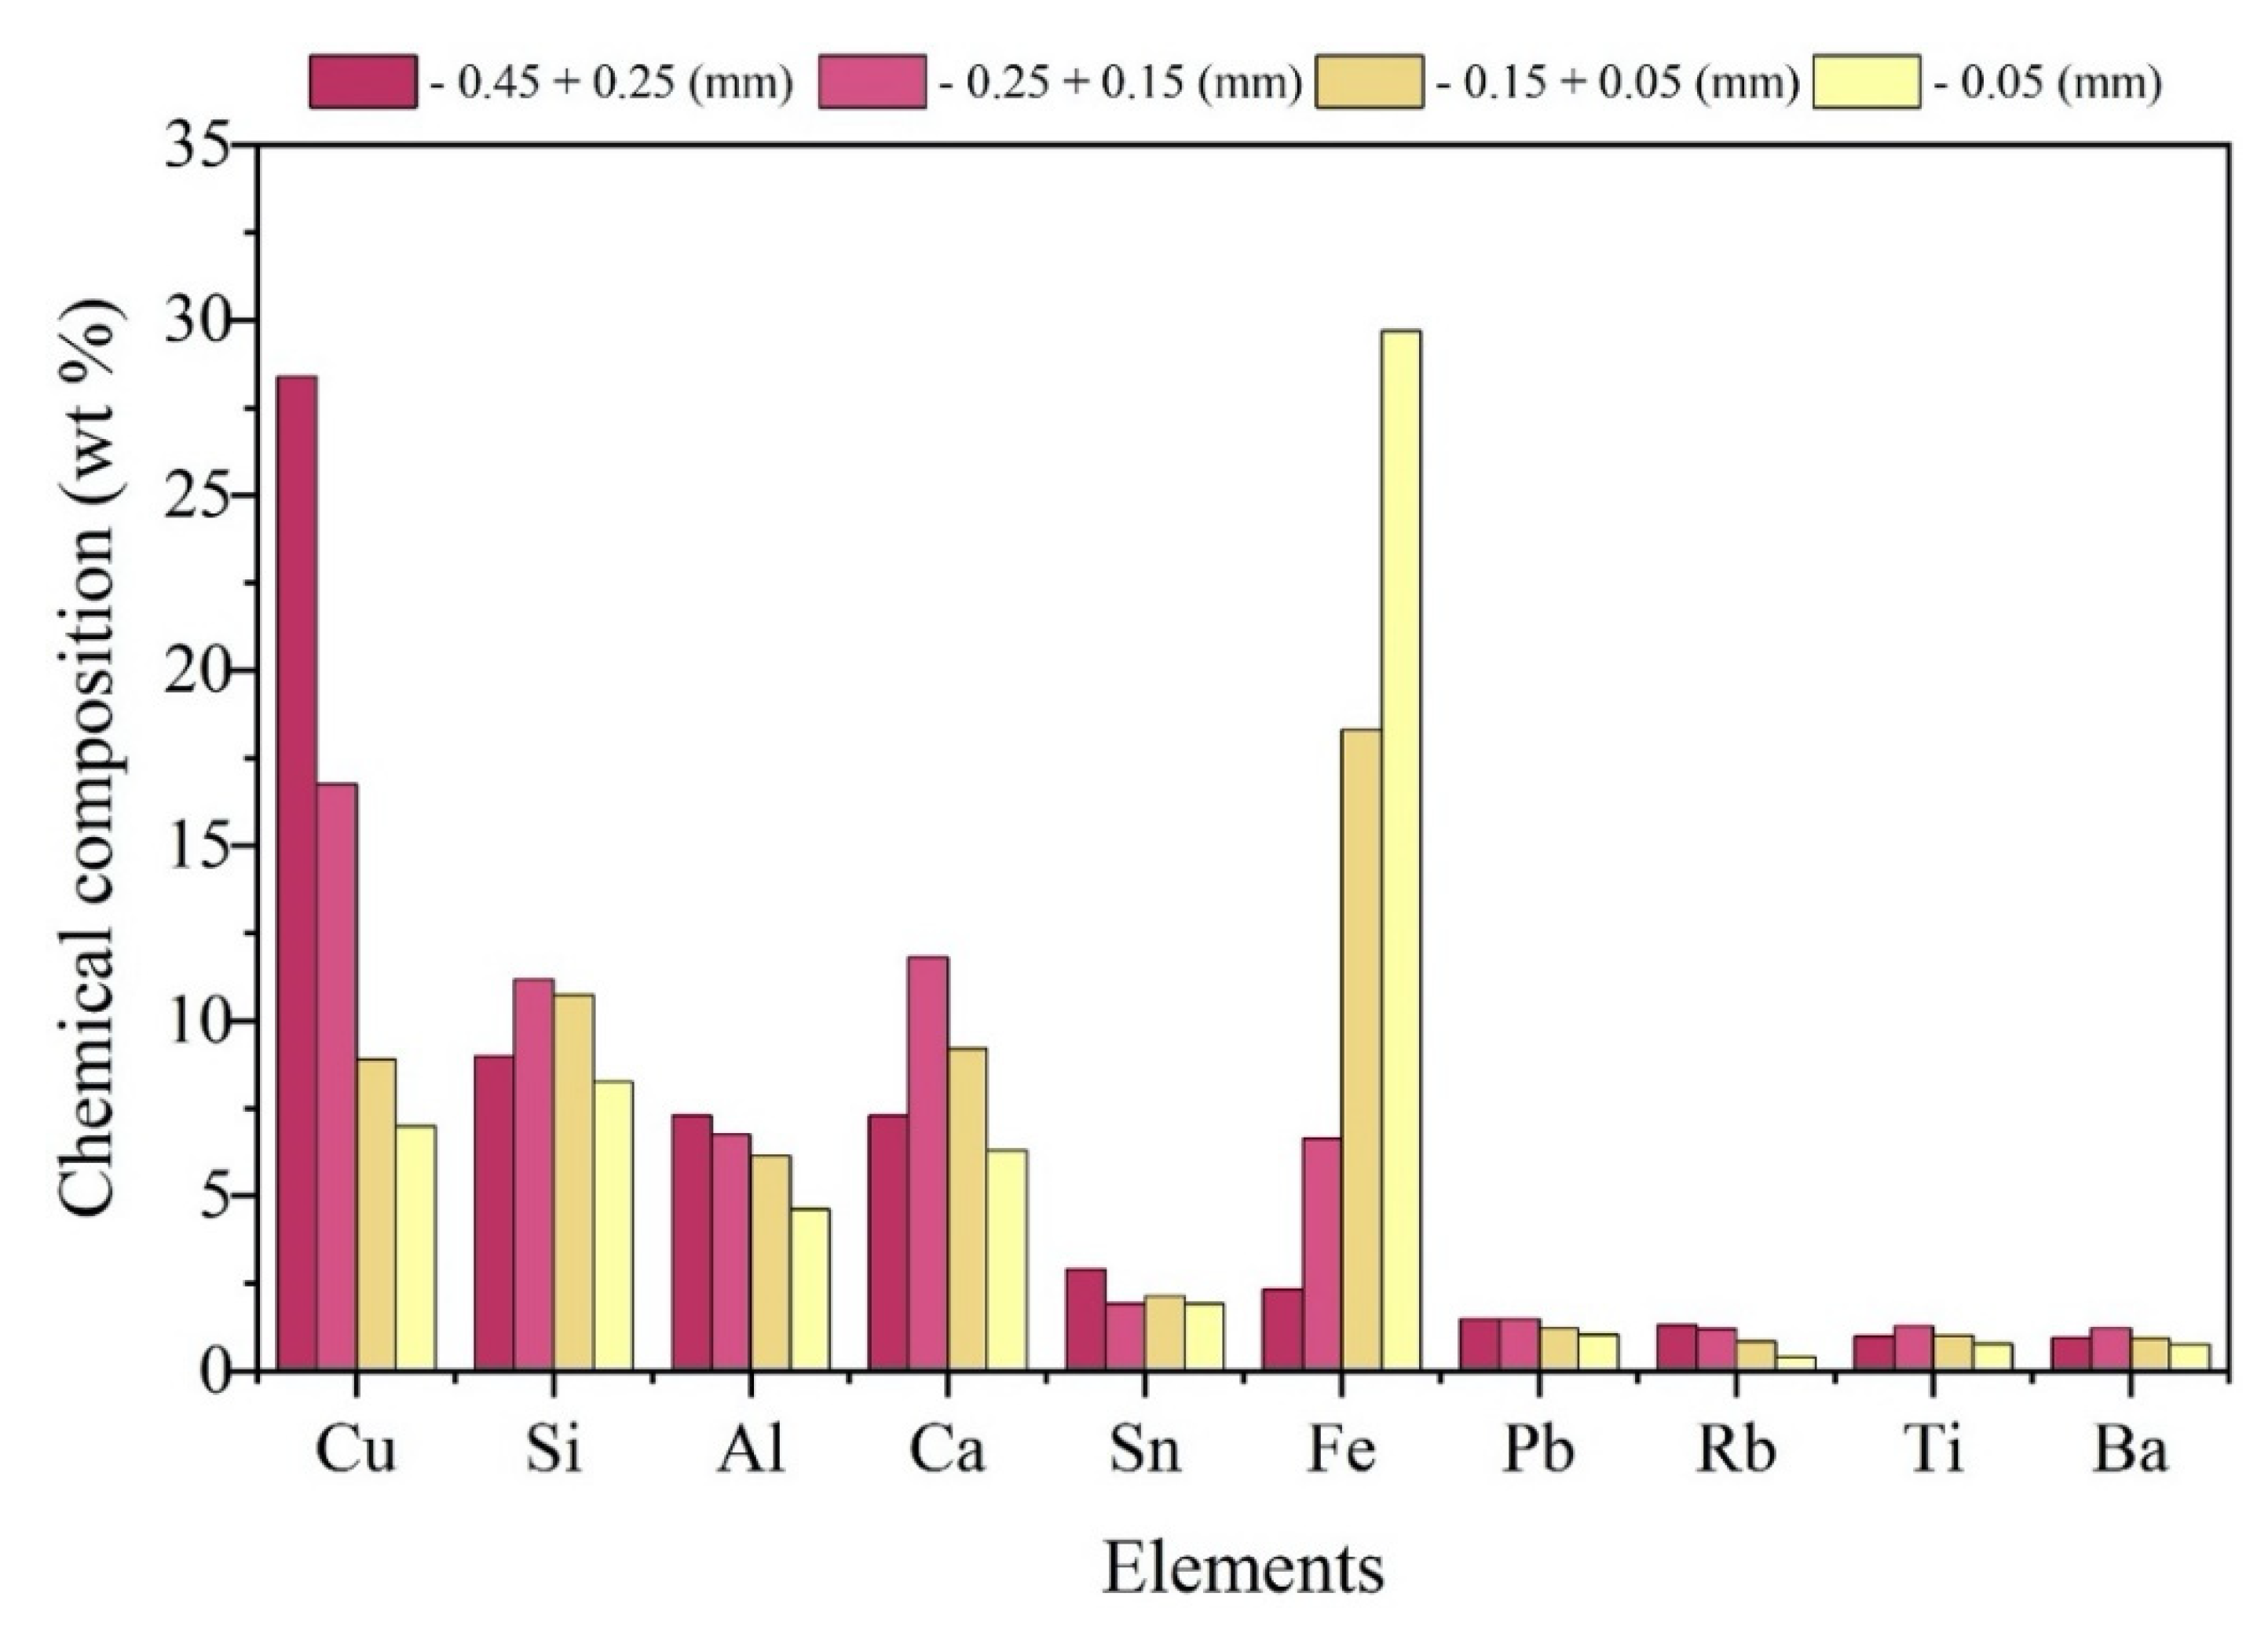
With the support of the X-Ray Fluorescence equipment - Oxford X-MET 7000, the elemental chemical analysis of each particle size fraction was obtained, which are shown in
Figure 14.
In general, it was found that due to the higher concentration (wt %) of the sample being allocated in the range of - 0.15mm + 0.05mm, the elements Fe (18.30%), Si (10.73%), Ca (9.21%) and Cu (8.89%) stand out regarding the participation of the elemental composition of this fraction and also regarding the general composition of the sample. However, in a punctual analysis, it is possible to notice the inversely proportional tendency of the presence of Fe in relation to the particle size of the classes, that is, the smaller the particle size of the material, the greater the relative presence of Fe in the fraction, registering 2.34 % (wt) in particles with the largest grain size and reaching 29.70% (wt) in the class with the smallest particle grain size.
The opposite occurs with Cu, which registers its largest participation (28.38%) in the composition of the fraction with the largest particle size (- 0.45 mm + 0.25 mm), decreasing its presence as the particle size increases also decreases.
3.3. Life Cycle Assessment
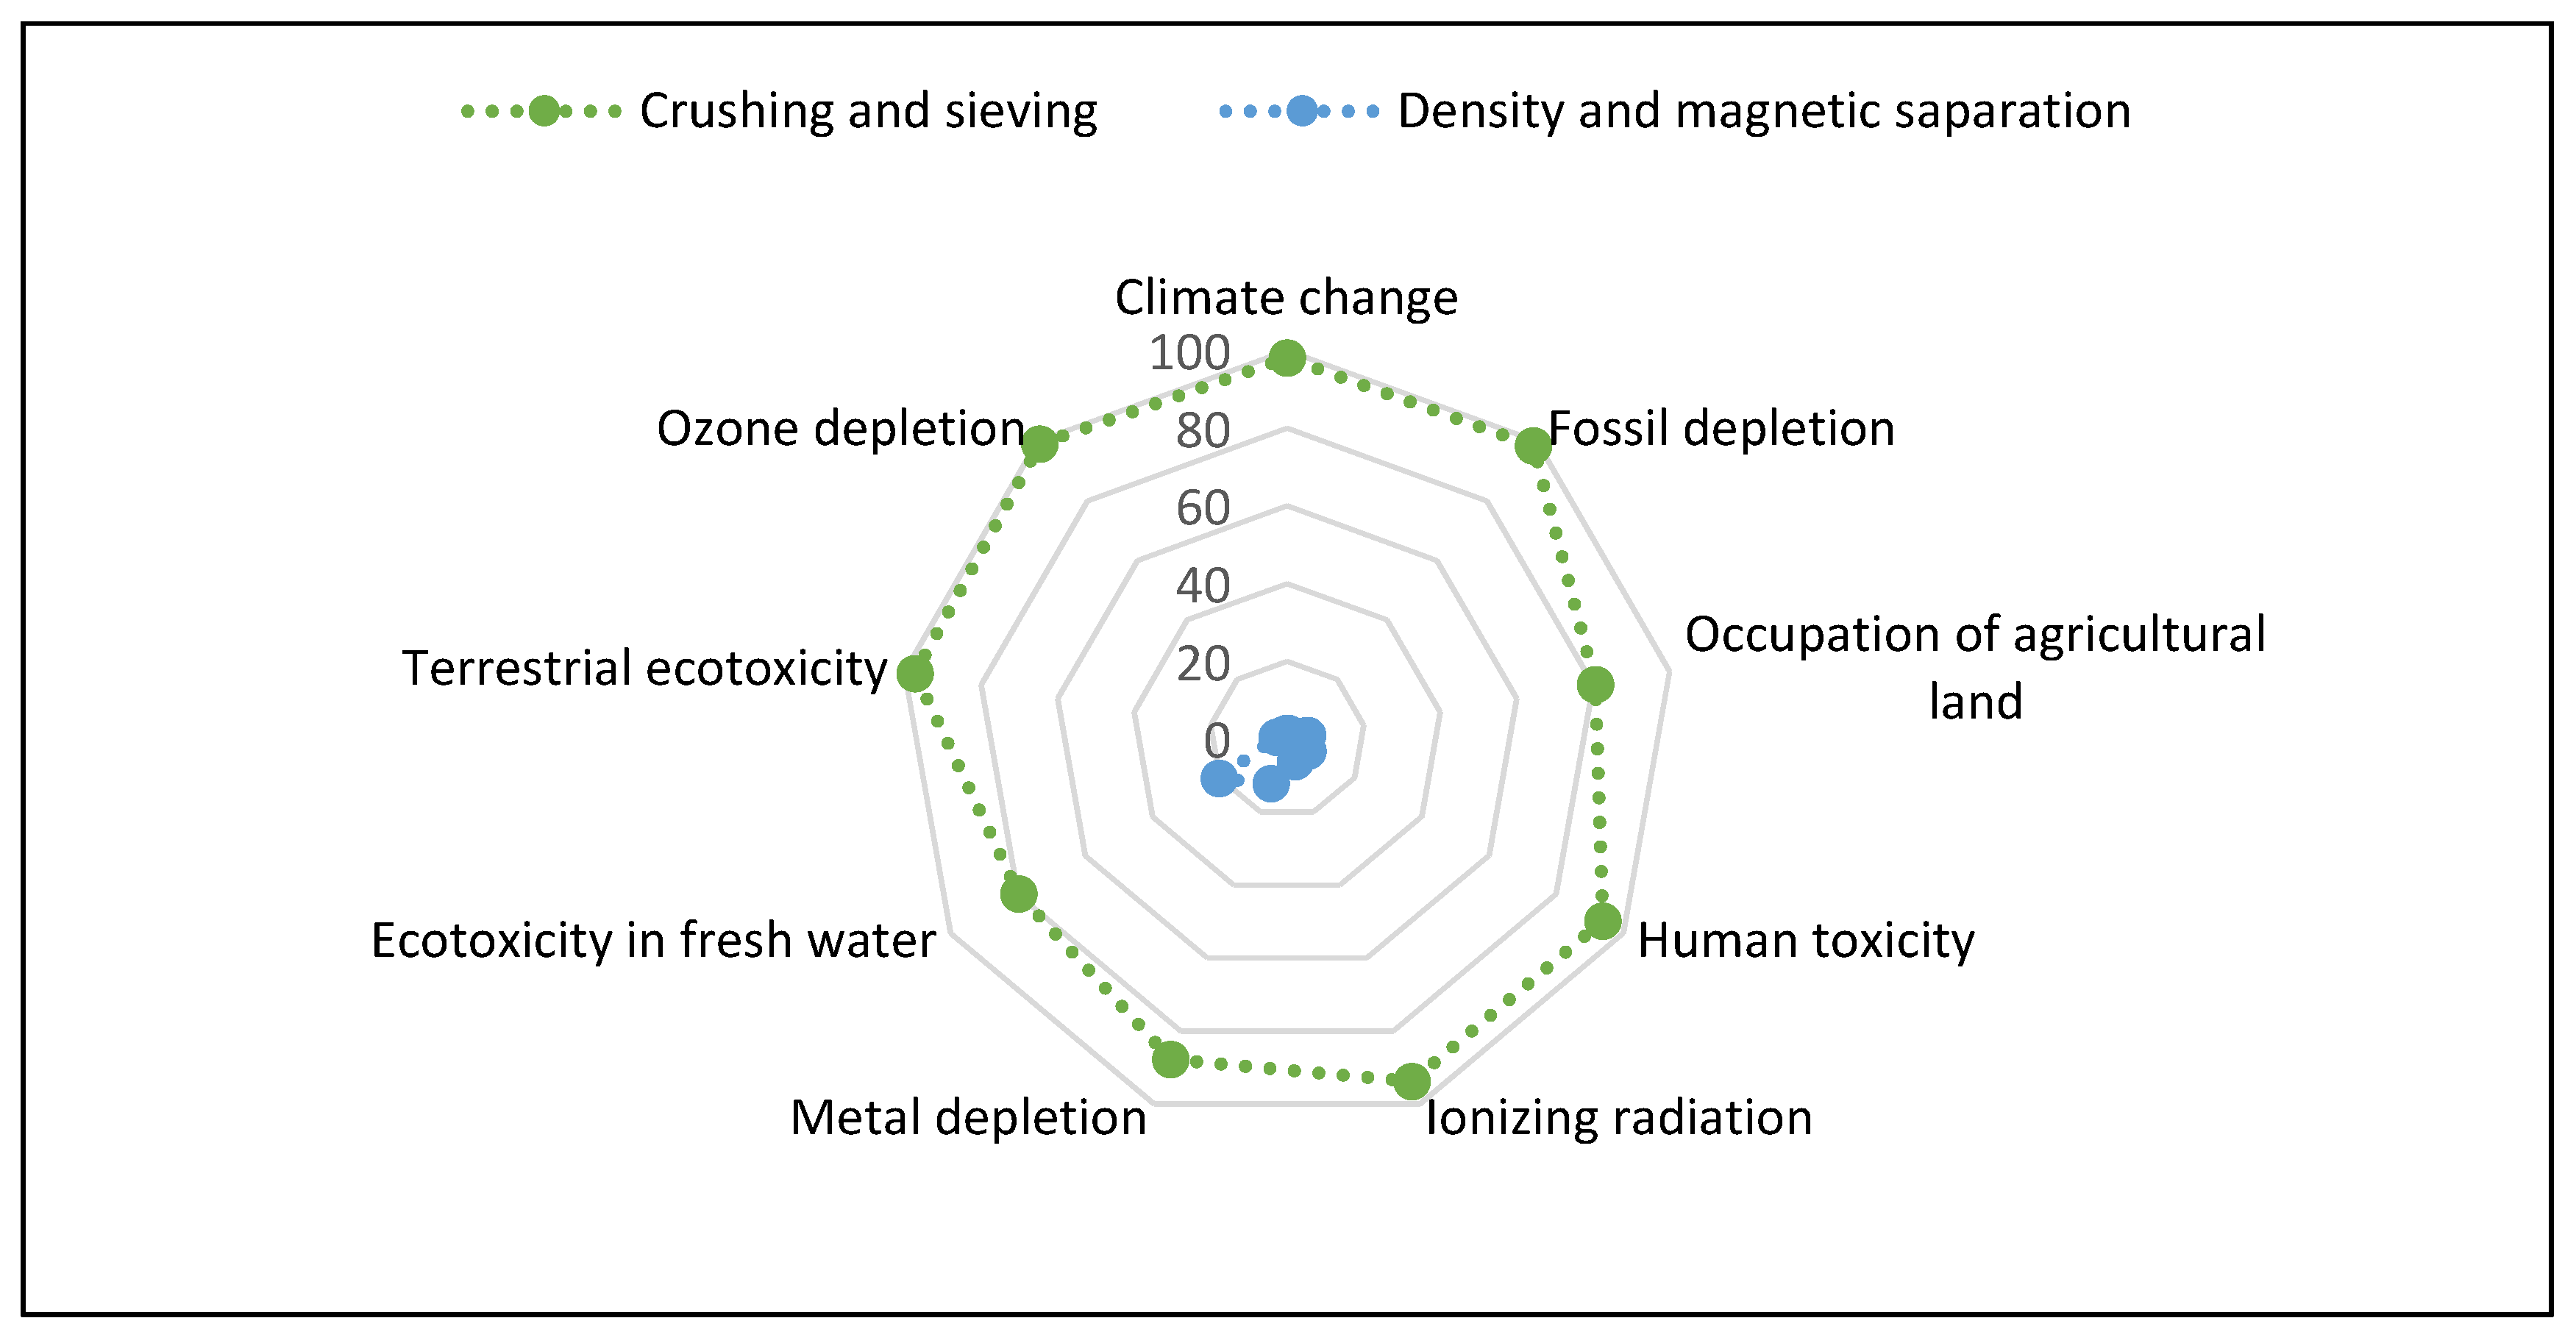
Analyzing the total values of the impacts generated in the pre-treatment phase for copper recovery in PCB waste, shown in the
Figure 15, it becomes possible to infer that the crushing and sieving operations, which make up process I, had a majority participation in all impact categories evaluated. In seven of the nine categories evaluated, crushing and screening activities accounted for more than 90% of the recorded impact values.
Table 9 presents the LCIA results for the pre-treatment phase. Thus, the importance of developing new technologies and methods in the pre-treatment phase is highlighted, which prioritize energy efficiency and value the recovery of the fraction of dust generated in this stage.
In a particular analysis of process I, it was found that the impacts associated with it are greatly influenced by the way of obtaining the energy used in this stage, especially by the energy matrix presented by each geographic area. This is due to the use of equipment that requires more energy consumption, when compared to the activities that make up process II.
On the other hand, the density separation operation, performed on an shaker table, required the use of water, which generated effluents as an output of the process. In addition, waste disposed in underground deposits contributed to process II reaching around 20% of the total share in the Freshwater Ecotoxicity Impact category.
The crushing process is necessary because it has the characteristic of releasing metals in the PCB, mainly copper, which is also present in the inner layers of the PCB. however, most of the materials processed in the grinding phase are of ceramic or polymeric origin, which makes subsequent processes for the recovery of metals in quantity and quality difficult.
It was possible to obtain a class of sample with non-magnetic characteristics, granulometry greater than 1mm and concentration of 78% Cu due to the separation operations carried out in process II, which contributed to the accumulation of metals, in particular copper, in a specific fraction, facilitating hydrometallurgical or pyrometallurgical processes.
