Preprint
Article

Accumulation of Trace Metals in Fruits from Mango And Syzigium guineense Growing in Residential Households from A Contaminated District of Lubumbashi (Dr Congo): Is Fruit Consumption at Risk?

Altmetrics

Downloads

78

Views

34

Comments

0

A peer-reviewed article of this preprint also exists.

Submitted:

29 June 2023

Posted:

30 June 2023

You are already at the latest version

Alerts
Abstract
Copper smelting has been the source of soil contamination in trace metals in Penga Penga (Lubumbashi). Residents are exposed to trace metal ingestion and planting trees is challenging in such soil conditions. Nevertheless, planting trees in former household dumps or using various types of amendments allowed the provisioning of fruits in few residences. In the perspective of scaling up the process, a survey has been conducted with the aim of assessing the effectiveness of the planting processes on the trace metal content in fruits and leaves of Mangifera indica L. and Syzygium guineense (Willd) DC. Samples were collected in residential households from Penga Penga and Kalebuka (a non-polluted suburb). The bioconcentration factor (BCF) and the safe weekly consumption (SWC) were calculated for each species. Results showed higher values of total and soluble concentrations of Cu, Pb, and Zn in the rhizosphere of the two species at Penga Penga. Metal concentrations were higher in fruits and leaves from Penga Penga with 47% of samples above FAO and WHO thresholds (vs 18.5% in Kalebuka). The BCF values were below 1 demonstrating the effectiveness of the process to reduce metal translocation to leaves and fruits. Recommendations from the SWC limited by Pb for consumption to 9 kg for mango flesh and by Cd 6.6 kg for S. guineense fruits at Penga Penga (Vs 78 and 68 kg at Kalebuka). Finally, results from this study provide interesting lessons from the scaling up and the technical itinerary of planting tree un Penga Penga.
Keywords: 
Subject: Environmental and Earth Sciences  -   Environmental Science

1. Introduction

More than a century of mining activity has severely impacted the environment in and around major towns of the Katangese Copperbelt (KCB) in south-eastern DR Congo. Indeed, many publications reported evidence of the impacts of mining activities on the trace metal pollution of atmosphere [1], rivers [2,3,4,5], and soil [6,7,8]. Numerous sites are affected by trace metal pollution in Lubumbashi. However, the pollution of the Penga Penga district by emissions from the copper smelter of the ‘Gécamines Lubumbashi’ plant is one of the oldest and best documented. In this area, the deposition of trace metal-rich particles after the emission of fumes by the smelter resulted in high concentrations of trace metals in soils as well as their acidification [9,1,10,11,7] with a footprint that spread over more or less 30 km in the direction of the prevailing winds [12]. The pollution generated has led to the replacement of the original open forest with a short, sparsely vegetated landscape with large patches of bare soil [9,13]. These high levels of pollution have exposed populations in the KCB to trace metals [14] with significant health impacts [15,16]. In recent years, the situation has been exasperated by uncontrolled urbanization and population growth in Lubumbashi [17,18], including polluted areas like Penga Penga.
In this context, phytoremediation trials have been implemented during the past 15 years in order to suggest strategies that could reduce population exposure. Results have highlighted the good abilities of local copper flora for the phytoremediation of polluted soils in Penga Penga [11,19]. Nevertheless, anarchic urbanization and population growth exacerbated the complexity of implementing a large-scale phytoremediation program. Indeed, the presence of residential households is a barrier to revegetating large continuous areas and leads to additional expectations regarding the establishment of vegetation in the district as reported by Mwanasomwe [20]. Especially, residents clearly indicated the need of planting woody species in order to improve local living conditions through the reduction of dust by windbreaks, the creation of microclimates (e.g. creation of shade), and the production of fruits and leaves that are edible or used in traditional medicine. Unfortunately, growing trees in polluted soils is challenging for most of the residents who declared a high mortality rate. Indeed, only 6.5% of the plots (44 out of 674) have at least one tree [20].
Observations in the site showed that residents who managed to grow trees in Penga Penga by planting them in locations of former household dumps or by using various types of organic and inorganic amendments such as soils from termite mounds (personal observations; [20]. Fruits and leaves can be directly consumed (fruits) or used for healthcare in traditional medicine (leaves). Numerous studies have shown risks of high trace metal concentrations due to the consumption of fruits and leaves of trees harvested from trace metal-contaminated environments [21,22,5,23]. Results from previous studies did not highlight the risks of ingesting fruits and leaves harvested from trees established in Penga Penga. Nor did they highlight the conditions in the rhizospheres of the cultivated species and relate these to the concentrations in the parts consumed by the residents, including the effect of the amendments used.
In addition, WHO has established thresholds for the safe consumption of foods based on their trace metal concentrations [24]. In practice, it represents the maximum amount of trace metals that can be safely ingested by the population without any kind of intoxication or related health issues. In the context of high and multiple metal pollution in Penga Penga [10,19,7], recommendations need to be made on the amount of fruit and leaves that could be safely consumed by residents. The limits should also be identified in order to contribute to the implementation of technical itineraries favoring low metal accumulation in the aboveground organs. Indeed, the identification of factors determining metal accumulation in leaves and fruits of cultivated trees is crucial for the implementation of a long-term strategy and the reduction of human exposure [5,25,26].
In this context, the general objective of this paper is to evaluate if the tree planting protocols followed in Penga Penga influenced the trace metal content of fruits and leaves and hence consumer safety. The specific objectives were: i) to assess the conditions of concentrations and mobility of trace metals in the rhizosphere of the trees grown in Penga Penga, in comparison to an unpolluted district (Kalebuka), ii) to determine the accumulation of metals in the fruits and leaves of Mangifiera indica and Syzygium guineense and iii) to recommend the amounts to be safely consumed by residents. The results obtained from this study are needed for the establishment of itineraries allowing the production of fruits and leaves limiting the accumulation of metals and reducing the risks of contamination of the food chain.

2. Materials and Methods

2.1. Study sites.

The study was carried out in two districts of Lubumbashi (Figure 1): Penga Penga and Kalebuka. They are both located in the south of Lubumbashi and are relatively the same age (around 20 years). They result from the "anarchic" extension of Lubumbashi and its huge demographic growth observed since the first decade of the 21st century. Unfortunately, Penga Penga is located in an area polluted by the former emissions from the Gécamines Copper Smelter, with total metal concentrations (mg.k-1) of the order of: Cd=6.5-8.5; Co=109-384; Cu=3524-50000; Pb=249-2657 and Zn=290-5900 accompanied an acid pH (4.6-5.5) 5900 [27]. Kalebuka is located in the opposite direction where the influence of fumes from smelter has been much lower. Table 1 presents the trace metal concentrations (after extraction with ammonium acetate + EDTA) in the surface soil of the two districts.
Lubumbashi is characterized by a climate that alternates a rainy season (November to April) and a dry season (May to October). The average annual rainfall is around 1200 mm while the average annual temperature is 20°C with lower temperatures in the first part of the dry season (5-16.5°C at night) and maximum temperatures recorded in October (33 to 39°C).
A former study [20] shows greater density and diversity of trees in Kalebuka compared to Penga Penga. However, the most abundant fruit tree species in both areas are mango (Mangifera indica L.), avocado (Persea americana L.), and guava (Psidium guajava L.). Syzigium guineense is the most frequent native woody species in both districts, although the number of individuals remains very low compared to the exotic species [20].
Observations in both settlements showed that planting had mainly been done in holes amended with household wastes. However, Mwanasomwe [20] reported that people in Penga Penga used a greater variety of amendments and larger holes than those in Kalebuka. The size of planting holes in plots where the trees have good vigor is more than one square meter wide and 50 to 100 cm deep in Penga Penga. Trees considered were at least ten years old.

2.2. Soil and plant sampling

Soil samples were collected from the rhizospheres of M. indica and S. guineense in Penga Penga and Kalebuka. In each district, samples were taken from the rhizosphere of 15 individuals of each of the two species, for a total of 30 samples per district and 60 soil samples for the whole study. At each sample point, four samples were collected 0-20 cm depth within a distance of 1 m to the tree trunk. These four samples were carefully mixed to produce a composite sample. The collected samples were placed in polythene bags, labeled, and dried at room temperature. They were then crushed and sieved through a 2 mm sieve and sent to the laboratory for chemical analysis.
Leaf and fruit samples were taken from the same trees as the soil samples. Leaves were selected from those that showed no apparent signs of disease or pest attack. At least ten leaves were collected from each tree to make a composite sample. For the fruits, six to ten fruits were collected per tree to form a composite sample. As with the leaves, the fruits were selected from those that showed no apparent signs of disease or pest attack. A total of 30 leaves and 30 fruit composite samples of M. indica and S. guineense were collected from each district. They were washed with 1% alconox solution according to the protocol proposed by Faucon et al. [28]. They were then oven dried at 105°C for 24 hours, mixed, and ground.

2.3. Chemical analysis of plants and soil

Analyses were done at the laboratory of the Soil Water Exchange axis of Gembloux Agro Bio-Tech (Université de Liège, Belgium). The soil pH was measured potentiometrically in the supernatant with a glass electrode pH meter, after stirring 5g of soil in 50 ml of CaCl2 (0.01 M) solution for 2 hours and followed by centrifugation at 3000 rpm for 10 minutes. Total concentrations of Al, Fe, Ca, K, Mn, Cu, Pb, and Zn were determined by portable XRF using a Titan S2 (Bruker). The measurements of total Cd and Co concentrations were not satisfactory by XRF. Soluble concentrations were determined after extraction with CaCl2 0.01 M in the solution used for the measurement of pH after filtration through filter paper (595 ½). As, Cd, Co, Cu, Pb, and Zn were measured using an Agilent 5100 ICP-OES. The limits of detection (mg.kg-1) were 0.01 for As and Cd, 0.04 for Co and Cu, 0.06 Zn for, and 0.16 for Pb.
For plant samples, mineralization was carried out using 65% HNO3 and 75% HClO4. Concentrations of As, Cd, Co, Cu, Pb, and Zn were determined by atomic absorption spectrometry (AAS, VARIAN 220, Agilent Technologies, SANTA Clara, CA, USA) [29]. It should be noted that the pulp of the fruits of M. indica and S. guineense were not separated from the skin, as consumption by the population is with pulp.

2.4. Calculation of trace metal bioconcentration factors

The bioconcentration factor (BCF) considers the bioaccumulation of metals in plants and the concentration of trace elements in the soil. It was used for predicting the concentration of Cu, Pb, and Zn in the leaves and fruits of the targeted species [30,31]. It is calculated as follows [32]:
Bioconcentration factor = Ctissue of plants/Csoil
Where C plant tissue is the concentration of the metal leaves or fruits (mg kg-1) and Csoil is the concentration of the metal (the total concentration) in the soil (mg kg-1).

2.5. Determination of the safe weekly consumption (SWC)

The safe weekly consumption (SWC) was calculated on the basis of data available in the literature and the concentration values of trace metals in fruit. The calculations were made for a 60 kg person. The following formula was used for the calculation:
SWC = SWI x C
Where SWC = Safe weekly concentration (no health risk) of the food (fruit), SWI = Safe weekly intake of the metal (= amount of metal that can be ingested without health risk), and C = Concentration of the metal in the food (fruit).
The SWI value is obtained from values available in the literature, including recommendations from FAO and WHO [24] and from Pelkonen et al. [33]. These values are presented as tolerable consumption per day (PMTDI), per week (PTWI), or per month (PTMI). They have been recalculated on a weekly basis for consistency (Table 2).
Furthermore, the recommendations for the amount of fruit to be consumed per week are based on the most limiting elements, i.e. those for which the lowest SWC values have been observed.
The SWC was not calculated for mango and S. guineense leaves as they are not subject to direct consumption as a vegetable or salad but rather used for the preparation of teas for consumption in traditional medicine.

2.6. Statistical analysis

A normality test was applied to data on soil and plant parameters. As the distributions were not normal, even after box-cox transformations, the non-parametric test of Mann Whitney (MW) was applied to compare concentrations between Penga Penga and Kalebuka as well as between mango and S. guineense. For the comparison between the rhizosphere of the two species, the Mann-Whitney test was applied separately in each district. The proportion of values over the limit recommended by FAO and WHO (2016) for leaves and fruits was calculated by dividing the number of values over the limit by the total number of samples. All statistical analyses were performed using R Studio 3.1.

3. Results

3.1. Soil mineral composition in the tree rhizosphere

Ca concentration and pH were higher (P < 0.05) in the tree rhizosphere at Penga Penga compared to Kalebuka (Table 3). With the exception of Al2O3 (%) where there is a significant difference, there was no significant difference for, Fe2O3 (%), and K. As expected, total concentrations of As, Cu, Pb, and Zn were higher at Penga Penga. The average total Cu concentration was seven times higher at Penga Penga (1379 mg kg-1) compared to Kalebuka (189 mg kg-1).
However, it can be noted that the maximum values of total concentrations recorded at Kalebuka are also higher than the range of values reported for natural forest soils in the Lubumbashi region. Regarding soluble contents, Cu concentration was higher at Penga Penga (1.4 mg kg-1) compared to Kalebuka (0.7 mg kg-1). There were no significant differences for the other elements.
The MW test showed no significant difference between the rhizosphere of the two species for all the parameters within each district. However, there was a significant difference between rhizospheres and the surrounding soils at Penga Penga (not shown). Ca concentrations and pH were higher in the rhizospheres while As, Co, Cu, Pb, and Zn total concentrations were higher in the surrounding unamended soil.

3.2. Accumulation and bioconcentration factors of trace elements in plants in Penga Penga and Kalebuka

Interventionary studies involving animals or humans, and other studies that require ethical approval, must list the authority that provided approval and the corresponding ethical approval code.
Table 4 shows that trace metal concentrations were generally higher in leaves and fruits at Penga Penga compared to Kalebuka. As, Pb and Zn were in higher concentrations (P < 0.05) in the leaves of Penga Penga while there was no difference for Cd (both species) and Cu (S. guineense). All trace metals were in higher concentrations (P < 0.05) in fruits harvested at Penga Penga.
The MW test applied to each site separately shows varying trends. At Penga Penga, M. indica had higher concentrations (P < 0.01) of As, Cu, Co, Pb, and Zn in leaves and higher concentrations (P < 0.01) of Cd, Cu, and Pb in fruits. Fruits of S. guineense showed higher concentrations of Cd and Zn. In Kalebuka, M. indica had higher Cd concentrations in leaves and fruits. It also had higher concentrations of As and Zn in leaves. S. guineense had higher concentrations of Cu in leaves and fruits.
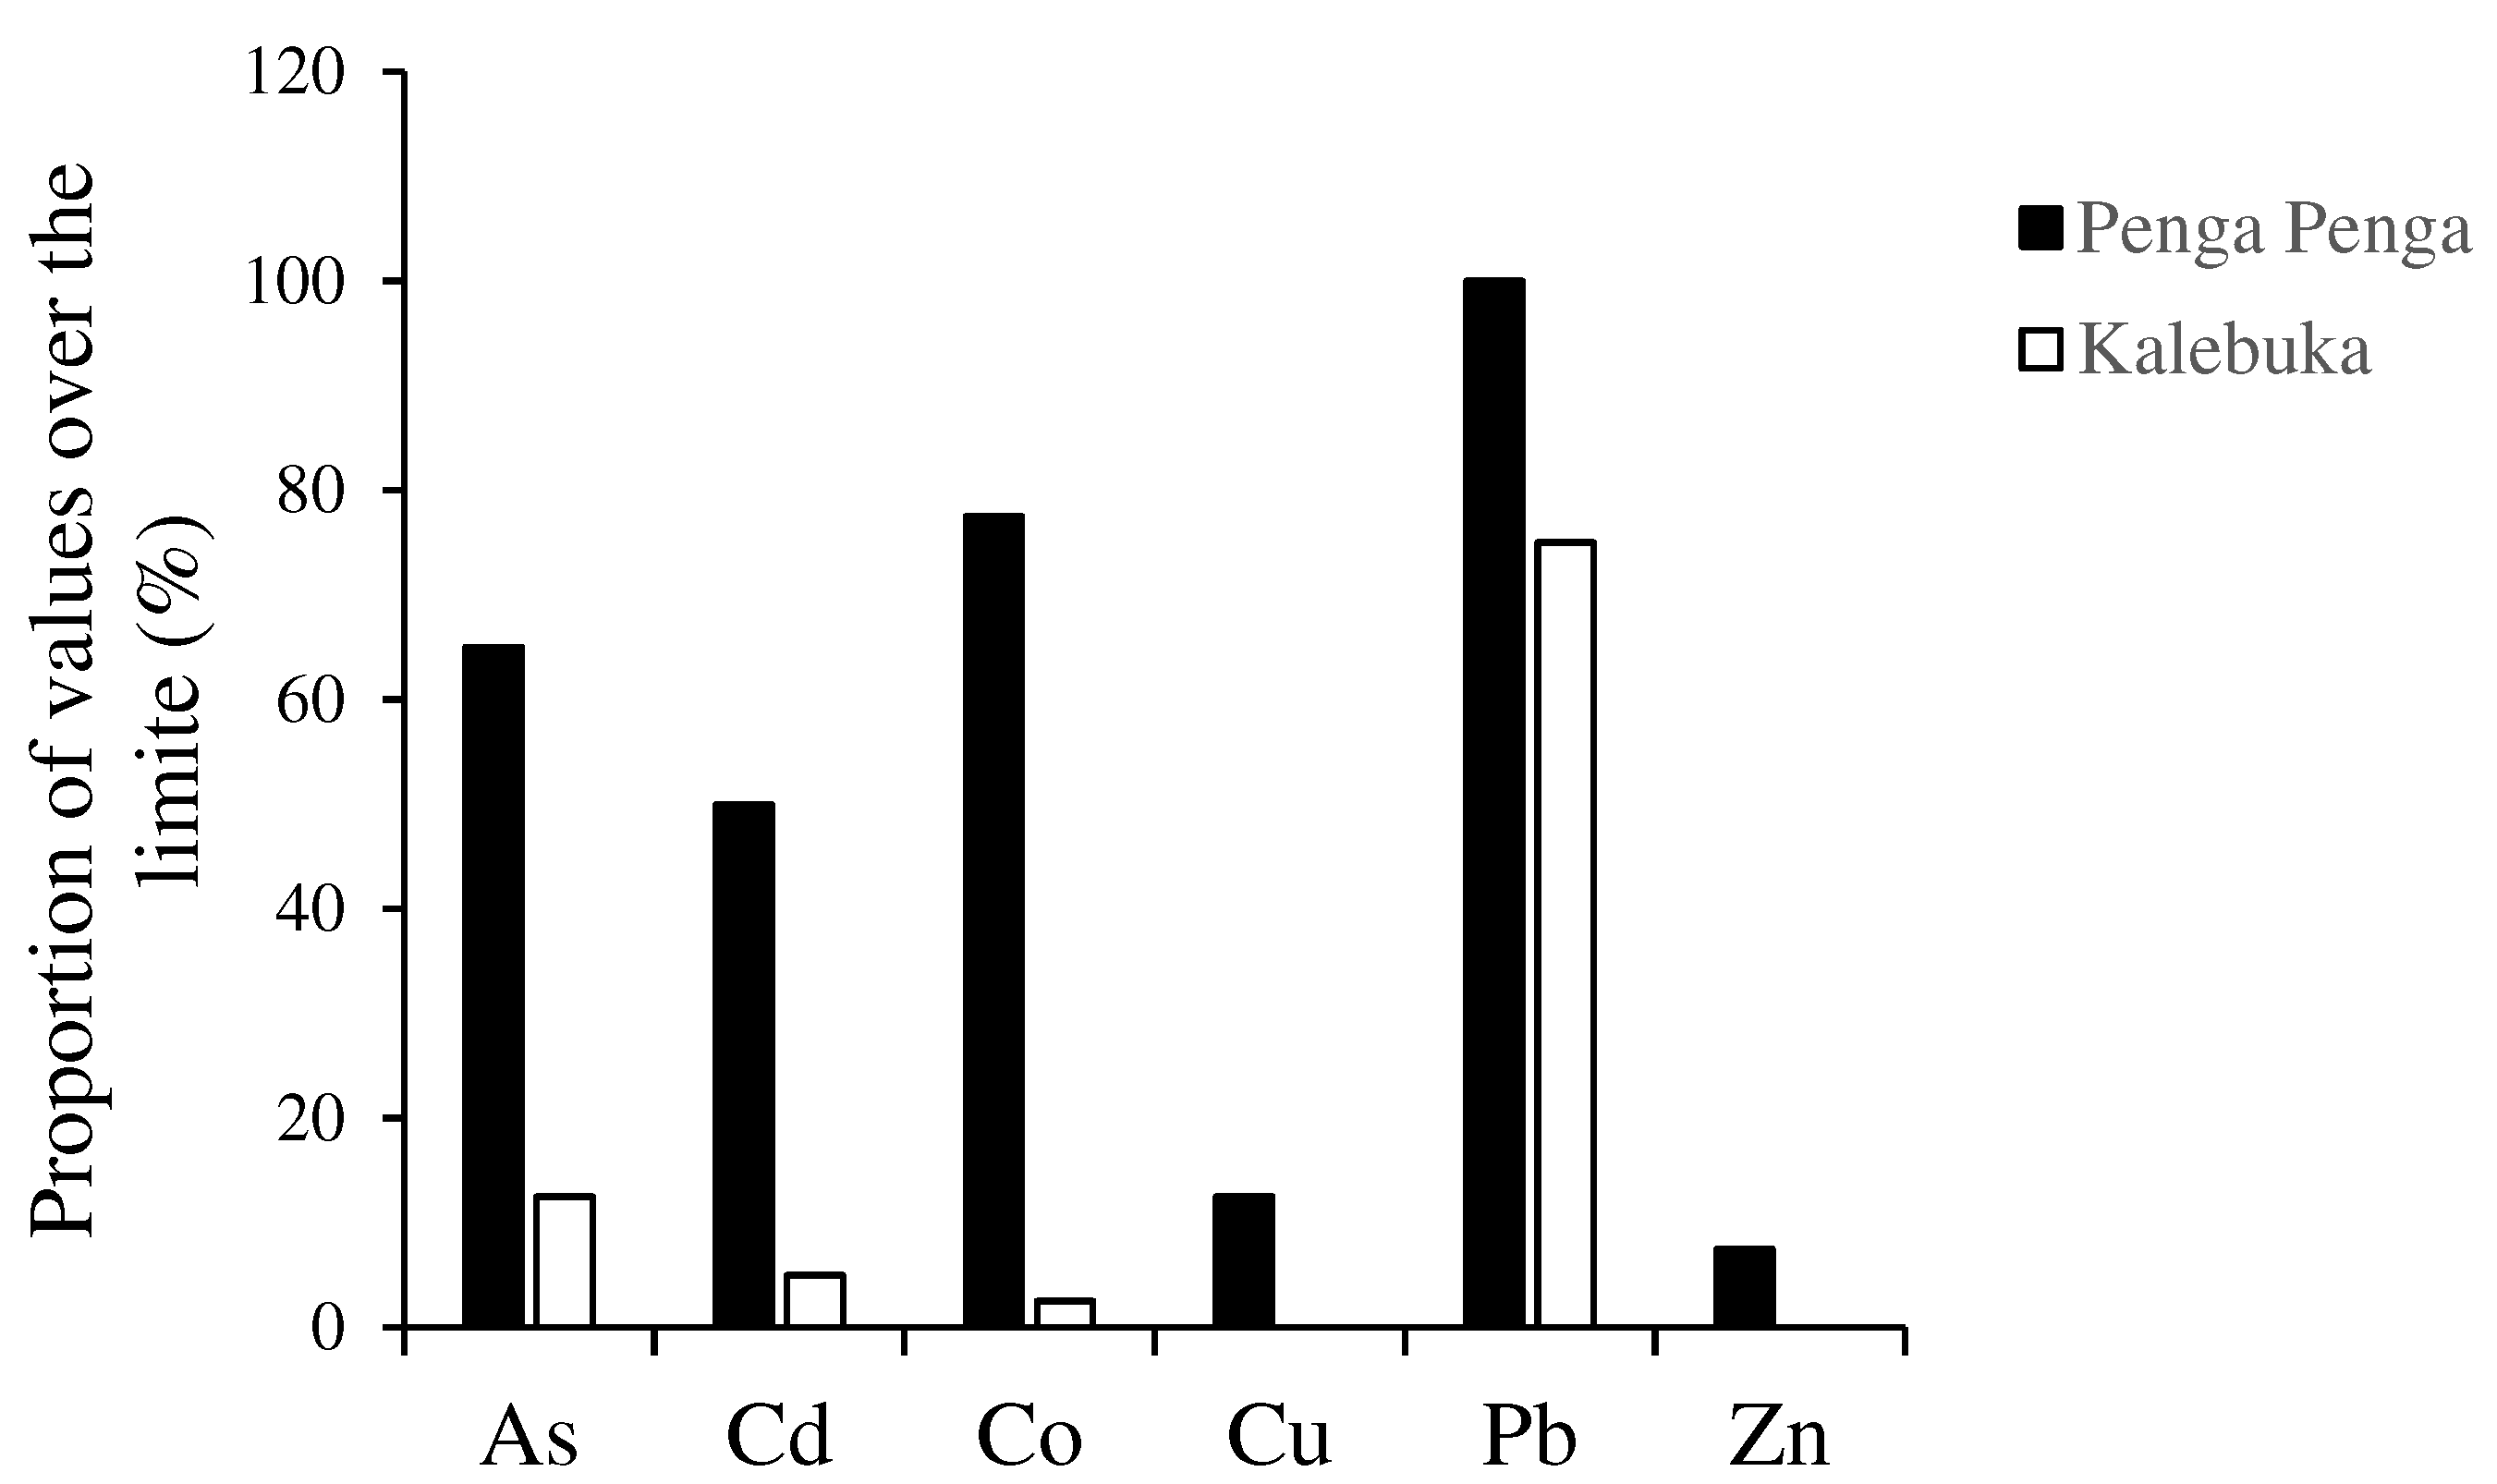
The results also show that 47% of the concentration values recorded in Penga Penga were above the FAO and WHO limits vs only 18.5% in Kalebuka. The highest proportion of values above the limit was recorded with Pb (in both districts) (Figure 2). All Pb concentration values recorded in Penga Penga (leaves and fruits) were above the FAO and WHO limits (0.03 mg kg-1). In Kalebuka, all Pb values in leaves and 50% of the concentration values in fruits are above the limit. Zn and Cu were the two trace metals with the lowest proportions of values above the recommended limit. Only 7.5% and 12.5% of the Zn and Cu concentrations were above the limit at Penga Penga while all values of these two trace metals were below the limit in Kalebuka.
Interventionary studies involving animals or humans, and other studies that require ethical approval, must list the authority that provided approval and the corresponding ethical approval code.
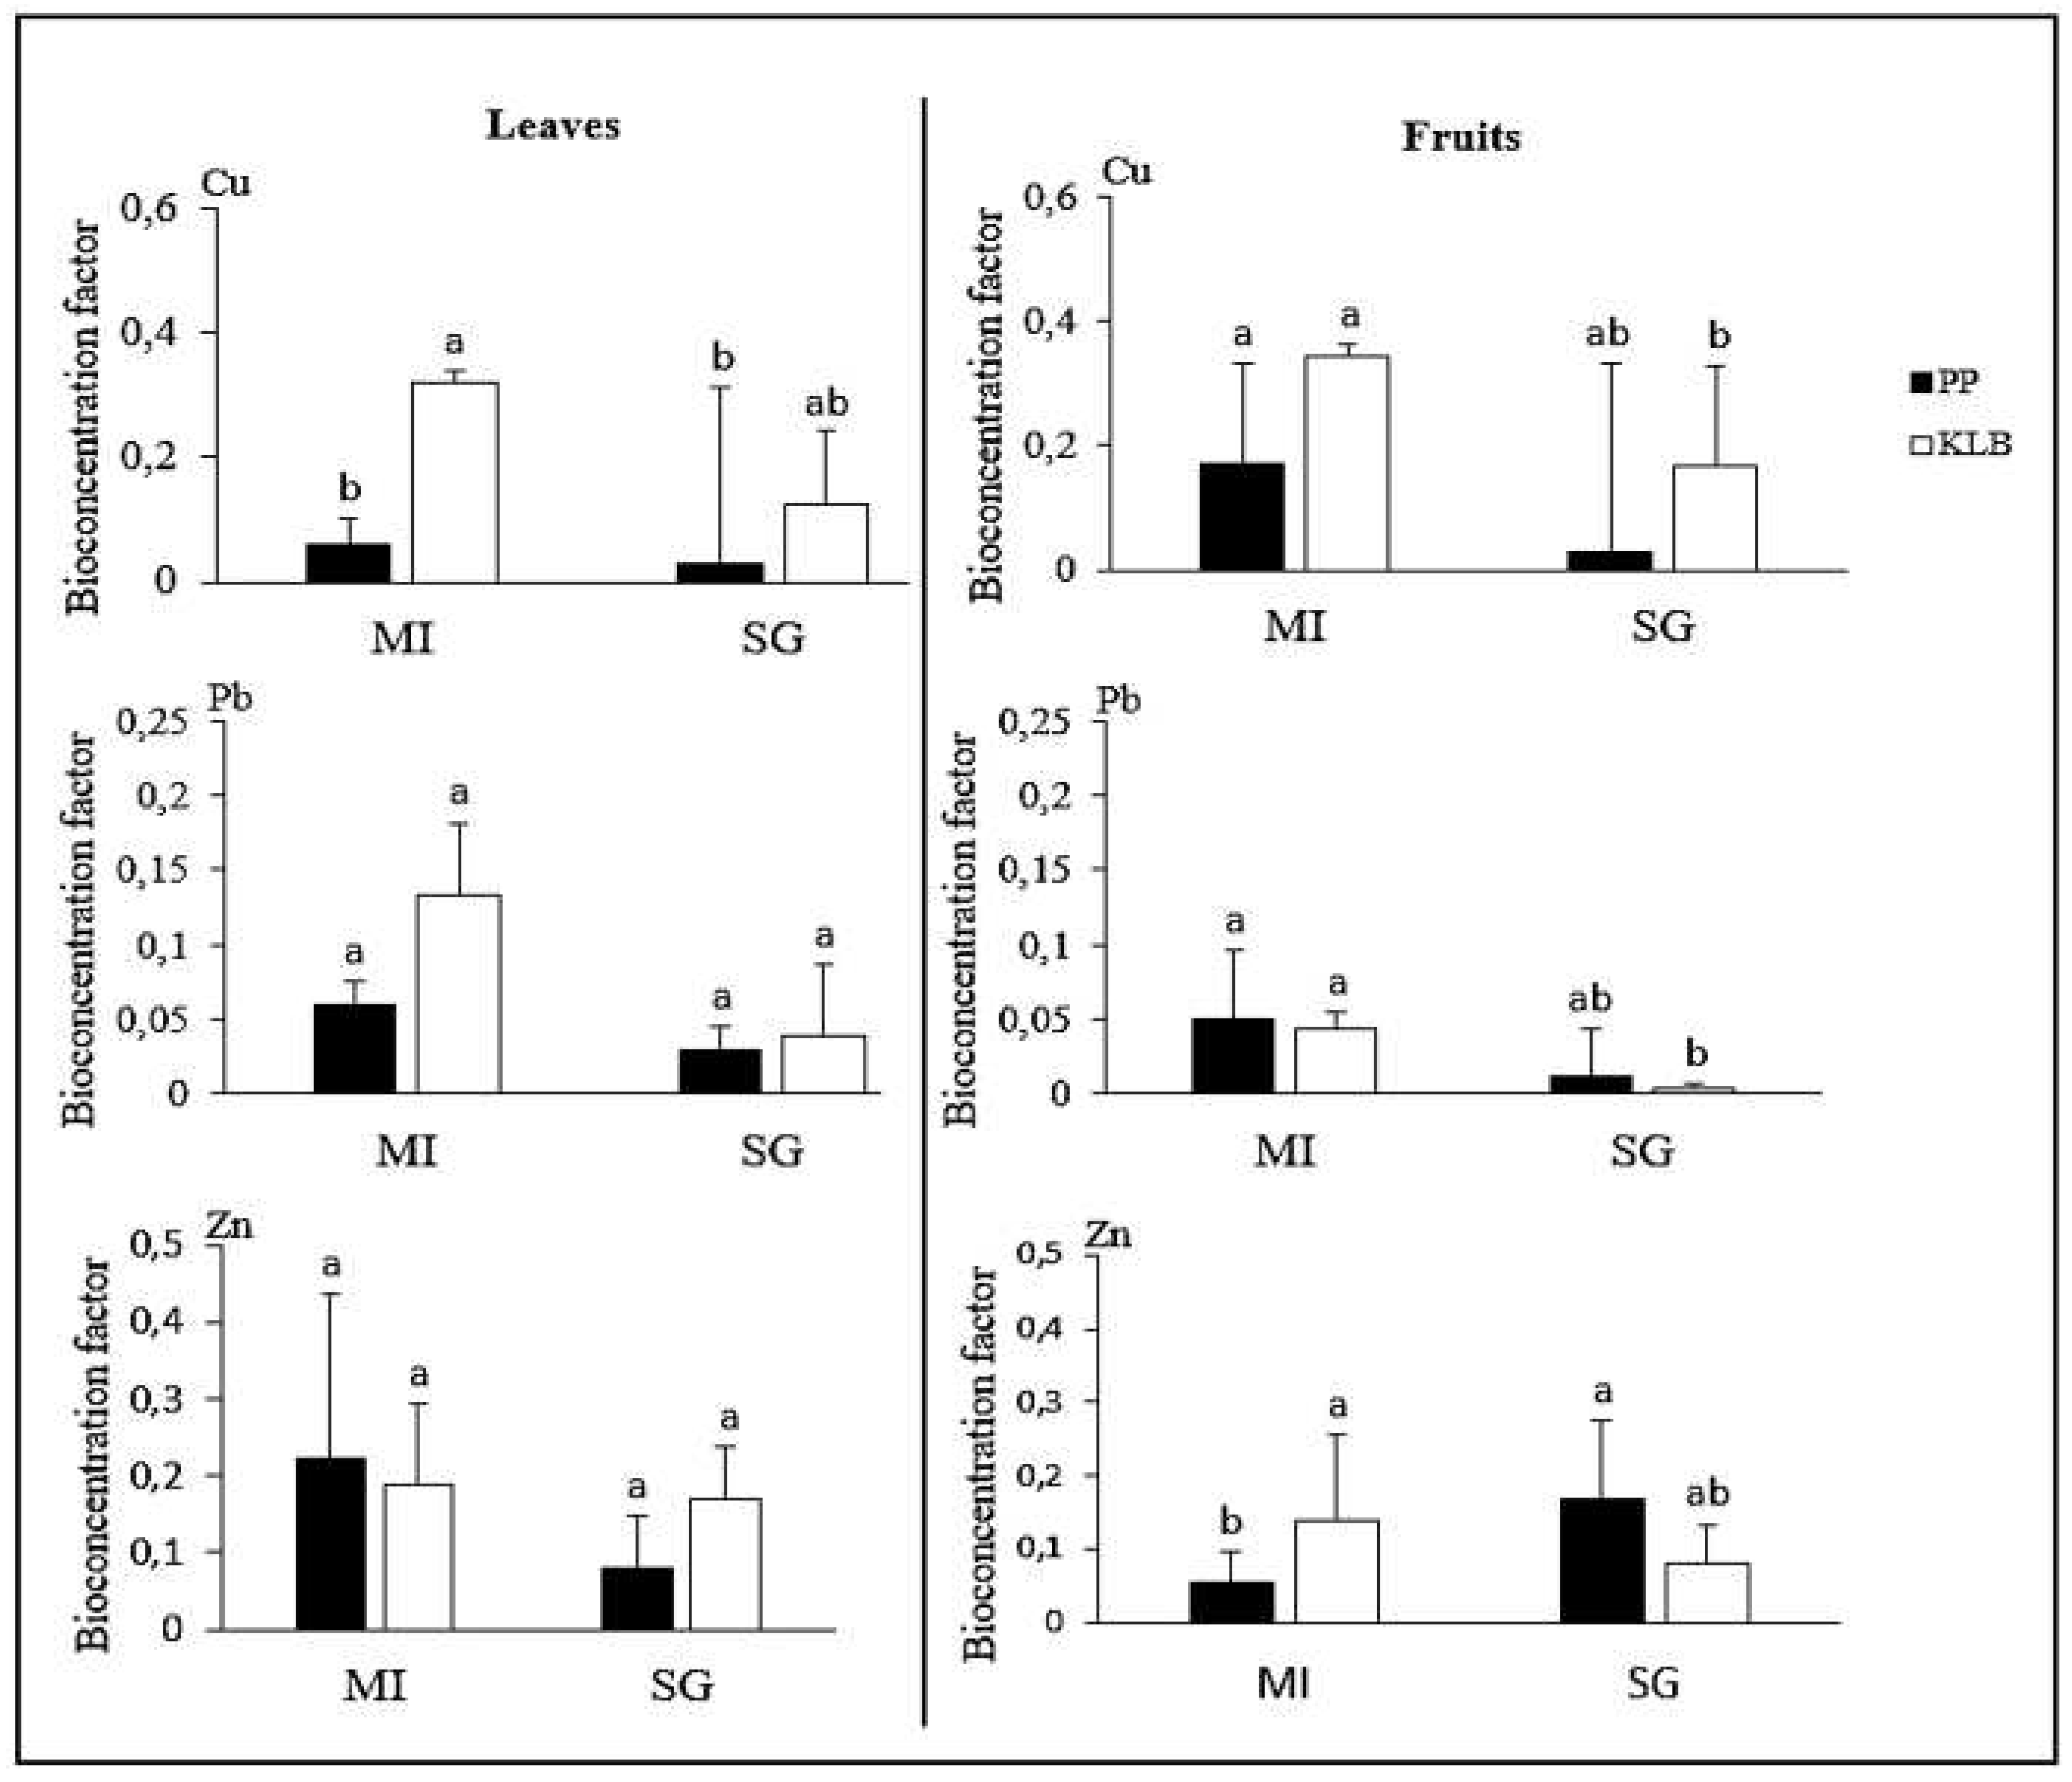
All bioconcentration factor values (leaves and fruits) were below 1 in both districts (Figure 3). In general, it can be seen that BCFs were higher in Kalebuka compared to Penga Penga. For Cu, the BCF values for leaves and fruits were always higher in Kalebuka. With the exception of M. indica in leaves and S. guineense in fruits, whose BCFs are slightly higher for Zn in Penga Penga. BCF values are similar for all species and in both sites for Pb.

3.3. Safe weekly consumption (SWC)

Interventionary studies involving animals or humans, and other studies that require ethical approval, must list the authority that provided approval and the corresponding ethical approval code.
Table 5 presents the results of the calculation of the safe weekly consumption of fresh fruits for a 60 kg person according to the SWC of each metal. Consistent with the concentration values in the fruit, SWC values are generally higher in Kalebuka compared to Penga Penga. However, the results show that the limiting elements for fruit consumption of two species at Penga Penga are Pb (for mango) and Cd (for S. guineense). These two trace metals limit the average consumption of mango flesh (including the skin) to 9 kg per week and S. guineense fruit to 6.6 kg per week.
In Kalebuka, the results recommend average consumptions of 68 and 78 kg per week of S. guineense and mango fruits respectively, and according to Co and Cu.

4. Discussion

4.1. Trace metal concentration in the tree rhizosphere

As expected, the results showed higher trace metal concentrations in the rhizosphere at Penga Penga compared to Kalebuka (Table 3). The deposition of trace metal-rich particles contained in the smoke emitted by the smelter chimney of the Gécamines plants in Lubumbashi explains the high concentrations observed in Penga Penga [19,27], as the study area is located in the pollution cone under the influence of the prevailing winds [12]. However, it can be seen that the samples collected from the rhizosphere present contrasting conditions compared to those reported for the surrounding soils (Table 1). Firstly, it can be noted that pH values are much higher in the soils collected from the rhizospheres of the two species (pH ranging from 6.7 - 7.7) compared to the conditions of the unamended Penga Penga soils (pH in the range of 4.2 - 5.5) as reported in previous studies [19,7,34]. This is most likely explained by the use of amendments with neutralizing properties such as termite mound soil [35]. The high calcium concentration observed from the rhizosphere supports this hypothesis due to the well-known action of Ca oxides and hydroxides on increasing pH values [36,37]. Shutcha et al. [19] already reported higher pH values in soil samples collected under Microchloa altera populations established on former landfill sites as well as under Setaria pumila populations established on former stripped termite mounds at Penga Penga. Secondly, total trace metal concentrations were found to be lower than in the surrounding unamended soil at Penga Penga. Indeed, total concentrations above 50,000 mg kg-1 are recorded in Penga Penga whereas in the rhizosphere the maximum was below 4800 kg-1 (Table 3). Nevertheless, it can be seen that the concentrations of metals in the rhizosphere at Penga Penga remain very high (on average 6 times higher) compared with references in the region [7]. This can be explained by two reasons: the high concentrations of trace metals in the amendments used and/or a lateral diffusion of metals from the surrounding soils to the rhizospheres. Indeed, residents of Penga Penga use a wide range of soil amendments when planting trees to ensure their survival and performance [20], personal observations), including termite mound soils. However, high concentrations of metals have been reported in the surface soils of termite mounds located at Penga Penga [38,19]. Regarding metal transfer from surrounding soils, Mwanasomwe et al. [39] reported similar trends from tree plantations installed on tailings at the Kipushi hydrometallurgical plant (30 km south of Lubumbashi). Other studies have reported these phenomena which are attributed to water movements and subsequent diffusion of mineral elements in soils [40]. This result demonstrates the value of long-term monitoring of plantations established on soils enriched in trace metals since it indicates enrichment of rhizosphere over the years.
Finally, it was very interesting to note the low proportion of soluble trace metal fractions (extractable with CaCl2 0.01 M) in the rhizospheres of both species at Penga Penga, with Pb and Zn values similar to those observed at Kalebuka (Table 3). This low availability of trace metals is most likely due to the well-known action of organic matter, pH, and Ca on the reduction of metal mobility [36,37,41]. The similar or lower BCF values recorded at Penga Penga compared to Kalebuka (Figure 3) support the hypothesis of reduced trace metal removals from tree rhizospheres at Penga Penga.
The results on rhizosphere conditions support the use of mineral and organic amendments to ensure successful tree planting at Penga Penga. They also support the need for long-term monitoring of metal concentrations after tree establishment to ensure the production of healthy fruit.

4.2. Metal accumulation in leaves and fruits

Authors should discuss the results and how they can be interpreted from the perspective of previous studies and of the working hypotheses. The findings and their implications should be discussed in the broadest context possible. Future research directions may also be highlighted.
As expected, trace metal concentrations were generally higher in leaves and fruits harvested from Penga Penga compared to Kalebuka (Table 4) and can be explained by higher trace metal exposure as demonstrated in many woody species [42,23]. However, the concentration gaps are not proportional to those in the rhizospheres (Kalebuka vs Penga Penga, see Table 3). For example, Cu concentration was seven times higher in the rhizosphere at Penga Penga compared to Kalebuka while it was similar in S. guineense leaves and 1.3 to 1.7 times higher in mango leaves and fruits of both species (Table 4). As mentioned above, the use of amendments in the rhizosphere of plants in Penga Penga may explain the low concentrations in leaves and fruits. This hypothesis is supported by the BCF values (Figure 3) which were generally similar between the two districts despite the higher total concentrations on metals in the rhizosphere at Penga Penga. Indeed, variations in BCF as a function of ecological conditions are documented [43] and would express, in the case of this study, exposure to different mobile concentrations of trace metals. In this context, the application of organic and mineral amendments would therefore be recommended to reduce metal accumulation in mango and S. guineense leaves and fruits in Penga Penga.
The results obtained also show an influence of the species on the accumulation of trace metals. Nevertheless, no clear trends emerged, except for As and Zn which seem to be accumulated in higher concentrations in mango leaves irrespective of the site. Future investigations should be undertaken to better identify trends as this result may be important for the selection of trees to be grown according to organ consumption needs [44]. Furthermore, Cu and Zn were accumulated in higher concentrations regardless of species. This is most likely due to their higher concentrations in the polluted soil of Penga Penga [10,19] but also in Kalebuka, as soils in the area have naturally higher concentrations of these two metals compared to the global average [7,20].

4.3. Human exposure and safe weekly consumption

Consistent with the concentration values in soils and plants, the results showed a higher proportion of values above the FAO and WHO limits in Penga Penga (Figure 2). In this case, the consumption of mango and S. guineense fruits and leaves may constitute an additional factor of exposure to trace metals, as already reported for other plant products in the region [45,5,46]. Nevertheless, calculations from the SWC showed that the consumption of S. guineense fruit is limited to 6.6 by the Cd concentration while it is limited to 9 kg per week for mango flesh (+ skin) by the Pb concentration (Table 5). These results led to two main conclusions. Firstly, these results show that it is not the most abundant elements in the polluted soil that would be the most problematic in the context of Penga Penga but rather those that have a greater weight in terms of a health risk as they are capable of causing serious diseases at low concentrations, as is the case for Cd and Pb [47,48,49]. Secondly, the recommended values of SWC are significant quantities, especially when considering that the average mango weight is 0.3 to 0.4 kg (whole mango, kernel representing 10%) and the mean consumption is varying from 2-3 mangoes from the resident during the production period (September to December) (personal observations). It can therefore be considered that the Penga Penga residents could safely consume mangoes within the limits proposed by the present study, as consumption of such a quantity does not represent a risk of intoxication if we consider the daily intake of the elements in the other nutrients. Furthermore, studies have reported a higher accumulation of trace metals in the skin of fruits, and mango in particular [50,51,52,52]. It would therefore be possible to increase the SWC value and recommend consumption quantities by removing the mango skin before consumption of the flesh. This would be a highly recommended change of habit for the residents of Penga Penga.
With regard to leaves, their use in traditional medicine mixtures requires a more flexible interpretation. Indeed, the leaves of mango and S. guineense are not directly consumed after harvesting but rather subjected to boiling in order to migrate the desired active principles into the solution [53,54,55,56]. It is the leaf tea of these two species that is consumed for processing. In this context, although the FAO and WHO limited values provide an indication of the quality of the leaves produced, it would be awkward to propose safe consumption amounts. It would be preferable for future assessments to analyze the trace metal concentrations in the leaf teas of both species. In this way, more relevant recommendations could be suggested. However, the metal accumulation values in the leaves provide an idea of the exposure hazard and support the need for appropriate soil treatment to reduce the transfer of trace metals to the leaves.

5. Conclusions

This study highlighted the soil mineral compositions in the rhizosphere of mango and S. guineense trees and their relative trace metal accumulation in leaves and fruits in the residential households of trace metal-polluted soil from Penga Penga in comparison to Kalebuka, a non-polluted district. Furthermore, it provides recommendations on the amount of fruits that could be consumed safely by the residents. Results are encouraging for establishing fruiting trees in Penga Penga as they demonstrate the positive impact of the planting protocol on the reduction of metal translocation in leaves and fruits. However, as almost fifty percent of samples from Penga Penga exceeded the FAO and WHO threshold values, it is suggested that agronomic practices should be improved to enhance the reduction of metal translocation in above-ground organs. In addition, it is recommended to test the removal of skin on the SWI.

Acknowledgments

The authors are grateful to the Academy of Research and Higher Education (ARES) through the Zorglub Project for the financial means made available. Serge is a research fellow in the Zorglub project. We also thank Natchik Muhigirwa Jean for his invaluable assistance in data collection.

Conflicts of Interest

“The authors declare that the research was conducted in the absence of any commercial or financial relationships that could be construed as a potential conflict of interest”.

References

  1. Mbenza, M., Aloni, K., Muteb, M. Some considerations on air pollution in Lubumbashi (Shaba, Zaire). Geo-eco-trop, 1989, 13 (1-4), 113-125.
  2. Mees, F., Masalehdani, M.N.N., De Putter, T., D'Hollander, C., Van Biezen, E., Mujinya, B.B., Potdevin, J.L., Van Ranst, E. Concentrations and forms of heavy metals around two ore processing sites in Katanga, Democratic Republic of Congo. J.Afr.Earth Sci. 2013, vol. 77,22-30. [CrossRef]
  3. Atibu, E.K., Devarajan, N., Thevenon, F., Mwanamoki, P.M., Tshibanda, J.B., Mpiana, P.T., Prabakar, K., Mubedi, J.I., Wildi, W., Poté, J. Concentration of metals in surface water and sediment of Luilu and Musonoie Rivers, Kolwezi-Katanga, Democratic Republic of Congo. Appl. Geochem. 2013, vol. 39, 26-32. [CrossRef]
  4. Muhaya, B. B., Kunyonga, C. Z., Mulongo, S. C., Mushobekwa, F. Z., & Bisimwa, A. M. Trace metal contamination of sediments in Naviundu river basin, Luano and Ruashi rivers, and Luwowoshi spring in Lubumbashi city, Democratic Republic of Congo. J. Environ. Sci. Eng. 2017, 6(9), 456-464.
  5. Muimba-Kankolongo, A., Banza Lubaba Nkulu, C., Mwitwa, J., Kampemba, F.M., Mulele Nabuyanda, M., Haufroid, V., Smolders, E., Nemery, B. Contamination of water and food crops by trace elements in the African Copperbelt: A collaborative cross-border study in Zambia and the Democratic Republic of Congo. 2021, Environ. Adv., vol. 6,100103. [CrossRef]
  6. Pourret, O., Lange, B., Bonhoure, J., Colinet, G., Decrée, S., Mahy, G., Séleck, M., Shutcha, M., Faucon, M.-P. Assessment of soil metal distribution and environmental impact of mining in Katanga (Democratic Republic of Congo). 2016, Appl. Geochem., 64, 43-55. [CrossRef]
  7. Shutcha, M.N.; Mukobo RP.; Muyumba K.D.; Mpundu M.M.; Faucon M P.; Lubalega K. T.; Ludovic A.; Annabelle J.; Vandenheede N.; Pourret O.; Michel Ngongo L.M.; Colinet G. Fond pédogéochimique et cartographie des pollutions des sols à Lubumbashi, in Anthropisation des paysages Katangais, Presses Universitaires de Liége-Agronomiqe Gembloux., Bogaert J., Gilles C. & Gregory M., 2018, 215-218.
  8. Mpinda, M.T., Mujinya, B.B., Mees, F., Kasangij, P.K., Van Ranst, E. Patterns and forms of copper and cobalt in Macrotermes falciger mounds of the Lubumbashi area, DR Congo. 2022, J. Geochem. Explor. 2022, 238, 107002. [CrossRef]
  9. Leblanc et Malaisse, F. Lubumbashi, un écosystème urbain tropical, Université nationale du Zaire, 1978.
  10. Mpundu Mubemba M. Contaminations des sols en éléments traces métalliques à Lubumbashi (Katanga/R.D. Congo). Évaluation des risques de contamination de la chaîne alimentaire et choix de solutions de remédiation. Thèse de doctorat. Faculté des Sciences Agronomiques, Université de Lubumbashi, Lubumbashi (RDC), 2010.
  11. Shutcha, M.N., Mubemba, M.M., Faucon, M.-P., Luhembwe, M.N., Visser, M., Colinet, G., Meerts, P. Phytostabilisation of Copper-Contaminated Soil in Katanga: An Experiment with Three Native Grasses and Two Amendments. 2010, Int. J. Phytoremediation, vol. 12, no 6, 616-632. [CrossRef]
  12. Munyemba, K.F. Quantification et modélisation de la dynamique paysagère dans la région de Lubumbashi : évaluation de l’impact écologique des dépositions issues de la pyrométallurgie. Thèse de doctorat. Faculté des Sciences Agronomiques, Université de Lubumbashi, Lubumbashi (RDC). 2010, p. 284.
  13. Munyemba, K., Bamba, I., Djibu, K.J.P., Amisi, M., Veroustraete, F., Ngongo, L.M., Bogaert, J. Occupation des sols dans le cône de pollution `à Lubumbashi. Presses Universitaires de Lubumbashi. 2008, Ann Fac Sc Agro. 1(2): 19–22.
  14. Banza, C.L.N.; Nawrot, T.S.; Haufroid V.; Decree S.; De Putter T.; Smolders E.; Kabyla B.I.; Luboya O.N.; Ilunga A.N.; Mutombo A.M.; Nemery B. 2009. High human exposure to cobalt and other metals in Katanga, a mining area of the Democratic Republic of Congo. Environ Res. 2009, 109 :745–752. [CrossRef]
  15. Cheyns, K.; Banza, C. L. N.; C., Ngombe L.K.; Asosa, J.N.; Haufroid V.; De Putter, T.; Nawrot, T.; Kimpanga, C.M.; Numbi, O.L.; Ilunga, B.K.; Nemery, B.; Smolders, E. Pathways of human exposure to cobalt in Katanga, a mining area of the D.R. Congo », Sci. Total Environ., 2014, 490,313-321. [CrossRef]
  16. Mukendi, R. A. M.; Banza C. L. N.; Mukeng C. A. K.; Ngwe J. T. M.; Mwembo A. N. A. N.; Kalenga P. M. K. Exposition de l’homme aux éléments tracés métalliques et altération du sperme : étude menée dans les zones minières du Haut-Katanga en République Démocratique du Congo, Pan Afr. Med. J., 2018, 30. [CrossRef]
  17. Nkuku C. & Rémon M. Stratégies de survie à Lubumbashi (RD Congo). Enquête sur 14000 ménages urbains. Mémoires lieux de savoir : Archive congolaise, Harmattan, Paris, 2006.
  18. INS. Annuaire statistique. Ministère de plan et de la révolution de la modernité & PNUD, RD Congo, 2014, p560.
  19. Shutcha, M.N., Faucon, M.-P., Kamengwa Kissi, C., Colinet, G., Mahy, G., Ngongo Luhembwe, M., Visser, M., Meerts, P. Three years of phytostabilisation experiment of bare acidic soil extremely contaminated by copper smelting using plant biodiversity of metal-rich soils in tropical Africa (Katanga, DR Congo) », Ecol. Eng. 2015, 82, 81-90. [CrossRef]
  20. Mwanasomwe, K.L. Amélioration du procédé de phytostabilisation avec les espèces ligneuses pour la production des services écosystémiques en milieux pollués urbains et périurbains de l’arc cuprifère Katangais. Thèse de doctorat, Gembloux Agro Bio-Tech, Université de Liège. Belgique. 2022, p217.
  21. Säumel, I., Kotsyuk, I., Hölscher, M., Lenkereit, C., Weber, F., Kowarik, I. How healthy is urban horticulture in high traffic areas? Trace metal concentrations in vegetable crops from plantings within inner city neighbourhoods in Berlin. Germany. Environ. Pollut., 2012, 165, 124-132. [CrossRef]
  22. Cao, L.T.T., Bourquin, L.D. Relationship of Arsenic and Lead in Soil with Fruit and Leaves of Apple Trees at Selected Orchards in Michigan. J. Food Prot., 2020, 83, 6, 935-942. [CrossRef]
  23. Liu, G., Chen, T., Cui, J., Zhao, Y., Li, Z., Liang, W., Sun, J., Liu, Z., Xiao, T. Trace Metal(loid) Migration from Road Dust to Local Vegetables and Tree Tissues and the Bioaccessibility-Based Health Risk: Impacts of Vehicle Operation-Associated Emissions », Int. J. Environ. Res. Public. Health, 2023, 20, 3, 2520. [CrossRef]
  24. 24. FAO and WHO. CF/10 INF/1. Working document for information and use in discussions related to contaminants and toxins in the GSCTFF. http://www.fao.org/fao-who-codexalimentarius, file: cf10_INF1e.pdf. 2016, p150.
  25. Tauqeer, H.M., Turan, V., Iqbal, M. Correction to: Production of Safer Vegetables from Heavy Metals Contaminated Soils: The Current Situation, Concerns Associated with Human Health and Novel Management Strategies, in Advances in Bioremediation and Phytoremediation for Sustainable Soil Management, J. A. Malik, Éd., Cham: Springer International Publishing, 2022, C1-C1. [CrossRef]
  26. Kavusi, E., Shahi Khalaf Ansar, B., Ebrahimi, S., Sharma, R., Ghoreishi, S.S., Nobaharan, K., Abdoli, S., Dehghanian, Z., Asgari Lajayer, B., Senapathi, V., Price, G.W., Astatkie, T. Critical review on phytoremediation of polyfluoroalkyl substances from environmental matrices: Need for global concern », Environ. Res., 2023, 217, 114844. [CrossRef]
  27. Langunu, S. 2022. Efficacité à long terme d’une phytostabilisation assistée in situ sur un sol fortement contaminé par les éléments traces métalliques à Lubumbashi. Mémoire d’études approfondie. Faculté des sciences Agronomiques, Université de Lubumbashi. RD Congo. 2022, p 65.
  28. Faucon, M. P., Shutcha, M. N., & Meerts, P. Revisiting copper and cobalt concentrations in supposed hyperaccumulators from SC Africa: influence of washing and metal concentrations in soil. Plant Soil, 2007, 301, 1-2, 29-36. [CrossRef]
  29. Miller, D. A., and White, R. A. A Conterminous United States Multilayer Soil Characteristics Dataset for Regional Climate and Hydrology Modeling. Earth Interact., 1998, 2, 2, 1-26. [CrossRef]
  30. Maiti, S. K., Kumar, A. and Ahirwal, J. Bioaccumulation of metals in timber and edible fruit trees growing on reclaimed coal mine overburden dumps, Int. J. Min. Reclam. Environ., 2016, 30, 3, 231-244. [CrossRef]
  31. Ali, H., Khan, E., Sajad, M.A. Phytoremediation of heavy metals—Concepts and applications », Chemosphere, 2013, 91, 7, 869-881, mai 2013. [CrossRef]
  32. Yang, Y.; Liang, Y.; Ghosh, A.; Song, Y.; Chen, H.; Tang, M. Assessment of arbuscular mycorrhizal fungi status and heavy metal accumulation characteristics of tree species in a lead–zinc mine area: potential applications for phytoremediation, Environ. Sci. Pollut. Res., 2015, 22, 17, 13179-13193. [CrossRef]
  33. Pelkonen, R., Alfthan, G., Järvinen, O. Element Concentrations in Wild Edible Mushrooms in Finland. The Finnish Environment. 2008, 25:1-42. http://hdl.handle.net/10138/38380.
  34. Muyumba, K. D. ; Olivier P. ; Amandine L. ; Michel-P F. ; Gregory M.; Michel NL.; Gilles, C. Évaluation expérimentale de la phytodisponibilité du cuivre et du cobalt dans les sols des écosystèmes métallifères de l’Arc cuprifère katangais, in Anthropisation des paysages Katangais, Presses Universitaires de Liége-Agronomiqe Gembloux., Gembloux: Bogaert J., Gilles C. & Gregory M, 2018, 192-213.
  35. Mujinya, B.B., Van Ranst, E., Verdoodt, A., Baert, G., Ngongo, L.M. Termite bioturbation effects on electro-chemical properties of Ferralsols in the Upper Katanga (D.R. Congo), Geoderma, 2010, 158, 3-4, 233-241. [CrossRef]
  36. Hale, B., Evans, L., Lambert, R. Effects of cement or lime on Cd, Co, Cu, Ni, Pb, Sb and Zn mobility in field-contaminated and aged soils, J. Hazard. Mater., 2012, 199-200, 119-127. [CrossRef]
  37. Tang, J., Cao, C., Gao, F., Wang, W. Effects of biochar amendment on the availability of trace elements and the properties of dissolved organic matter in contaminated soils, Environ. Technol. Innov., 2019, 16,100492. [CrossRef]
  38. Lubalega K.T. Metal contamination and termite mounds around Lubumbashi. DEA thesis, University of Lubumbashi, DR Congo p55, 2009.
  39. Mwanasomwe, J. K., Langunu, S., Shutcha, M. N., Colinet, G. Effects of 15-Year-Old Plantation on Soil Conditions, Spontaneous Vegetation, and the Trace Metal Content in Wood Products at Kipushi Tailings Dam, Front. Soil Sci., 2022, 2, 934491. [CrossRef]
  40. Simon, L. Potentially Harmful Elements in Agricultural Soils, in PHEs, Environment and Human Health, C. Bini et J. Bech, Éd., Dordrecht: Springer Netherlands, 2014, 85-150. [CrossRef]
  41. Adamczyk-Szabela, D., Wolf, W.M. The Impact of Soil pH on Heavy Metals Uptake and Photosynthesis Efficiency in Melissa officinalis, Taraxacum officinalis, Ocimum basilicum, Molecules, 2022, 27,15, 4671. [CrossRef]
  42. Podar, D., Maathuis, F.J.M. The role of roots and rhizosphere in providing tolerance to toxic metals and metalloids », Plant Cell Environ., 2022, 45,3,719-736. [CrossRef]
  43. Boim, A.G.F., Melo, L.C.A., Moreno, F.N., Alleoni, L.R.F. Bioconcentration factors and the risk concentrations of potentially toxic elements in garden soils, J. Environ. Manage., 2016, 170, 21-27. [CrossRef]
  44. Oti, W. O. Bioaccumulation Factors and Pollution Indices of Heavy Metals in Selected Fruits and Vegetables from a Derelict Mine and Their Associated Health Implications, Int. J. Environ. Sustain., 2015, 4,1. [CrossRef]
  45. Mpundu, M.M., Useni, S.Y., Mwamba, M.T., Kateta, M.G., Mwansa, M., Ilunga, K., Kamengwa, K.C., Kyungu, K., and Nyembo K.L., 2013. Trace metal levels in soils from different vegetable gardens in the mining town of Lubumbashi and risks of contamination of vegetable crops. J.of Applied Bios., 2013, 65: 4957-4968.
  46. Mununga Katebe, F., Raulier, P., Colinet, G., Ngoy Shutcha, M., Mpundu Mubemba, M., Jijakli, M.H. Assessment of Heavy Metal Pollution of Agricultural Soil, Irrigation Water, and Vegetables in and Nearby the Cupriferous City of Lubumbashi, (Democratic Republic of the Congo), Agronomy, 2023, 13, 2, 357. [CrossRef]
  47. WHO (World Health Organization). Report Fruit and Vegetable Initiative, Report of the meeting, Geneva, 2003, 25-27.
  48. Hung, HC., Joshipura, KJ. Fruit and vegetable intake and risk of major chronic disease. Journal of the National Cancer Institute, 2004, 96:1577-84.
  49. WHO. Food safety, decision of the thirteenth World Health Assembly, New York, NY, 2020.
  50. Ogunkunle, A. T. J.; Bello, O. S.; Ojofeitimi, O. S. Determination of heavy metal contamination of street-vending fruits and vegetables in Lagos state, Nigeria, Int. Food Res. J., 2014, 21, 2115-2120.
  51. S. Study of heavy metals in mango (Mangifera indica L.) in Perlis, Malaysia. Indian Res. J.Pharm, 2015, 2, 299–303.
  52. Širić, I., Eid, E.M., El-Morsy, M.H.E., Osman, H.E.M., Adelodun, B., Abou Fayssal, S., Mioč, B., Goala, M., Singh, J., Bachheti, A., Arya, A.K., Choi, K.S., Kumar, V., Kumar, P. Health Risk Assessment of Hazardous Heavy Metals in Two Varieties of Mango Fruit (Mangifera indica L. var. Dasheri and Langra), Horticulturae, 2022, 8, 9, 832. [CrossRef]
  53. Mangambu, M., Mushagalusa, K., Kadima, N. Contribution à l’étude photochimique de quelques plantes médicinales antidiabétiques de la ville de Bukavu et ses environs (Sud-Kivu, R.D.Congo)., J. Appl. Biosci., 2014, 75,1,6211. [CrossRef]
  54. Badou, R.B., Yedomonhan, H., Tossou, M., Diversité d’usages et Statut de conservation de Syzygium guineense (Willd.) DC. subsp. macrocarpum (Engl.) F. White (Myrtaceae) au Bénin, Int. J. Environ. Stud., 2019, 76, 5, 827-842. [CrossRef]
  55. Sferrazzo, G., Palmeri, R., Vanella, L., Parafati, L., Ronsisvalle, S., Biondi, A., Basile, F., Li Volti, G., Barbagallo, I. Mangifera indica L. Leaf Extract Induces Adiponectin and Regulates Adipogenesis, Int. J. Mol. Sci., 2019, 20, 13, 3211. [CrossRef]
  56. Drabo, C., Nikiema, Z.S., Dianda, O.Z., Dao, A., Sanou, J., Sawadogo, M. Usage thérapeutique du manguier (Mangifera indica L., Anacardiaceae) au Burkina Faso, VertigO, 2023. [CrossRef]
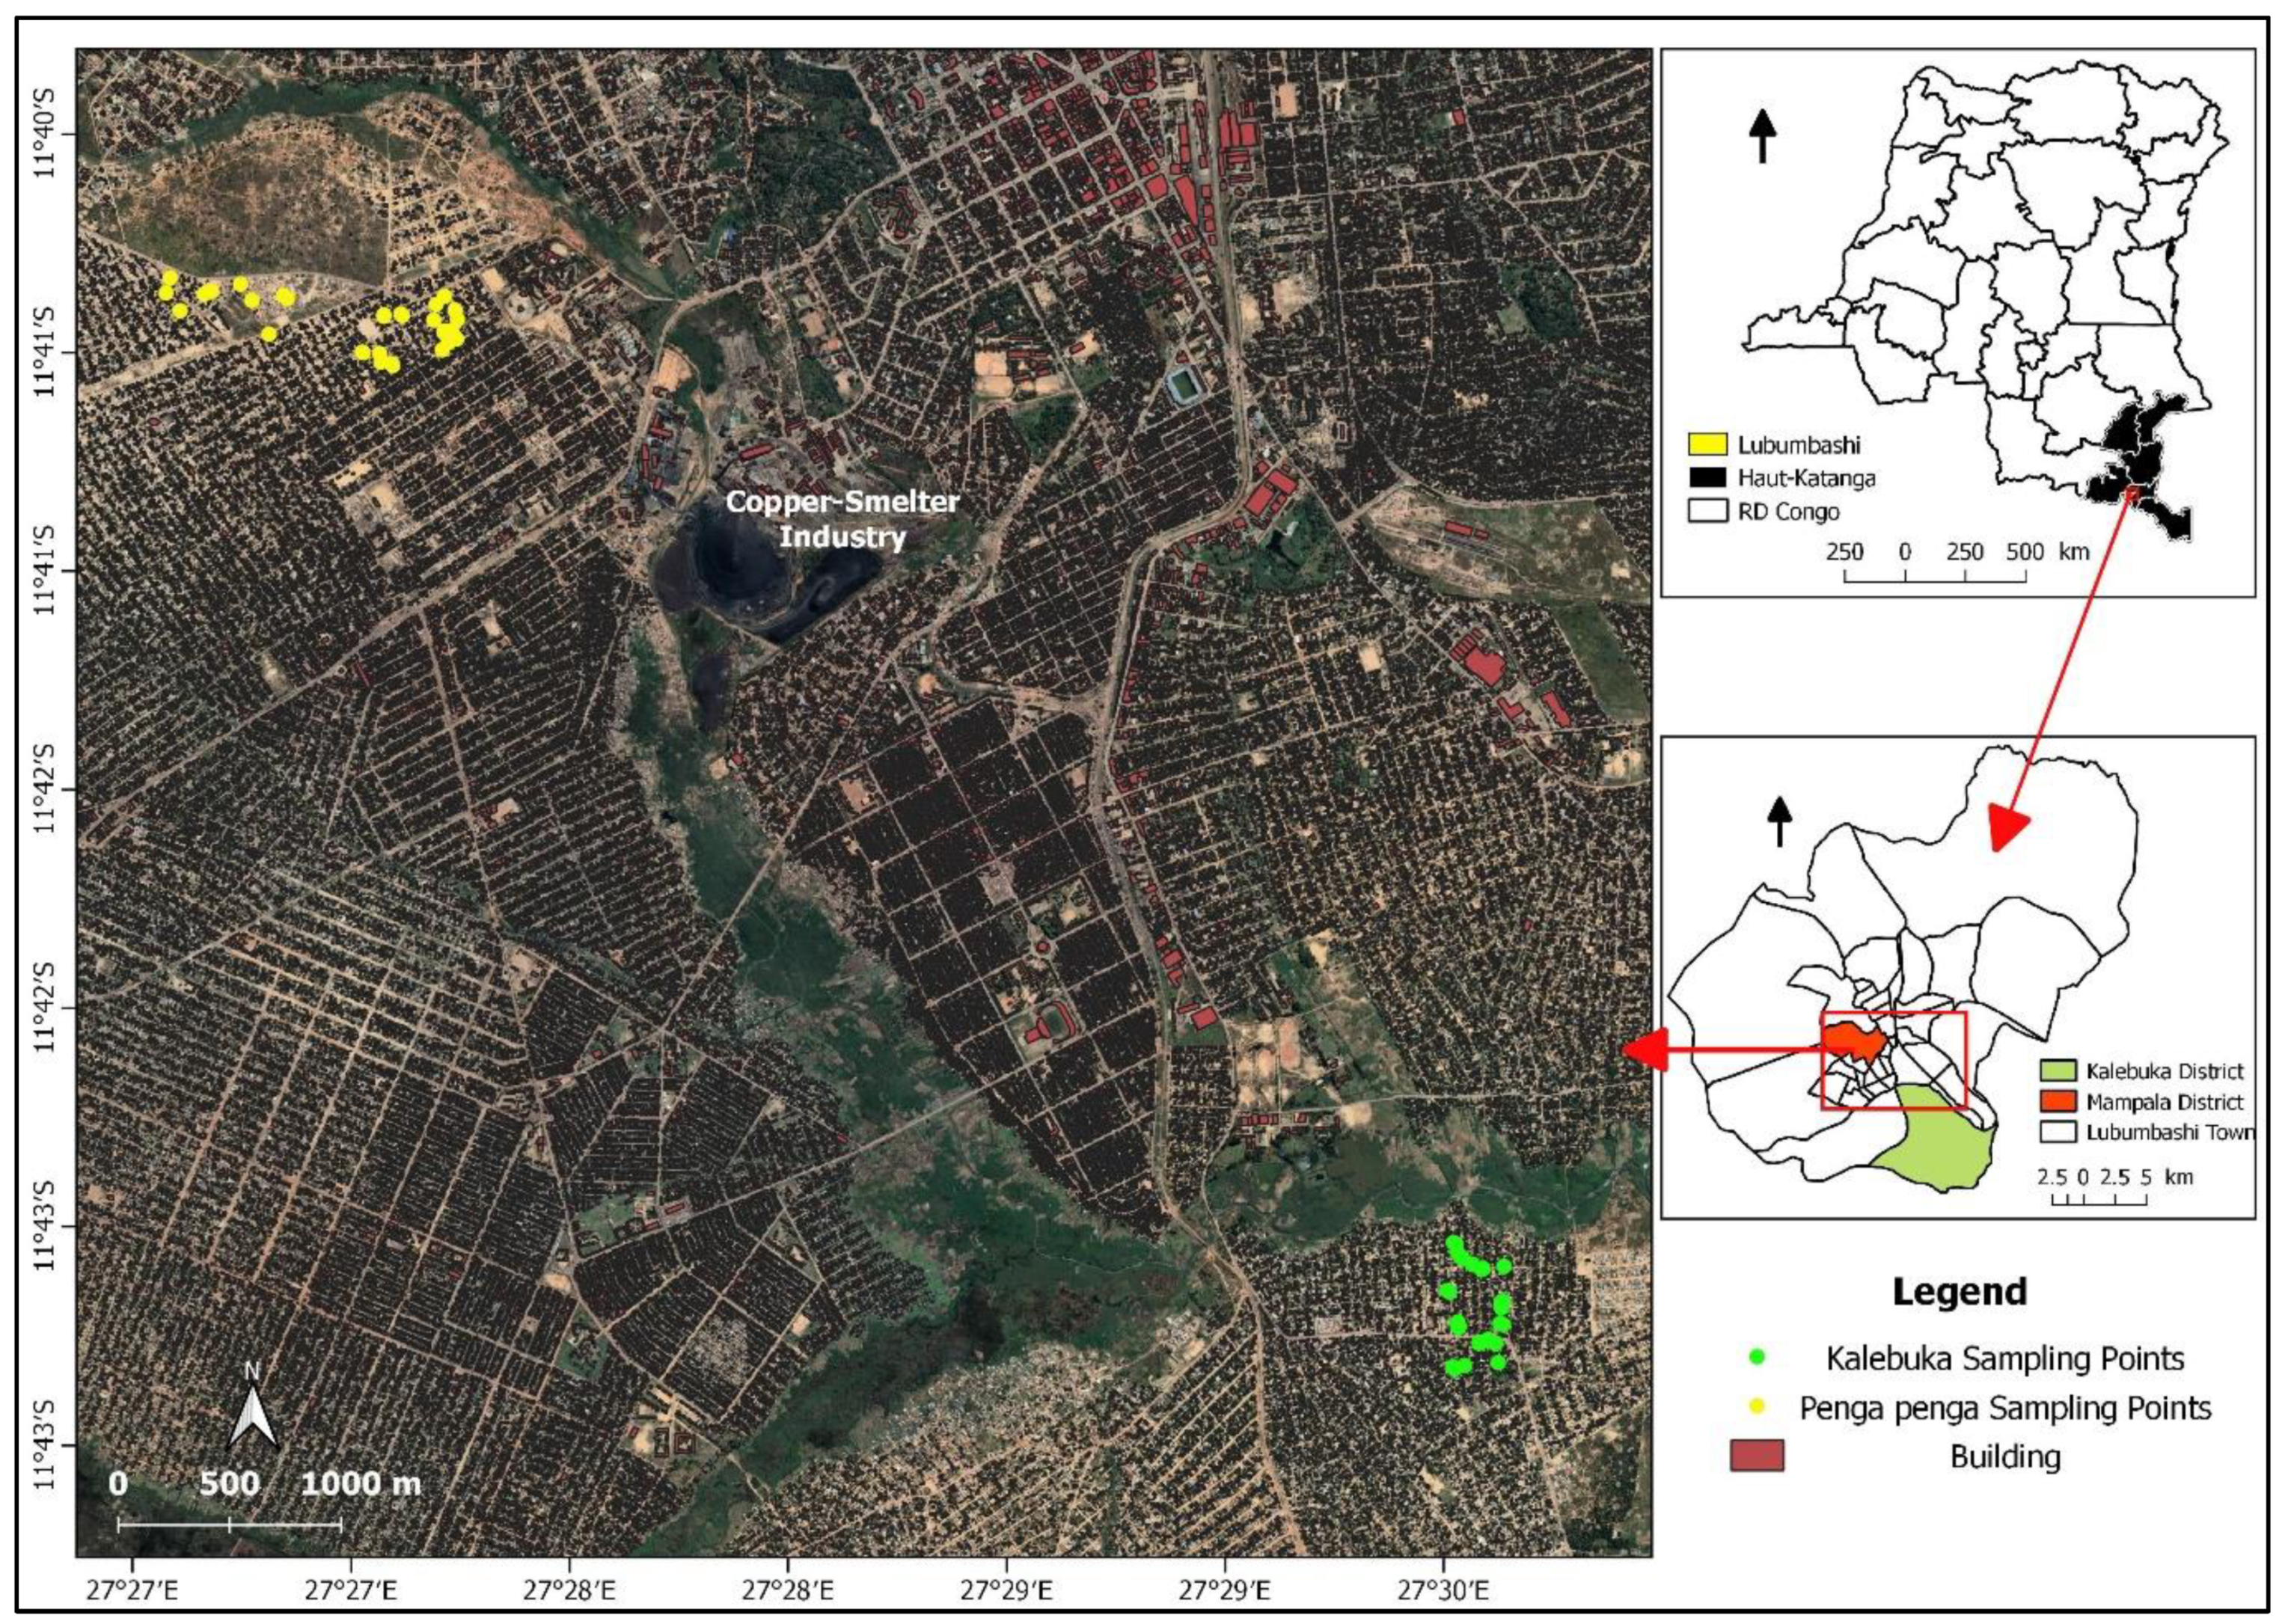
Figure 1. Location of the study area and sampling sites at Penga Penga and Kalebuka.
Preprints 78039 g001
Figure 2. Proportion of concentration values above the WHO limit for fruits and vegetables. Limit according to FAO and WHO [24].
Preprints 78039 g002
Figure 3. Bioconcentration factor of Cu, Pb, and Zn in leaves and fruits of M. indica (MI) and S. guineense (SG). On the left BCF in leaves and on the right BCF in fruits. Penga Penga (PP), Kalebuka (KLB).
Preprints 78039 g003
Table 1. pH, total organic C, and trace metal concentrations in the soil from two districts [20].
Parameters Penga Penga Kalebuka
pH KCl 6.3 (4.8-7.8) 6.8 (5.4 - 8.2)
TOC (%) 1.6 (0.5-3.0) 1.2 (0.4 - 0.2)
Co (mg.kg-1) 21 (4.6-90) 1.9 - 2.5
Cu (mg.kg-1) 2966 (213-17096) 48 (45.3 – 50)
Zn (mg.kg-1) 202 (21-736) 18.2 (0 - 36.4)
Table 2. Safe weekly intake values for each metal analyzed in the study (mg per week). Calculated after PMTDI from FAO and WHO [24] for As, Cd, Cu, and Pb, and from Pelkonen et al. [33] for Co and Zn.
Trace metals SWI (mg per week)
As 1.26
Cd 0.35
Co 9,8
Cu 210
Pb 1.5
Zn 180
Table 3. pH, major element, and trace metal concentrations of surface soil (0-20 cm) collected in the rhizosphere of M. indica and S. guineense in Penga Penga and Kalebuka (Lubumbashi, DR Congo). Average (Minimum - Maximum). AsT, CuT, PbT, and ZnT = Total As, Cu, Pb, and Zn concentrations; AsS, CdS, CoS, CuS, PbS, and ZnS = Soluble concentrations (extractable with CaCl2 0.01 M). References for uncontaminated soils around Lubumbashi from Shutcha et al. (2018).
Parameters Penga Penga Kalebuka References
pH 7.7 (6.7-8.4) a 6.4 (4.5-7.7) b 4.9 - 6.8
Al2O3 (%) 2.5 (1.4-5.0) a 3.0 (1.4-4.6) b 1.9-10.7
Fe2O3 (%) 4.3 (2.7-9.1) a 4.5 (2.5-6.5) a 0.9-7.4
Ca (%) 0.7 (0.1-2.3) a 0.3 (0.1-1.0) b -
K (%) 0.9 (0.4-2.0) a 1.0 (0.5-1.6) a -
Mn (mg kg-1) 251 (89-679) a 292 (77-717) a -
AsT (mg kg-1) 12.8 (3-81) a 7.6 (3-16) b -
CuT (mg kg-1) 1379 (60-4670) a 189 (22-695) b 20 - 456
PbT (mg kg-1) 142 (17-547) a 33 (2.0-110) b 7 - 82
ZnT (mg kg-1) 467 (129-1236) a 115 (31-275) b 26 - 180
AsS (mg kg-1) <0.01 <0.01 -
CdS (mg kg-1) 0.07 (<0.01-0.5) a 0.13 (<0.01-1.05) a -
CoS (mg kg-1) 0.31 (0.013-3.8) a 0.17 (0.01-1.7) a -
CuS (mg kg-1) 1.4 (0.2-7.4) a 0.7 (0.04-11.8) b -
PbS (mg kg-1) 0.11 (0.03-0.4) a 0.1 (0.06-0.4) a -
ZnS (mg kg-1) 0.4 (0.01-6.9) a 1.7 (0.007-12.3) a -
Table 4. Accumulation of metals (mg kg-1) in leaves and fruits at Penga Penga (PP) and Kalebuka (KLB). Average (Minimum-Maximum). Letters indicate significant differences (P < 0.05) between Penga Penga and Kalebula values.
Species Leaves Fruit FAO/WHO limits
Penga Penga Kalebuka Penga Penga Kalebuka
As M. Indica 0.2 a 0.1 b 0.1 < 0.001 0.1
(0.08-0.3) (0.07-0.24) (0.05-0.2)
S. guineense 0.1 a 0.05 b 0.02 < 0.001
(0.07-0.2) (0.04-0.08) (0.00-0.1)
Cd M. Indica 0.1 a 0.14 a 0.19a 0.09 b 0.2
(0.07-0.3) (0.05-0.22) (0.1-0.3) (0.01-0.4)
S. guineense 0.2 a 0.09 a 0.2 a 0.03 b
(0.06-0.8) (0.03-0.3) (0.1-0.3) (0.02-0.05)
Co M. Indica 3.3 a 0.3 b 2.9 a 0.84 b 1
(2.5-4.1) (0.1-1.2) (2.3-3.6) (0.75-0.88)
S. guineense 2.7 a 0.7 b 0.84 a 0.79 a
(1.8-4.1) (0.6-0.82) (0.7-1.02) (0.68-0.91)
Cu M. Indica 22.2 a 13 b 29.3 a 22.0 b 40
(15-42) (9-16) (9-64) (19-27)
S. guineense 18.4 a 19.8 a 18.9 a 15.9 b
(13-26) (17-24) (15-21) (14-19)
Pb M. Indica 3.3 a 1.0 b 2.2 a 0.31 b 0.3
(1.2-5) (0.7-1.5) (0.5-6) (0.03-0.6)
S. guineense 2.2 a 0.8 b 0.8 a 0.11 b
(1.1-4.3) (0.3-1.2) (0.3-2.4) (0.01-0.2)
Zn M. Indica 47.8 a 19.7 b 13.3 a 9.5 b 60
(19-137) (12-25) (9-24) (7-13)
S. guineense 20.3 a 13.9 b 39.1 a 14.7 b
(12-45) (11-16) (28-47) (7-70)
Table 5. Safe weekly consumption (kg per week) of M. indica and S. guineense fruits considering their metal concentrations for a 60 kg person in Penga Penga (PP) and Kalebuka (KLB). Safe weekly consumption was calculated after recommendations from FAO and WHO [24].
Preprints 78039 i001
Disclaimer/Publisher’s Note: The statements, opinions and data contained in all publications are solely those of the individual author(s) and contributor(s) and not of MDPI and/or the editor(s). MDPI and/or the editor(s) disclaim responsibility for any injury to people or property resulting from any ideas, methods, instructions or products referred to in the content.
Copyright: This open access article is published under a Creative Commons CC BY 4.0 license, which permit the free download, distribution, and reuse, provided that the author and preprint are cited in any reuse.
Prerpints.org logo

Preprints.org is a free preprint server supported by MDPI in Basel, Switzerland.

Subscribe

© 2024 MDPI (Basel, Switzerland) unless otherwise stated