Preprint
Article

A Power Service Route Planning Scheme Based on Relay Protection Service Overload and Dual Route

Altmetrics

Downloads

138

Views

33

Comments

0

Submitted:

27 June 2023

Posted:

30 June 2023

You are already at the latest version

Alerts
Abstract
Relay protection service is the most crucial service carried by the electric power communication network, which is directly linked to the safe operation of the power grid. In the route planning of power services, a route planning architecture for the power communication network is constructed in this paper, considering the operation and maintenance requirements, such as relay protection service overload (RPSO) and dual route. To minimize network risk variance, the problem of single-service route allocation is formulated by taking the factors into account such as service delay, link bandwidth utilization, and RPSO constraints. Based on $k$ shortest paths algorithm, a route planning scheme for the power services is proposed, which considers RPSO and risk balance, and a strategy for implementing multi-service route planning of the communication network is studied. The simulation results show that the proposed route planning strategy can effectively avoid relay protection service overload, reduce network risk variance, and balance network risk.
Keywords: 
Subject: Engineering  -   Electrical and Electronic Engineering

1. Introduction

With the development of communication technology and computer technology, traditional power grid is evolving towards smart grid with higher reliability, sustainability and flexibility [1,2]. Power communication network is an important part of smart grid. The backbone network is composed of switching nodes and optical cable links, which carries the services of power grid production and operation. The transmission and exchange of service data are closely related to the safe operation of power grid [3,4]. In the process of high-quality development of power grid, the types and quantities of power services continue to grow, and the reliability and effectiveness of power communication network service transmission must be ensured [5,6]. And it is an important method to ensure the safe and reliable operation of power communication network to allocate routes reasonably for power services [7].
At present, a large number of research results have been published on the research of power service route planning. Literature [8] calculates the importance of links according to the availability rate of links in the power communication network and the service routes carried, and then analyzes the reliability of each service route. Literature [9,10] divide the power communication network into physical link layer, network topology layer and service layer. Based on the three-layer topology structure and its relationship, the reliability of switching equipment and optical cable link is analyzed, and the risk assessment model of service route is established. On this basis, some studies have established different service route planning models considering the risk or risk balance (RB) of power communication network. However, the solution methods are different, which are mainly divided into two categories. One is the use of genetic algorithm. Based on software-defined network architecture, literature [11] constructs a link importance evaluation algorithm for working route and backup route, and adopts genetic algorithm for service route planning with network risk as optimization objective. In literature [12], the weighted summation of load pressure, average service delay and risk balance is used as the objective function of route planning, and the improved genetic algorithm is used to solve the problem. Based on service distribution and network attacks, literature [13] constructs a communication vulnerability index to describe the risk of service transmission, and optimizes routes through an improved fast genetic algorithm. Literature [14] establishes a multi-objective optimization problem considering risk balance degree and service delay, which was solved by NSGAII algorithm. The other uses algorithms in graph theory, including Dijkstra algorithm [15] and the k shortest paths (KSP) algorithm [16]. Dijkstra algorithm is used to solve the shortest path between two nodes in the graph, while KSP algorithm is an extension of Dijkstra algorithm to solve k shortest path between two nodes. The KSP algorithm proposed by Yen first finds the shortest path between the source node and the destination node through Dijkstra algorithm, then removes each link on the shortest path in turn, recalculates the shortest path between the source node and the destination node, and repeats the process until k paths are found. Literature [17] takes the risk of optical cable link and switching node as its weight, and adopts Dijkstra algorithm to directly obtain the route with the lowest risk value as the service route. Literature [18] uses KSP algorithm to find multiple reachable routes for services, and selects the route with the least network risk balance as the service route. Reference [19] considers the case of route recovery after a communication network failure. For services that cannot be transmitted after a communication network fault, the KSP algorithm is used to obtain k candidate paths based on the link bandwidth and transmission delay, and select the path that meets the bandwidth requirement as the recovery route. Literature [20] considers the risks of nodes and links, calculates the shortest path of each service based on the intermediary centrality theorem, and modifies the service route several times to improve the risk balance of the network. In addition, literature [21,22] adopt the P-cycle protection method to configure prefabricated protection routes for important services, which improves resource utilization but reduces the protection ability for a single service.
As can be seen from the above, current researches focus on reducing network risk and lack consideration of relay protection service overload (RPSO). Relay protection service is the most important service carried by power communication network. To ensure secure transmission of relay protection service, the route planning of relay protection service is restricted by overload. That is, the number of relay protection service carried by an optical cable link cannot exceed the overload threshold. At the same time, the relay protection service requires dual route planning. When the working route fails, the relay protection service quickly switches to the protection route to ensure the transmission of service data. Therefore, a route planning scheme considering RPSO and RB is proposed for overload and dual route planning of relay protection service. The main contributions of the paper can be summarized as follows:
1.
We establish the service route planning architecture of the power communication network, describe the service requests, service reachable routes, and network service carrying status (NSCS), and give the calculation of the NSCS parameters of the reachable route.
2.
We carry out the problem planning of route allocation for a single service with the goal of reducing the variance of network risk and meeting the constraints of delay, bandwidth and RPSO, and propose a route planning scheme considering RPSO and RB.
3.
We study the multi-service routing planning process with unifying the route assignment of non-relay protection service and the dual route assignment of relay protection service.
The remainder of the paper is provided as follows. Section 2 introduces the route planning model of power communication network. Section 3 describes the route planning problem. Section 4 describes the single-service route planning scheme. Section 5 describes the process of route planning for multiple services. Section 6 provides simulation results with theoretical analysis. In Section 7, the paper is concluded.

2. Route planning model of power communication network

The route planning architecture of the power communication network is showed in Figure 1, including the service routing control center (SRCC) and the power communication network G. Suppose the power communication network has σ service requests that need route planning. These service requests arrive in sequence based on time. After route planning for the first n 1 services, the SRCC receives the n-th service request b ( n ) and searches for multiple reachable routes based on the source node and destination node. According to the obtained NSCS parameters { B v ( n 1 ) , B e ( n 1 ) , D e ( n 1 ) } , the working route P ( n ) of service b ( n ) is selected from multiple reachable routes. The relay protection service also needs to determine the protection route P a ( n ) . After the service route is planned, the SRCC delivers the route to the power communication network for data transmission. The following describes the power communication network, service requests, service reachable routes and NSCS parameters in detail, and gives the calculation process of the NSCS parameters of the reachable route.

2.1. Power communication network

The power communication network consists of N switching nodes and M optical cable links, which can be represented by undirected graph G = ( E , V ) , where V = { v i , i Λ } , Λ = { 1 , 2 , . . . , N } is the set of switching nodes and E is the set of physical links. The link between node v i and node v j is defined as e i j , and i < j is required to avoid duplication. All optical cable links in the network form set E.
In the power communication network, service data is transmitted from the source node to the destination node through multiple switching nodes and multiple optical cable links. Considering the factors such as delay, bandwidth and network risk, the relevant parameters of the power communication network nodes and links are further defined.
For switching node v i , the data processing forwarding delay and availability rate are set as τ v ( v i ) and u v ( v i ) respectively. The data processing forwarding delay mainly includes processing delay, queuing delay and sending delay. The value is related to algorithm complexity and hardware device performance. The availability of switching nodes is related to practical factors such as operating years and operating environment of the site where they are located, and 0 u v ( v i ) 1 . The failure rate of switching node v i is
r v ( v i ) = 1 u v ( v i )
For optical cable link e i j , its length and bandwidth capacity are l ( e i j ) and f ( e i j ) respectively, and the availability rate per unit length is u e ( e i j ) . The link bandwidth capacity is proportional to the number of fiber optic cable core. The fiber optic cable core number is generally 24, 36, 48, 72 and so on. The availability of links is affected by factors such as time of operation, number of wires and type of cable. The failure rate of the whole optical cable link e i j can be expressed as
r e ( e i j ) = 1 u e l ( e i j ) ( e i j )

2.2. Service request

There are many types of electric power services, including relay protection service, security and stability control service and so on. Different services have different delay and bandwidth requirements and are of different importance to the normal operation of the power grid. The importance degree of Class q-th service in power communication network is g ( q ) , which can be calculated by using the approximate ideal solution sorting method [17], where q Π , Π = { 1 , 2 , . . . , Q } , Q is the number of service types, and 0 < g ( q ) < 1 . Among all kinds of services, the relay protection service is the most important and its importance value is the largest. Without loss of generality, if q = 1 , it indicates relay protection service. The greater the importance of services carried by switching nodes and optical cable links, the greater the network risk.
Therefore, service requests are defined as a 5-dimensional feature vector. The n-th service request is represented by b ( n ) = ( s ( n ) , d ( n ) , τ ( n ) , ω ( n ) , q ( n ) ) , where s ( n ) and d ( n ) are the source node and destination node of the service, τ ( n ) and ω ( n ) are the delay and bandwidth requirements of the service, and q ( n ) is the category of the service.

2.3. Service reachable routes

For service request b ( n ) , there are multiple paths from s ( n ) to d ( n ) , which are called reachable routes. For the convenience of calculation, the reachable route is expressed in matrix form. All the reachable route matrices of a service constitute the reachable route set, which can be expressed as
Φ ( n ) = P s ( n ) , d ( n ) , G
where P indicates a reachable route for the service. If the reachable route contains the link e i j , the elements P ( i , j ) and P ( j , i ) are both 1; otherwise, the value of the elements is 0. The reachable route matrix has symmetry.
According to definition of P , the set of nodes contained in P is
V P = { v i | j Λ P ( i , j ) > 0 , i Λ }
The sequence number set of nodes contained in P can be expressed as Λ P = { i Λ | v i V P } . After removing the source node and destination node, the set of intermediate nodes contained in P can be represented as V P = V P { s ( n ) , d ( n ) } . Similarly, the set of links contained in a reachable route can be expressed as
E P = { e i j | P ( i , j ) = 1 , i < j , i Λ , j Λ }
Based on the definition of P , the delay and NSCS parameters of route can be calculated conveniently.

2.4. NSCS parameters

The service requests of the power communication network arrive in order of time. The current service carrying status of the communication network is the basis of service routing planning. If the first n services have been planned, the NSCS of the power communication network can be represented by { B v ( n ) , B e ( n ) , D e ( n ) } .
The dimension of node service carrying matrix B v ( n ) is N × Q , and the element B v ( n ) ( i , q ) represents the number of Class q service carried by node v i . The dimension of link service carrying tensor B e ( n ) and link bandwidth occupation matrix D e ( n ) are N × N × Q and N × N respectively. When e i j E , the values of B e ( n ) ( i , j , q ) and B e ( n ) ( j , i , q ) are the number of Class q-th service carried by link e i j . When e i j E , the element value is 0. Similarly, when e i j E , element D e ( n ) ( i , j ) = D e ( n ) ( j , i ) , whose value represents the occupied bandwidth of the services carried by link e i j . When e i j E , it is equal to 0.

2.5. NSCS parameters of the reachable route

When the n-th service request b ( n ) arrives, it is necessary to plan a route for the service under the current NSCS { B v ( n 1 ) , B e ( n 1 ) , D e ( n 1 ) } . To select the optimal route from multiple reachable routes, we need to calculate the corresponding NSCS for each reachable route. Given that an reachable routing matrix of b ( n ) is P . The calculation of NSCS corresponding to P is shown below.

2.5.1. Calculation of node service carrying parameter

If the reachable route P contains node v i , the number of Class q services carried by this node increases by 1, and the number of other services carried by this node remains unchanged. Otherwise, the number of all types of services hosted by the node remains the same. Thus, the calculation of B v can be expressed as
B v ( i , q ) = B v ( n 1 ) ( i , q ) + 1 , i Λ P , q = q ( n ) B v ( n 1 ) ( i , q ) , i Λ P , q q ( n ) or i Λ P

2.5.2. Calculation of link service carrying parameters

According to the definition of the reachable route matrix P , P ( i , j ) and P ( j , i ) mean that the link e i j carries b ( n ) , and the number of Class q service carried by the link increases by 1, and the bandwidth usage increases by ω ( n ) . When P ( i , j ) = 0 , link e i j does not carry new services and the status parameters remain unchanged. At the same time, the element value of P is 0 or 1, so the calculation of B e and D e can be represented by P , specifically
B e ( i , j , q ) = B e ( n 1 ) ( i , j , q ) + P ( i , j ) , q = q ( n ) B e ( n 1 ) ( i , j , q ) , q q ( n )
D e ( i , j ) = D e ( n 1 ) ( i , j ) + ω ( n ) · P ( i , j )
It can be seen that the definition of the route matrix simplifies the calculation of NSCS parameters and facilitates computer implementation. In the multi-service planning process, after determining the service working route or protection route, the updating of NSCS parameters is similar to the calculation of NSCS parameters of reachable route.

3. The problem of single service route planning in power communication network

Based on the route planning architecture of the power communication network, aiming at minimizing network risks and satisfying constraints such as RPSO, delay and bandwidth, this paper describes the route planning problem of single service at the current time mathematically.

3.1. Power communication network risk balance

The network risk value consists of the risk value of nodes and links. The risk value of node or link is determined by the total importance of all the services it carries and the corresponding failure rate, and is defined as the product of the two.
For node v i , the risk value is R V ( v i ) = r v ( v i ) · g v ( v i ) . For link e i j , the risk value is R E ( e i j ) = r e ( e i j ) · g e ( e i j ) . Where, g v ( v i ) and g e ( e i j ) respectively indicate the total importance of all types of services on node v i and link e i j , which can be expressed as
g v ( v i ) = q Π g ( q ) · B v ( i , q )
g e ( e i j ) = q Π g ( q ) · B e ( i , j , q )
Therefore, the average risk values of nodes and links in the communication network are respectively
R ¯ V = 1 N v i V R V ( v i )
R ¯ E = 1 M e i j E R E ( e i j )
Furthermore, the variance of node risk and link risk is respectively
R VV = 1 N v i V R V ( v i ) R ¯ V 2
R EV = 1 M e i j E R E ( e i j ) R ¯ E 2
Network risk variance is the sum of node risk variance and link risk variance, i.e
R NV = R VV + R EV
The smaller the network risk variance, the smaller the risk value difference between switching nodes and optical cable links in communication network, and the better the network operation quality. Therefore, minimizing network risk variance is taken as the goal of route planning.

3.2. Constraints on route planning of relay protection services

When the relay protection service carried by optical cable link exceeds a certain amount, it will bring great risk to the safe operation of power grid. Therefore, when planning routes for relay protection services, we need to consider the limit on the number of relay protection services carried by links to reduce network risk. Set the RPSO threshold to λ . The number of relay protection services carried by each cable link cannot exceed λ . The value of B e ( i , j , 1 ) is the number of relay protection services carried by the cable link e i j . Therefore, when the working route and protection route of the relay protection service are selected, the RPSO constraint that are met can be expressed as
B e ( i , j , 1 ) λ , i Λ , j Λ
When the structure and parameters of power communication network are given, the value of λ is related to network risk variance R NV . When the value of λ is small, the number of relay protection services that can be carried by each link is small. In this case, the risk of each link is small and the risk difference between links is small because the importance of relay protection service is the greatest. Therefore, R NV is small. As the value of λ increases, the number of relay protection services that can be carried by each link increases. The risk caused by relay protection service increases, the risk difference between links increases, and R NV increases accordingly. As λ continues to increase, the route planning of almost all relay protection services are no longer constrained by RPSO. The number of relay protection services carried by each link is approximately unchanged, and R NV is also almost unchanged.

3.3. Delay and bandwidth constraints for service route planning

For the reachable route P , the transmission delay τ P of service data consists of the processing and forwarding delay τ 1 of the intermediate node and the transmission delay τ 2 of the optical cable link, i.e. τ P = τ 1 + τ 2 . According to the definition of relevant parameters in Section 2.1, the forwarding processing delay of intermediate nodes and the transmission delay of optical cable links are respectively
τ 1 = v i V P τ v ( v i )
τ 2 = e i j E P l ( e i j ) c / r
where c / r is the data transmission speed, c is the speed of light, and r is the refractive index of the fiber core region.
At the same time, optical cable link bandwidth capacity is limited. We need to reserve a part of the bandwidth for some special circumstances or emergency. Considering the bandwidth capacity and the bandwidth occupation parameter D e of the link , the bandwidth occupation rate of link e i j can be calculated and expressed as
η e ( e i j ) = D e ( i , j ) f ( e i j )
Set η max ( e i j ) is the maximum bandwidth usage of link e i j . Reachable route P must meet the following constraints to be selected as service route
τ P τ ( n )
η e ( e i j ) η max ( e i j ) , e i j E P

3.4. Mathematical model of single-service route planning problem

When the n-th service request b ( n ) arrives, under NSCS { B v ( n 1 ) , B e ( n 1 ) , D e ( n 1 ) } , the optimization problem of planning working route P ( n ) for the service can be expressed as
minimize P Φ ( n ) R N V subject to ( 16 ) ( 20 ) ( 21 )
where Φ ( n ) is the set of reachable routes from the service source node to the service destination node of the service request b ( n ) .
Dual route planning is required for the relay protection service. When finding a working route P ( n ) , follow the description in question (22). When planning protection route P a ( n ) , the link disjoint of working route and protection route must be satisfied. The link set contained by route P is E P , and the link set contained by route P ( n ) is E P ( n ) . Therefore, the set of routes that do not intersect with the link of P ( n ) can be expressed as
Γ ( n ) = { P | E P E P ( n ) = , P Φ ( n ) }
We can delete links contained in the working route P ( n ) in the network topology. Then obtain the reachable route set Γ ( n ) of the protected route. The planning problem of the protection route is obtained by replacing the set Φ ( n ) with Γ ( n ) in the planning problem of the working route (22). It can be seen that the difference between the planning of working route and protection route lies in the difference of reachable route sets, which can be carried out by similar route planning schemes.

4. Single-service route planning scheme based on RPSO-RB

As shown in problem (22), route planning can be carried out in two steps. The first step is to find the reachable route set of the service request. In the second step, the route that satisfies constraints and minimizes the network risk variance is selected as working route or protection route in the reachable route set.

4.1. Reachable route collection based on KSP algorithm

Aiming at the first step of route planning, given the communication network structure, the operation of finding the reachable route set is a NP-hard problem with high computational complexity. In engineering, KSP algorithm is often used to obtain the set of k reachable routes. In this paper, KSP algorithm is adopted to obtain reachable route set.
Specifically, the total length of P is expressed as
d P = e i j E P l ( e i j )
The power communication network G is regarded as a entitled undirected graph, the length of the link is taken as the link weight. The KSP algorithm is used to obtain the first k shortest distance reachable routes to form the reachable route set Φ k ( n ) = { P 1 , P 2 , . . . , P k } , where d P k 1 d P k . There are reachable paths between all switching nodes in the power communication network, and Φ k ( n ) is not an empty set. When the value of k is large, all the reachable paths between the source node and the destination node may be less than k, and the number of elements in Φ k ( n ) may be less than k. In general, the larger the value of k is, the greater the number of elements in set Φ k ( n ) , the larger the length of possible routes, the more links involved in service data transmission, and the greater the network risk.
The value of k affects the probability of successfully finding routes and is related to the total number of services σ . When σ is small and routes are sought for new services, the remaining link bandwidth resources of the network are abundant. The larger the value of k, the more elements in set Φ k ( n ) , the greater the possibility of finding routes that meet constraints from the set, and the greater the probability of successful route planning for services. When k increases to a certain value, the routes added in the reachable route set are almost impossible to be selected as service routes. In this case, the change of k has little impact on the probability of successful route planning. However, when σ increases to a certain number, the link resources of the network are almost exhausted. When finding routes for new services, the link bandwidth resources of the network are insufficient. Increasing k decreases the probability of new services successfully finding routes.
In addition, it is necessary to calculate the corresponding network risk variance of each reachable route in the set Φ k ( n ) , which also increases the amount of computation. So, in practice, k has to be a compromise.

4.2. RPSO-RB route planning scheme

The following describes the RPSO-RB routing scheme for single-service route planning. Given the service request b ( n ) , solve problem (22) to determine the working route; If b ( n ) is a relay protection service, it needs to continue to plan protection route. In this paper, RPSO-RB route planning scheme is proposed to allocate working route or protection route.
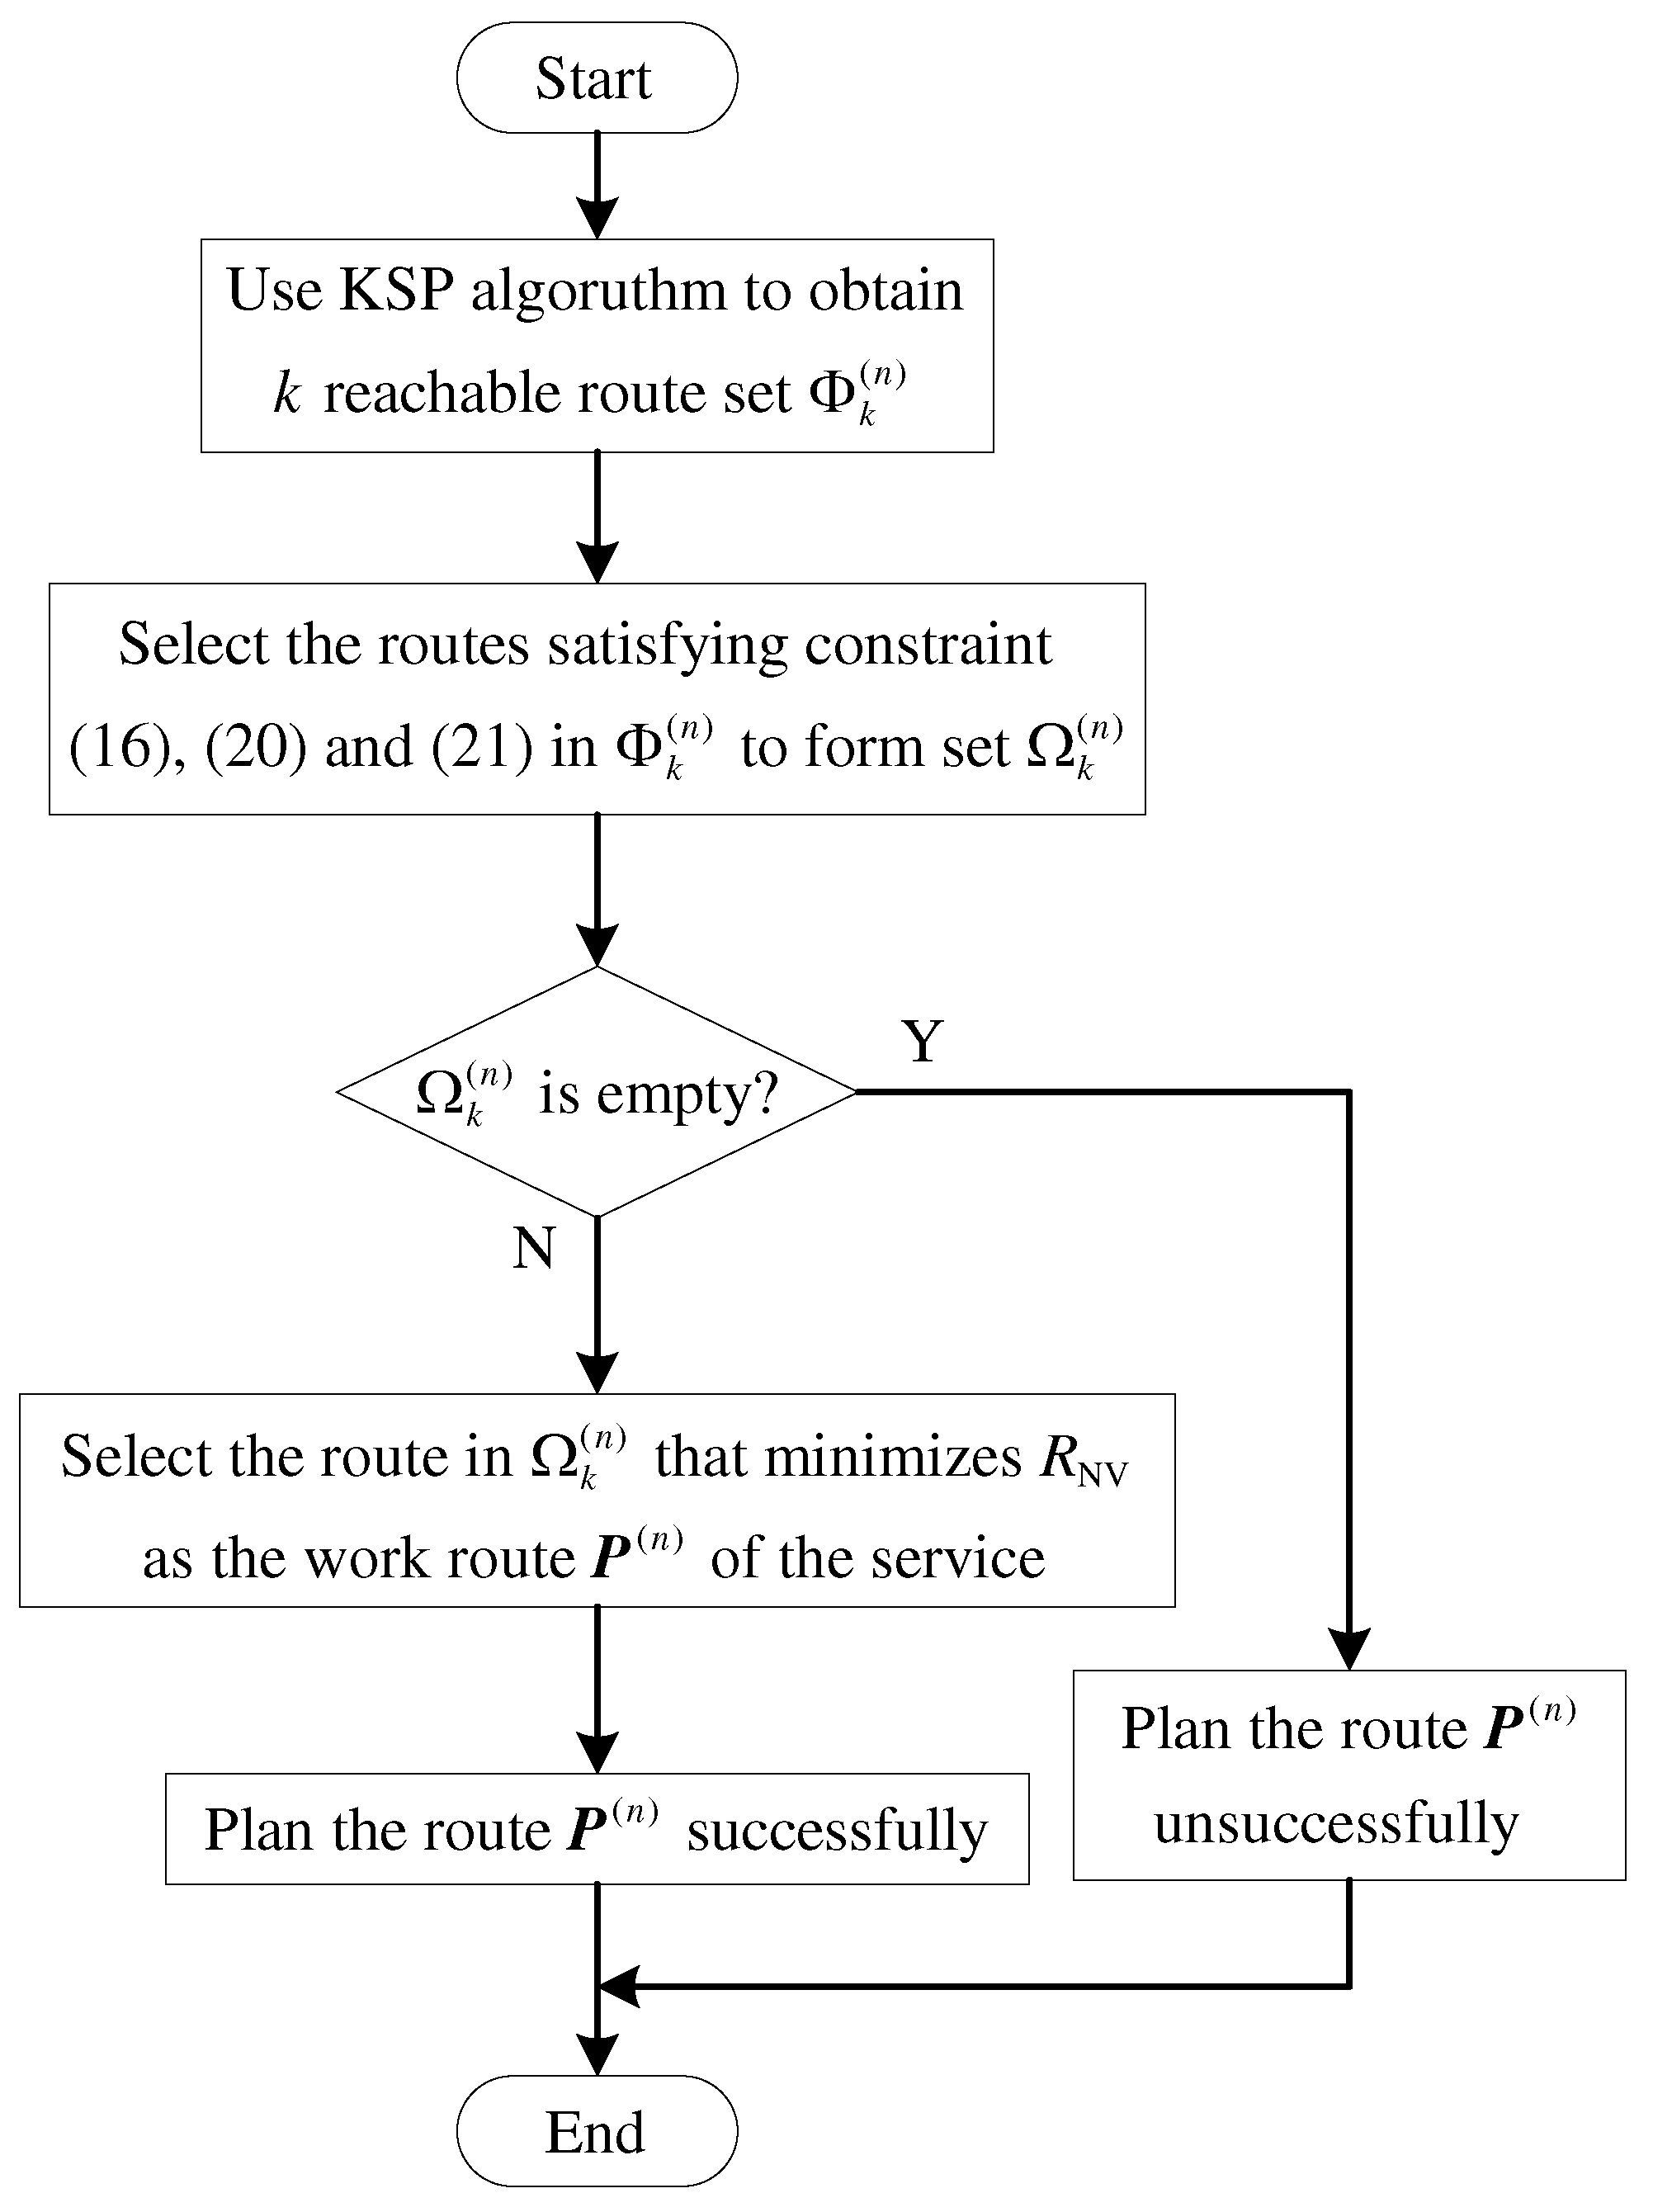
Taking planning working route P ( n ) for b ( n ) an example, the flow chart of RPSO-RB route planning scheme is shown in Figure 2 and the specific steps are as follows:
Step 1: The reachable routes set Φ k ( n ) of this service is obtained by using the KSP algorithm.
Step 2: For a reachable routing matrix P in set Φ k ( n ) , calculate the NSCS parameters by formula (6)-(8) to determine whether constraints (16), (20) and (21) are satisfied. If yes, this route P is an element of the set Ω k ( n ) .
Step 3: Determine whether the reachable route set Ω k ( n ) is empty. If not empty, go to Step4. Otherwise, the service does not have reachable routes that meet constraints, route planning fails, and services are blocked.
Step 4: For a reachable route P in set Ω k ( n ) , calculate the network risk variance R NV by formula (9)-(15). Set the route with the smallest R NV value as the working route P ( n ) of the service. The route planning is successful, that is,
P ( n ) = arg min P Ω k ( n ) R NV
In the RPSO-RB route planning scheme, when the number of services carried by the network is large enough, the reachable route set Ω k ( n ) is empty, and the search for working routes fails and services are blocked.
The planning process of protection route is similar to that of working route. It only needs to replace set Φ ( n ) with set Γ ( n ) .

5. Multi-service route planning implementation policy

The service requests of the power communication network arrive in sequence of time. The SRCC allocates routes for new services based on the NSCS parameters of the current time. After routes are planned for a single service request, NSCS parameters are updated. In this way, route planning for multiple services is completed.

5.1. Update NSCS parameters for multi-service routing planning

When updating NSCS parameters, dual route planning is required for relay protection service. After NSCS parameters are updated for working route, NSCS parameters are also updated for protection route. Considering that the value of elements in the routing matrix is 0 or 1 and is not intersecting with links, the NSCS parameters of non-relay protection services and relay protection services can be updated in a unified manner to facilitate computer implementation.
Set the protection route of non-relay protection service as all-zero matrix, and define the service route matrix of b ( n ) as
P d ( n ) = P ( n ) + P a ( n )
This represents the nodes and links contained in work route and protect route of b ( n ) . The process of updating the NSCS parameters after the route of the n-th service request b ( n ) is deployed is similar to that of calculating the NSCS parameters of the reachable route. According to formula (6)-(8), simply replace P with P d ( n ) , that is, update from { B v ( n 1 ) , B e ( n 1 ) , D e ( n 1 ) } to { B v ( n ) , B e ( n ) , D e ( n ) } .

5.2. Multi-service routes planning process

Given nodes and links parameters of the power communication network, and the multi-service routes planning process adopting RPSO-RB route planning scheme is as follows:
Step1: Wait for the next service request b ( n ) to arrive.
Step2: Plan P ( n ) for business request b ( n ) .
Step3: Judge whether the planning of working route is successful. If successful, go to Step4. Otherwise block b ( n ) , turn to Step1.
Step4: Determine whether the current service is a relay protection service. If yes, find the protection route P a ( n ) , and go to Step5; Otherwise, set the protection route P a ( n ) to an all-zero matrix and go to Step6.
Step5: Judge whether the protection route P a ( n ) is planned successfully. If successful, go to Step6. Otherwise block b ( n ) , turn to Step1.
Step6: Calculate service route P d ( n ) according to Formula (26), update the NSCS parameters, and go to Step7.
Step7: For all links, calculate and judge the bandwidth utilization rate of all links to determine whether all links reach their thresholds. If yes, end. Otherwise, turn to Step1.

5.3. Service blocking rate

In route planning, given the network topology structure of power communication and various parameters of nodes and links, the number of services that a network can carry is limited. When the set of reachable routes that meet the constraints is empty, routes that meet the requirements cannot be found for services, and service requests are blocked. Specifically, for non-relay protection services, if working route planning fails, the service request is blocked. For the relay protection service, if the working route or protection route planning fails, the service request is blocked.
Service blocking rate is defined as the ratio of the number of blocked services to the total number of services, denoted as μ , which is often used to analyze and study the performance of route planning strategy.

6. Simulation Results

6.1. Simulation parameter setting

6.1.1. Communication network parameters

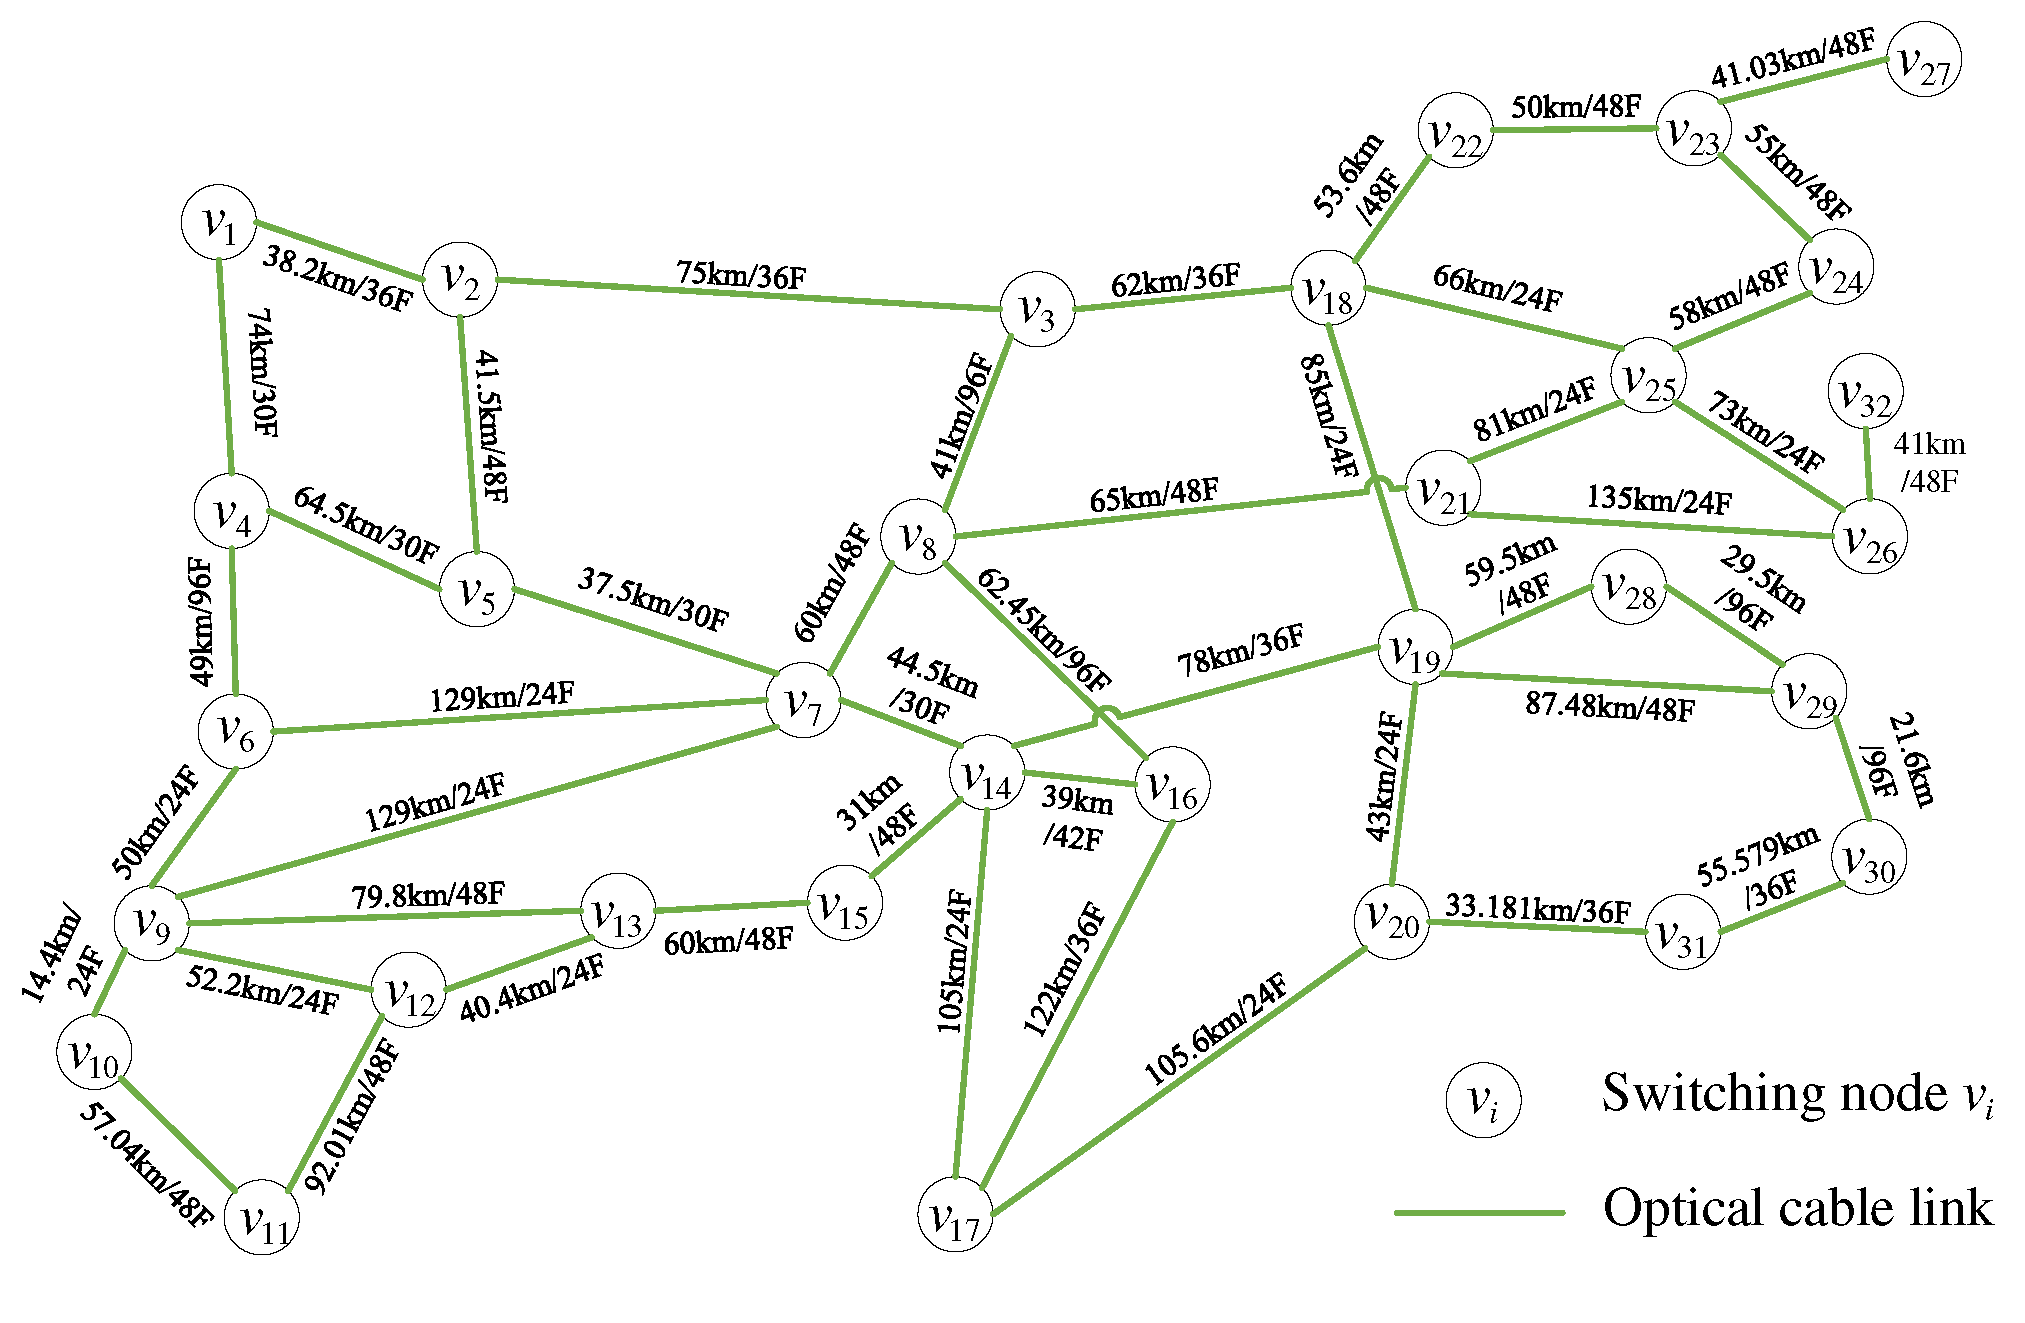
In this paper, the power communication network in part of China is simulated and the routing planning scheme is studied. The topology structure of the communication network is shown in Figure 3, which contains 32 switching nodes and 47 optical cable links. Link length and number of fiber cores are marked on the link segments. In the simulation experiment, it is assumed that the data processing and forwarding delay of each switching node is 0.022ms. The bandwidth of a single-core optical fiber is 30 Mbits/s. The bandwidth capacity of a link is the product of the number of cores multiplied by the bandwidth of a single-core optical fiber. The availability of switching nodes and the unit availability cable links are fixed values of 0.9996 and 0.9984, respectively. The refractive index of fiber is 1.48.

6.1.2. Service request parameter

In the simulation, the source node and destination node of non-relay protection service are randomly selected in the node set according to uniform distribution, which satisfies s ( n ) d ( n ) . The source node and destination node of the relay protection service are adjacent and directly connected. Table 1 lists the service types, latency, bandwidth, importance, and quantity ratio. Considering the randomness of service generation, sufficient samples are needed for experiments. As shown in Table 1, σ services are generated, called a service group, and multi-service routes are planned for the services of a service group. In the simulation process, 100 service group experiments were carried out, and the experimental results were statistically averaged.

6.2. Research on the performance of service route planning policy

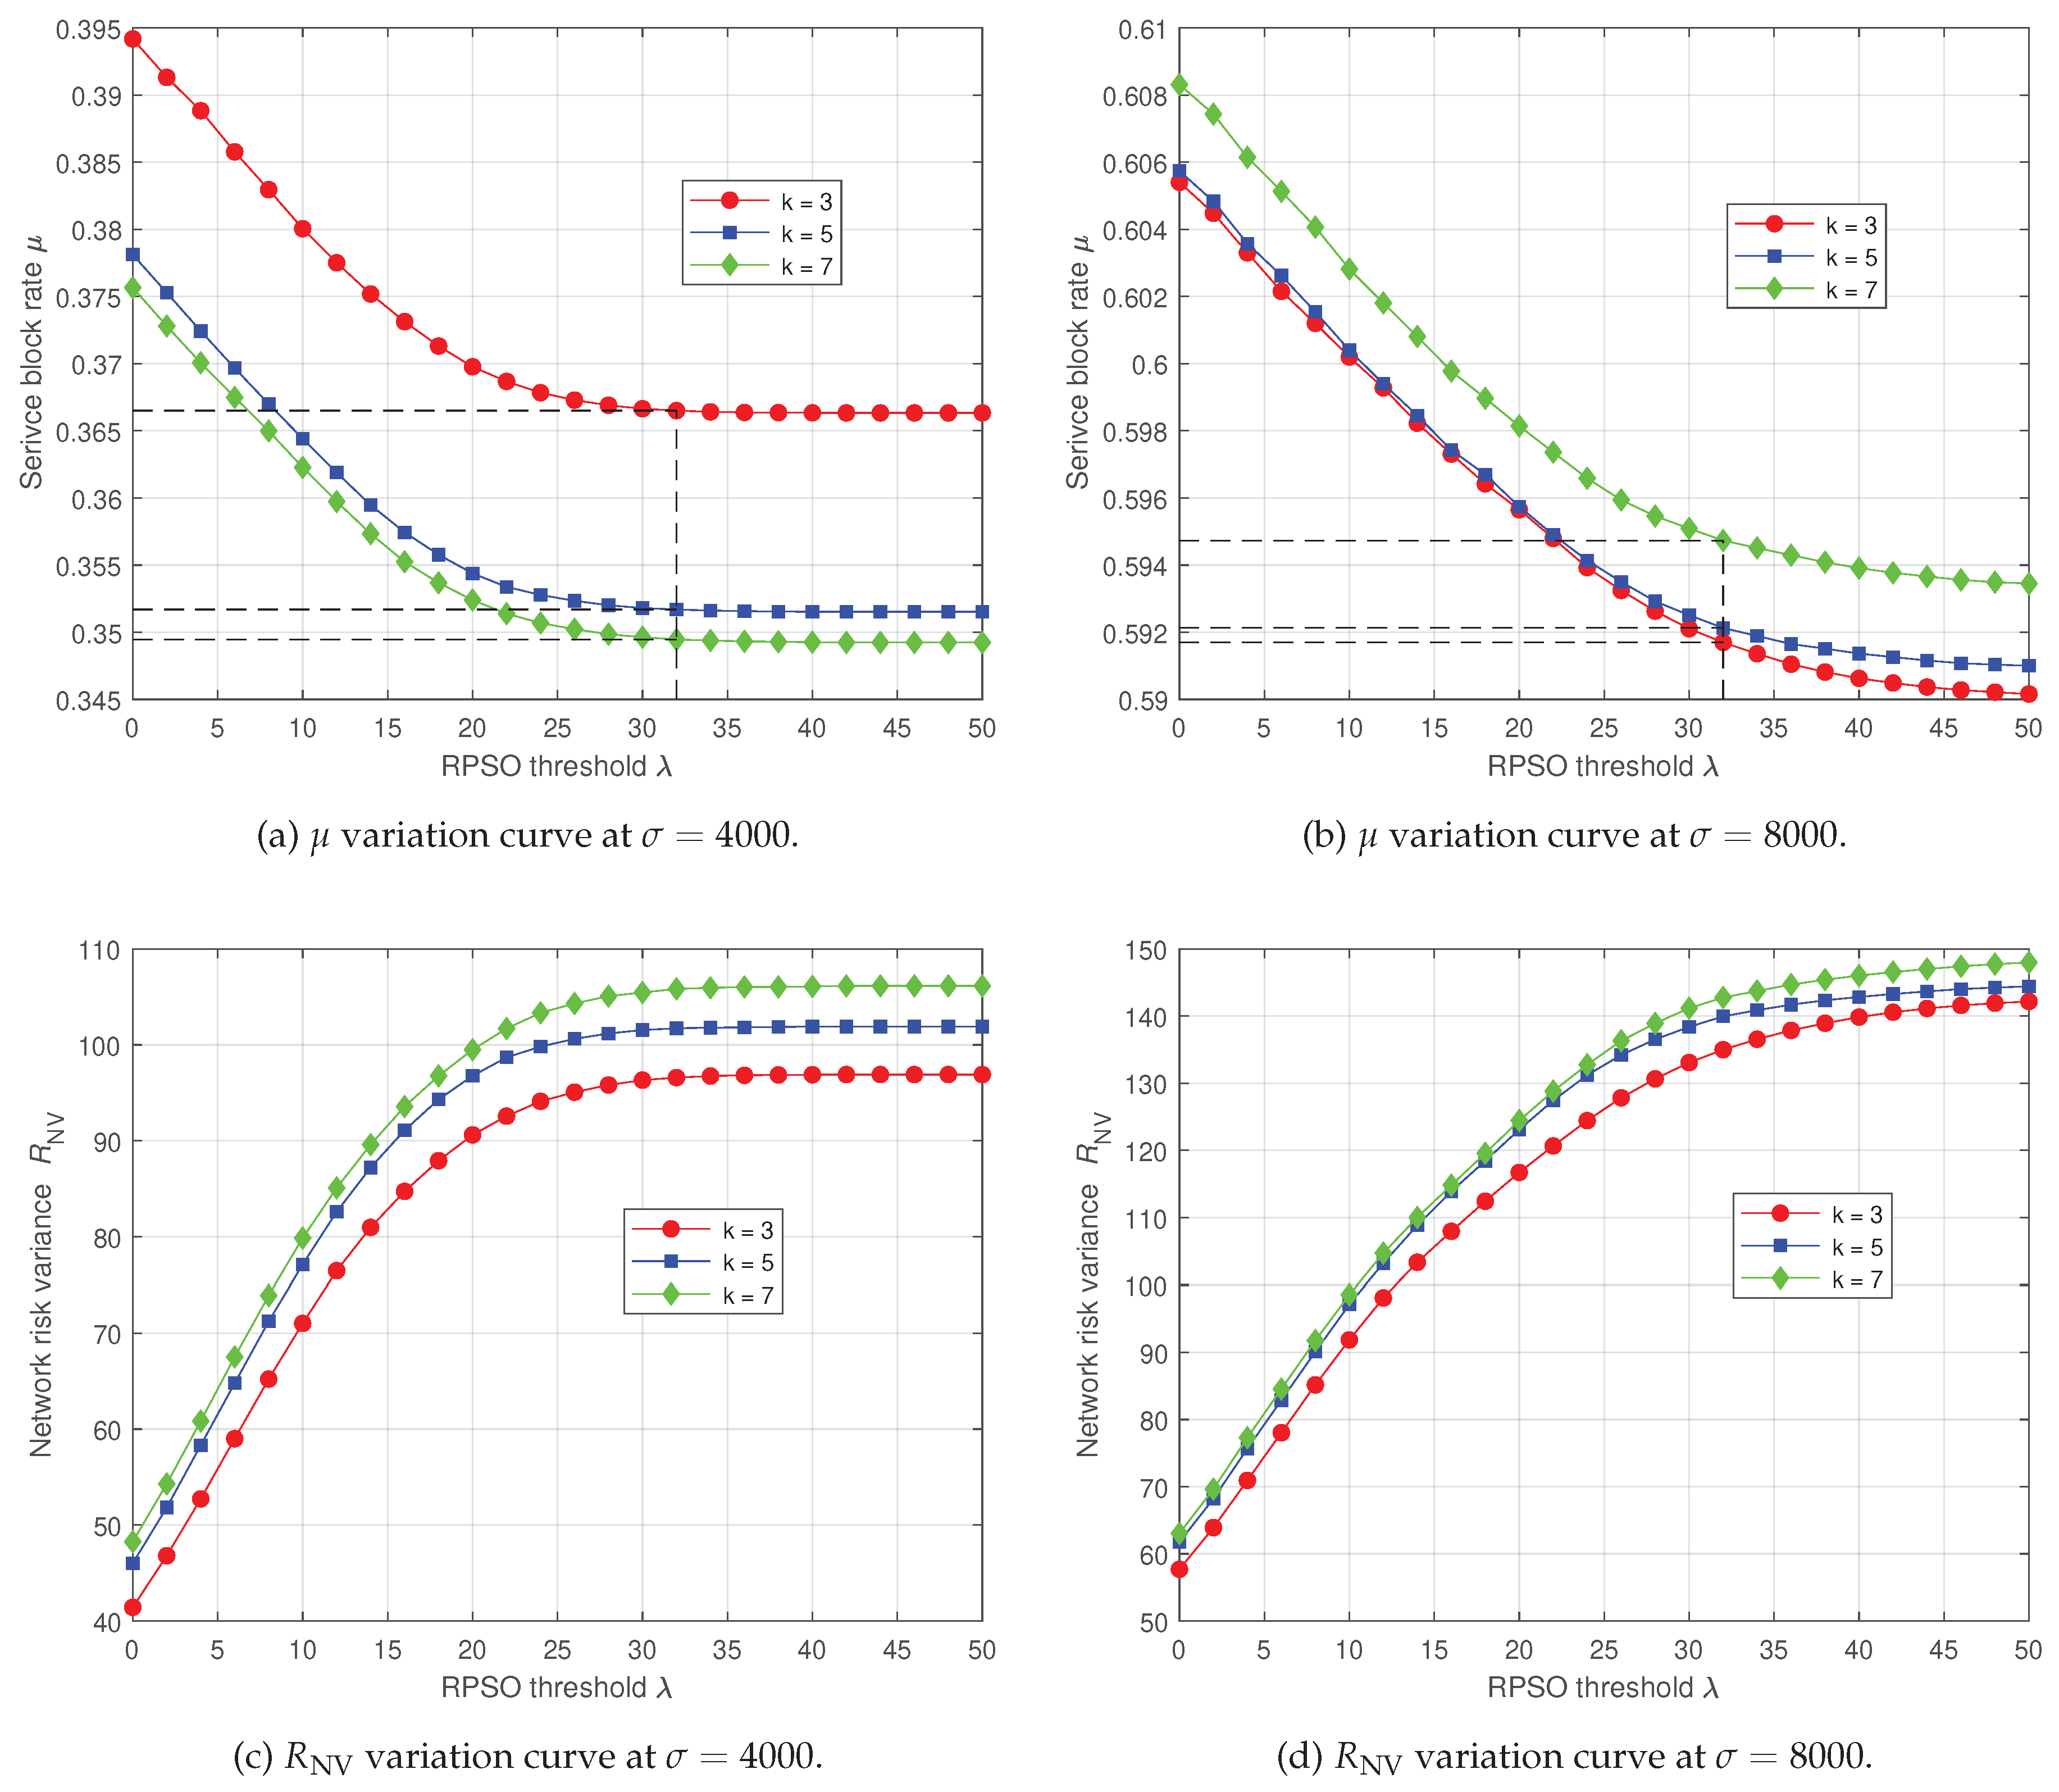
According to the RPSO-RB route planning scheme proposed in this paper, the route planning of σ service requests is carried out. The following studies the influence of the values of λ and k on the performance of the RPSO-RB routing scheme. In simulation, the upper limit η max ( e i j ) of bandwidth utilization of each link in the communication network is set as a constant 0.8. The service blocking rate μ and network risk variance R N V with RPSO threshold λ when traffic number σ is 4000 and 8000 are respectively presented in Figure 4Figure 4. The following is a detailed analysis.

6.2.1. Impact of RPSO threshold λ on solution performance

By comparison with Figure 4Figure 4, given the values of σ and k, blocking rate μ of network gradually decreases with the increase of RPSO threshold λ , while risk variance R NV gradually increases. When λ is less than 25, the law of μ increasing and R NV decreasing is approximately linear. After 25, the rate of change of μ and R NV gradually decreases until they no longer change.
As described in Section 3.2, when λ is small, the number of relay protection service blocks is large, resulting in higher μ , small risk difference between network nodes and links, and small R NV . As the value of λ increases, the number of relay protection service that can successfully allocate routes increases, while μ decreases and R NV increases. As the value of λ continues to increase, the effect of constraint (16) can be ignored. The route planning of almost all relay protection services is no longer constrained by overload. The number of relay protection services carried by each link is approximately constant, and the μ and R NV are also almost unchanged.

6.2.2. Impact of the value of k on the solution performance
Furthermore, as shown in Figure 4Figure 4, the influence of the value of k in KSP algorithm on the routing planning strategy can also be analyzed.
The service blocking rate μ is different due to the change of value of k compared with Figure 4 and Figure 4, which is related to σ . When σ = 4000 , μ decreases obviously with the increase of k; However, when σ = 8000 , increasing k, μ tends to increase slightly. According to Section 4.1, when σ is small, the link bandwidth resources of the network are relatively rich, and the larger k is, the smaller service blocking rate μ is. However, with the increase of σ , the remaining link bandwidth resources in the network decrease. The larger the value of k, the smaller the remaining link bandwidth resources, and the higher μ .
According to Figure 4 and Figure 4, given λ , when σ is 4000 or 8000, risk variance R N V tends to increase with the increase of k value. As described in Section 4.1, the larger k is, the more link bandwidth resources will be occupied by service routes, resulting in the increase of network risk variance R N V .
Figure 4. Service blocking rate μ and network risk variance R NV variation curve with RPSO threshold λ
Preprints 77790 g004

6.3. Comparison of route planning schemes
According to the experimental results in Section 6.1, under the conditions of setting communication network parameters and service parameters, the values of λ and k are set to 32 and 5 respectively, and the RPSO-RB route planning scheme is compared with other schemes.
For the convenience of description, the RPSO-RB routing Scheme proposed in this paper is denoated as Scheme A, and two other schemes B and C are selected as comparison schemes. In Scheme B, in the flow of Scheme A, perform route planning for multiple services regardless of constraint C1. Scheme C uses literature [17] to propose route planning algorithms that consider nodes risk and links risk. In the simulation experiment, the route planning effect of the three schemes is compared from the aspects of service blocking rate and network risk variance. Because Scheme C does not consider the upper limit of link utilization, the upper limit η max ( e i j ) of the bandwidth utilization of links in Scheme A and Scheme B is set to 1.
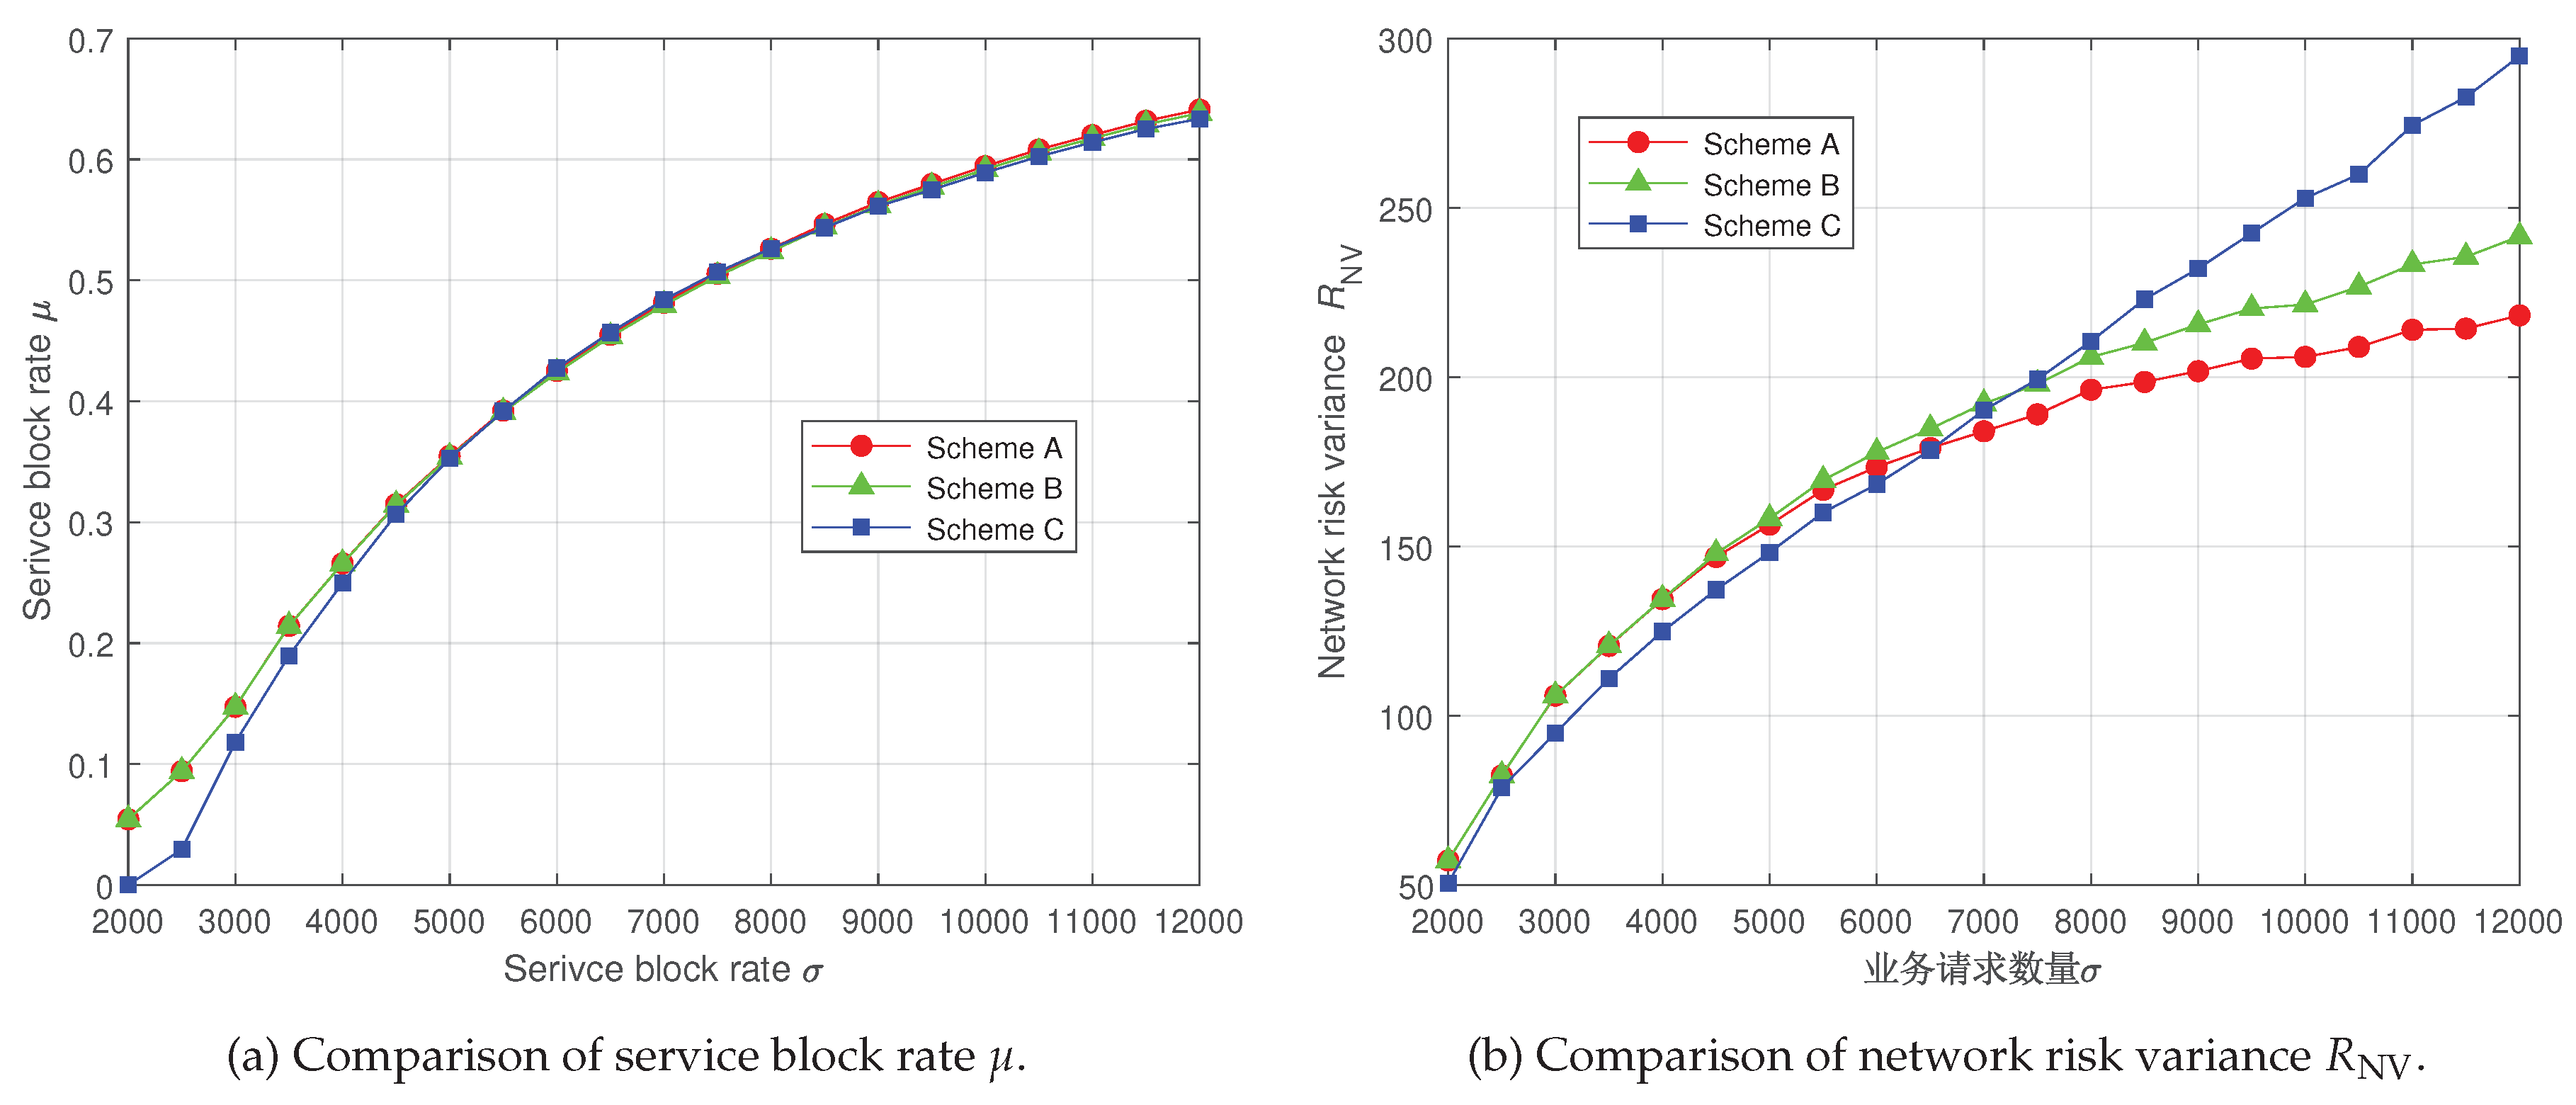
Figure 5 shows the comparison of service blocking rate μ of three schemes when the number of different service requests σ . With the increase of σ , the blocking rate μ of routing planning using three schemes increases gradually. When σ < 5000 , μ used in Scheme A and Scheme B for route planning is basically the same, but higher than that in Scheme C. Figure 5 compares the network risk variance R NV of the three schemes under different service request quantity σ . With the gradual increase of σ , the R NV of route planning using the three schemes gradually increase. When σ < 4500 , the R NV of Scheme A and Scheme B are basically the same, but higher than that of Scheme C. When 4500 < σ < 6500 , the R NV of Scheme C are minimum, Scheme B is maximum, and Scheme A is centered. When σ > 6500 , the R NV of Scheme A are lower than those of Scheme B and Scheme C.
On the whole, when the number of services requests is small, the service blocking rate μ and network risk variance R NV of Scheme A for route planning are large, but when the number of service requests is large, Scheme A has obvious advantages in the risk variance R NV . This is because when the number of service requests is small, Scheme A considers the overload constraint of relay protection service, resulting in a larger μ . However, the bandwidth resources of optical cable links in the network are certain. With the increase of σ , and μ of different schemes is basically the same. Scheme A aims to minimize R NV and limits the number of relay protection services carried by the link. So the corresponding R NV are minimal. Scheme B aims to minimize R NV and does not consider RPSO, whose corresponding R NV are larger than Scheme A. Scheme C seeks the route with the least risk for each service. As a result, some links carry too many services. When the number of services is large, the corresponding R NV is larger than that for Scheme A.
Figure 5. Comparison of service block rate μ and network risk variance R NV of different schemes under different service request numbers at λ = 32 and k = 5
Preprints 77790 g005

7. Conclusions

In this paper, a route planning system model of power communication network is established, and a route planning scheme of power communication network is proposed considering overload of relay protection service and risk balance. It is constrained by service delay requirement, link bandwidth utilization limit, overload limit of relay protection service and double routes satisfying link disjoint, and aims at minimizing network risk variance. The route planning for various services is completed. Simulation results show that the proposed scheme can avoid RPSO, balance network risk, and improve the reliability of power communication network transmission. In the future research, more parameters related to power communication network will be considered to build a more perfect route planning system model of power communication network.

Acknowledgments

The work was supported by the Science and Technology project of State Grid Corporation of China(Research on Dispatching Fusion Communication Oriented to Power Communication Network and Its Cooperative Control with Power Network Operation, 52060022001B).

References

  1. J. Sanusi, O. Oghenewvogaga, B. B Adetokun, A. M Abba, The impact of communication technologies on the smart grid, 2022 IEEE Nigeria 4th International Conference on Disruptive Technologies for Sustainable Development (NIGERCON) (2022) 1-5. [CrossRef]
  2. F. E. Abrahamsen, Y. Ai, M. Cheffena, Communication technologies for smart grid: A Comprehensive Survey, Sensors 21 (23) (2021) 8087. [CrossRef]
  3. P. Y Kong, Optimal configuration of interdependence between communication network and power grid, IEEE Transactions on Industrial Informatics 15 (7) (2019) 4054-4065. [CrossRef]
  4. Z. Min, W. Muqing, Q. Lilin, A. Quanbiao, L. Sixu, Evaluation of cross-Layer network vulnerability of power communication network based on multi-dimensional and multi-layer node importance analysis, IEEE Access 10 (2022) 67181-67197. [CrossRef]
  5. D. Said, A survey on information communication technologies in modern demand-side management for smart grids: challenges, solutions, and opportunities, IEEE Engineering Management Review 51 (1) (2023) 76-107. [CrossRef]
  6. S. Aggarwal, N. Kumar, S. Tanwar, M. Alazab, A survey on energy trading in the smart grid: taxonomy, research challenges and solutions, IEEE Access 9 (2021) 116231-116253. [CrossRef]
  7. P. Y Kong, Routing in communication networks With interdependent power grid, IEEE/ACM Transactions on Networking 28 (4) (2020) 1899-1911. [CrossRef]
  8. W. Yao, Q. Chen, J. She, J. Chen, X. Zhuo, J. Li, Method for calculating the link importance of power communication network based on link availability, 2019 IEEE 3rd Advanced Information Management, Communicates, Electronic and Automation Control Conference (IMCEC) (2019) 136-139. [CrossRef]
  9. Y. Guo, M. Xu, Research on reliability evaluation model and path optimization for power communication network, 2015 5th International Conference on Electric Utility Deregulation and Restructuring and Power Technologies (DRPT) (2015) 2495-2500. [CrossRef]
  10. Z. Shao, Y. Wang, X. Chen, Y. Zhang, J. He, Z. Wang, A network risk assessment methodology for power communication business, 2016 IEEE International Conference on Network Infrastructure and Digital Content (IC-NIDC) (2016) 40-43. [CrossRef]
  11. Y. Huang, X. Shen, Y. Xiao, M. Sun, H. Liao and W. Yuan, Research on risk assessment algorithm for power monitoring global network based on link importance and genetic algorithm, 2022 International Conference on Knowledge Engineering and Communication Systems (ICKES) (2022) 1-8. [CrossRef]
  12. O. Dong, P. Yu, H. Liu, L. Feng, W. Li, F. Chen, L. Shi, A service routing reconstruction approach in cyber-physical power system based on risk balance, NOMS 2018 - 2018 IEEE/IFIP Network Operations and Management Symposium (2018) 1-6. [CrossRef]
  13. B. Ti, J. Wang, G. Li, M. Zhou, Operational risk-averse routing optimization for cyber-physical power systems, CSEE Journal of Power and Energy Systems 8 (3) (2022) 801-811. [CrossRef]
  14. B. Liu, P. Yu, X. Qiu, L. Shi, Risk-aware service routes planning for system protection communication networks of software-defined networking in energy Internet, IEEE Access 8 (2020) 91005-91019. [CrossRef]
  15. M. Luo, X. Hou, J. Yang, Surface Optimal Path Planning Using an Extended Dijkstra Algorithm, IEEE Access 8 (2020) 147827-147838. [CrossRef]
  16. B. Chen, X. Chen, H. Chen, W. H K Lam, A fast algorithm for finding K shortest paths using generalized spur path reuse technique, Transactions in GIS 25 (2021) 516-533. [CrossRef]
  17. P. Zhao, P. Yu, C. Ji, L. Feng, W. Li, A routing optimization method based on risk prediction for communication services in smart grid, 2016 12th International Conference on Network and Service Management (CNSM) (2016) 377-382. [CrossRef]
  18. N. Xing, S. Xu, S. Zhang, S. Guo, Load balancing-based routing optimization mechanism for power communication networks, China Communications 13 (8) (2016) 169-176. [CrossRef]
  19. J. Lv, Y. Liu, K. Gao, J. Wang, X. Guo, X. Yu, Y. Zhao, J. Zhang, Service awareness recovery under N-1 failure in power grid optical communication networks, 2021 IEEE 4th International Conference on Automation, Electronics and Electrical Engineering (AUTEEE) (2021) 303-306. [CrossRef]
  20. N. Ngamjaroen, P. Rapisak, Communication service risk evaluation based on risk balancing network for selecting service route, 2021 International Conference on Power, Energy and Innovations (ICPEI) (2021) 171-174. [CrossRef]
  21. B. Li, C. Lu, B. Qi, Y. Sun, D. Li, S. Chen, B. Yang, P-cycle based protection scheme with cycle multiplexing and capacity balance for multicast service in substation communication network, International Journal of Electrical Power & Energy Systems 102 (2018) 340-348. [CrossRef]
  22. B. Qi, L. Liu, B. Li, S. Liu, X. Wu, C. Lu, C. Zhu, An emerging survivability technology for dispatching service of electric power communication network, IEEE Access 6 (2018) 21231-21241. [CrossRef]
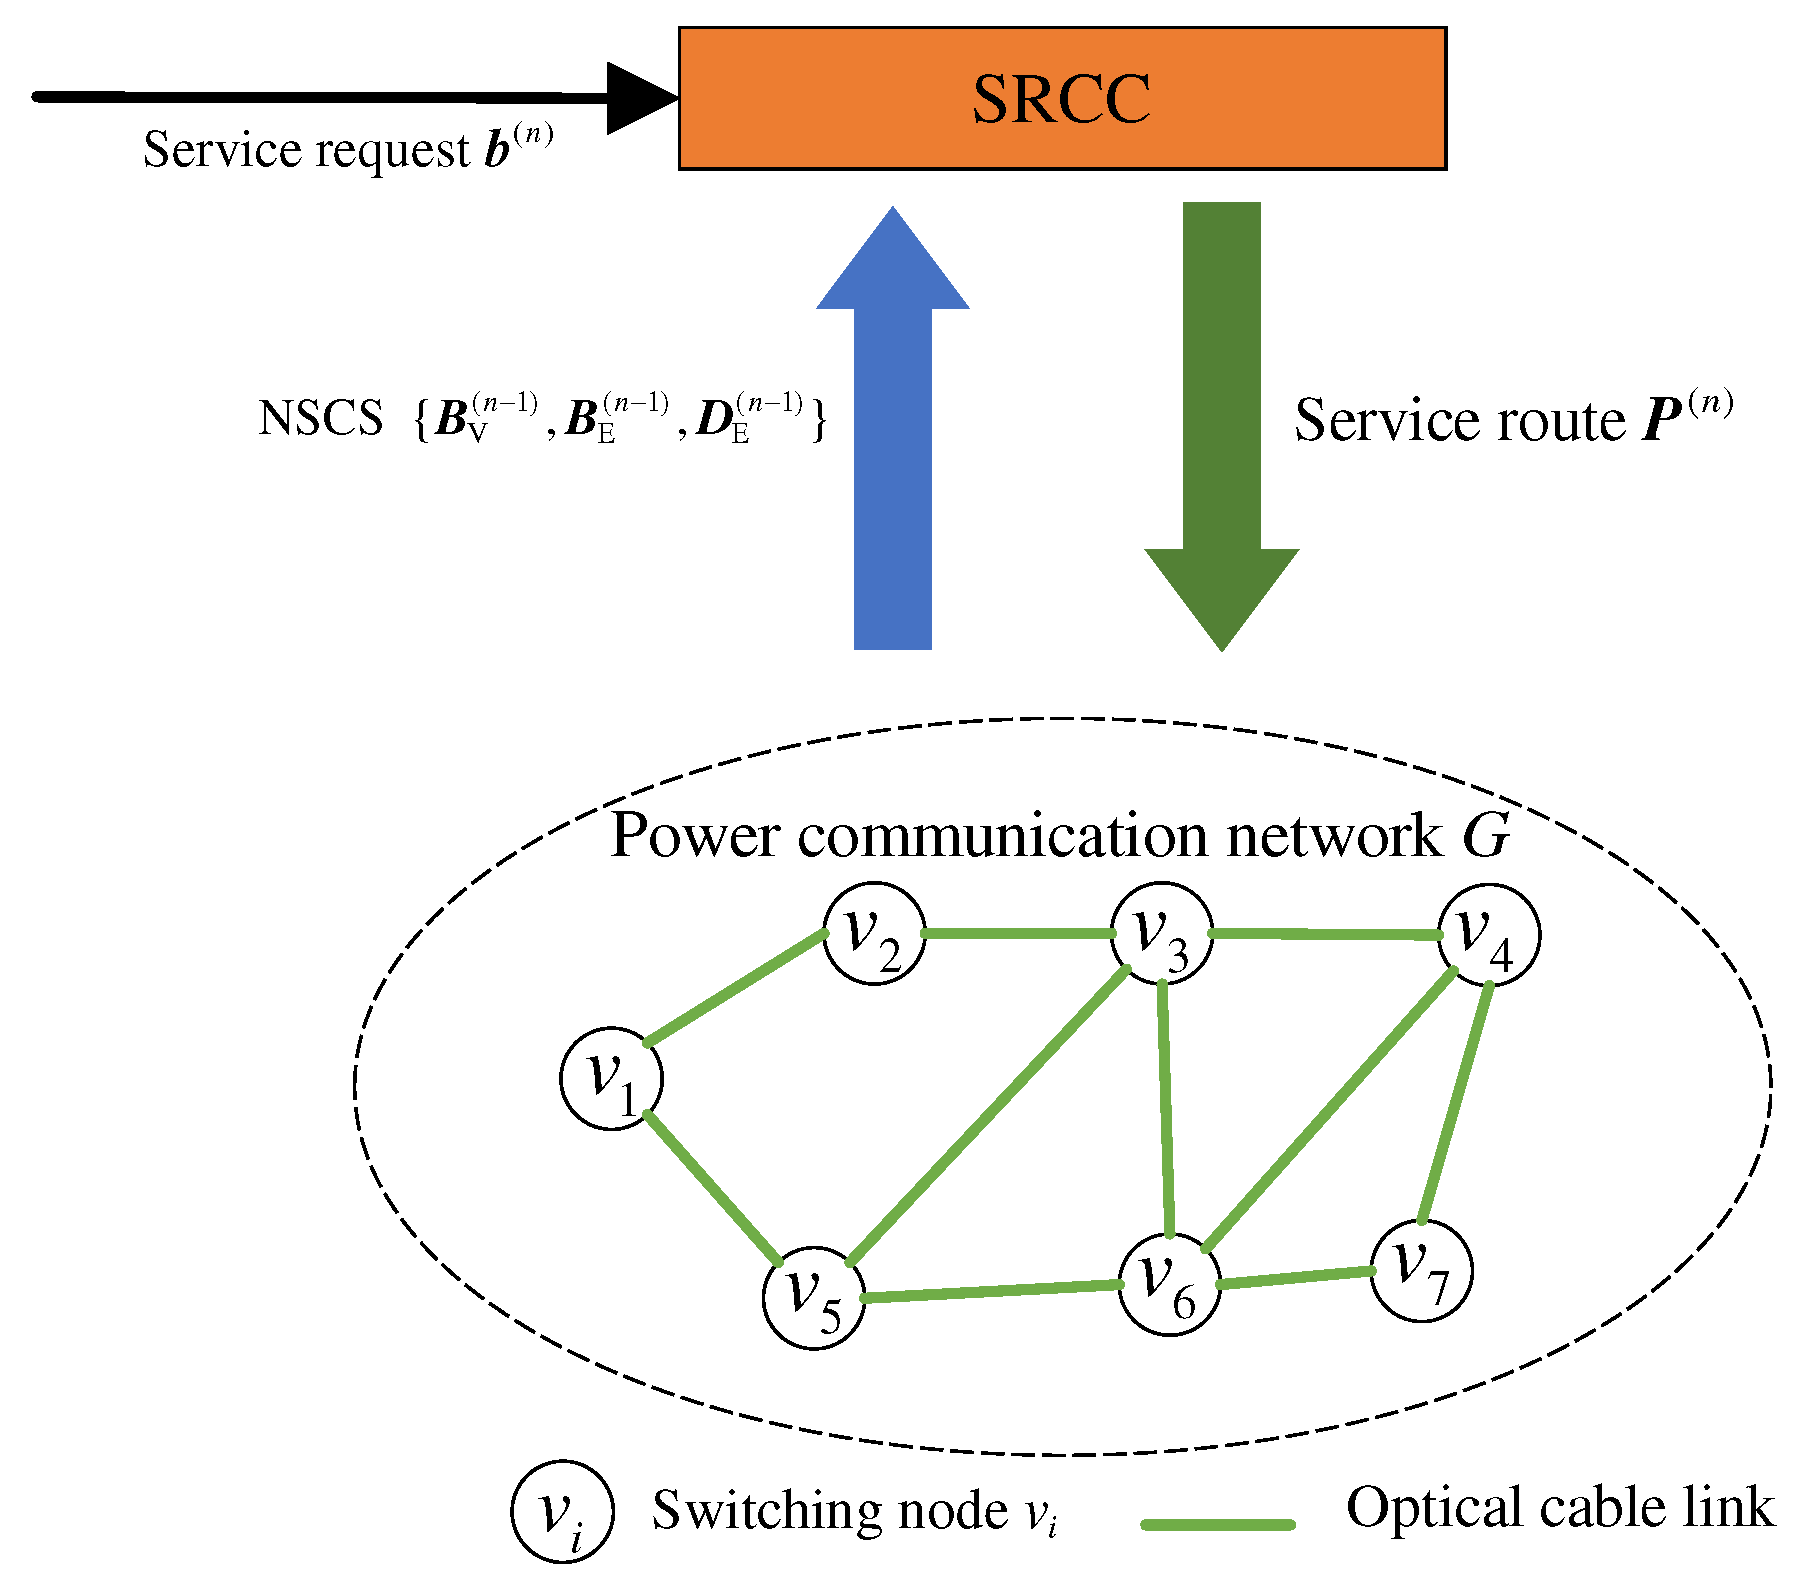
Figure 1. Route planning architecture of power communication network service.
Preprints 77790 g001
Figure 2. The flow chart of RPSO-RB route planning scheme.
Preprints 77790 g002
Figure 3. Power cable network in part of China.
Preprints 77790 g003
Table 1. Service types and characteristic parameters.
Service types Maximum
delay/ms
Bandwidth
/(Mbits/s)
Service
importance
Service
quantity ratio
Relay protection
service
12 2 0.9981 5
Stably controls
system service
30 2 06069 10
Schedule automation
service
100 2 0.1008 20
Communication
monitoring service
500 2 0.0768 15
Management
telephone service
5000 0.5 0.0652 30
Information support
system service
5000 10 0.0234 20
Disclaimer/Publisher’s Note: The statements, opinions and data contained in all publications are solely those of the individual author(s) and contributor(s) and not of MDPI and/or the editor(s). MDPI and/or the editor(s) disclaim responsibility for any injury to people or property resulting from any ideas, methods, instructions or products referred to in the content.
Copyright: This open access article is published under a Creative Commons CC BY 4.0 license, which permit the free download, distribution, and reuse, provided that the author and preprint are cited in any reuse.
Prerpints.org logo

Preprints.org is a free preprint server supported by MDPI in Basel, Switzerland.

Subscribe

© 2024 MDPI (Basel, Switzerland) unless otherwise stated