1. Introduction
Groundwater is one of the most important components of water cycle in coastal environments. Hydrological resources of this mechanism depend mainly on local climatic conditions (rainfall, snowfall, temperature, evaporation), influence of the sea level, and human activity (Backman et al., 2007, Wendt et al., 2020). In the context of the present global warming (IPCC, 2018), is important to monitor groundwater changes and identify potential hazards leading to drought. These complex phenomena occur across Europe (e,g,, Spinoni et al 2014, 2016,2019; Rebetez et al 2006; Ionita et al. 2017,2022; Laaha et al. 2017; Moravec et al 2021). Their effects lead to significant economic, social, and environmental costs. Droughts is variably classified as meteorological, agricultural, hydrological (including groundwater), and socio-economic drought (Tallaksen and Van Lanen 2004; Mishra and Singh, 2010; Van Loon 2015). Drought is defined as a situation, in which the groundwater level is lower than its normal state, including flow rate decreases in spring (Van Loon and Anne, 2015; Marchant and Bloomfield, 2018). Groundwater deficiencies are caused by low precipitation and rising temperatures, which, lead to an increase in spatial evapotranspiration. Groundwater reacts slowly to meteorological drought; usually with a certain delay, and takes a long time to recharge/restore (Chamanpira et al., 2014; Chao et al., 2017; Batalha et al., 2018). During recent years, a general global trend toward more frequent and more severe meteorological droughts has been observed (Dai, 2011; Spinoni et al., 2014; Cammallieri et al., 2020; Chiang et al., 2021). This tendency also relates the Europe, including the Baltic Sea coast.
This study presents comprehensive evidence, showing determinant linkages between meteorological conditions, particularly during hot and dry annual intervals, sea level changes and groundwater flows, ultimately generating a drought on the coast. This complex process has been investigated at the Łeba Barrier in the middle part of the Polish Baltic area. The novel knowledge, resulting from the long-term field monitoring, documents negative responses of the coastal groundwater system primarily determined by shortages of rainfall and low sea levels.
2. Materials and Methods
2.1. Study Area
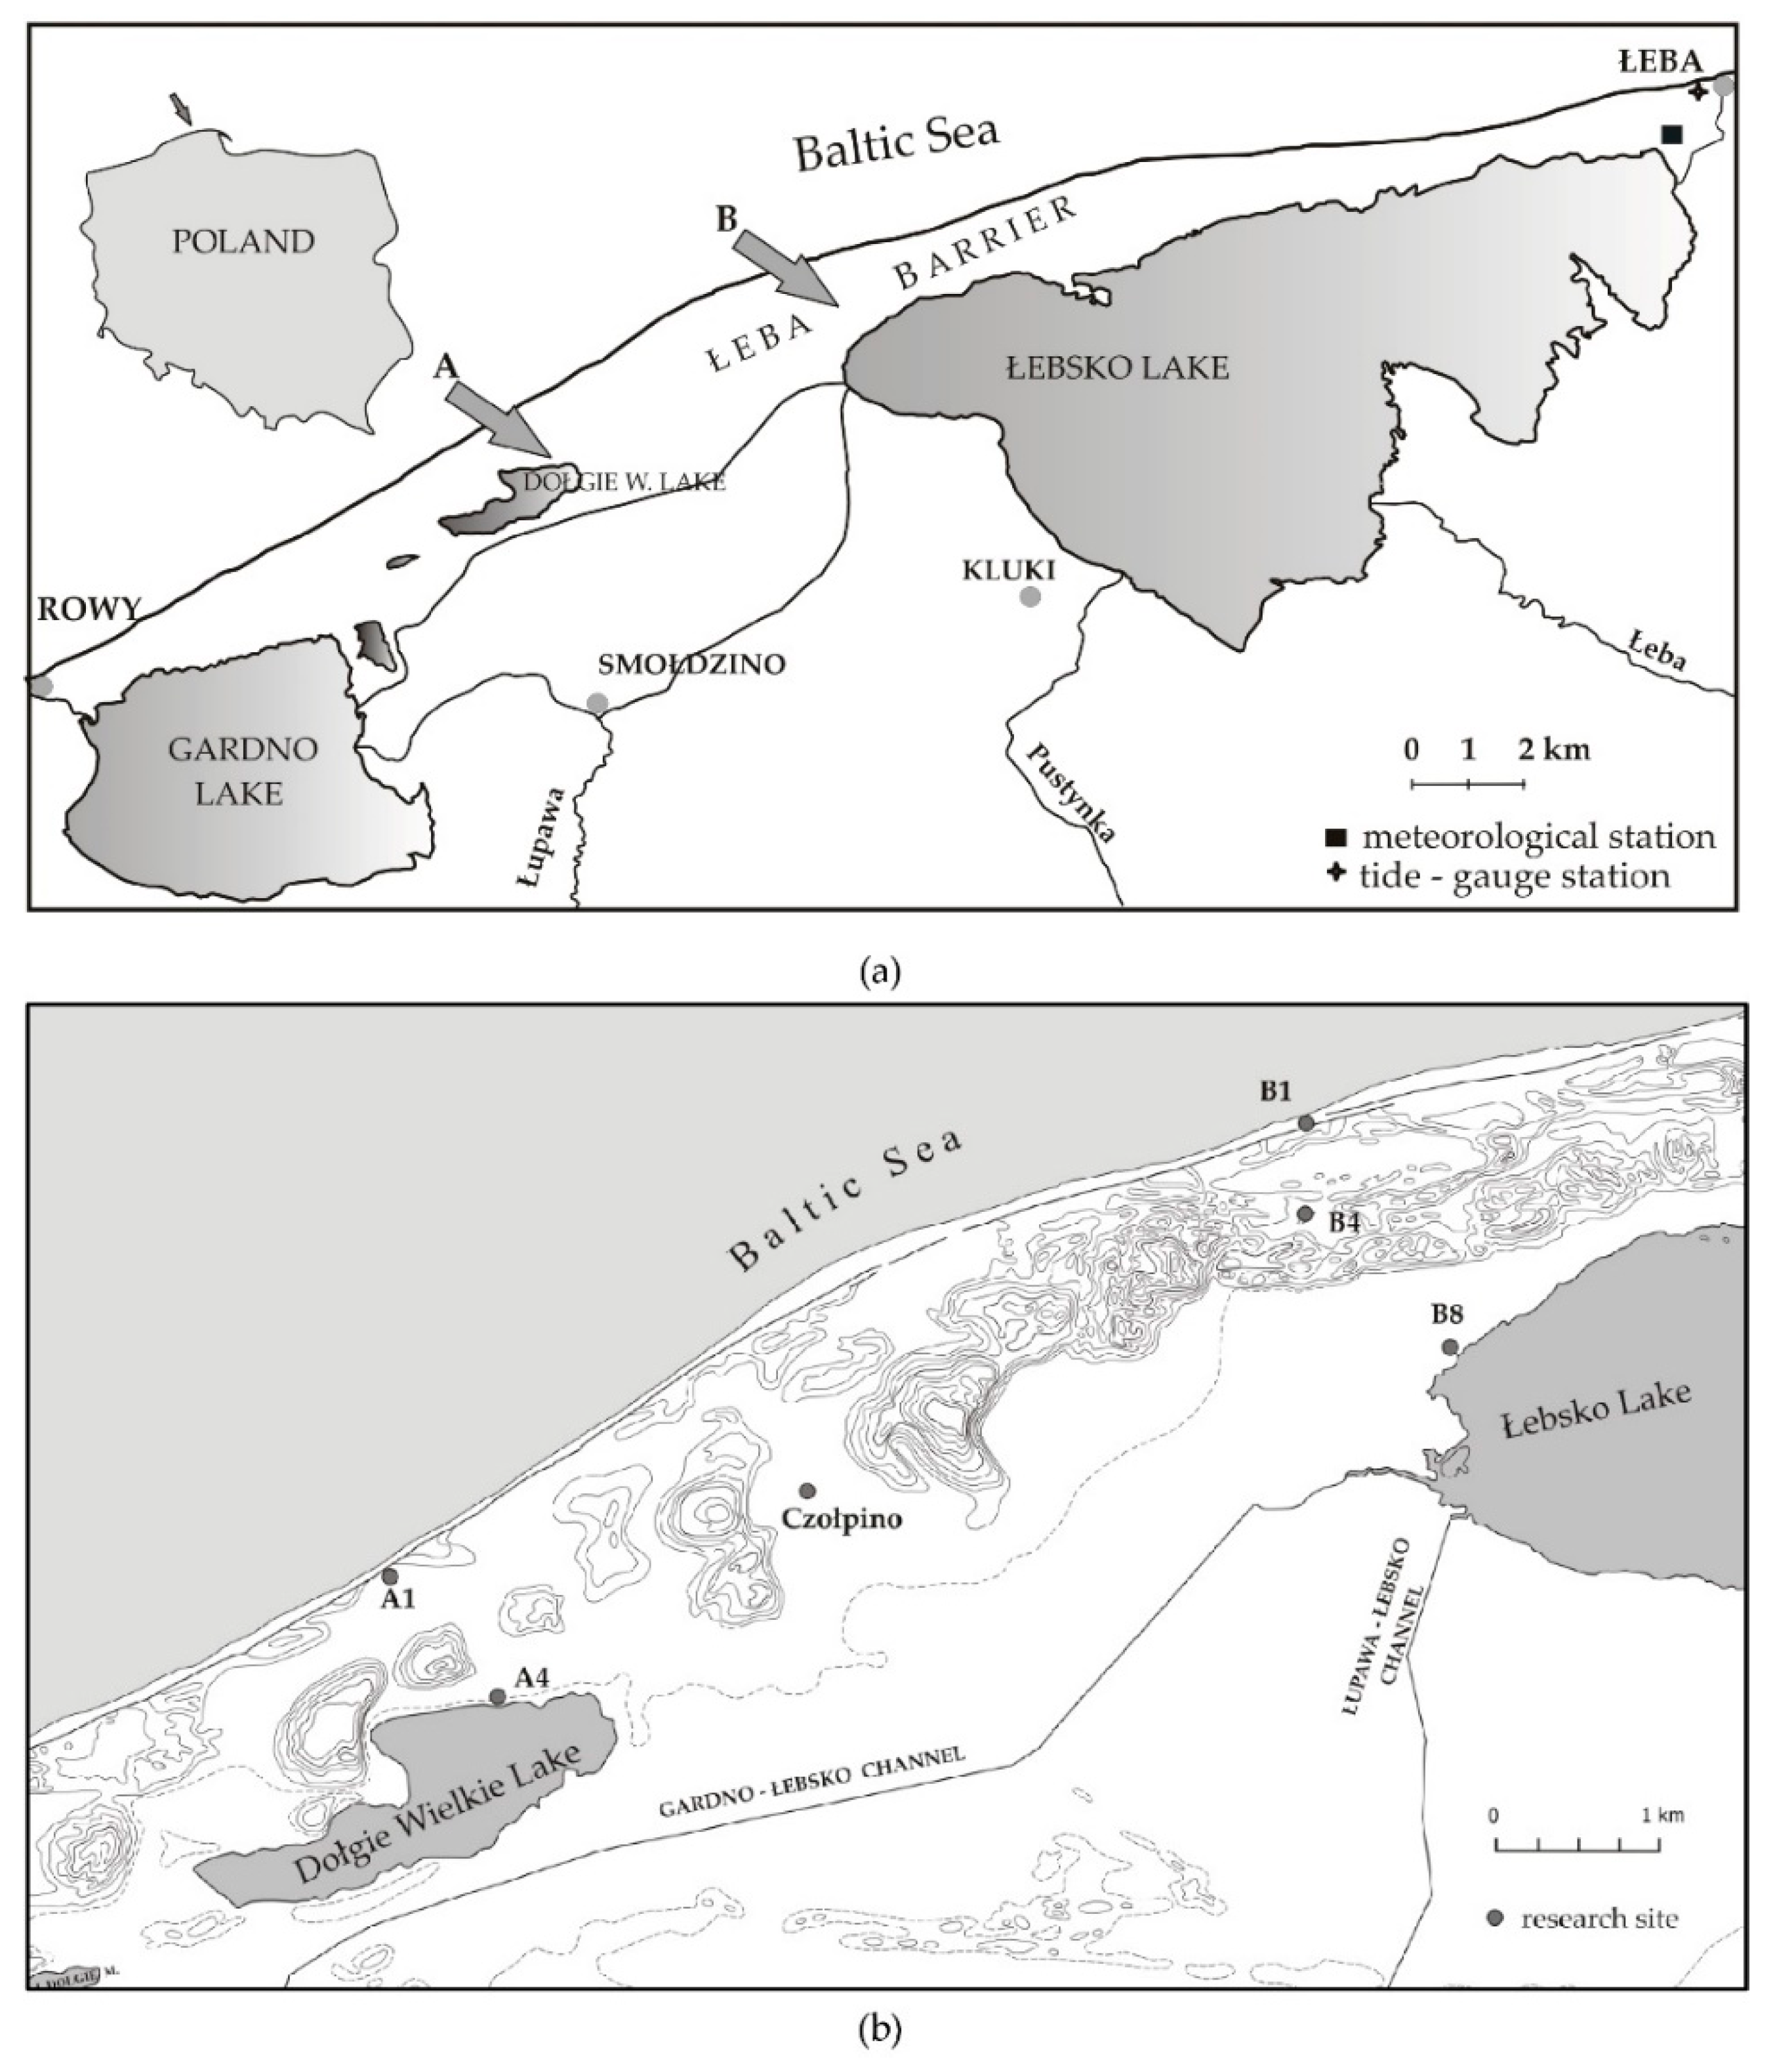
The study was carried out in the central part of the Polish Baltic coast delimited by the 201 km and 208 km of the Polish shoreline (according to the Maritime Office), in the western part of the Łeba Barrier (
Figure 1A). The Łeba Barrier, 0.6-2 km wide, covered by sand dunes, is a stretch of land defined by a well-developed barrier-lagoon coast (Rotnicki 1995). The investigated sector is located within the naturally protected area of the Słowiński National Park (SNP) encompassing a total of 32 744.03 ha west of the city of Łeba. About 1/3 of the park's area is occupied by lakes. The largest of them is Łebsko Lake connecting to the sea by a channel—the mouth of the Łeba River. Brackish waters of the lake are separated from the sea by the Łeba Barrier, stretching over a distance of 40 km. Its hydrological regime is conditioned on one hand by the inflow of water from rivers, alimenting it on level 80-90%, on the other hand by changing hydrodynamic conditions between the lake and the Baltic Sea (Chlost and Ciesliński 2005).To the west, there is a smaller, freshwater DołgieWielkie Lake physically separated from the sea.
According to the regional groundwater scheme (Paczyński and Sadurski, 2007), the study area is located within the hydrogeological unit of the East Pomeranian Province of the Baltic coast. Quaternary sediments and geomorphic backgrounds here constitute a collector (natural reservoir) of groundwater in permeable deposits of a glacio-fluvial, marine, and riverine origin (Kordalski, Lidzbarski, 2000; Szelewicka, 2000). The analyzed section of the barrier is built mainly by sandy marine sediments inter-bedded by organic layers (Rotnicki 2009), and overlain by loose aeolian sands. The groundwater level is usually at a depth of 1–5 m; at the Łeba Barrier even below 15 meters (Lidzbarski, 2004).
2.2. Data Collection
Groundwater monitoring was conducted in the area of active coastal dunes, and on the adjoining marshlands, which extend in the vicinity of Łebsko Lake (
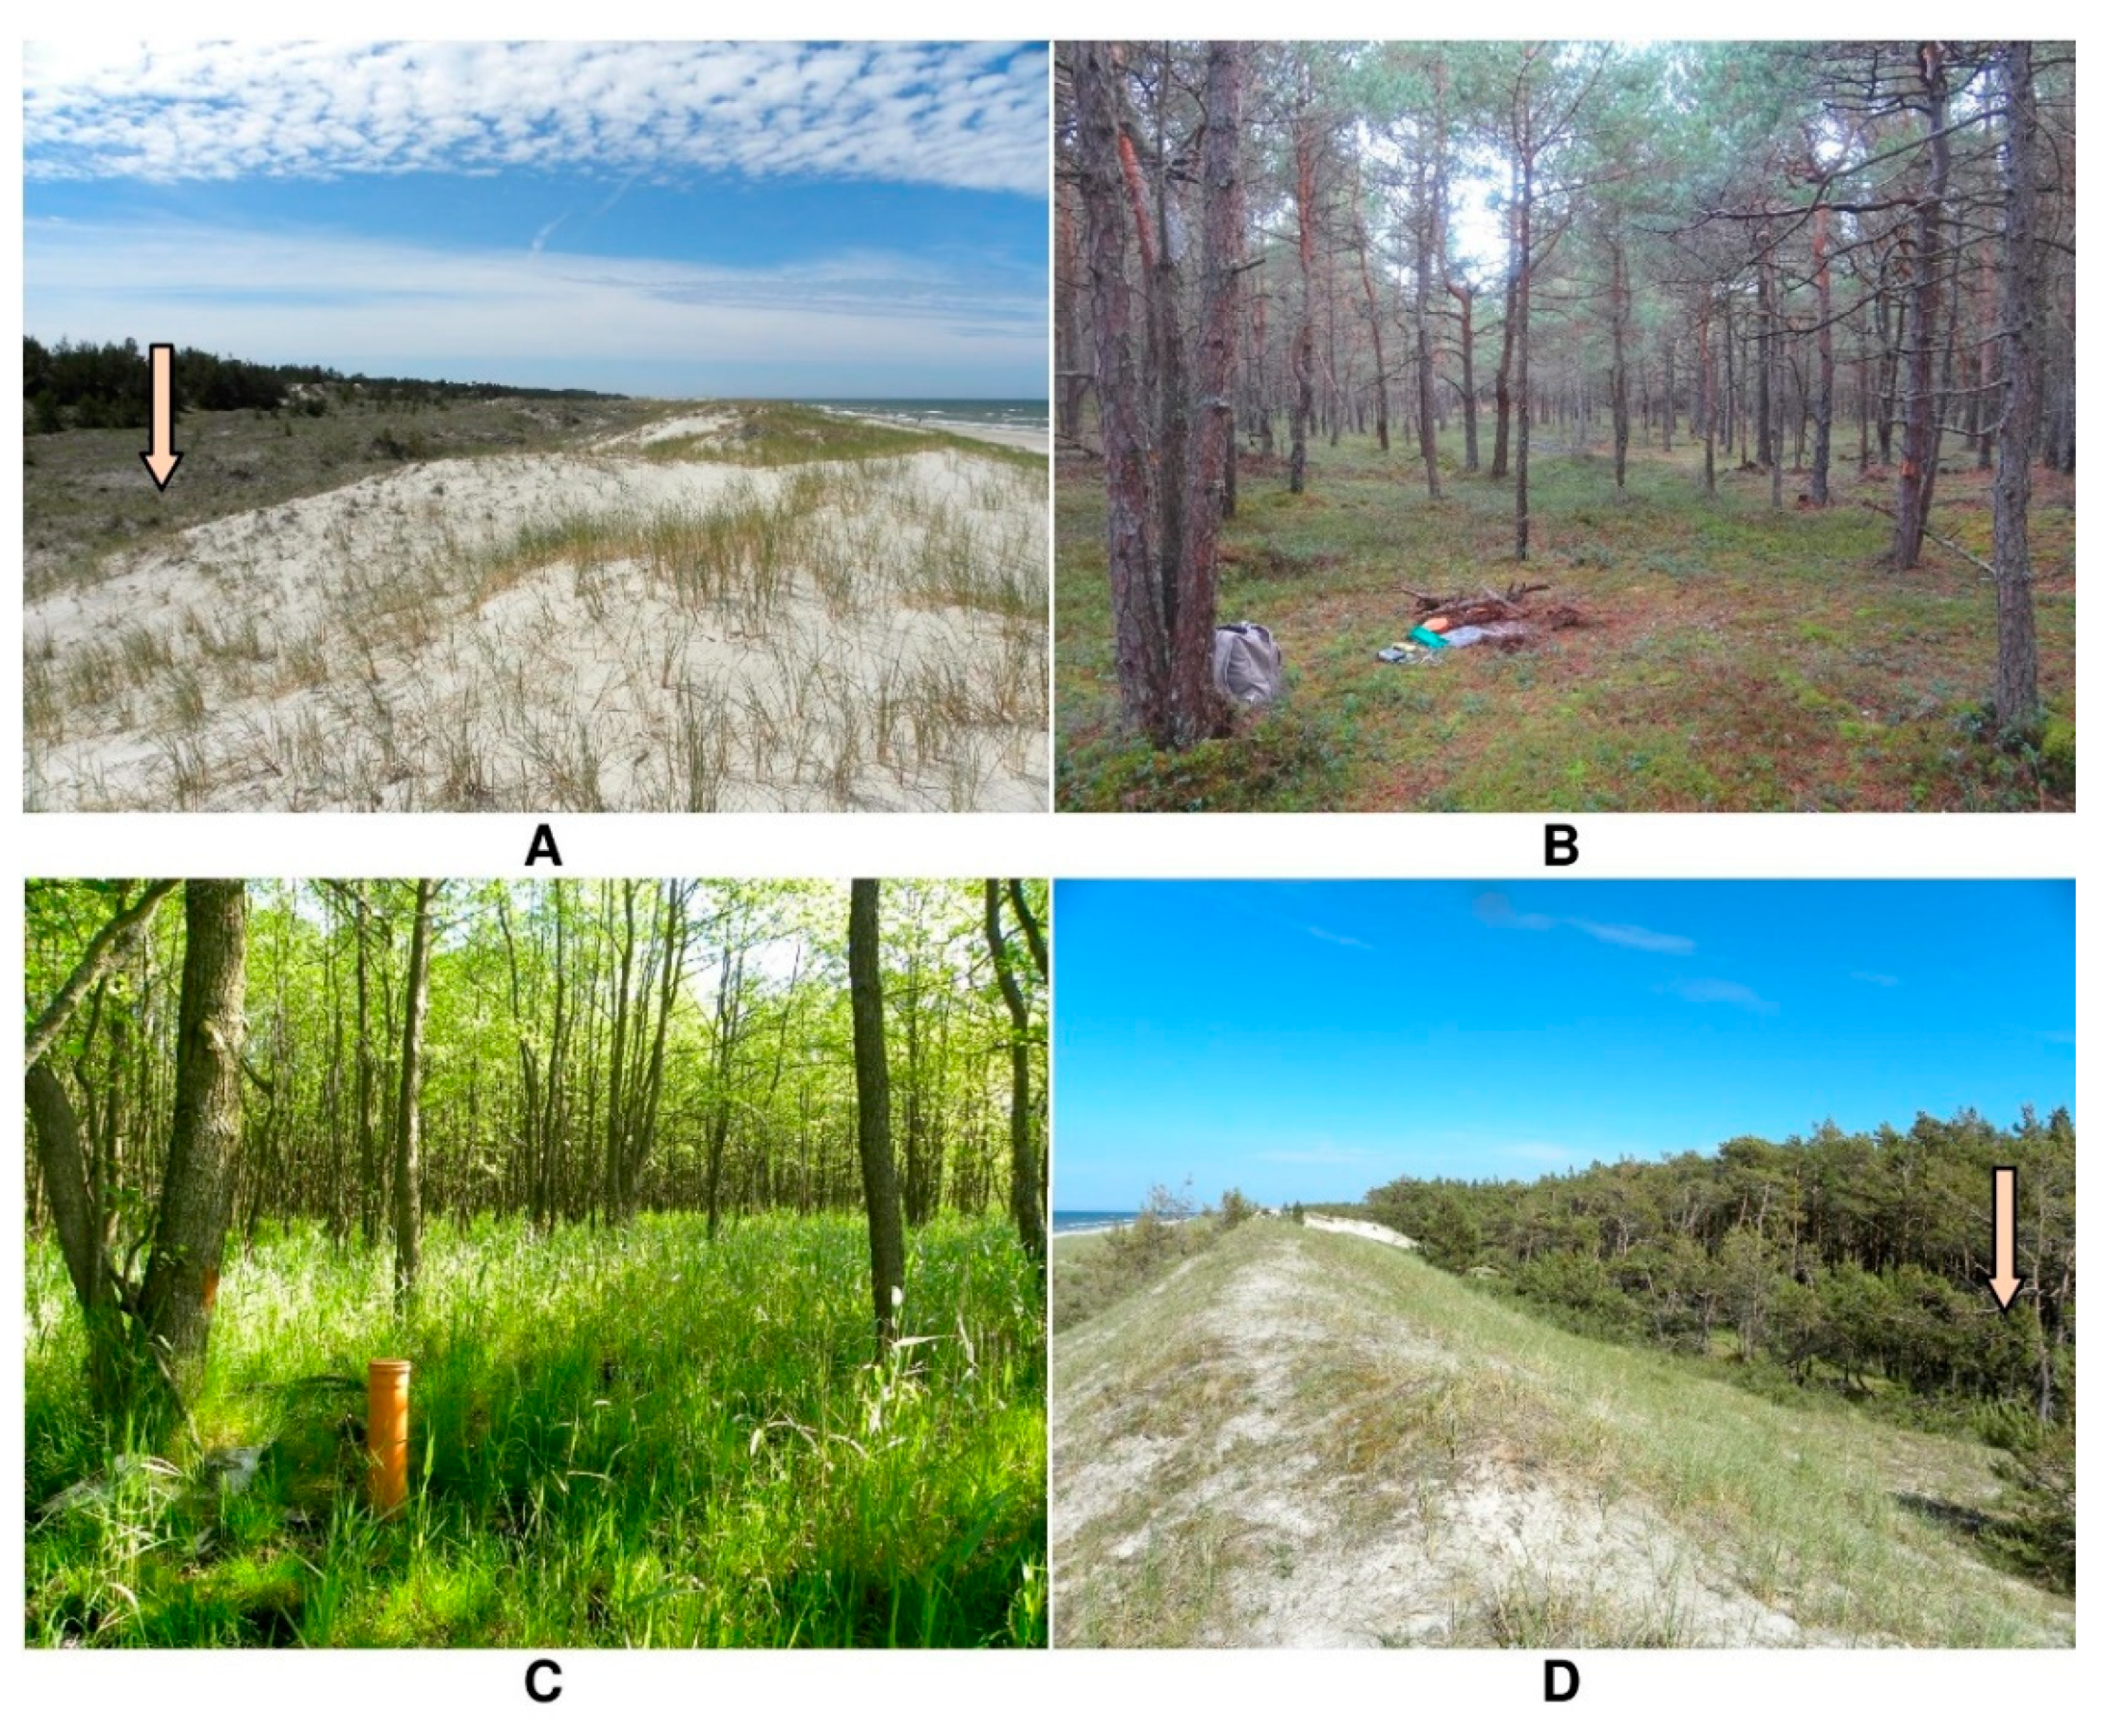
Figure 1B). Hydrological data recorded by piezometers were also collected near the DołgieWielkie Lake, where the coastal spit is narrower. The piezometers were positioned between the Baltic Sea and the coastal lakes Łebsko and DołgieWielkie (
Figure 1B,2). The electronic recorders—DIVER (Schlumberger Water Service) were installed in a total of five piezometers (A1, A4, B1, B4, B8).
Observations of the fluctuating groundwater level within the monitoring site network were performed over the 2009–2020 hydrological years, providing a reliable analytical data set considering the more then decadal monitoring period (Kazimierski et al., 2009). Until now, there has been absence of a detailed regional groundwater monitoring performed long-term. Own field data were completed by the analytical data of the groundwater fluctuations on the Łeba Barrier from the Czołpino site of the State Monitoring Network. A hydrogeological monitoring at Czołpino has been carried out by the Polish Hydrogeological Survey (PHS) since 2005. The statistically processed annual records from this location are summarized in the Hydrogeological Annual Report of the Polish Geological Institute-the National Research Institute (
https://www.pgi.gov.pl/psh).
The measurements of the Baltic Sea level on the Polish coast, the Łebsko Lake level, rainfall and air temperature, integrated in this study, were conducted by the Institute of Meteorology and Water Management. The meteorological and sea level data of the Institute of Meteorology and Water Management at the National Research Institute (IMWM-NRI) were used; more specifically, the records from the synoptic station (IMWM-NRI) at Łeba (N 54º45’, E 17º32’). These meteorological and hydrological records are freely available
https://danepubliczne.imgw.pl website. In this study, the data have been presented with a reference to the hydrological year, which in Poland is from 1 November until 31 October.
3. Results
3.1. Groundwater Level Change (2009–2020)
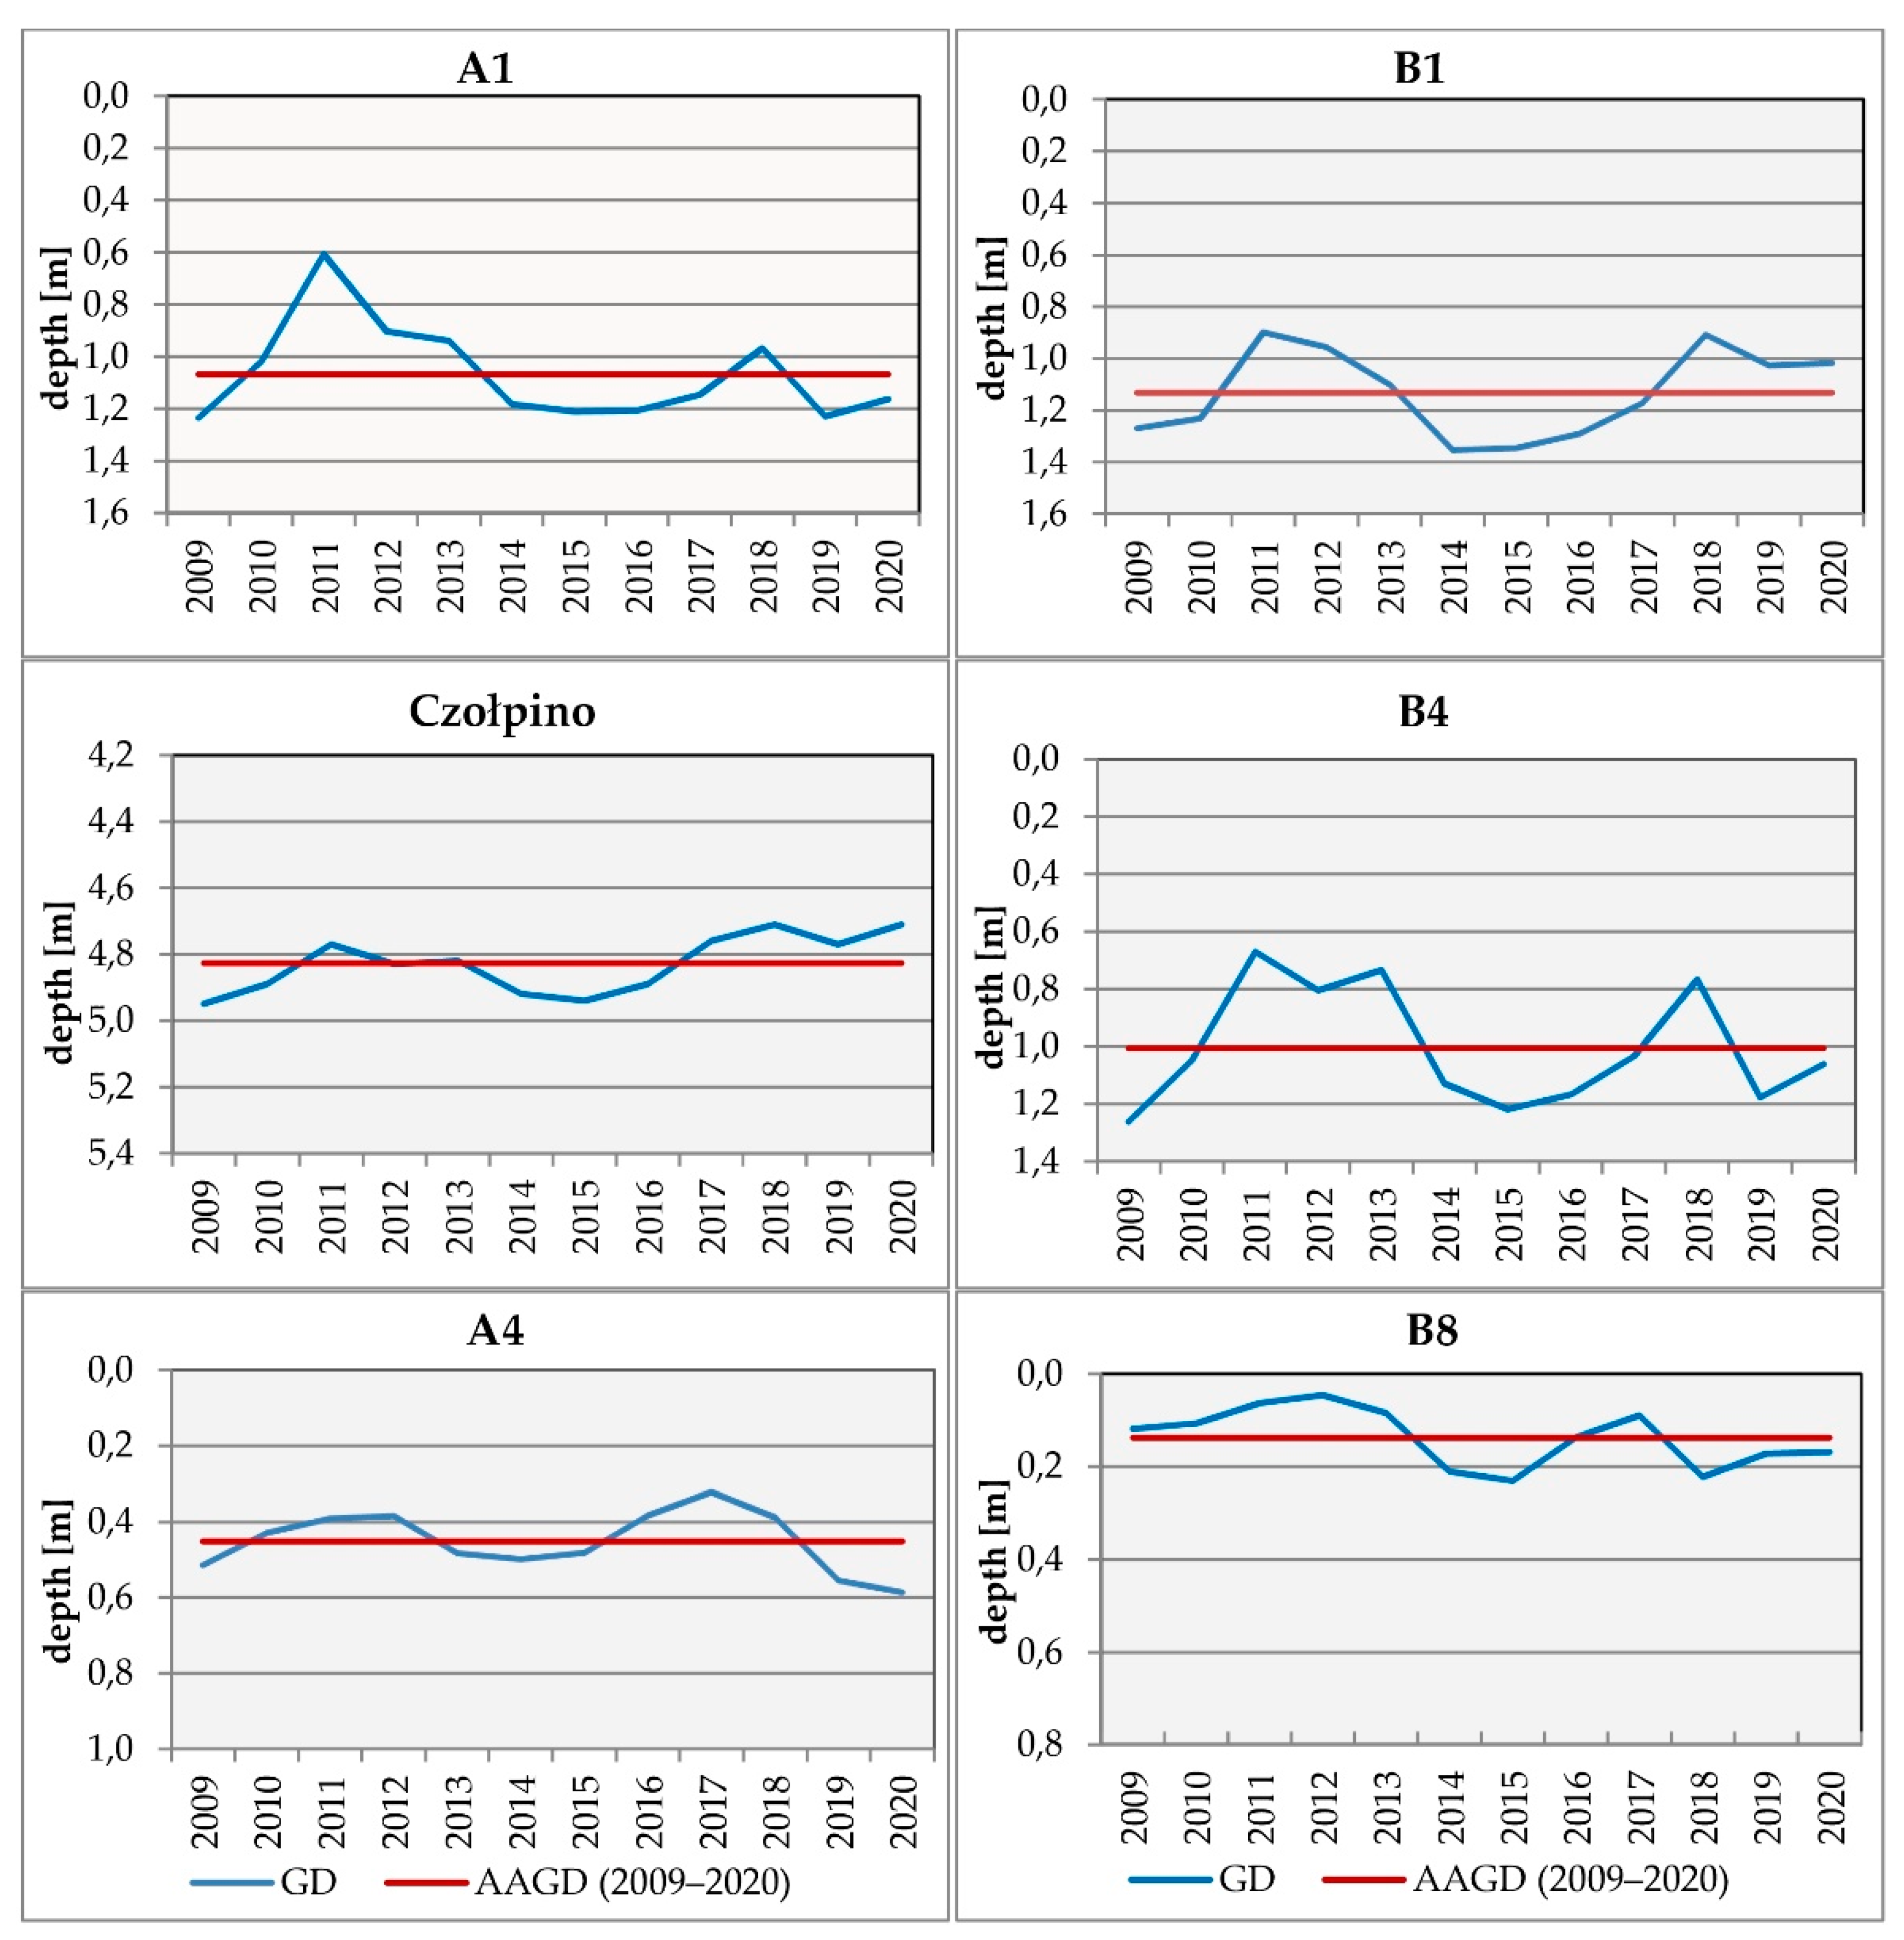
The analytical results of the groundwater level change on the Łeba Barrier show marked fluctuations over the 2009-2020 study period (
Figure 3). In the northern barrier zone, near to the sea shoreline, the average annual groundwater depth over the past 11 years was at the level of 1 m below the ground surface (bgs), whereas the average annual levels for each single year varied (bgs) from 0.61 m in 2011 to 1.35 m in 2015. The maximal and minimal groundwater levels recorded in the northern zone were then 0.06 m (2011) and 1.63 m (2015) respectively. Given the sufficient length of the observation period, it can be assumed that this range approximately indicates the maximal and minimal groundwater levels in this coastal environment (
Figure 3, Table 1).
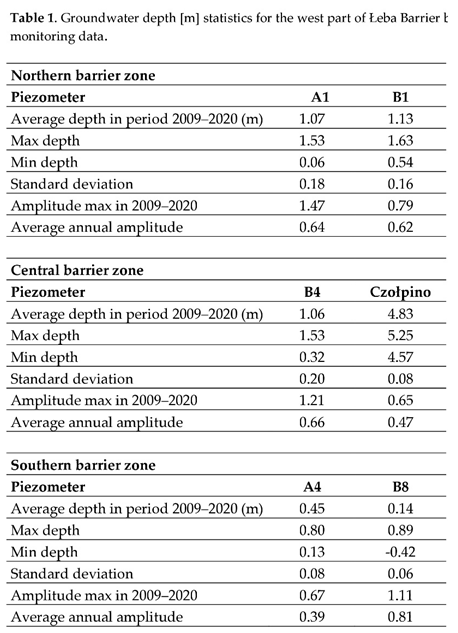
In the southern barrier zone near the Łebsko Lake and DołgieWielkie Lake, the average groundwater depth for the 2009–2020 study period was 0.14 m and 0.45 m, showing the overall lower average value than recorded in the northern barrier zone. The average annual levels (bgs) in the southern zone ranged between the intervals of 0.06 m (2011) and 0.59 m (2020). The minimal and maximal measurements were 0.42 m above ground surface (ags) (2011), and 0.89 m bgs (2018), respectively. The results show generally a lower absolute range of groundwater fluctuations than for the northern zone (
Figure 3, Table 1).
In the central barrier zone situated between the Łebsko and DołgieWielkie Lake, and the Baltic Sea, the average groundwater depth (bgs) for the 2009–2020 study period was 1.06 m. At the Czołpino site, the average depth was significantly lower (4.83 m). This deeper groundwater level may reflect a presence of a water drill site used for a former military unit, and the current water pumping mainly in the summer tourist season. The average annual levels (bgs) in the central barrier zone ranged between 0.67 m (2011) and 4.92 m (2015). The minimal and maximal depth limits observed during the study period in the central zone were 0.32 m (2011) and 5.25 m (2015). The monitoring data attest to a wider range of the local groundwater depths than in the northern and southern zones (
Figure 3, Table 1). At all sites (except B1 and Czołpino), the groundwater regime displays a slight downward trend. The coefficients of determination (R
2) for the analyses of each piezometer locations was rather low (0.04–0.38), indicating a low degree of fitting with the estimated model.
On the basis of the average assessed depth of groundwater within the study area, three hydrological zones can be determined: 1) the northern zone, located close to the sea, characterized by deeper groundwater with sea-drainage ; 2) the southern zone, adjacent to the lake, with the lowest groundwater tables; 3) the transitive zone with drainage in to both the sea and the lake. At all locations, the groundwater levels were highest in 2011, apart from the A4 site near DołgieWielkie Lake and the Czołpino site, where the groundwater level was repeatedly (2017, 2018, 2020) the highest. The lowest groundwater level was observed at most of the research sites in 2015.
3.2. Hydrometeorological Conditions
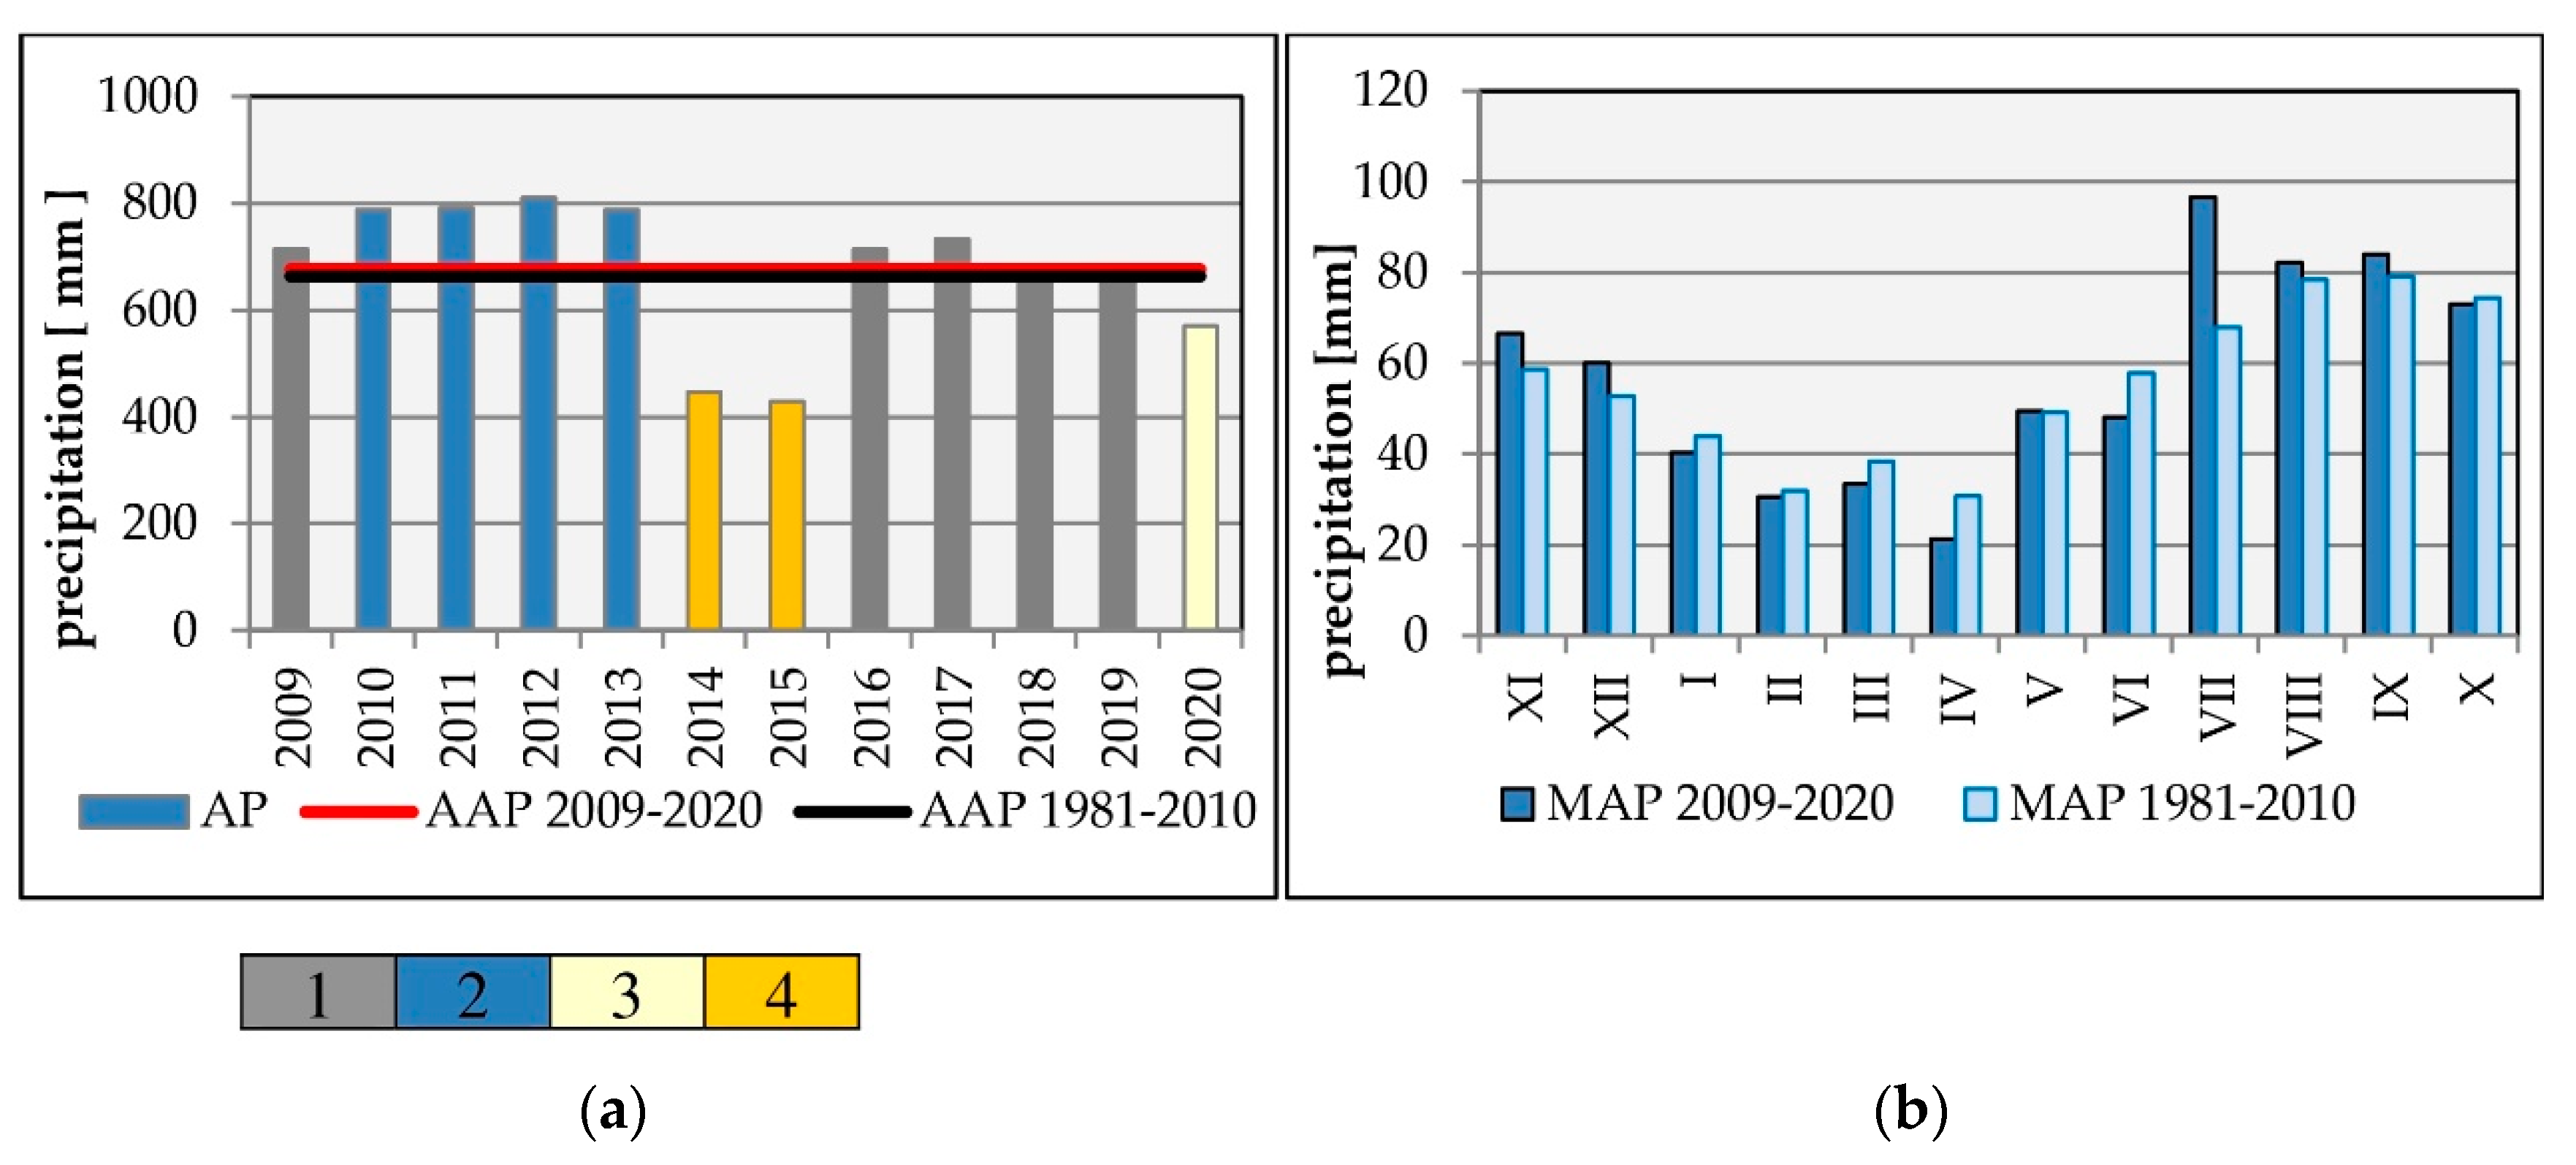
Annual average precipitation total during 2009–2020 was 676 mm. This is slightly more than the average annual rainfall over 1980–2010 (664 mm). For the study period, the annual precipitation (AP) within the Łeba Barrier ranged from 811 mm (2012) to 429 mm (2015) (
Figure 4A). Positive precipitation anomalies were found in eight years; negative anomalies in three years (2014, 2015, 2020). In the extreme years, the sums of precipitation were >130 mm above (2012) and >240 mm lower (2015) with respect to the average annual precipitation. Based on Z. Kaczorowska (1962) classification, which is one of the most used classifications in meteorological analyses applied in Poland, five years in the period 2009–2020 and 1981–2010 were rated as "normal", four years as "wet" (2010–2013), and two years (2014, 2015) as "very dry”. The lowest monthly precipitation average (21 mm) was in April (
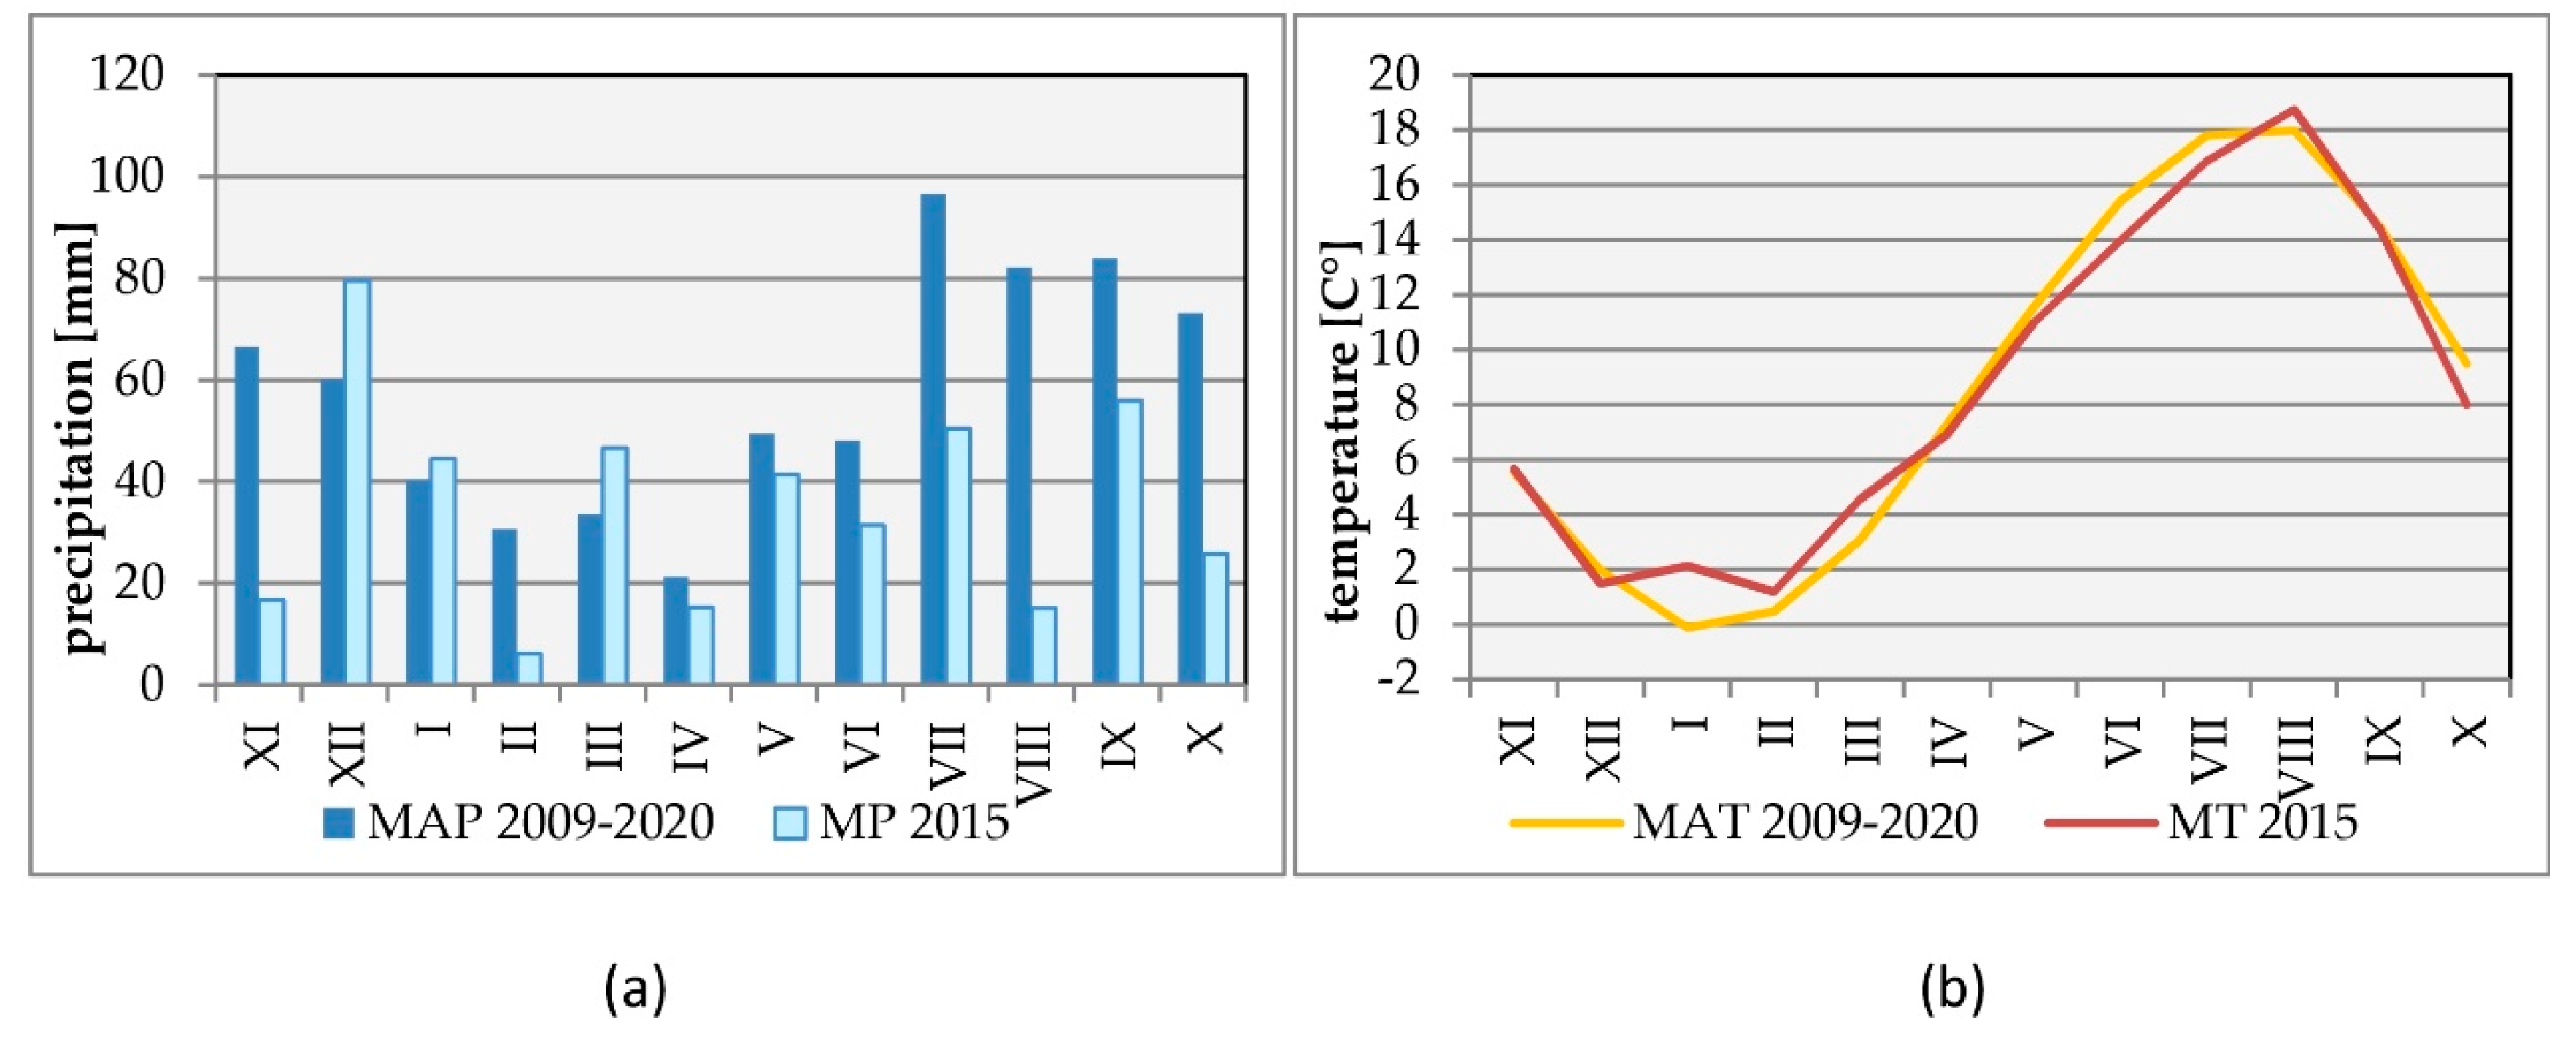
Figure 4B). Low precipitation values were also recorded in February (31 mm) and March (34 mm). In turn, the highest precipitation relate to the summer months—July (97 mm), September (84 mm) and August (82 mm). For the entire 2009–2020 period, the driest year was 2015, particularly because of a rather dry summer season with the exceptionally low precipitation values in July (51 mm), August (15 mm) and October (26 mm) (Figure 6A). According to the long-term (1951–2015) precipitation records at the Łeba Barrier (Chlost et al., 2018), no significant change in the annual precipitation totals was noticed. However, the annual values are differentiated in relation to the long-term averages.
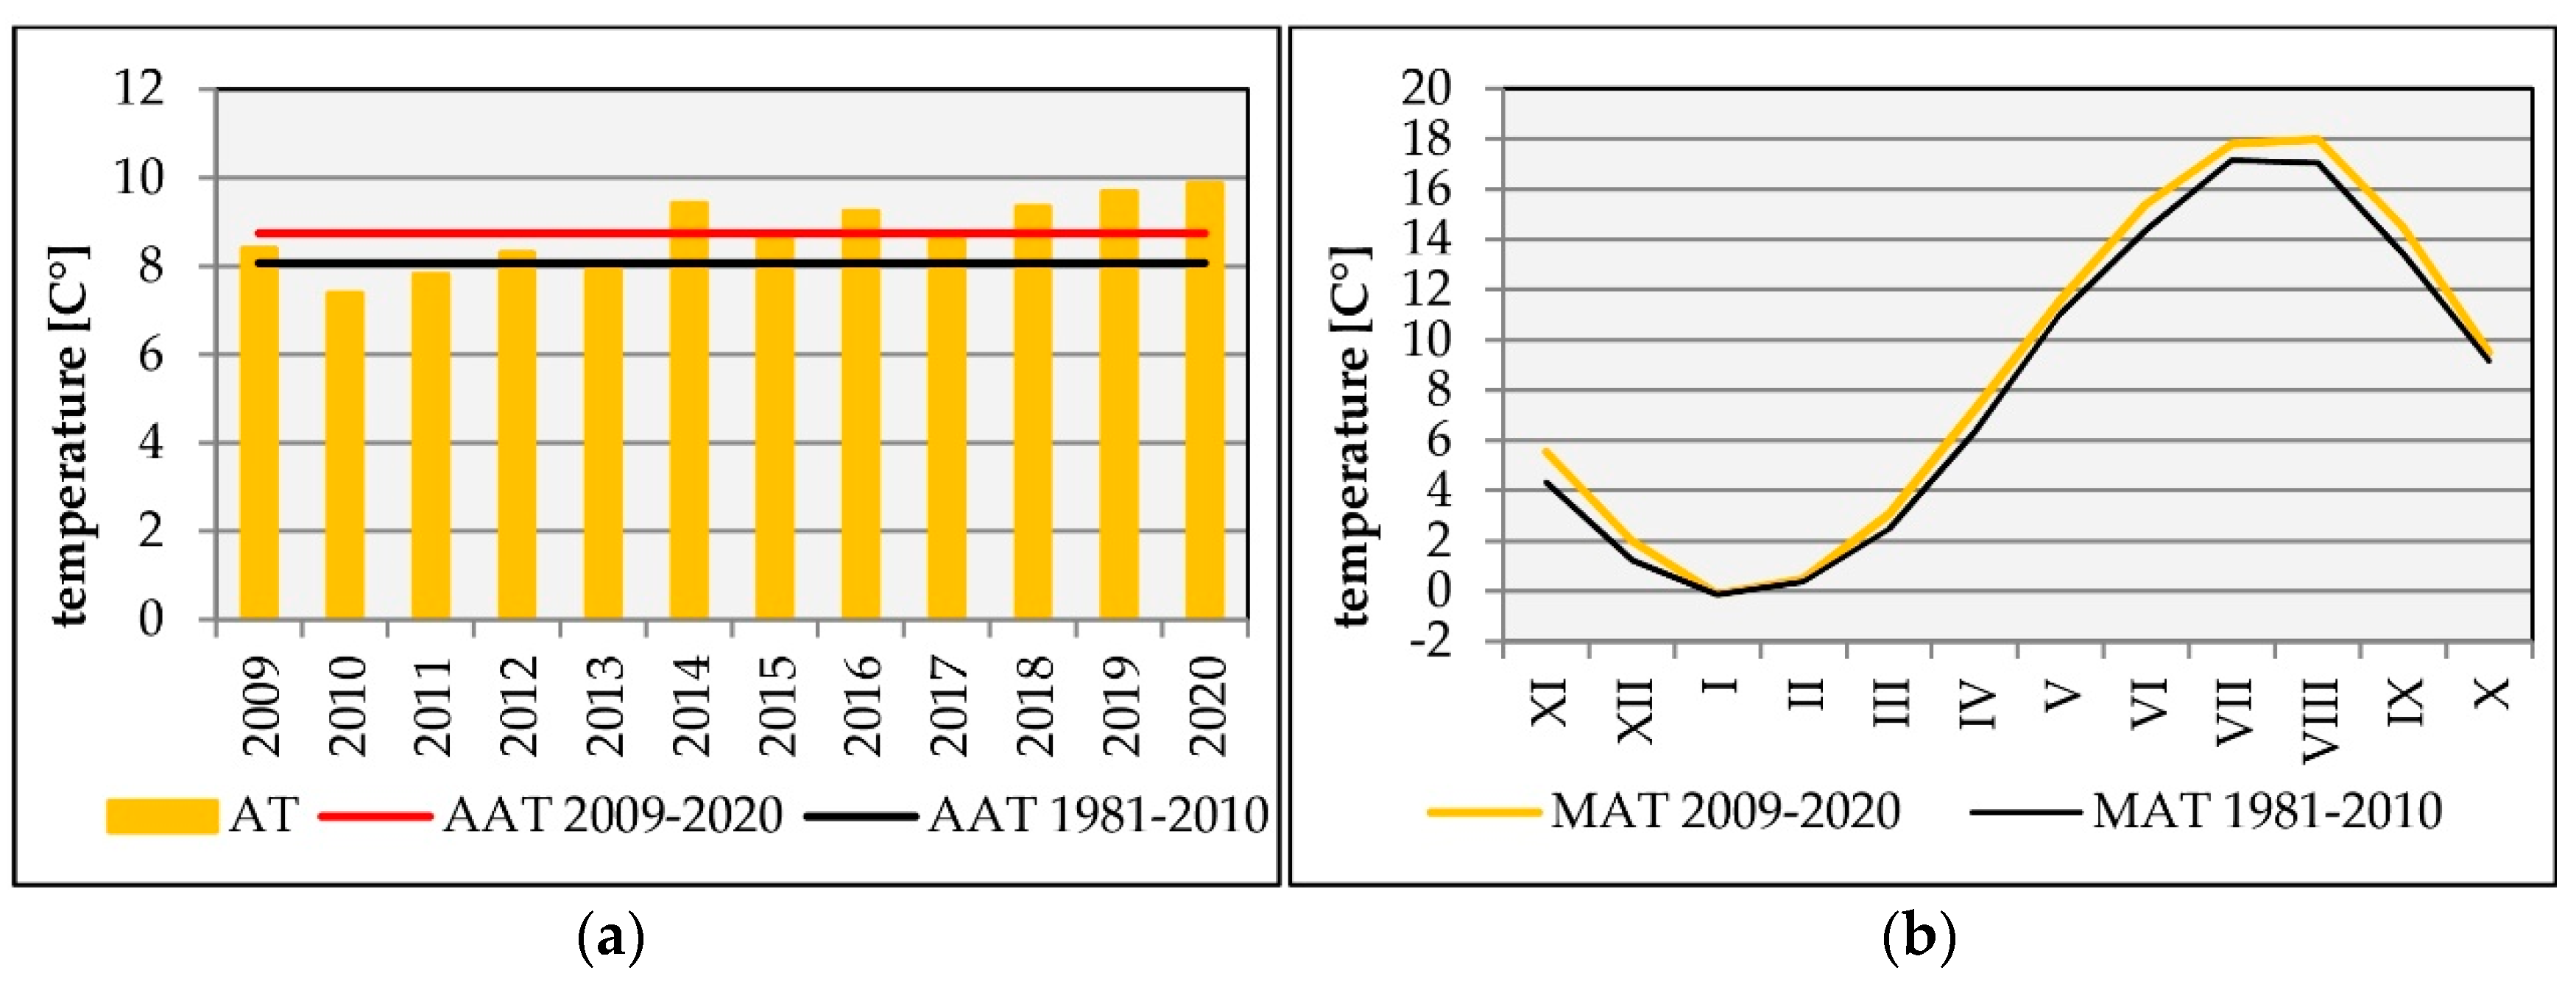
One of the most important climatic factors is air temperature, which affects the intensity of evaporation from the water surface, ground/soils and vegetation cover. The average annual air temperature (AAT) in Łeba has increased by 0.68°C from 8.07°C (1981–2010) to 8.75°C (2009–2020) (
Figure 5A). The records provide evidence of a progressing warming trend. The AT in the particular years, calculated from the mean t°C values in period 2009–2020, varied from 7.4°C (2010) to 9.88°C (2020). In terms of mean monthly air temperature values in Łeba (2009–2020), the coldest was January (–0.12°C), the warmest months then August (17.99°C) and July (17.8°C) (
Figure 5B). February was the coldest (1.19°C) and August the warmest (18.75°C) in 2015 (
Figure 6B). In 1951–2015 (Chlost et al., 2018), both the AAT and mean values of most extreme temperatures are characterized by a statistically significant increase. The annual sum of evaporation equaled 491 mm on average in the 1951-2015 period (op.cit.). The highest yearly value >570 mm defines the dry years 2002, 2006, 2007 and 2014. The highest monthly mean potential evaporation total relates to the summer months: June (88 mm), July (82 mm), and August (74 mm).
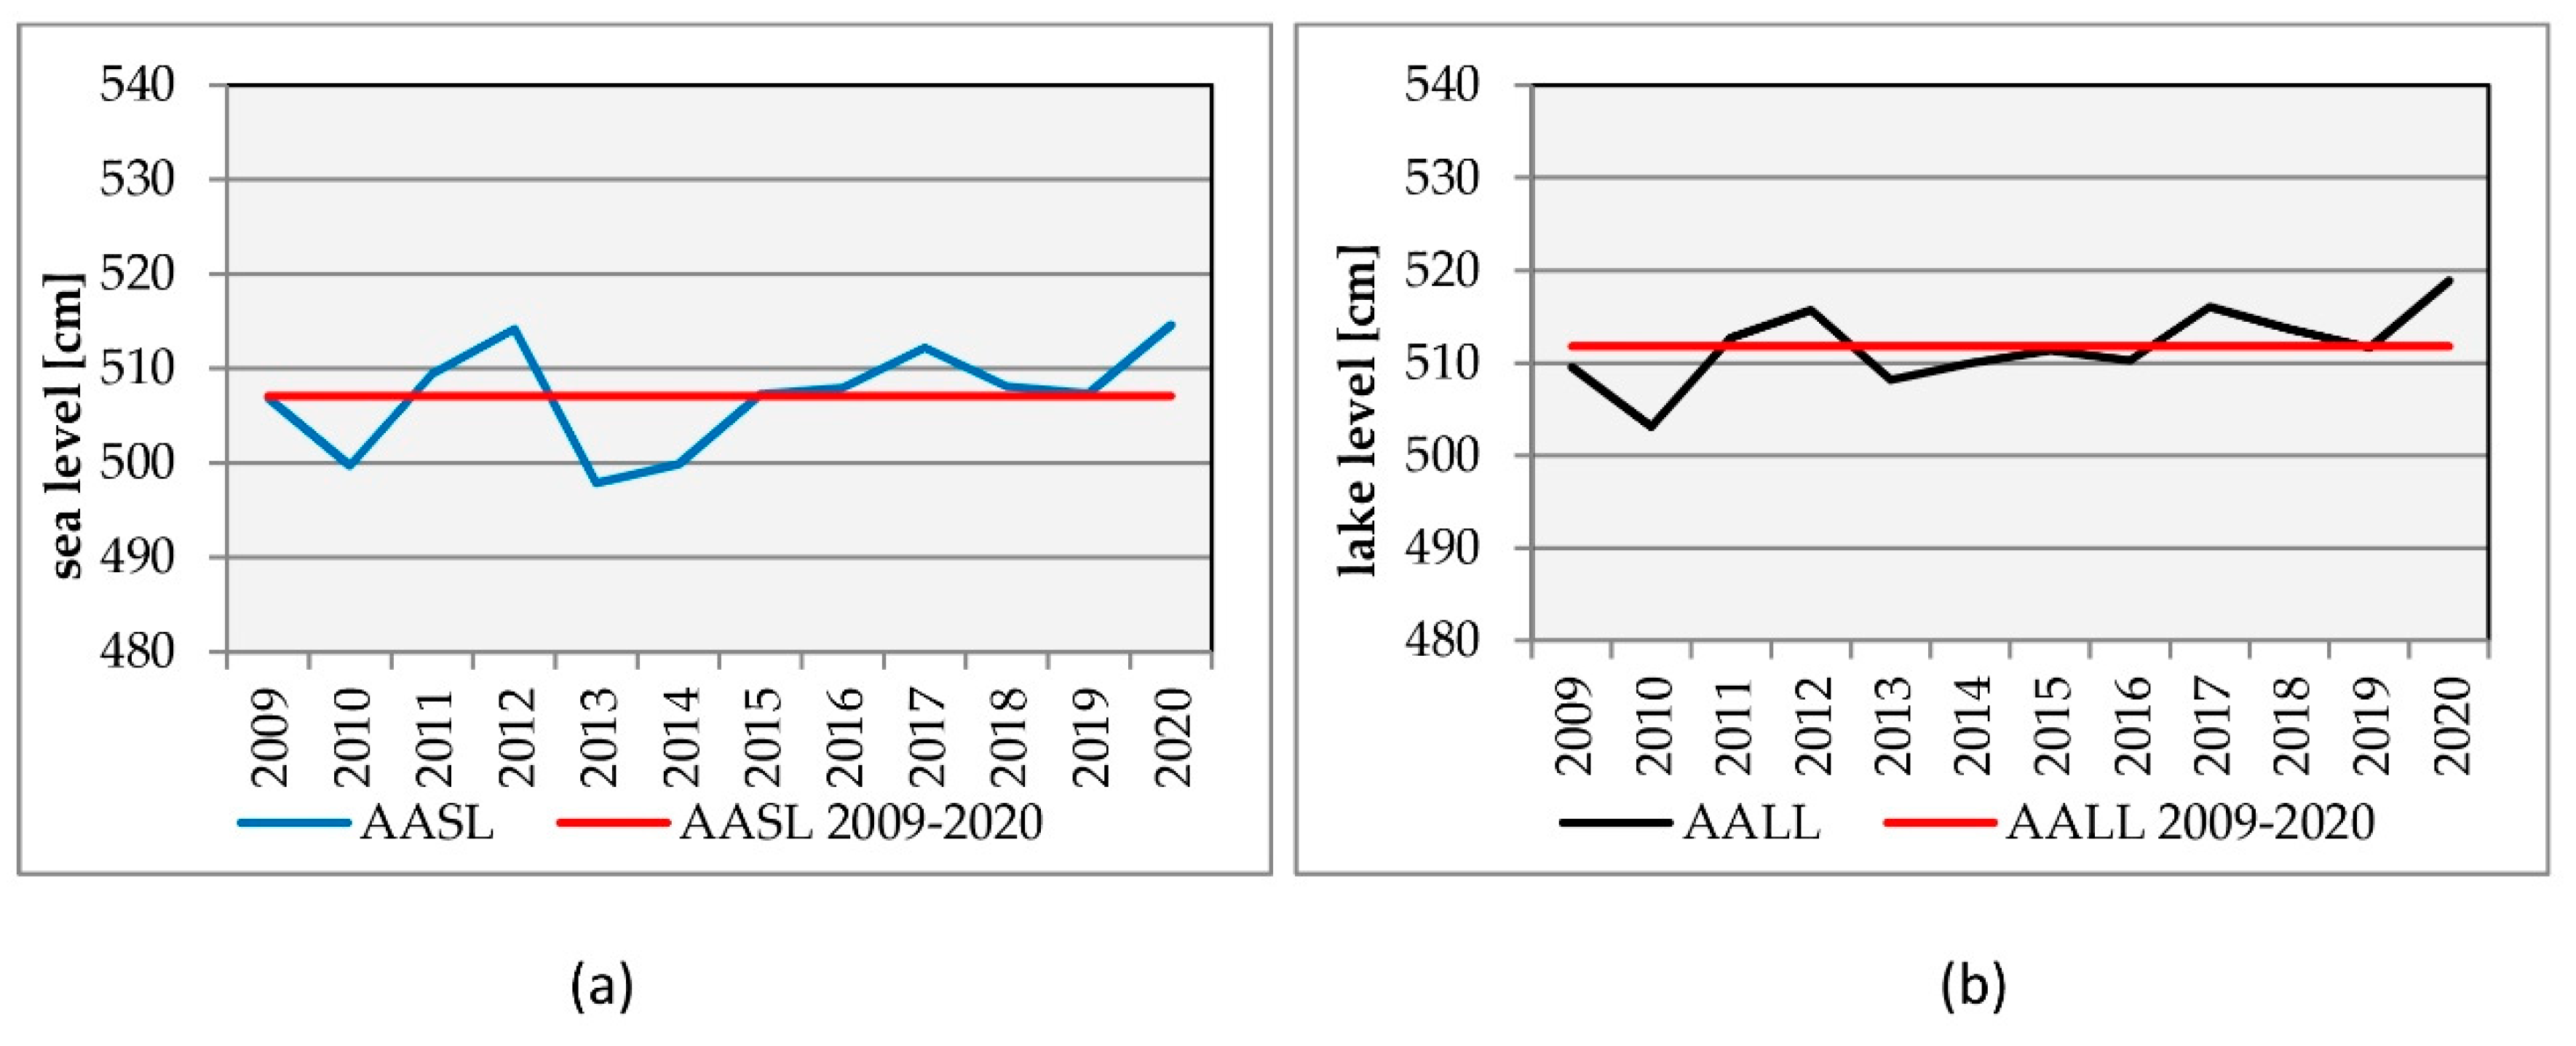
Conditions of groundwater occurrence in the coastal areas show specific features. Along the shoreline, there is contact of salt sea water with fresh groundwater that flows from the land. In normal states, these waters remain in a natural balance/equilibrium. When disturbed, the aggravated conditions lead to degradation of freshwater resources (Burzyński et al., 1999). The mean annual sea level in the period of 2009–2020 amounted 507.1 cm at Łeba, and 508.6 cm at Ustka located 50 km to west of Łeba (
Figure 1A). For the study period, the average annual level of the Baltic Sea at the Łeba Barrier ranged from 514.6 cm (2020) to 479.9 cm (2013) (
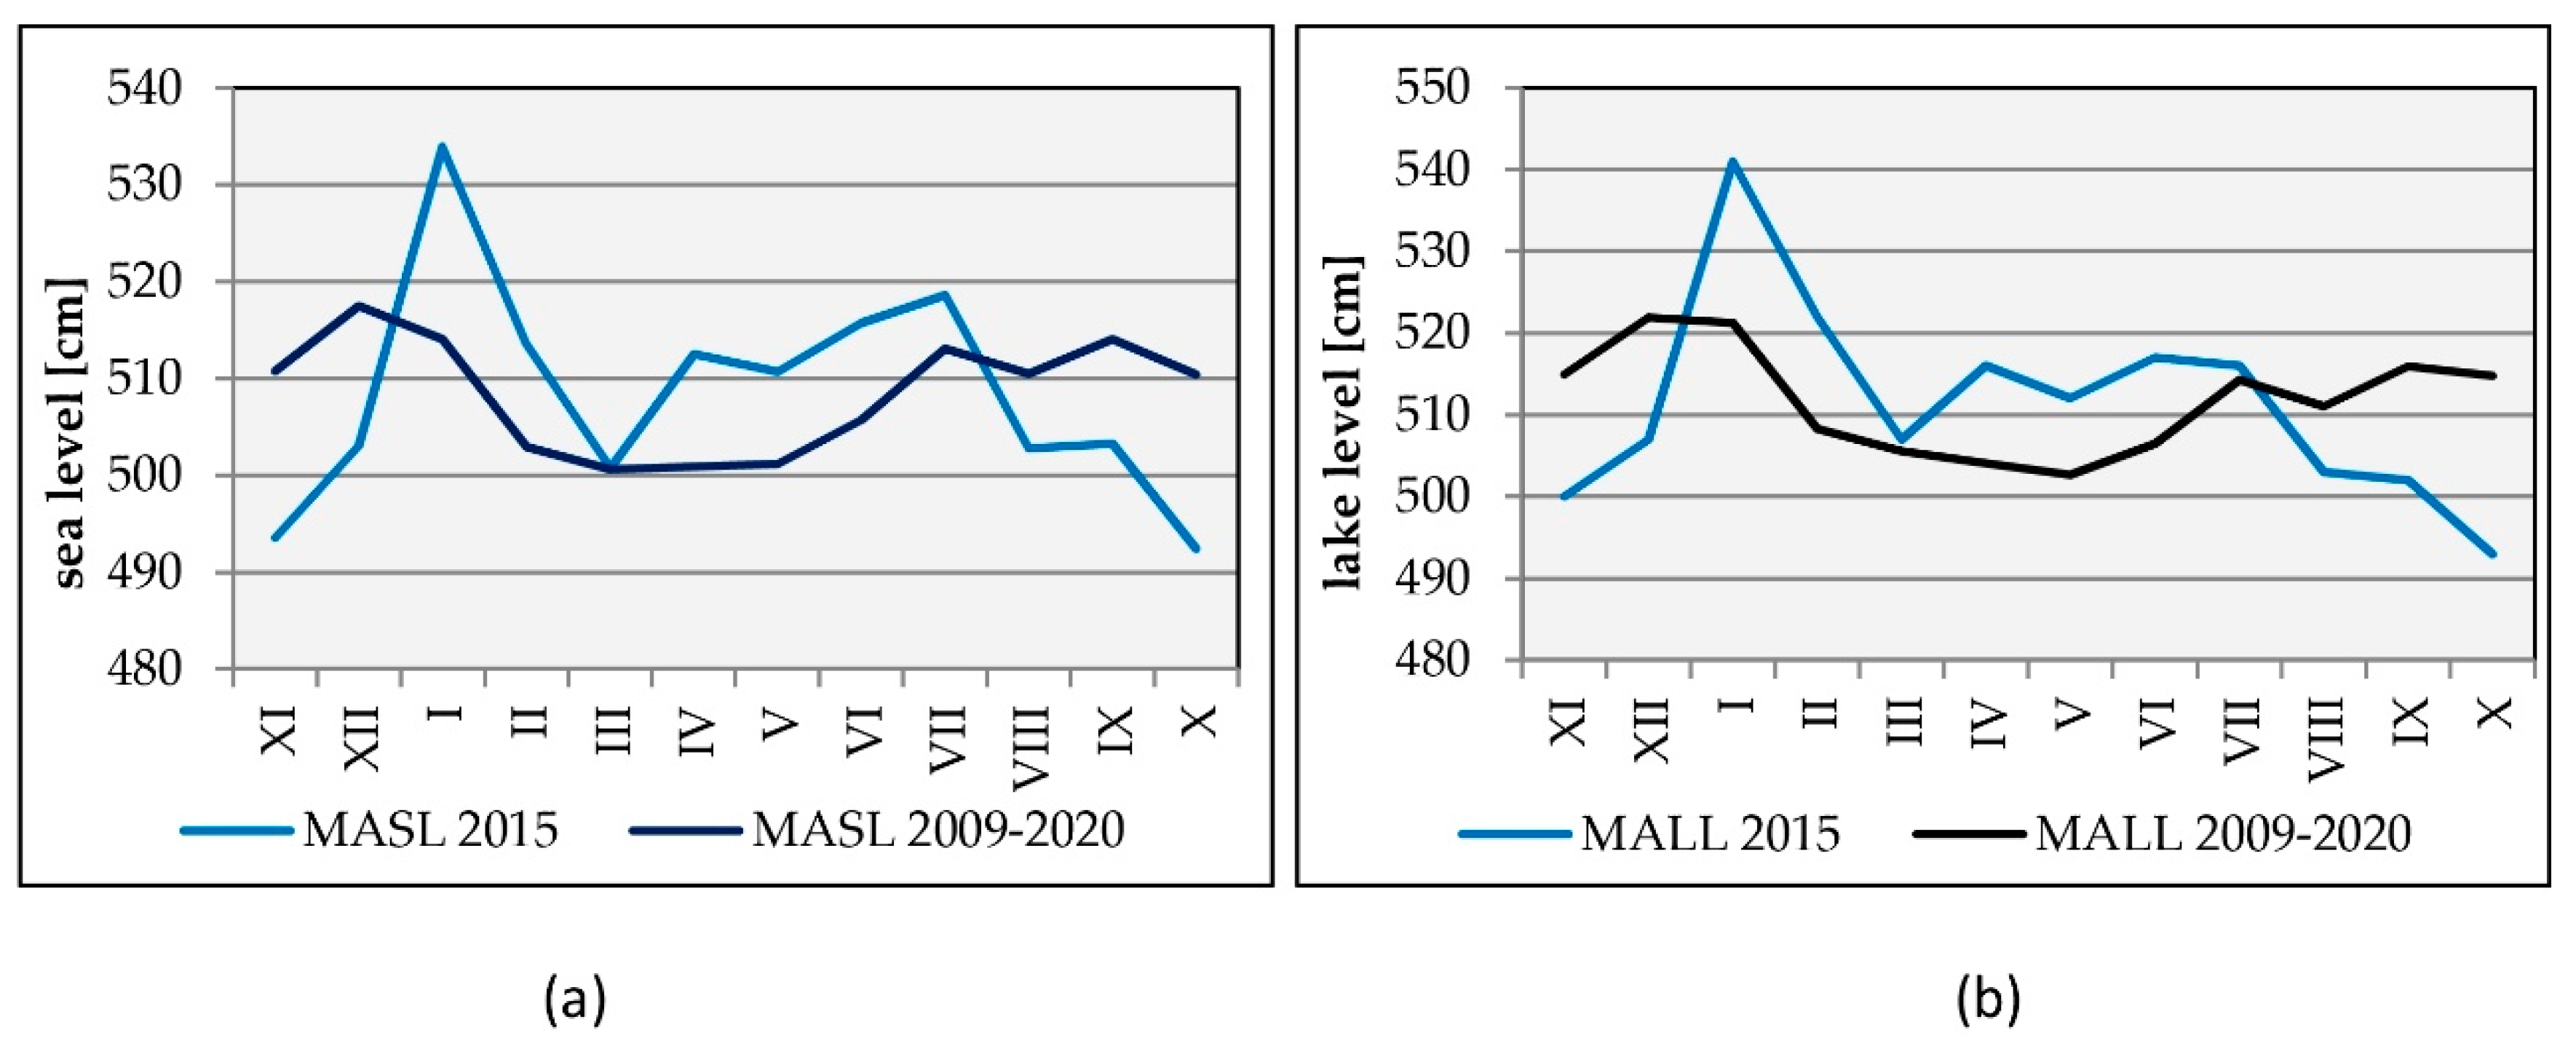
Figure 7A). The lowest monthly sea level average was in March (500.6 cm); the highest in December (517.49 cm) (
Figure 8A). The Polish Baltic coast records of the extreme sea-levels show that they occur in the autumn, winter and spring, from October to April (Rotnicki and Borzyszkowska 1999,Wolski and Wiśniewski, 2014). As the Baltic Sea is connected to Łebsko Lake, their water fluctuations correlate The mean annual Łebsko Lake level in 2009–2020 was slightly above the average annual sea level (511.76 cm) (
Figure 7B). The average annual Łebsko Lake level range varied from 503.08 cm (2010) to 518.92 cm (2020). The maximum level of the lake over the period was recorded in December (521.92 cm), such as the Baltic Sea level, and the minimum level of the lake water in May (502.67 cm) (
Figure 8B).
In the context of the long-term (2009–2020) monthly average of the Baltic Sea levels, the monthly variation of the sea level in 2015 was rather specific (
Figure 8A). The maximum sea-level was in January (533.93 cm), the minimum in October (492.40 cm) and November (493.56 cm). This anomaly was likely generated by storm surges (H ≥ 570 cm) acting along the Łeba Barrier coast in January and February 2015, which caused the observed sea-level increase.
3.3. Groundwater drought
The term groundwater drought or hydrogeological drought refers to a period of decreased groundwater levels with respect to normal. When groundwater systems are affected by droughts,groundwater levels and the groundwater discharge decrease. These situations generally occur on a time scale of months to years (van Lanen and Peters, 2000; Mishra, 2010). Groundwater drought can be identified using three elements: recharge, groundwater levels, and discharge from groundwater to the surface water system (Tate and Gustard, 2000; Van Lanen and Peters, 2000). Of these three, an estimation of groundwater drought based on the water table position analysis is an efficient method.
A hydro-geological drought (Kazimierski et al., 2009) can be determined from characteristic groundwater depths (GD) in the following way:
GD ≥ HLG - no drought hazard;
HLG > GD > ALG - drought hazard;
ALG ≥ GD > 0.5 (ALG + LLG) - occurrence of shallow hydro-geological drought;
GD ≤ 0.5 (ALG + LLG) - occurrence of deep hydro-geological drought,
(GD - groundwater depth; HLG - the highest low groundwater depth of each year;
ALG - average of the lowest groundwater depth of each year; and LLG - the lowest lowgroundwater depth of each year).
The occurrence of a shallow hydro-geological drought is related to the position of the groundwater level below the average of the lowest groundwater depth of each year (ALG). This is one of the method used applied in Poland in drought hydrogeological analyses (Krogulec 2018).
In the study area, the lowest groundwater levels were observed in almost all piezometers of the monitoring sites in 2015, whereas the highest levels were observed in 2011 (
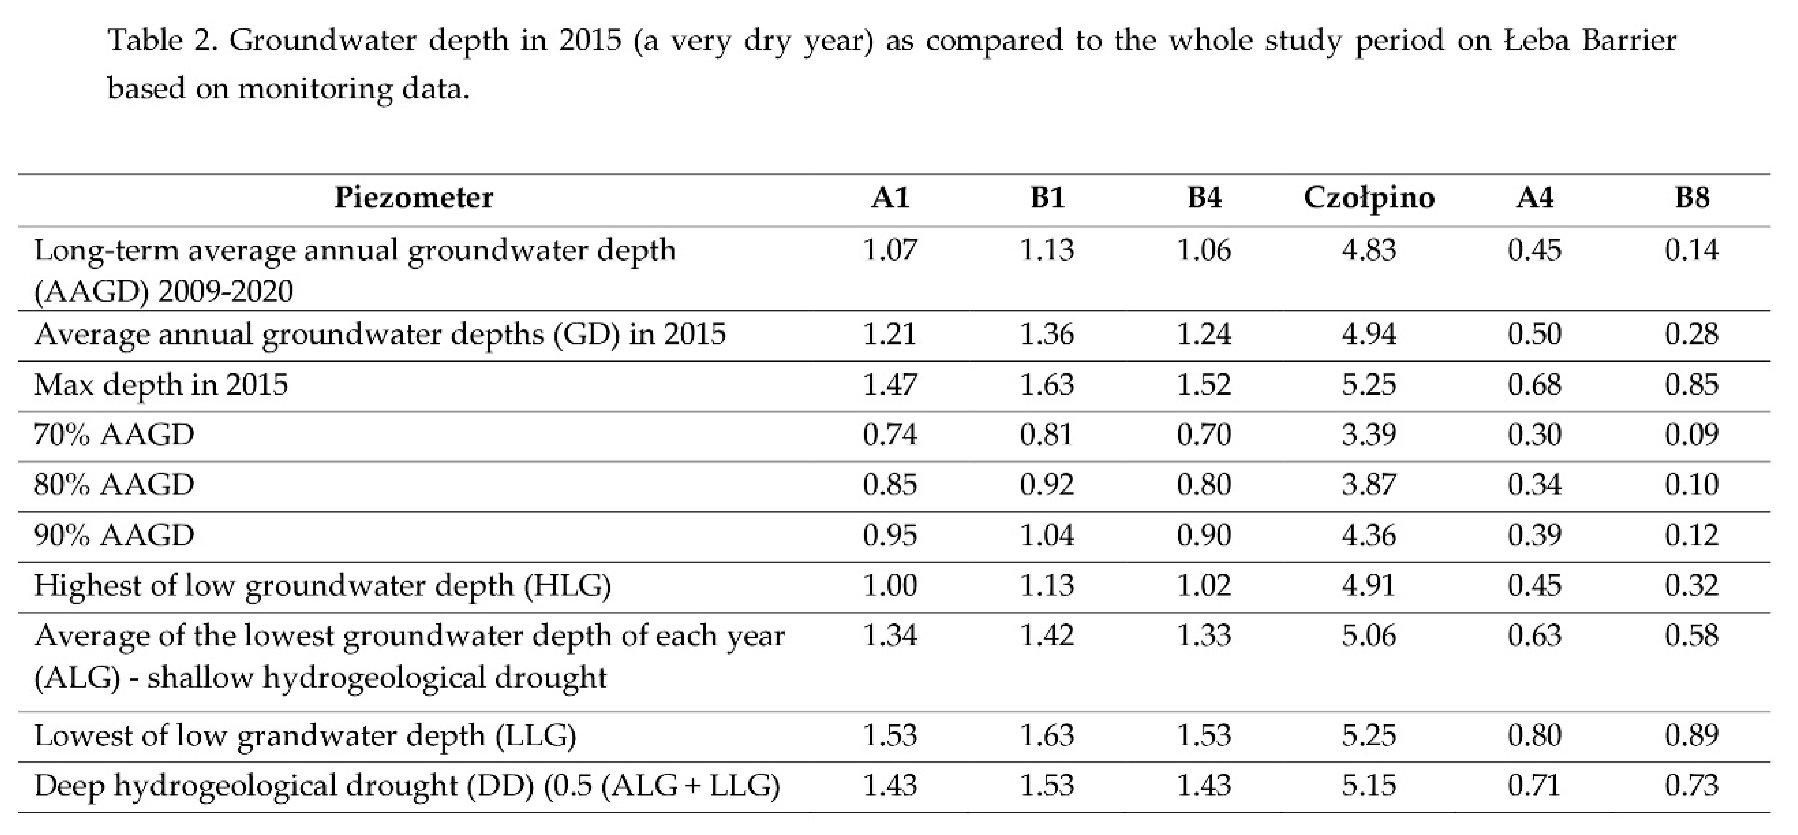
Figure 3). The ALG value and the state of deep hydro-geological drought determined as GD ≤ 0.5 (ALG + LLG) refers to the levels lower than the average groundwater level depth recorded in 2015 (Table 2), which is considered the driest year in the monitored period 2009–2020. The average value of groundwater levels is close to HLG, which informs about an establishing hazard drought.
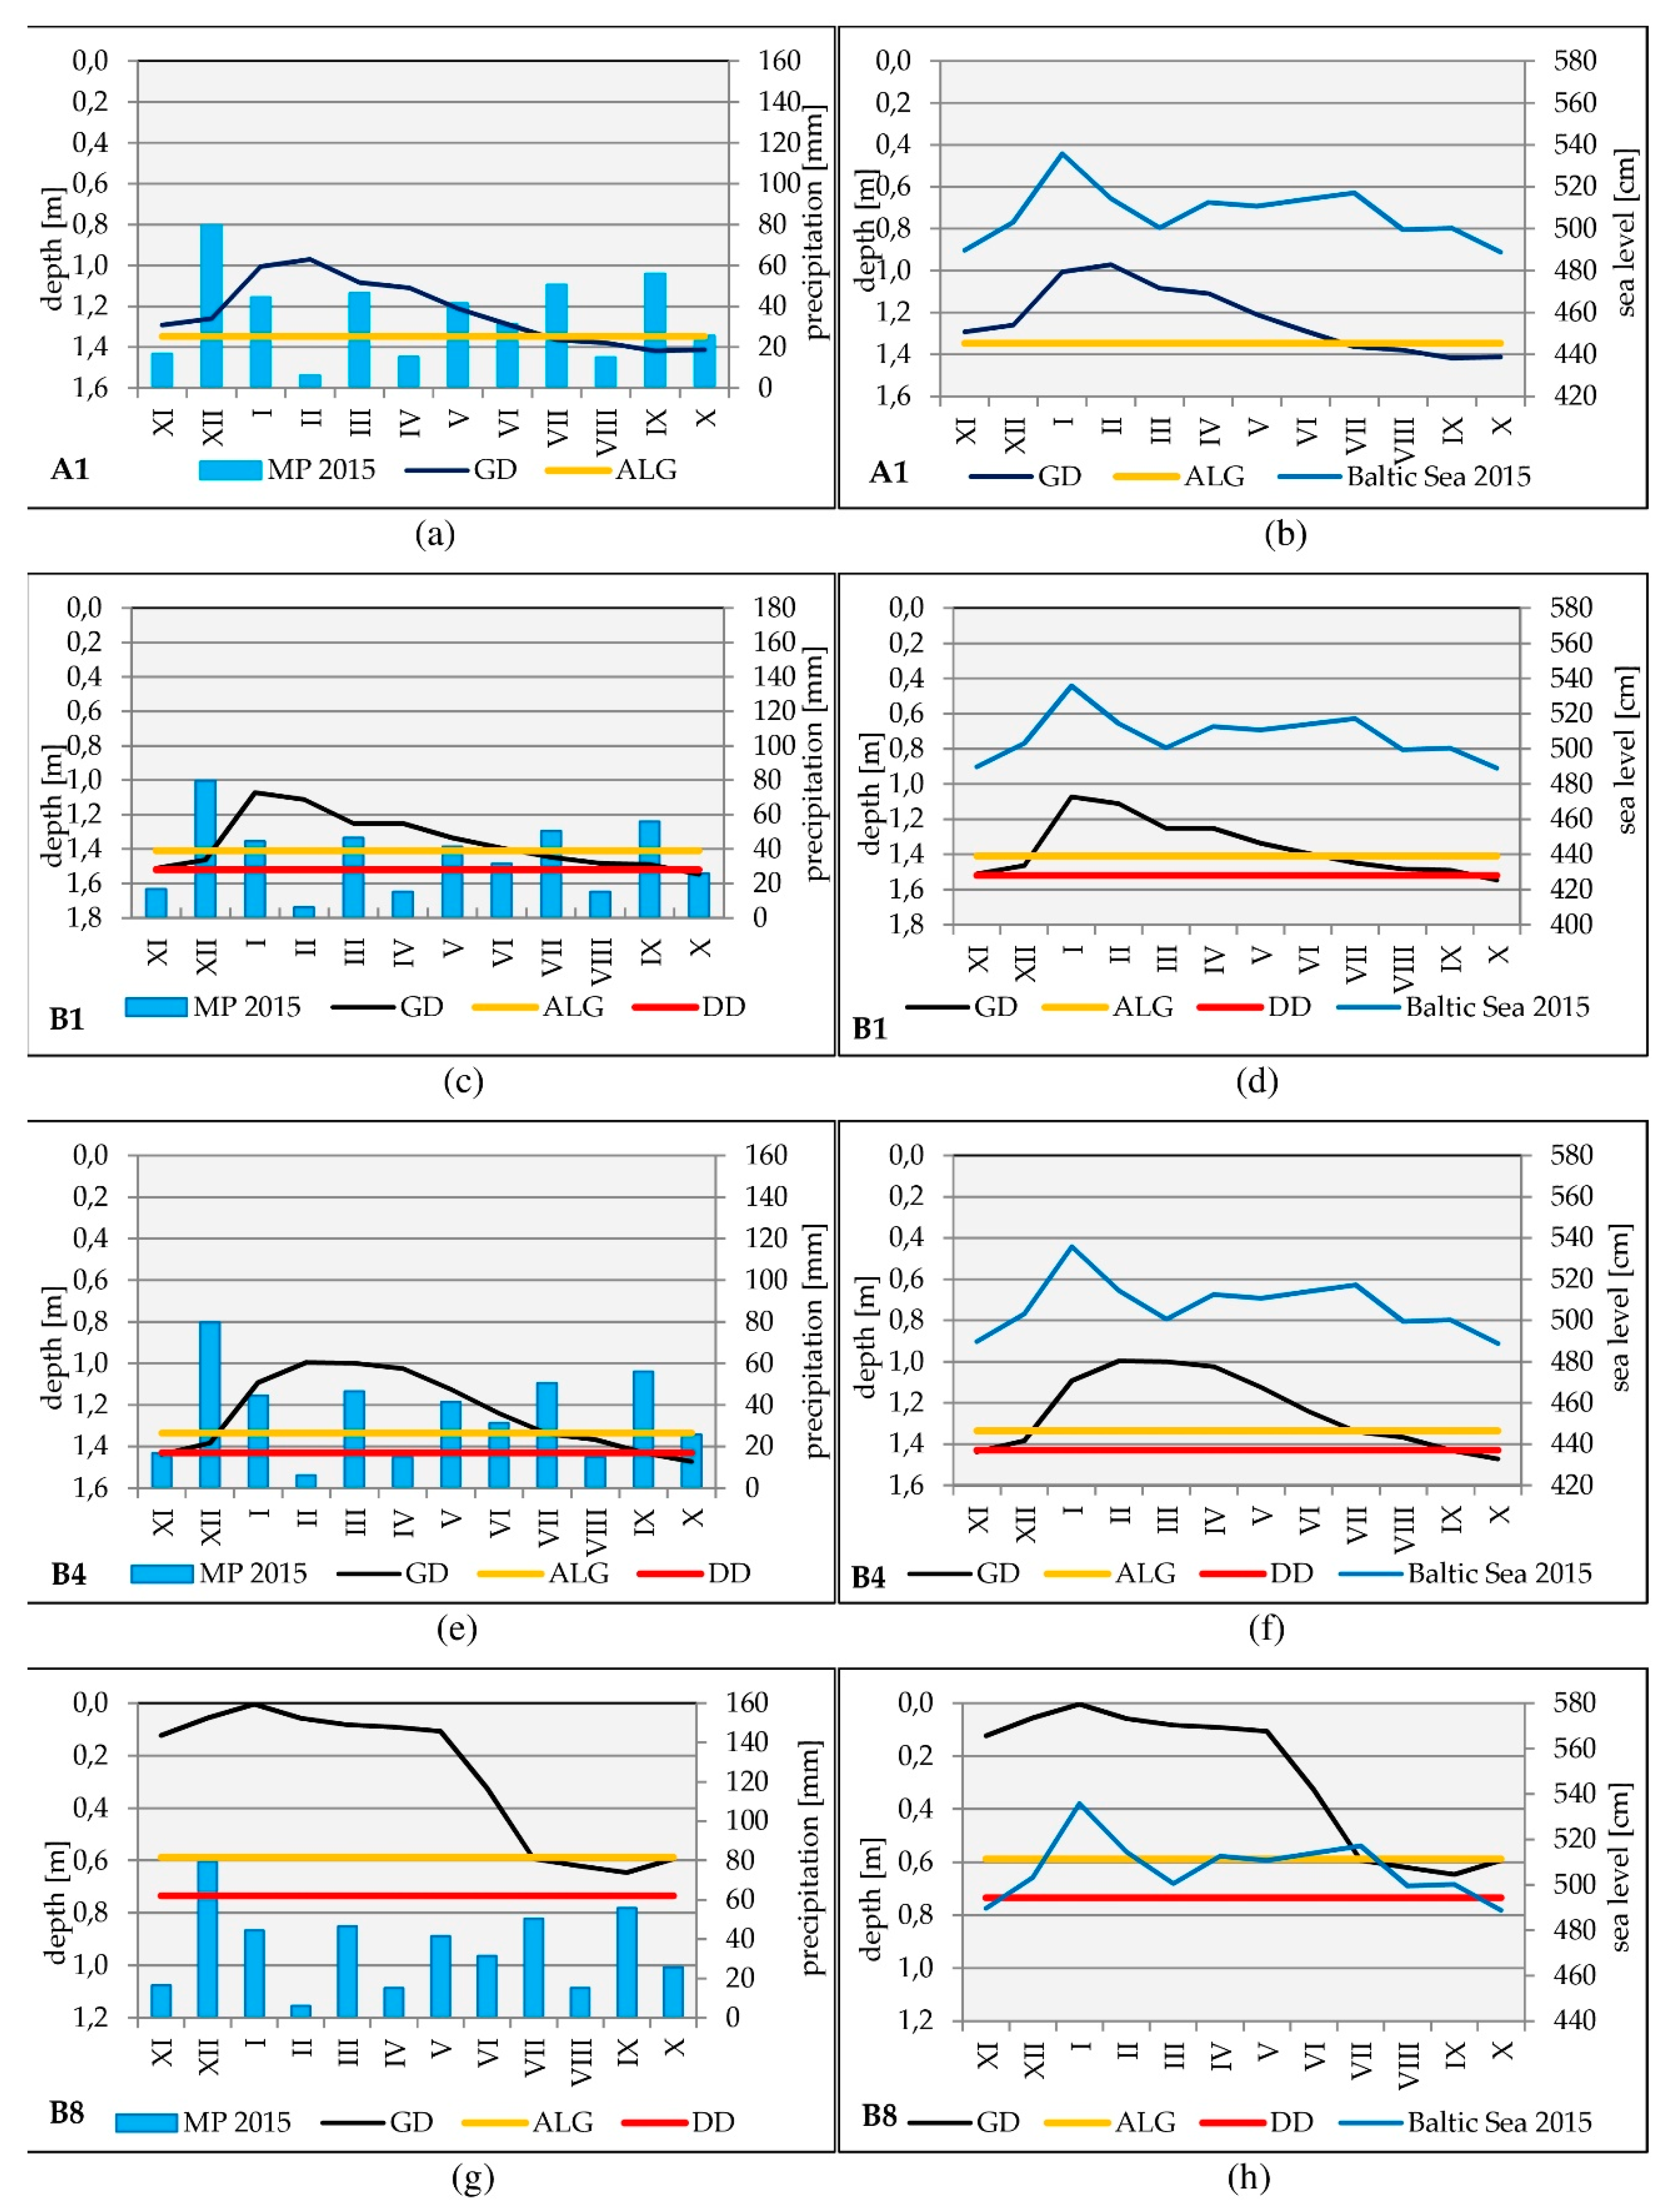
The groundwater levels below ALG may practically be treated as periods of a possible hydro-geological drought. During 2009–2020, shallow and deep ground water droughts were identified at most of the sites in 2015 (
Figure 9). In all six locations, shallow groundwater droughts began in July and continued into October. In October, at three sites (B1, B4 and Czołpino), the lowering groundwater level reached the state of a deep drought. At two sites (B1, B4), hydro-geological drought appeared already in November and lasted until December. In the case of site B1, located closest to the sea coastline, it was a deep groundwater drought.
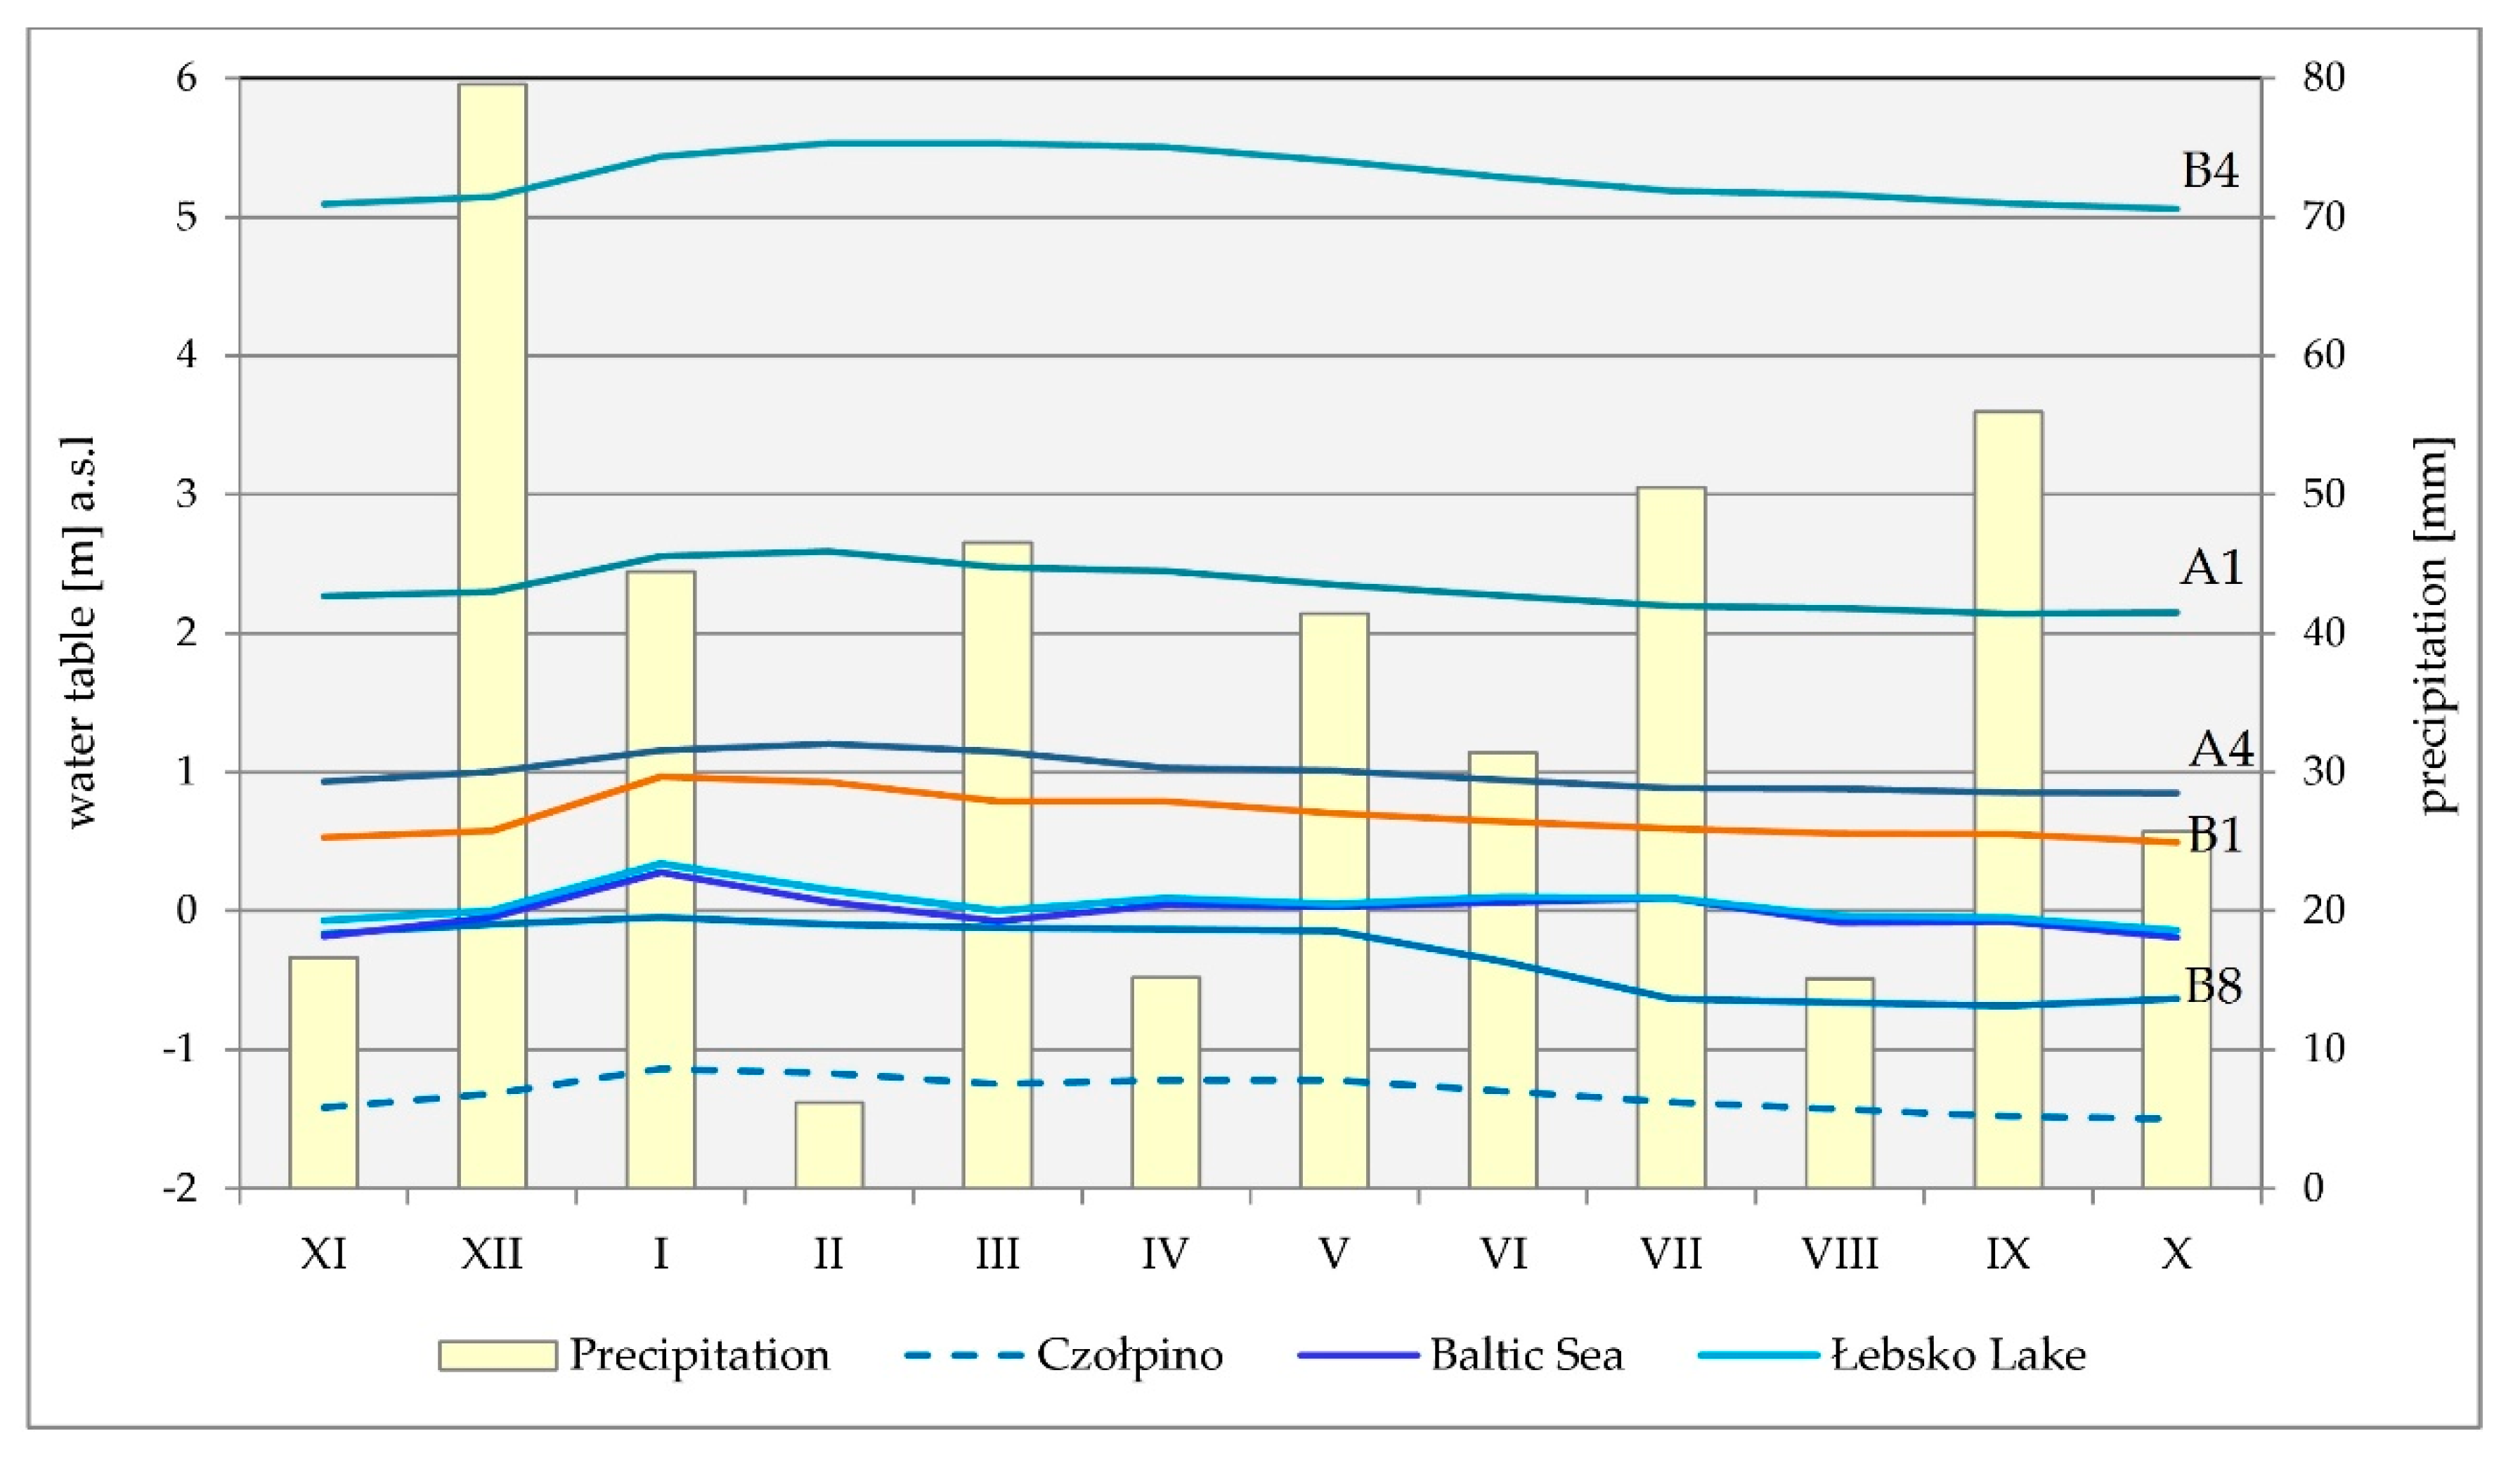
The Baltic Sea is a regional drainage base for groundwater of the Łeba Barrier, referring to the position of the groundwater level and the Baltic Sea in relation to absolute altitude (
Figure 10). Only groundwaters at the sites located at the Łebsko Lake and Czołpino are below the Baltic Sea level. The course of groundwater fluctuations in the case of the site B8 indicates that they were supplied by the surface waters of Łebsko Lake throughout almost the entire year of 2015. The lowered groundwater table in relation to the sea level at the Czołpino site indicates a groundwater depression, which was probably formed by pumping water from a nearby well.
4. Discussion
Long-term (2009–2020) average values of the regional groundwater levels have been used to assess the hazards and the occurrence of hydro-geological drought in the coastal zone of the Łeba Barrier. The conducted analyses of the present hydro-geological situation in the central part of the Polish coast indicate a transition from the high groundwater levels recorded in 2011 to the lower levels (referred to the 2015 drought datum). The main source of groundwater supply is precipitation, which variedduring the investigated period. The very low precipitation values, with minima in 2015, reflected the meteorological situation that occurred at that time throughout Europe. The summer of 2015 was not only dry but also very hot across Europe (Ionita et al., 2017). On the Łeba Barrier, weather was very warm especially in August, when the temperature was 1.7 C higher than a long-term (1981–2010) average. High evapotranspiration rates combined with a lack of precipitation led to record low river flows in several major rivers in Europe. The 2015 drought developed rapidly over the Iberian Peninsula, France, southern Benelux, and central Germany in May, and reached a peak intensity and a spatial extent by August especially in the eastern part of Europe (Ionita et al., 2017; Laaha et al ,m 2017), including Poland (Kubiak-Wójcicka and Bąk, 2020; Chlost et al, 2018; Kowalczyk, 2016; Smorawska, 2016). In August, large areas of hydro-geological drought appeared in Poland, which appeared in September (PSH Report 2015).
Due to the lack of a hydrogeology-monitoring network on the Polish coast without long series of measurements, the regionally indicative drought periods and/or annual (seasonal) episodes were not recorded. The here presented measurements from the Łeba Barrier from the central , middle part of the Polish Baltic coast are the only ones, which provide a consistent and comprehensive picture on the coastal drought fluctuations, with the identified groundwater minima (and maxima). In the course of the present climate change, a systematic and spatially allocated monitoring of groundwater is of utmost relevance. Often, drought is spatially seen as a period of severely reduced precipitations, which results, among other precaution measures, in restrictions of water accessibility (Whilhite et al., 1985, 2000; Peters, 2003; Peters and van Lanen, 2003; Tallaksen and Van Lanen, 2004; Mishra and Singh, 2010).
Studies on effects of meteorological conditions on groundwater droughts have also been conducted in other regions of the country (e.g., Tarka and Staśko, 2010; Gurwin, 2014; Kowalczyk et al., 2015; 2016, Krogulec, 2018; Kubiak-Wójcicka, 2022). Depending on local hydro-geological conditions, the duration of low water can be either longer or shorter in deeper aquifers. The Łeba Barrier coast research concluded that for deeper water levels, droughts were more delayed and more severe. These droughts were further strengthened at places where an unsaturated zone was thinner and the response to meteorological influences was faster.
This study shows that droughts with respect to precipitation are delayed by about 1 month. Analyzes of the relationship between the particular monthly precipitation values and the monthly groundwater levels on the Łeba Barrier during the 2009–2020 period (examined using the Pearson correlation coefficient) provide evidence that mainly the impact of precipitation was statistically significant only for August. This impact applies to all sites except for Czołpino, where underground waters are the deepest and react at a slower rate. The values of the correlation coefficient range from 0.67 to 0.82. A high correlation coefficient between precipitation and groundwater in April and June occurs at the sites (A4, B8) located near the lakes. At other places (B8), the precipitation inflows last longer (January, February, May, July and October). In addition, a significant coefficient of correlation between rainfall and groundwater (January) is at B1 located in the zone of fore-dunes.
In addition to precipitation, the analyzed relationship between the monthly mean sea levels and the monthly mean groundwater levels shows that in four locations (B1, B4, B8, A4) statistically significant correlations occur in August. The changes in the Baltic Sea level in January, September and October affect the coastal groundwater monitored sites (B1, B8) located near to shoreline and the Łebsko Lake. Changes in the sea level also affect the coastal groundwaters in February and June (B8). On the other hand, groundwater at Czołpino correlates well with the Baltic Sea level in April-May, July, September and October.
Human activity is, along with atmospheric variations, the main factor generating changes in the local groundwater levels (Dua et al., 2020; Taylor et al. 2012; Zhou et al., 2010). But groundwater resources along the coast can be threatened not only due to climatic conditions leading to aridification. They are negatively affected by the sea-level rise, especially in the coastal areas along the southern Baltic coast, where a future sea level rise is expected. The obtained results show that the low sea levels strengthen the effects of low precipitation and high temperatures, causing altogether the occurrence of hydro-geological drought in the coastal sandbar areas.
5. Conclusion
Long-term investigations of the hydro-geological systems on the northernmost tip of the southern Baltic coast revealed, for the first time, clear dependences of climate change, sea-level fluctuations and periods of droughts. The 12-year systematic monitoring of the inland groundwater fluctuations performed at a series of sites on the Łeba Barrier provided evidence of shallow groundwater variations and their relationship with the meteorological condition, and the sea-level dynamics.
The long-term average annual rainfall in the central part of the Polish coast has increased over the past four decades. During the analyzed period 2009–2020, extreme thermal atmospheric events occurred. This particularly relates to the very dry summers (2014, 2015) with a hot August 2015 corresponding to the exceptionally low sea level stand, which continued until December. The relationships between the groundwater level and changes in the sea level and rainfall on the sandbar were confirmed by the statistically significant correlation coefficients of August. Climatic conditions and the low groundwater of that particular year resulted in the decrease groundwater levels throughout the spit. The documented fluxes between sea-water and the coastal lacustrine basins (Łebsko Lake and Dołgie Wielkie Lake) are facilitated by the permeability of the sand deposits and the underlying glacio-fluvial deposits forming the surficial geology of the area. Low sea level affects the accelerated flow of groundwater from the land to the sea. This process is of particular importance during dry and hot periods, as it can lead to lowering of groundwater and the occurrence of hydrogeological drought. Long-term natural stresses related to drought have an influence on the local ecosystems including forests with shallow root systems. The investigations continue.
Funding
The APC was funded by the Polish Ministry of Science.
Acknowledgments
Hydro-meteorological and sea level data were obtained from the Institute of Meteorology and Water Management, National Research Institute in Warsaw.
Conflicts of Interest
The author declare no conflict of interest.
References
- Backman, B.; Luoma, S.; Schmidt-Thomé, P.; Laitinen, J. Potential risks for shallow groundwater aquifers in coastal areas of the Baltic Sea, a case study in Hanko area in south Finland. CIVPRO Working Paper 2007: 2. Espoo: GeologicalSurvey of Finland. G: Espoo.
- Batalha, M.S.; Barbosa, M.C.; Faybishenko, B.; van Genuchten, M.T. Effect of temporal averaging of meteorological data on predictions of groundwater recharge. J. Hydrol. Hydromech 2018, 66, 143–152. [Google Scholar] [CrossRef]
- Burzyński, K.; Kozerski, B.; Sadurski, A. Procesy ingresji i ascenzji wód na polskim wybrzeżu bałtyckim. (Ingression and ascensionprocesses of salt watersalong the PolishBalticcoast). Biul. Państw. Instyt. Geologicznego1999, 388, 35–48.
- Cammalleri, C.; Barbosa, P.; Vogt, J.V. Evaluating simulated daily discharge for operational hydrological drought monitoring in the Global Drought Observatory (GDO). Hydrol. Sciences Journal 2020, 65, 1316–1325. [Google Scholar] [CrossRef]
- Chamanpira, G.; Zehtabian, H.; Ahmadi, H.; Malekian, A. Effect of drought on groundwater resources; a study to optimize utilization management (case study: Alashtar Plain). Bulletin of Environmental, Pharmacology and Life Sciences2014, 3 (10), 48–56.
- Chao, N.; Luo, Z.; Wang, Z.; Jin, T. Retrieving Groundwater Depletion and Drought in the Tigris- Euphrates Basin Between 2003 and 2015. Groundwater 2017, 56, 770–782. [Google Scholar] [CrossRef] [PubMed]
- Chiang, F.; Mazdiyasni, O.; AghaKouchak, A. Evidence of anthropogenic impacts on global drought frequency, duration, and intensity. Nature Communications 2021, 12, 2754. [Google Scholar] [CrossRef] [PubMed]
- Chlost, I.; Ciesliński, R. Change of level of waters Lake Łebsko. Limnological Review 2005, 5, 17–26. [Google Scholar]
- Chlost, I.; Owczarek, M.; Kirschenstein, M. Thermal and Humidity Conditions of Raised Bogs of the Slowinski National Park (Northern Poland) and their Influence on the Fluctuations of Groundwater Levels. Proceedings of the International Multidisciplinary Scientific GeoConference SGEM 2018.
- Dai, A. Drought under global warming: A review. Wiley Interdiscip. Rev. Clim. Chang. 2011, 2, 45–65. [Google Scholar] [CrossRef]
- Dua, K. S. Y.; Imteaz, M. A.; Sudiayem, I.; Klaas, E. M. E.; Klaas, E. C. M. . Assessing Climate Changes Impacts on Tropical Karst Catchment: Implications on Groundwater Resource Sustainability and Management Strategies. J. Hydrol. 2020, 582, 124426. [Google Scholar] [CrossRef]
- Gurwin, J. Long-term monitoring and GIS based determination of groundwater drought propagation, the Lower Silesia region, SW Poland. Episodes 2014, 37(3), 172–181. [Google Scholar] [CrossRef]
- Ionita, M.; Nagavciuc, V.; Scholz, P.; Dima, M. Long-term drought intensification over Europe driven by the weakening trend of the Atlantic Meridional Overturning Circulation. Journal of Hydrol: RegionalStudies, 2022, vol. 42. [CrossRef]
- Ionita, M.; Tallaksen, L. M.; Kingston, D. G.; Stagge, J. H.; Laaha, G.; Van Lanen, H. A. J.; Scholz, P.; Chelcea, S. M.; Haslinger, K. The European 2015 drought from a climatological perspective. Hydrol. Earth Syst. Sci. 2017, 21, 1397–1419. [Google Scholar] [CrossRef]
- IPCC, 2018: Summary for Policymakers. In: Global Warming of 1.5°C. An IPCC Special Report on the impacts of global warming of 1.5°C above pre-industrial levels and related global greenhouse gas emission pathways, in the context of strengthening the global response to the threat of climate change, sustainable development, and efforts to eradicate poverty [Masson-Delmotte, V., P. Zhai, H.-O. Pörtner, D. Roberts, J. Skea, P.R. Shukla, A. Pirani, W. Moufouma-Okia, C. Péan, R. Pidcock, S. Connors, J.B.R. Matthews, Y. Chen, X. Zhou, M.I. Gomis, E. Lonnoy, T. Maycock, M. Tignor, and T. Waterfield (eds.)]. Cambridge University Press, Cambridge, UK and New York, NY, USA, pp. 3-24. . [CrossRef]
- Kaczorowska, Z. Opady w Polsce w przekroju wieloletnim. (Precipitation in Poland). Prace Geogr. IG PAN 1962, 33, 1–102. (in Polish).
- Kazimierski, B.; Cabalska, J.; Mikołajczyk, A.; Pilichowska-Kazimierska, E. Ocenazagrożeniasusząhydrogeologiczną (gruntową) naobszarzePolski. Materiały XVIII OgólnopolskiegoSympozjumZintegrowanegoMonitoringuŚrodowiskaPrzyrodniczego2009, Szymbark.
- Kowalczyk, A.; Stępińska-Drygała, I.; Wesołowski, P. Zmienność wieloletnia i sezonowa występowania minimalnych stanów wód podziemnych na wybranym obszarze nizinnym [Seasonal and long-term variability of monthly minimum groundwaterlevels in selectedlowlandarea]. Przegląd Geologiczny 2015, 63, 860–866.
- Kowalczyk, A.; Wesołowski, p.; Woźnicka, M. Od powodzi do suszy – analiza zmian sytuacji hydrogeologicznej w Polsce w latach 2010–2015. Biul. Państw. Inst. Geolog. 2016, 466, 123-136.
- Krogulec, E. Evaluating the risk of groundwater drought in groundwater-dependent ecosystems in the central part of the Vistula River Valley, Poland. Ecohydrology& Hydrobiology 2018, 18(1), 82-91. [CrossRef]
- Kubiak-Wójcicka, K.; Jamorska, I. An analysis of groundwater drought in combination with meteorological droughts. Case study of the Gwda River catchment (northern Poland). ActaMontanisticaSlovaca2022, Volume 27 (3), 667-684. [CrossRef]
- Kubiak-Wójcicka, K.; Machula, S. Influence of Climate Changes on the State of Water Resources in Poland and TheirUsage. Geosciences 2020, 10, 0312. [Google Scholar] [CrossRef]
- Laaha, G.; Gauster, T.; Tallaksen, L. M.; Vidal, J.-P.; Stahl, K.; Prudhomme, C.; Heudorfer, B.; Vlnas, R.; Ionita, M.; Van Lanen, H. A. J.; Adler, M.-J.; Caillouet, L.; Delus, C.; Fendekova, M.; Gailliez, S.; Hannaford, J.; Kingston, D.; Van Loon, A. F.; Mediero, L.; Osuch, M.; Romanowicz, R.; Sauquet, E.; Stagge, J. H.; Wong, W. K. The European 2015 drought from a hydrological perspective. Hydrol. Earth Syst. Sci. 2017, 3001–3024. [Google Scholar] [CrossRef]
- Marchant, B. P.; Bloomfield, J. P. Spatio-temporal Modelling of the Status of Groundwater Droughts. J. Hydrol. 2018, 564, 397–413. [Google Scholar] [CrossRef]
- Mishra, A.K.; Singh, V.P. A review of drought concepts. J. Hydrol. 2010, 391, 202–216. [Google Scholar] [CrossRef]
- Moravec, V.; Markonis, Y.; Rakovec, O.; Svoboda, M.; Trnka, M.; Kumar, R.; Hanel, M. Europe under multi-year droughts: how severe was the 2014–2018 drought period. Environ. Res. Lett. 2021, 16. [Google Scholar] [CrossRef]
- Paczyński, B.; Sadurski, A. (Eds). Hydrogeologia regionalna Polski [Regionalhydrogeology of Poland]. Państwowy Instytut Geologiczny, Warszawa, Poland, 2007, 106 pp.
- Peters, E. Propagation of drought through groundwater systems – illustrated in the Pang (UK) and Upper-Guadiana (ES) catchments. Wageningen University & Research, Wageningen, 2003.
- Peters, E.; van Lanen, H.A.J. Propagation of drought in groundwater in semi-arid and sub-humid climatic regimes. Hydrology of the Mediterranean and Semi-Arid Regions2003, 278, 312–317.
- PSH Report No. 6a/2015. https://www.pgi.gov.pl/psh/materialy-informacyjne-psh.
- Rebetez, M.; Mayer, H.; Dupont, O.; Schindler, D.; Gartner, K.; Kropp, J.P.; Menzel, A. Heat and drought 2003 in Europe: aclimate synthesis. Ann. For. Sci. 2006, 63(6), 569–577. [Google Scholar] [CrossRef]
- Rotnicki, K. Identyfikacja, wiekiprzyczynyholoceńskichingresjiiregresjiBałtykunapolskimwybrzeżuśrodkowym. Wydawn. SłowińskiegoParkuNarodowego, Smołdzino, Poland, 2009.
- Rotnicki K., Borówka R. K. The last cold period in the Gardno-Łeba Coastal Plain. In: Rotnicki K. (ed.), Polish Coast: Past, Present and Future, Journal of Coastal Research 1995, Spec. Issue 22, 225-230.
- Rotnicki K., Borzyszkowska W. PrzyspieszonywzrostpoziomumorzaijegoskładowenapolskimwybrzeżuBałtyku w latach 1951–1990 (Accelerated sea-level rise and its components at the Polish Baltic coast in the years 1951–1990). In: EwolucjasystemównadmorskichPołudniowegoBałtyku, Borówka R.K. (ed.), BoguckiWydawnictwoNaukowe, Poznań–Szczecin, 1999, pp. 141–160.
- Smorowska, U. Changes in Drought Conditions in Poland over the Past 60 Years Evaluated by the Standardized Precipitation-Evapotranspiration Index. ActaGeophysica2016, vol. 64, no 6. [CrossRef]
- Spinoni, J.; Barbosa, P.; De Jager, A.; McCormick, N.; Naumann, G.; Vogt, J.V.; Magni, D.; Masante, D.; Mazzeschi, M. A new global database of meteorological drought events from 1951 to 2016. J. Hydrol. Reg. Stud. 2019, 22, 100593. [Google Scholar] [CrossRef]
- Spinoni, J.; Naumann, G.; Carrao, H.; Barbosa, P.; Vogt, J. World drought frequency, duration, and severity for 1951–2010. Int. J. Climatol. 2014, 34, 2792–2804. [Google Scholar] [CrossRef]
- Spinoni, J.; Naumann, G.; Vogt, J. V.; Barbosa, P. Meteorological droughts in Europe: Events and impacts, past trends and future projections, Office des publications, Luxembourg, 2016.
- Staśko, S.; Tarka, R.; Buczyński, S. (2017). Ekstremalne zdarzenia meteorologiczne i ich odzwierciedlenie w stanach wód podziemnych (przykłady z Dolnego Śląska) [Extreme weatherevents and theireffect on the groundwaterlevel. Examples from Lower Silesia]. Przegląd Geol. 2017, 65: 1244–1248.
- Tallaksen, L.M.; Van Lanen, H.A.J. Hydrological drought: processes and estimation methods for streamflow and groundwater. In: Developments in Water Science, vol. 48. Amsterdam, the Netherlands: Elsevier Science B.V.; 2004.
- Tarka R., Staśko S. Wahania zwierciadła wód podziemnych jako odzwierciedlenie ekstremalnych sytuacji pogodowych. In: WyjątkowezdarzeniaprzyrodniczenaDolnymŚląskuiichskutki. UniwersytetWrocławski, Wrocław, 2010, 241-255.
- Taylor, R. G.; Scanlon, B.; Döll, P.; Rodell, M.; van Beek, R.; Wada, Y. , et al. (2012). Ground Water and Climate Change. Nat. Clim Change. 2012, 3, 322–329. [Google Scholar] [CrossRef]
- Van Lanen, H.A.J.; Peters, E. Definition, effects and assessment of groundwater droughts. Drought and Drought Mitigation in Europe, 49–61, Kluwer AcademicPublishers, 2000.
- Van Loon, A.F. Hydrological drought explained by climate and catchment characteristics. Journal of Hydrol. 2015, 526, 3. [Google Scholar] [CrossRef]
- Van Loon, A. F.; Anne, F. Hydrological Drought Explained. WIREsWater2015, 2, 359–392. Wiley Interdiplinary. [CrossRef]
- Wendt, D.E.; Van Loon, A.F.; Bloomfield, J.P.; Hannah, D.M. Asymmetric impact of groundwater use on groundwater droughts. Hydrol. Earth Syst. Sci. 2020, 24, 4853–4868. [Google Scholar] [CrossRef]
- Wilhite, D.A. Drought: A Global Assessment, vols. I & II. Routledge Hazards and Disasters Series, Routledge, London, 2000.
- Wilhite, D.A.; Glantz, MH. Understanding the drought phenomenon: the role of definitions. Water Int. 1985, 10:111–120.
- Wolski, T.; Wiśniewski, B. Long-term, seasonal and short-term fluctuations in the water level of the Southern Baltic Sea. Quaest. Geographic. 2014, 33(3), 181–197. [Google Scholar] [CrossRef]
- Zhou, Y.; Zwahlen, F.; Wang, Y.; Li, Y. Impact of Climate Change on Irrigation Requirements in Terms of Groundwater Resources. Hydrogeol J. 2010, 18(7), 1571–1582. [Google Scholar] [CrossRef]
Figure 1.
Location of the study areain the Polish Baltic coastal zone : (a)- the Łeba Barrier with A and B piezometer profile and meteorological and tide-gauge station in Łeba; (b)- location of research site (piezometers A1, A4, B1, B4, B8 and Czołpino).
Figure 1.
Location of the study areain the Polish Baltic coastal zone : (a)- the Łeba Barrier with A and B piezometer profile and meteorological and tide-gauge station in Łeba; (b)- location of research site (piezometers A1, A4, B1, B4, B8 and Czołpino).
Figure 2.
(A) Piezometer B1(the northern barrier zone; the belt of coastal dunes); (B) Piezometer B4 (the central barrier zone);(C)Piezometer B8 (the southern barrier zone; the marshy belt);(D)Piezometer A1(the northern barrier zone the belt of coastal dunes).
Figure 2.
(A) Piezometer B1(the northern barrier zone; the belt of coastal dunes); (B) Piezometer B4 (the central barrier zone);(C)Piezometer B8 (the southern barrier zone; the marshy belt);(D)Piezometer A1(the northern barrier zone the belt of coastal dunes).
Figure 3.
Variability of average annual groundwater depths (GD) in piezometers on the Łeba Barrier against the background of the long-term average annual groundwater depth (AAGD) 2009-2020.
Figure 3.
Variability of average annual groundwater depths (GD) in piezometers on the Łeba Barrier against the background of the long-term average annual groundwater depth (AAGD) 2009-2020.
Figure 4.
(a) -Variability of the annual sum of precipitation (AP) on the Łeba Barrier against the background of the long-term average annual precipitation (AAP) for 2009-2020y and 1981-2010; (b) - Variability of the long-term monthly average of precipitation (MAP) for 2009-2020y and 1981-2010. Prepared on the basis of IMWM data (for Łeba meteorological station) according to hydrological years (November-October); 1-normal year, 2-wet year, 3-dry year, 4- very dry year.
Figure 5.
(a) -Variability of the annual temperature (AT) on the Łeba Barrier against the background of the long-term average annual temperature (AAT) for 2009-2020y and 1981-2010; (b) - Variability of the long-term monthly average of temperature on (MAT) for 2009-2020y and 1981-2010. Prepared on the basis of IMWM data(for Łeba meteorological station) according to hydrological years (November-October);.
Figure 6.
(a) - Variability of the long-term monthly average of precipitation (MAP) for 2009-2020y and monthly average in 2015; (b) - Variability of the long-term monthly average of temperature on (MAT) for 2009-2020y and monthly average in 2015. Prepared on the basis of IMWM data (for Łeba meteorological station) according to hydrological years (November-October);.
Figure 7.
a - Variability of average annual of Baltic Sea level (AASL) for 2009-2020y against the background of the long-term average annual (AASL) 2009-2020; b - Variability of the long-term monthly average of Łebsko lake level (MASL) for 2009-2020y and monthly average of sea level in 2015. Prepared on the basis of IMWM data (for Łeba mareographical station) according to hydrological years (November-October);.
Figure 8.
(a) - Variability of the long-term monthly average of Baltic Sea level (MASL) for 2009-2020y and monthly average of sea level in 2015; (b) - Variability of the long-term monthly average of Łebsko Lake level (MASL) for 2009-2020y and monthly average of lake level in 2015. Prepared on the basis of IMWM data (for Łeba station) according to hydrological years (November-October);.
Figure 9.
Groundwater drought on the Łeba Barrier in 2015; Average of the lowest groundwater depth of each year (ALG) 2009-2020 - shallow hydrogeological drought; Deep hydrogeological drought (DD); a,c,e,g - variability of monthly average groundwater depths (GD) in 2015 in piezometers against the background of the monthly precipitation (MP); b,d,f,h - variability of monthly average groundwater depths (GD) in 2015 in piezometers against the background of monthly sea level in 2015.; Prepared on the basis of IMWM data(for Łeba meteorological station) according to hydrological years (November-October).
Figure 10.
Relations between the Baltic Sea level and the groundwater levels on the Łeba Barrier presented in absolute heights [m a.s.l.].
Figure 10.
Relations between the Baltic Sea level and the groundwater levels on the Łeba Barrier presented in absolute heights [m a.s.l.].
|
Disclaimer/Publisher’s Note: The statements, opinions and data contained in all publications are solely those of the individual author(s) and contributor(s) and not of MDPI and/or the editor(s). MDPI and/or the editor(s) disclaim responsibility for any injury to people or property resulting from any ideas, methods, instructions or products referred to in the content. |
© 2023 by the authors. Licensee MDPI, Basel, Switzerland. This article is an open access article distributed under the terms and conditions of the Creative Commons Attribution (CC BY) license (http://creativecommons.org/licenses/by/4.0/).


