1. Introduction
G protein-coupled receptors (GPCRs) are the most abundant types of receptors on eukaryotic cell membranes. Each of them typically contains a conversed architecture of seven transmembrane helices (TMs) that divide the receptor into N-terminus, C-terminus, three extracellular loops (ECLs), and three intracellular loops (ICLs) [
1]. Once anchored by specific ligands, the receptor is activated through conformational rearrangements, followed by recruiting corresponding G proteins or β-arrestins to the intracellular binding site and triggering downstream signaling [
2].
Neurotensin receptor 1 (NTSR1), a prototypical class A GPCR, plays a prominent role in central nervous system and in the periphery [
3]. In the past 40 years, researchers have extensively developed small molecules and peptides to explore its biological functions [
4,
5,
6,
7,
8,
9]. These modulators, according to their biological effect, can be categorized into full agonists, partial agonists and antagonists [
10]. Further studies have shown that NTSR1 agonists play an anti-addictive role in the central nervous system, while antagonists inhibit the invasion and migration of peripheral cells, demonstrating the potential to treat a variety of peripheral tumors [
3].
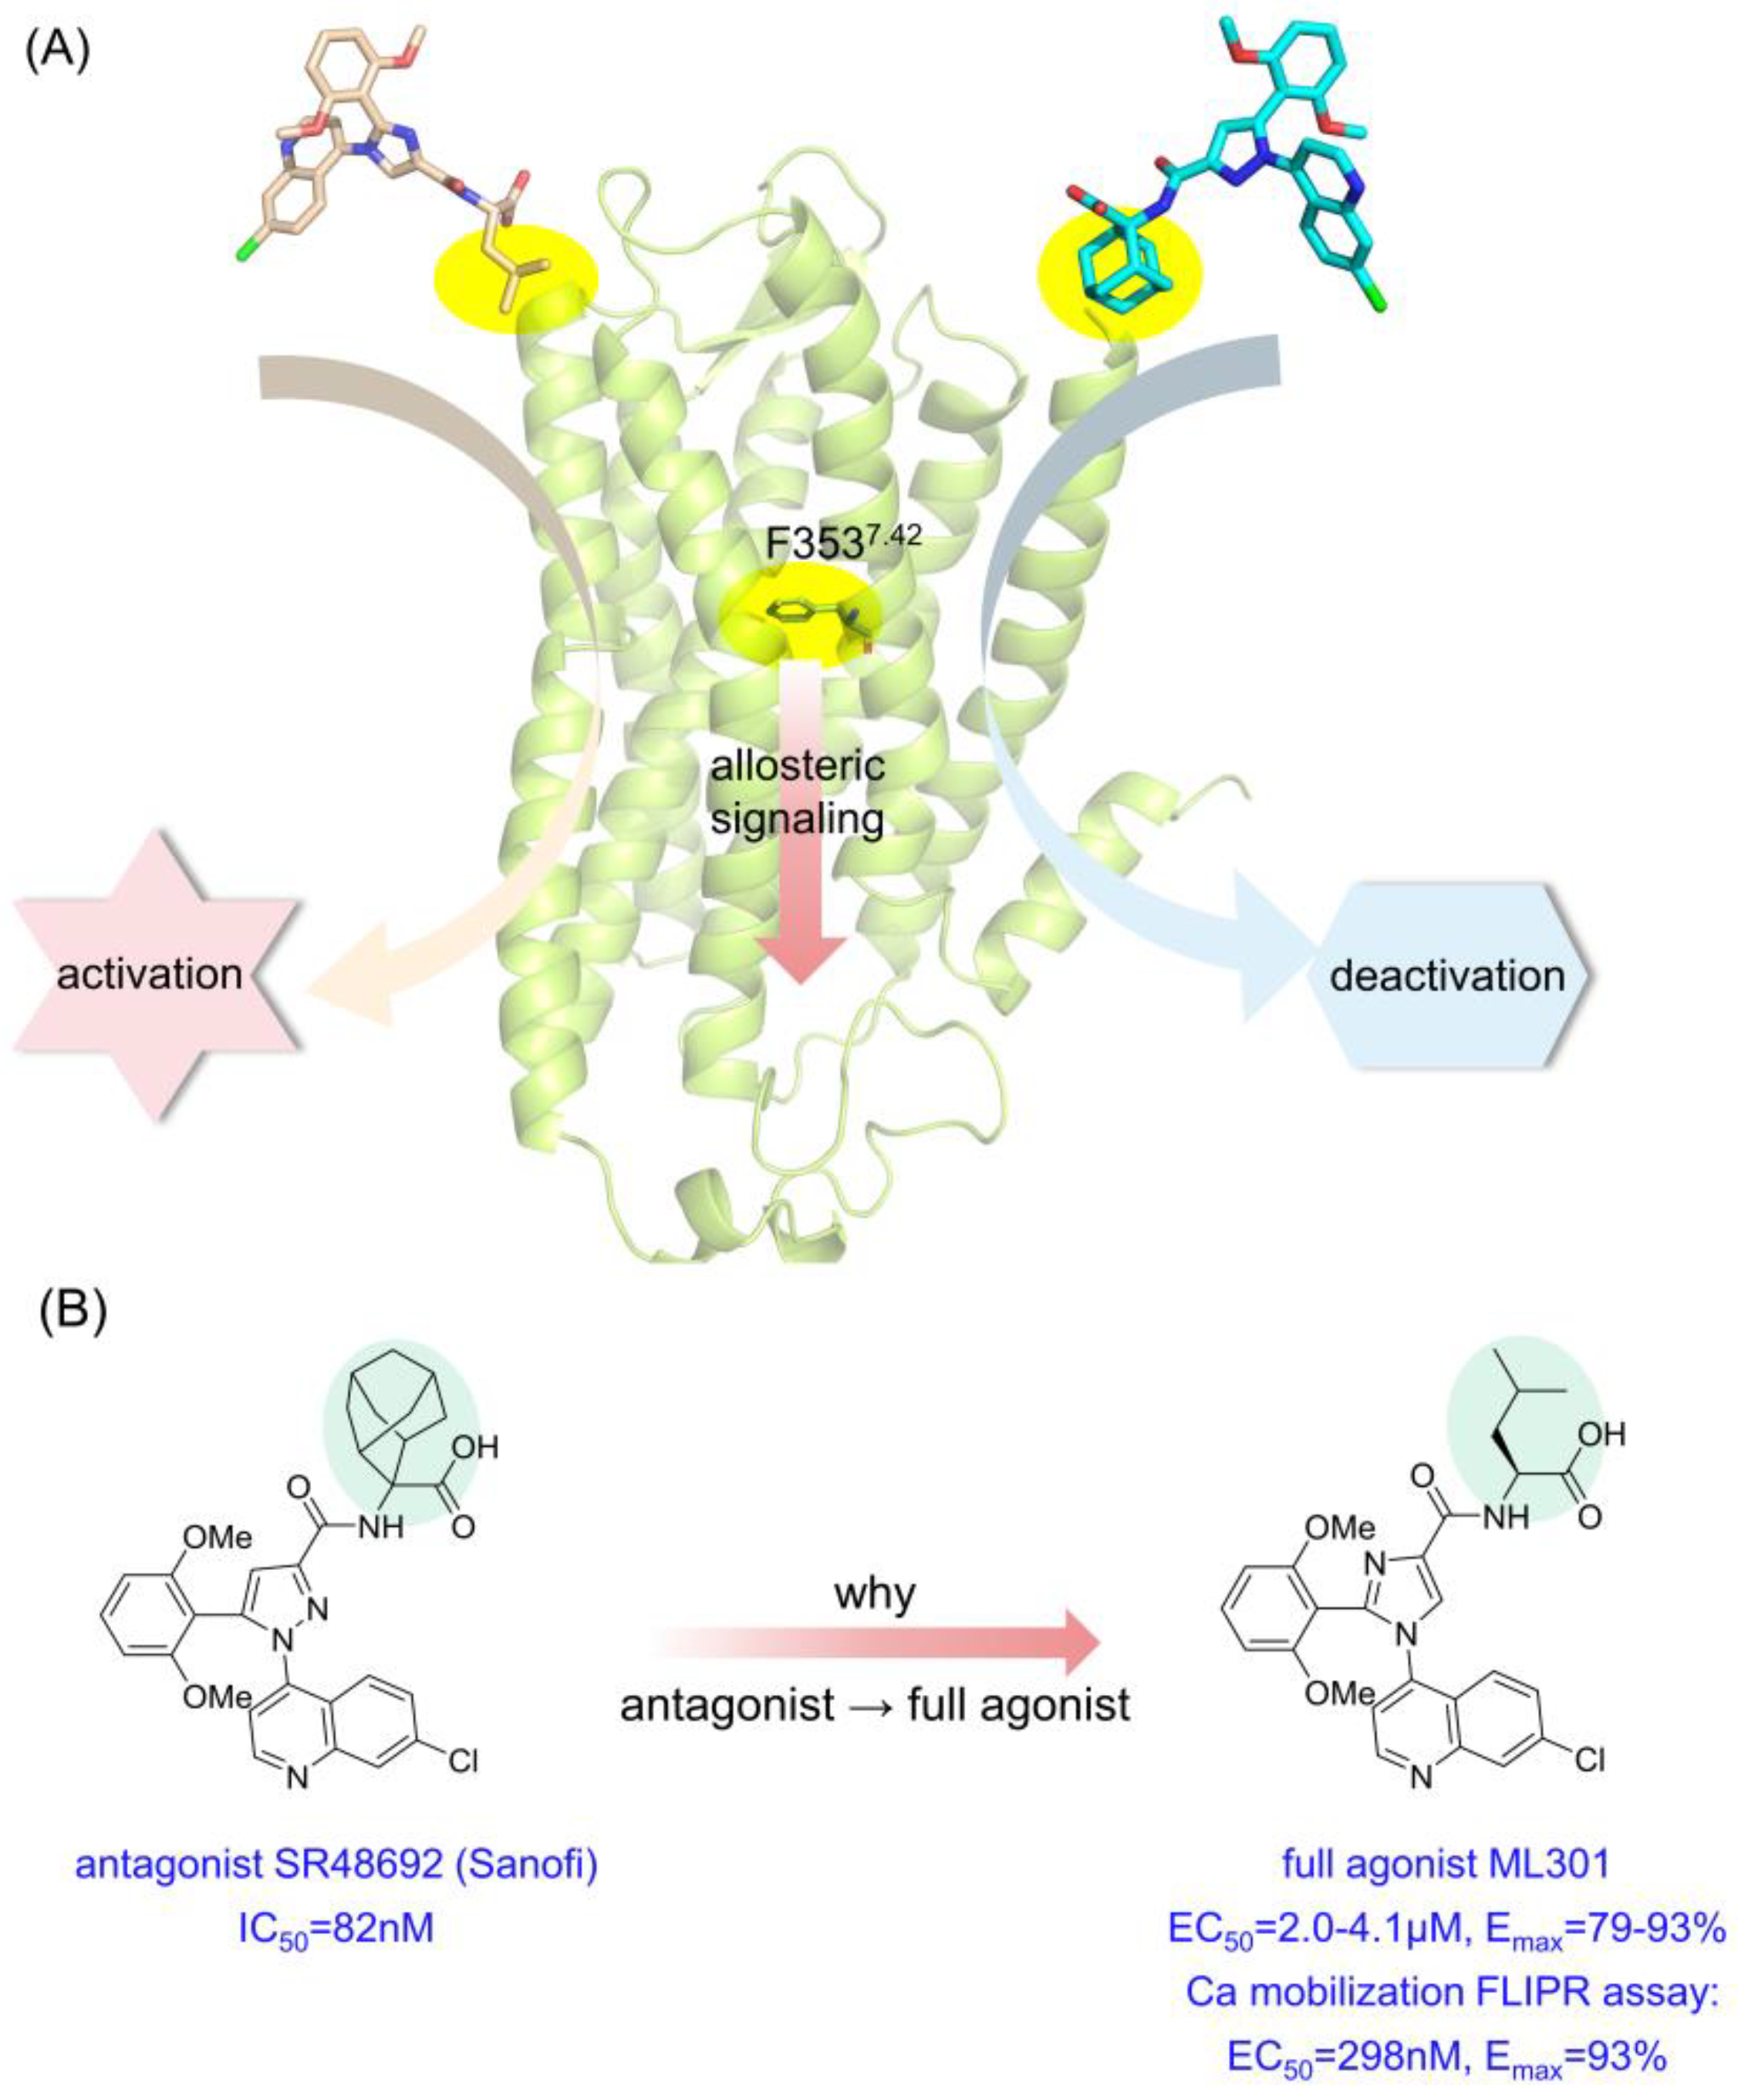
Among modulators, a ubiquitous phenomenon is that merely the substitution of adamantane into leucine moiety reverses antagonists into full agonists [
6] (
Figure 1). Mechanistic study of this phenomenon will be conducive to resolving fine-tuning signal regulation within class A GPCRs and accelerating the design of NTSR1 agonists or antagonists.
Recently, the complexes of NTSR1 and its ligands have been determined by either crystal or cryo-electron microscopy (cryo-EM) methodology [
11,
12,
13,
14,
15], laying solid underpinning for this research. However, these snapshots are intrinsically static and therefore not sufficient enough to represent the dynamics of conformational ensemble to explain differences in protein internal signaling. Molecular dynamics (MD) simulations, initiating from static crystallographic structures, simulates dynamical information on atomic level and conformational transitions, serving as a crucial complementation for crystallography [
16,
17]. Its biophysical application ranges from protein conformational study [
18,
19], allosteric mechanisms [
20,
21], to drug discovery [
22,
23,
24,
25].
In view of conformational transition of GPCRs occurring over a large time scale, one of the enhanced sampling methodologies, Gaussian accelerated molecular dynamics (GaMD) simulation, is employed. GaMD adds a harmonic boost potential which follows a near-Gaussian distribution to smoothen the potential energy surface of the system, accelerating the transition between low-energy states [
26]. With the advantage of no need to set predefined reaction coordinates and reducing the energetic noise, GaMD has witnessed extensive applications in GPCR conformational exploration [
27,
28].
Here, we selected representative NTSR1 agonist ML301 and antagonist SR48692 to decipher the mechanism of one-group difference triggering inverse NTSR1 signaling. GaMD (a total of 12 μs) was performed as a pioneer to broaden the conformational landscape, while synergistic application of conventional MD (cMD) simulation (a total of 10.5 μs) and Markov state models were conducted to characterize the detailed conformational dynamics of NTSR1 in different states. The result indicated that the flexibility distinction of leucine/adamantane moiety contributes to different signal transduction via a loosely coupled allosteric network. Furthermore, we found that R3226.54, Y3196.51, F3537.42, S3567.45 and S3577.46 might play a constructive role in inducing the activation of NTSR1 receptor. Collectively, this research provides dynamic insights into the elaborate signaling pathway within NTSR1 and lays a promising foundation for refinement of modulators harboring different regulatory functions of NTSR1 receptor.
2. Materials and Methods
2.1. Construction of Stimulated Systems
Four model systems were built for MD simulations: inactive NTSR1+ML301 system, inactive NTSR1+SR48692 system, active NTSR1+ML301 system, active NTSR1+SR48692 system. The inactive NTSR1 structure was obtained by homology modeling based on corresponding murine structure (PDB ID: 6ZIN) [
15]. SWISS-MODEL (
https://swissmodel.expasy.org/) [
29] and Pymol were utilized to remodel the truncated loops, carry out homology modeling and remove non-NTSR1 co-crystallized molecules. The obtained inactive state structure was then performed as receptor for molecular docking of ML301 and SR48692 utilizing Autodock Vina. The output ligand poses were carefully aligned, since adamantane versus leucine is the only major difference between the two compounds. Using the canonical state NTSR1 (PDB ID: 6OS9) [
13] as the receptor, the active NTSR1+ML301 complex and the active NTSR1+SR48692 complex were constructed in a similar way. Then, the obtained complexes were oriented in the Orientations of Proteins in Membrane (OPM) server (opm.phar.umich.edu/) [
30] and inserted into the POPC membrane in the CHARMM-GUI server [
31]. Next, the systems were embedded in TIP3P water molecules with a length of 10 Å. The counterions concentration of 0.15 mol/L KCl were used to balance the system charge [
32]. Finally, we used Amber-tleap program to generate the coordinate and topology files for simulation, with lipid 14 force field for POPC membrane [
33], ff14SB force field for proteins [
34], GAFF force field for ligands [
35] and TIP3P model for water molecules [
36].
2.2. Gaussian Accelerated Molecular Dynamics (GaMD) Simulations
The systems were first minimized with restraint of 500 kcal mol-1Å-2 on the NTSR1 receptors and ligands, while waters and counterions were minimized in 30,000 deepest descent cycles, followed by 20,000 conjugate gradient cycles. Second, all atoms were subjected to 4000 cycles of steepest descent and 20,000 cycles of conjugate gradient minimization without any restraint. Next, each system was gradually thermalized from 0 K to 310 K within 700 ps under isothermal-isovolumetric (NVT) conditions and finally equilibrated for 3.5 ns in an isothermal-isobaric (NPT) ensemble.
In the GaMD simulation method, when the system potential V(r) is lower than the reference energy E at position r, the updated V*(r) is calculated using Equations (1) and (2):
where the two parameters E and k (the harmonic force constant) are automatically adjusted using Equations (3) and (4):
If E is set to the lower bound as
, then
can be calculated by Equation (5), while if E is set to the upper bound
, then
can be calculated by Equation (6):
where , and denote the maximum, minimum and averaged potential energy of simulated systems, with and refer to the standard deviation of potential energy and user-specified upper limit for proper reweighting, respectively.
To conduct GaMD product simulation, conventional MD simulation of 100 ns was first performed to obtain
,
,
,
and the greatest
and
. Next, 60 ns GaMD equilibration were conducted to collect boost potential [
27]. Last, four systems underwent 3 rounds of 1 μs dual-boost GaMD simulations with random velocities and an integration step of 2.0 fs. During simulations, the particle mesh Ewald (PME) method was employed to evaluate the long-range electrostatic interactions while a cutoff of 10 Å was used for short-range electrostatic and van der Waals interactions [
37]. Covalent bonds involving hydrogen were restricted using the SHAKE algorithm [
38]. The temperature of the systems was kept at 310 K using the Langevin dynamics with the coupling time constant of 1.0 ps. The coordinates of the snapshots were collected every 200 ps.
2.3. Conventional Molecular Dynamics (cMD) Simulations
To reasonably select replicas in GaMD simulations, K-means clustering algorithm was performed and finally two replicas of the active NTSR1+ML301 system and five replicas of the active NTSR1+SR48692 system were selected. The restart files were extracted according to the representative frames for the input of cMD simulation. Then, seven systems underwent 3 rounds of 500 ns cMD simulations with random velocities and an integration step of 2.0 fs. The simulation settings and methods kept consistent with GaMD simulations except for removing the boost potential.
2.4. Dynamic Cross-Correlation Matrix (DCCM) Analysis
The Dynamic Cross-Correlation Matrix (DCCM) analysis was performed using the CPPTRAJ module [
39] of AMBER18 on representative trajectories to to investigate the coupled motions between atoms. Based on the normalized cross-correlation matrix C, the ‘Pearson-like’ cross-correlation coefficient () is calculated using Equation (7):
where and indicate the position vectors of ith and jth atoms.
2.5. Principal Component Analysis (PCA) and Free Energy Landscape (FEL)
To capture the dominant motions during simulation, an effective statistical method PCA was introduced by constructing covariance matrix, diagonalizing the matrix to generate eigenvectors and computing eigenvalues based on the mean square fluctuation of trajectories projected along the eigenvectors. The eigenvectors, interpreted as principal components, were ranked by eigenvalues, with the top-ranked eigenvectors (such as PC1 and PC2) represent the most influential dynamics of the system [
40].
where , T, and represent Boltzmann constant, simulation temperature, the population of ith bin and the population of most populated bins. To enhance the diversity of indicator selection to ensure comprehensive conformational depiction, we selected indicators including distance, angle and RMSD values.
2.6. Community Network Analysis (CNA)
Benefited from correlation coefficient matrix
and the NetworkView plugin in VMD, we computed the community organization distinction between the active NTSR1+ML301 system and the active NTSR1+SR48692 system. In this analysis, each
atom was recognized as a node. Based on Equation (7), the edge connections between nodes can be further calculated using Equation (11):
where
was computed using Equation (7) with i and j represent two nodes here. Two nodes are considered connected with a cutoff distance of 4.5 Å for at least 75% of the simulation time. Next, connected substructures, namely ‘communities’, was generated utilizing Girvan−Newman algorithm with a cutoff residue number of 3. The edge betweenness, put as the number of optimal paths travel across certain edge, was then calculated and set proportional to the width of bonds bridging communities [
42,
43].
2.7. Markov State Models (MSM) Construction and Validation
Harnessing activation/deactivation parameters as input, Markov state models (MSM) was constructed following the standard PyEMMA protocol (
http://www.emma-project.org/latest/) [
44]. First, both the active NTSR1+ML301 system and the active NTSR1+SR48692 system was validated Markovian through the implied timescale (ITS) verification obeying Equation (12):
where represents the lag time and denotes the eigenvalues of the Markov transition matrix.
Then, the free-energy landscape was decomposed into 120 microstates using K-means clustering algorithm and MSMs was established with an ITS-unaffected lag time of 5 ns. Thereupon, the Perron Cluster Analysis (PCCA+) algorithm was assigned to converge the microstates into four metastates, where Chapman–Kolmogorov test was subsequently conducted to validate Markovian among them. Next, the transition path theory (TPT) was applied to calculate the mean first passage time (MFPT) for activation/deactivation process based on the transition probability matrix of MSMs. Finally, utilizing MDTraj package, we extracted the structures near the microstate cluster centers of corresponding metastate into new trajectories and selected the representative conformation of each metastate according to the similarity score
given by Equation (13):
where is the RMSD between conformation i and j, while is the standard deviation of d.
3. Results
3.1. Antagonist SR48692 and Agonist ML301 Binding Induce Respective Inactive and Active Conformations of NTSR1
To comprehensively explore the conformational landscape, each 1 μs × 3 rounds of GaMD simulations was performed on four systems, including the inactive NTSR1+SR48692 system, the inactive NTSR1+ML301 system, the active NTSR1+SR48692 system, and the active NTSR1+ML301 system. We defined two parameters (namely collective variables, CVs) to project the simulated trajectories onto a two-dimensional (2D) space, to depict the global conformational transition during NTSR1 activation/deactivation. Since the most quintessential feature shared by class A GPCRs activation is the outward movements of TM5 and TM6 and the inward displacement of TM7 at the intracellular side [
19,
20,
32], the first CV is the distance between the center of mass of S253
5.55 (superscripts indicate the Ballesteros-Weinstein numbering for GPCR residues) in TM5 and S356
7.45-S357
7.46 in TM7 (distance TM5-TM7). The decrease of TM5-TM7 distance represents the inward movement of TM7. The distance between the center of mass of Y103
2.41 in TM2 and V302
6.34 in TM6 (distance TM2-TM6) is defined as the second CV. The increase of TM2-TM6 distance means the outward displacement of TM6.
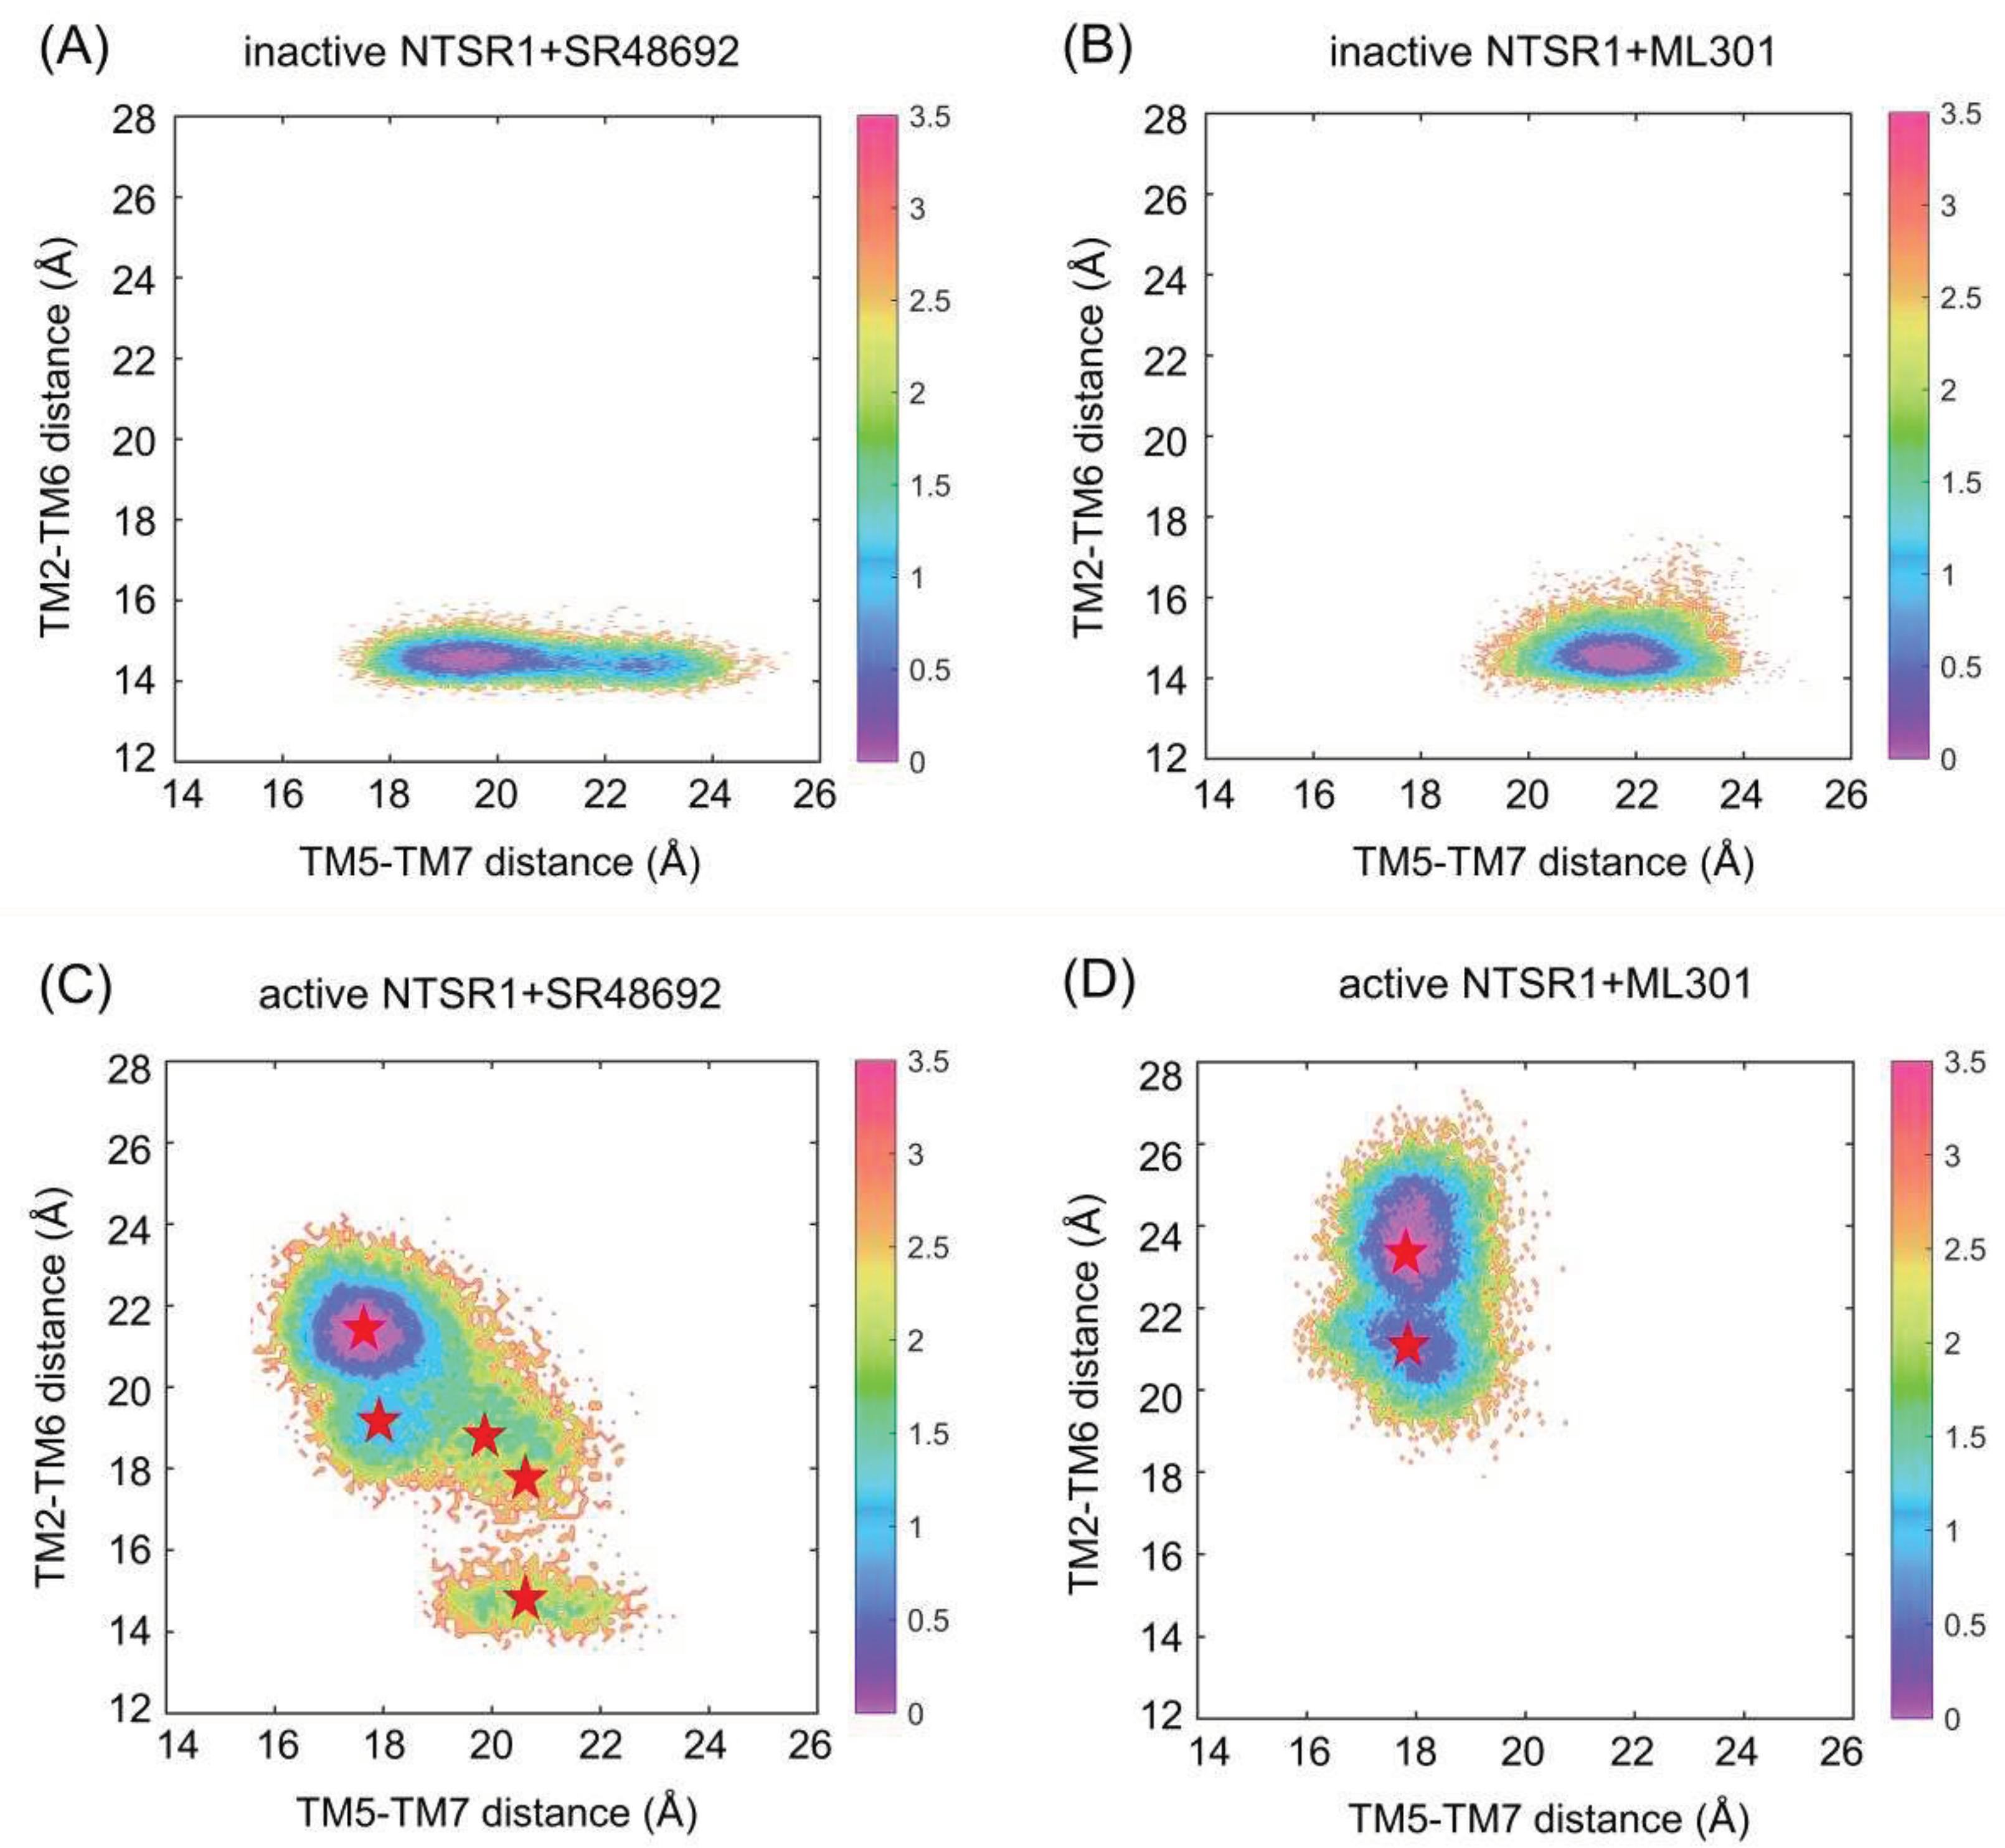
Antagonist SR48692 and agonist ML301 binding induces distinct conformational ensemble of NTSR1 (
Figure 2). Since the initial inactive structure is characterized by a TM5-TM7 distance of 22.45 Å and a TM2-TM6 distance of 14.42 Å, the density basin with a TM5-TM7 distance of ~20-23 Å and a TM2-TM6 distance of ~14-15 Å represents the inactive state (
Figure 2A,B). Similarly, with the initial active structure featuring a TM5-TM7 distance of 16.86 Å and a TM2-TM6 distance of 24.35 Å, the active conformation can be characterized by the density basin with a TM5-TM7 distance of ~16.5-19 Å and a TM2-TM6 distance of ~20.5-25 Å (
Figure 2C,D). These observations suggest that the active conformations are inaccessible initiating from the inactive state of NTSR1 due to high energy barrier even with agonist ML301 binding (
Figure 2A,B), while the inactive conformations are captured initiating from the active state of NTSR1 in the presence of antagonist SR48692 (
Figure 2C,D). Once bound to SR48692, the receptor transits from the active into inactive states through several intermediate conformations (
Figure 2C). In contrast, the full agonist ML301 binding stabilizes the receptor in the active state (
Figure 2D). 2D landscape projected by other parameters (CV1: TM3-TM6 distance, evaluated by the distance between the center of mass of R166
3.50 in TM3 and V302
6.34 in TM6; CV2: NPxxY RMSD, evaluated by root mean square deviation of non-symmetric side-chain atoms of residues N360
7.49 to Y364
7.53) demonstrates similar results (
Figure S1).
We used K-means clustering to extract five representative conformations from GaMD trajectories of the active NTSR1+SR48692 system (
Figure 2C) and two representative conformations from GaMD trajectories of the active NTSR1+ML301 system (
Figure 2D), and then performed additional 500 ns × 3 rounds cMD simulations on the seven systems with each extracted conformation as the initial structure. The RMSD value of ligands in all simulations was first proved to reach convergence in both systems (
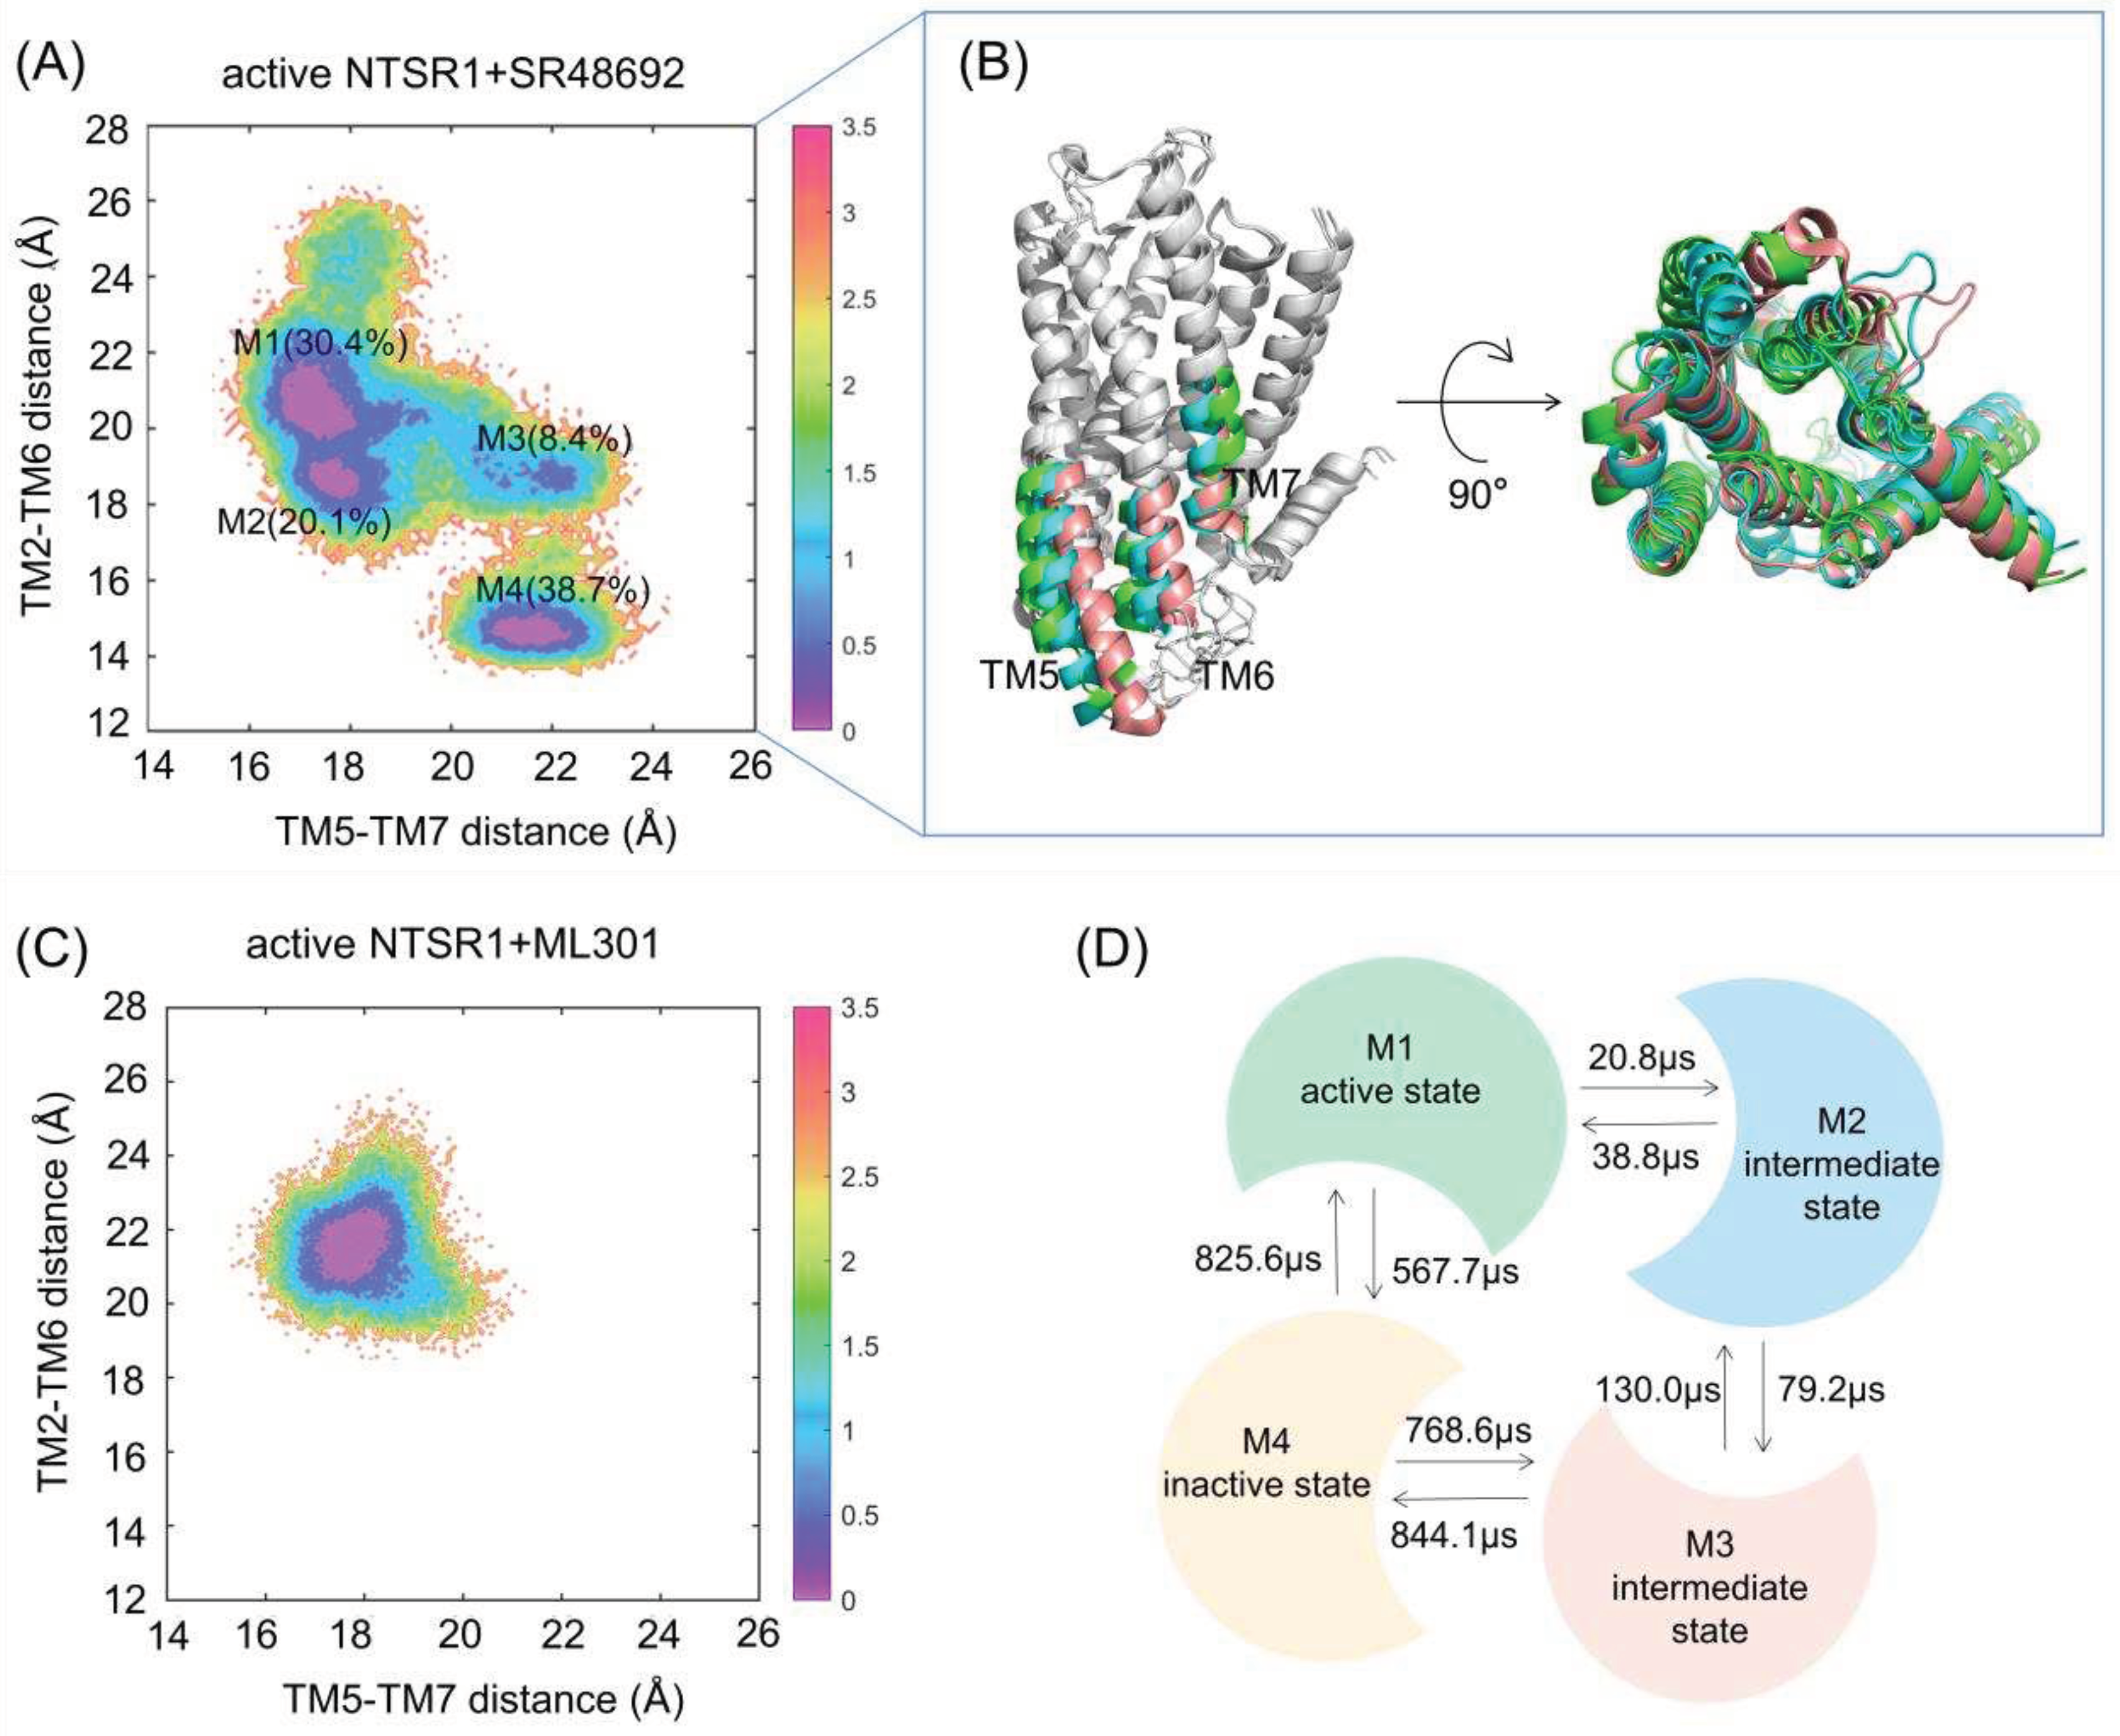
Figure S2A), in order to verify the rationality of our docking and simulation. Then, the free energy landscape was depicted using identical CVs. Antagonist SR48692 binding induces the gradual deactivation of NTSR1 through a transition pathway of M1 (the active state, 30.4%) → M2 (the intermediate state, 20.1%) → M3 (the intermediate state, 8.4%) →M4 (the inactive state, 38.7%) (
Figure 3A). Significantly, the representative conformation extracted from each energy basin features typical characteristics of the active state, the intermediate state and the inactive state, as revealed by the conformational arrangements of TM5, TM6 and TM7 (
Figure 3B). Porcupine plot was constructed to graphically visualize the dominant movements of different regions (
Figure S2B). The outward shifts of TM5 and TM6 and the inward translocation of TM7 present the dominant conformational dynamics despite the highly flexible loops. In contrast, agonist ML301 binding stabilizes NTSR1 in the active state (
Figure 3C). 2D landscape projected by TM3-TM6 distance (CV1) and NPxxY RMSD (CV2) illustrates similar results (
Figure S2C and S2D).
We further applied Markov state models to unveil the transition detail of the active NTSR1+SR48692 system (
Figure 3D). The result indicates that the M1→M2 (20.8 μs) and M2→M3 (79.2 μs) transition times are shorter than the corresponding reverse processes (38.8 and 130.0 μs, respectively), which confirm that the inactive state is more accessible than the active state with the binding of SR48692 to the active NTSR1. Notably, owing to the lowest population of the M3 state, a long timescale is required for the complete deactivation of the receptor, implying that NTSR1 deactivation is a slow motion.
3.2. Agonist ML301 Binding Contributes to Enhanced Conformational Dynamics
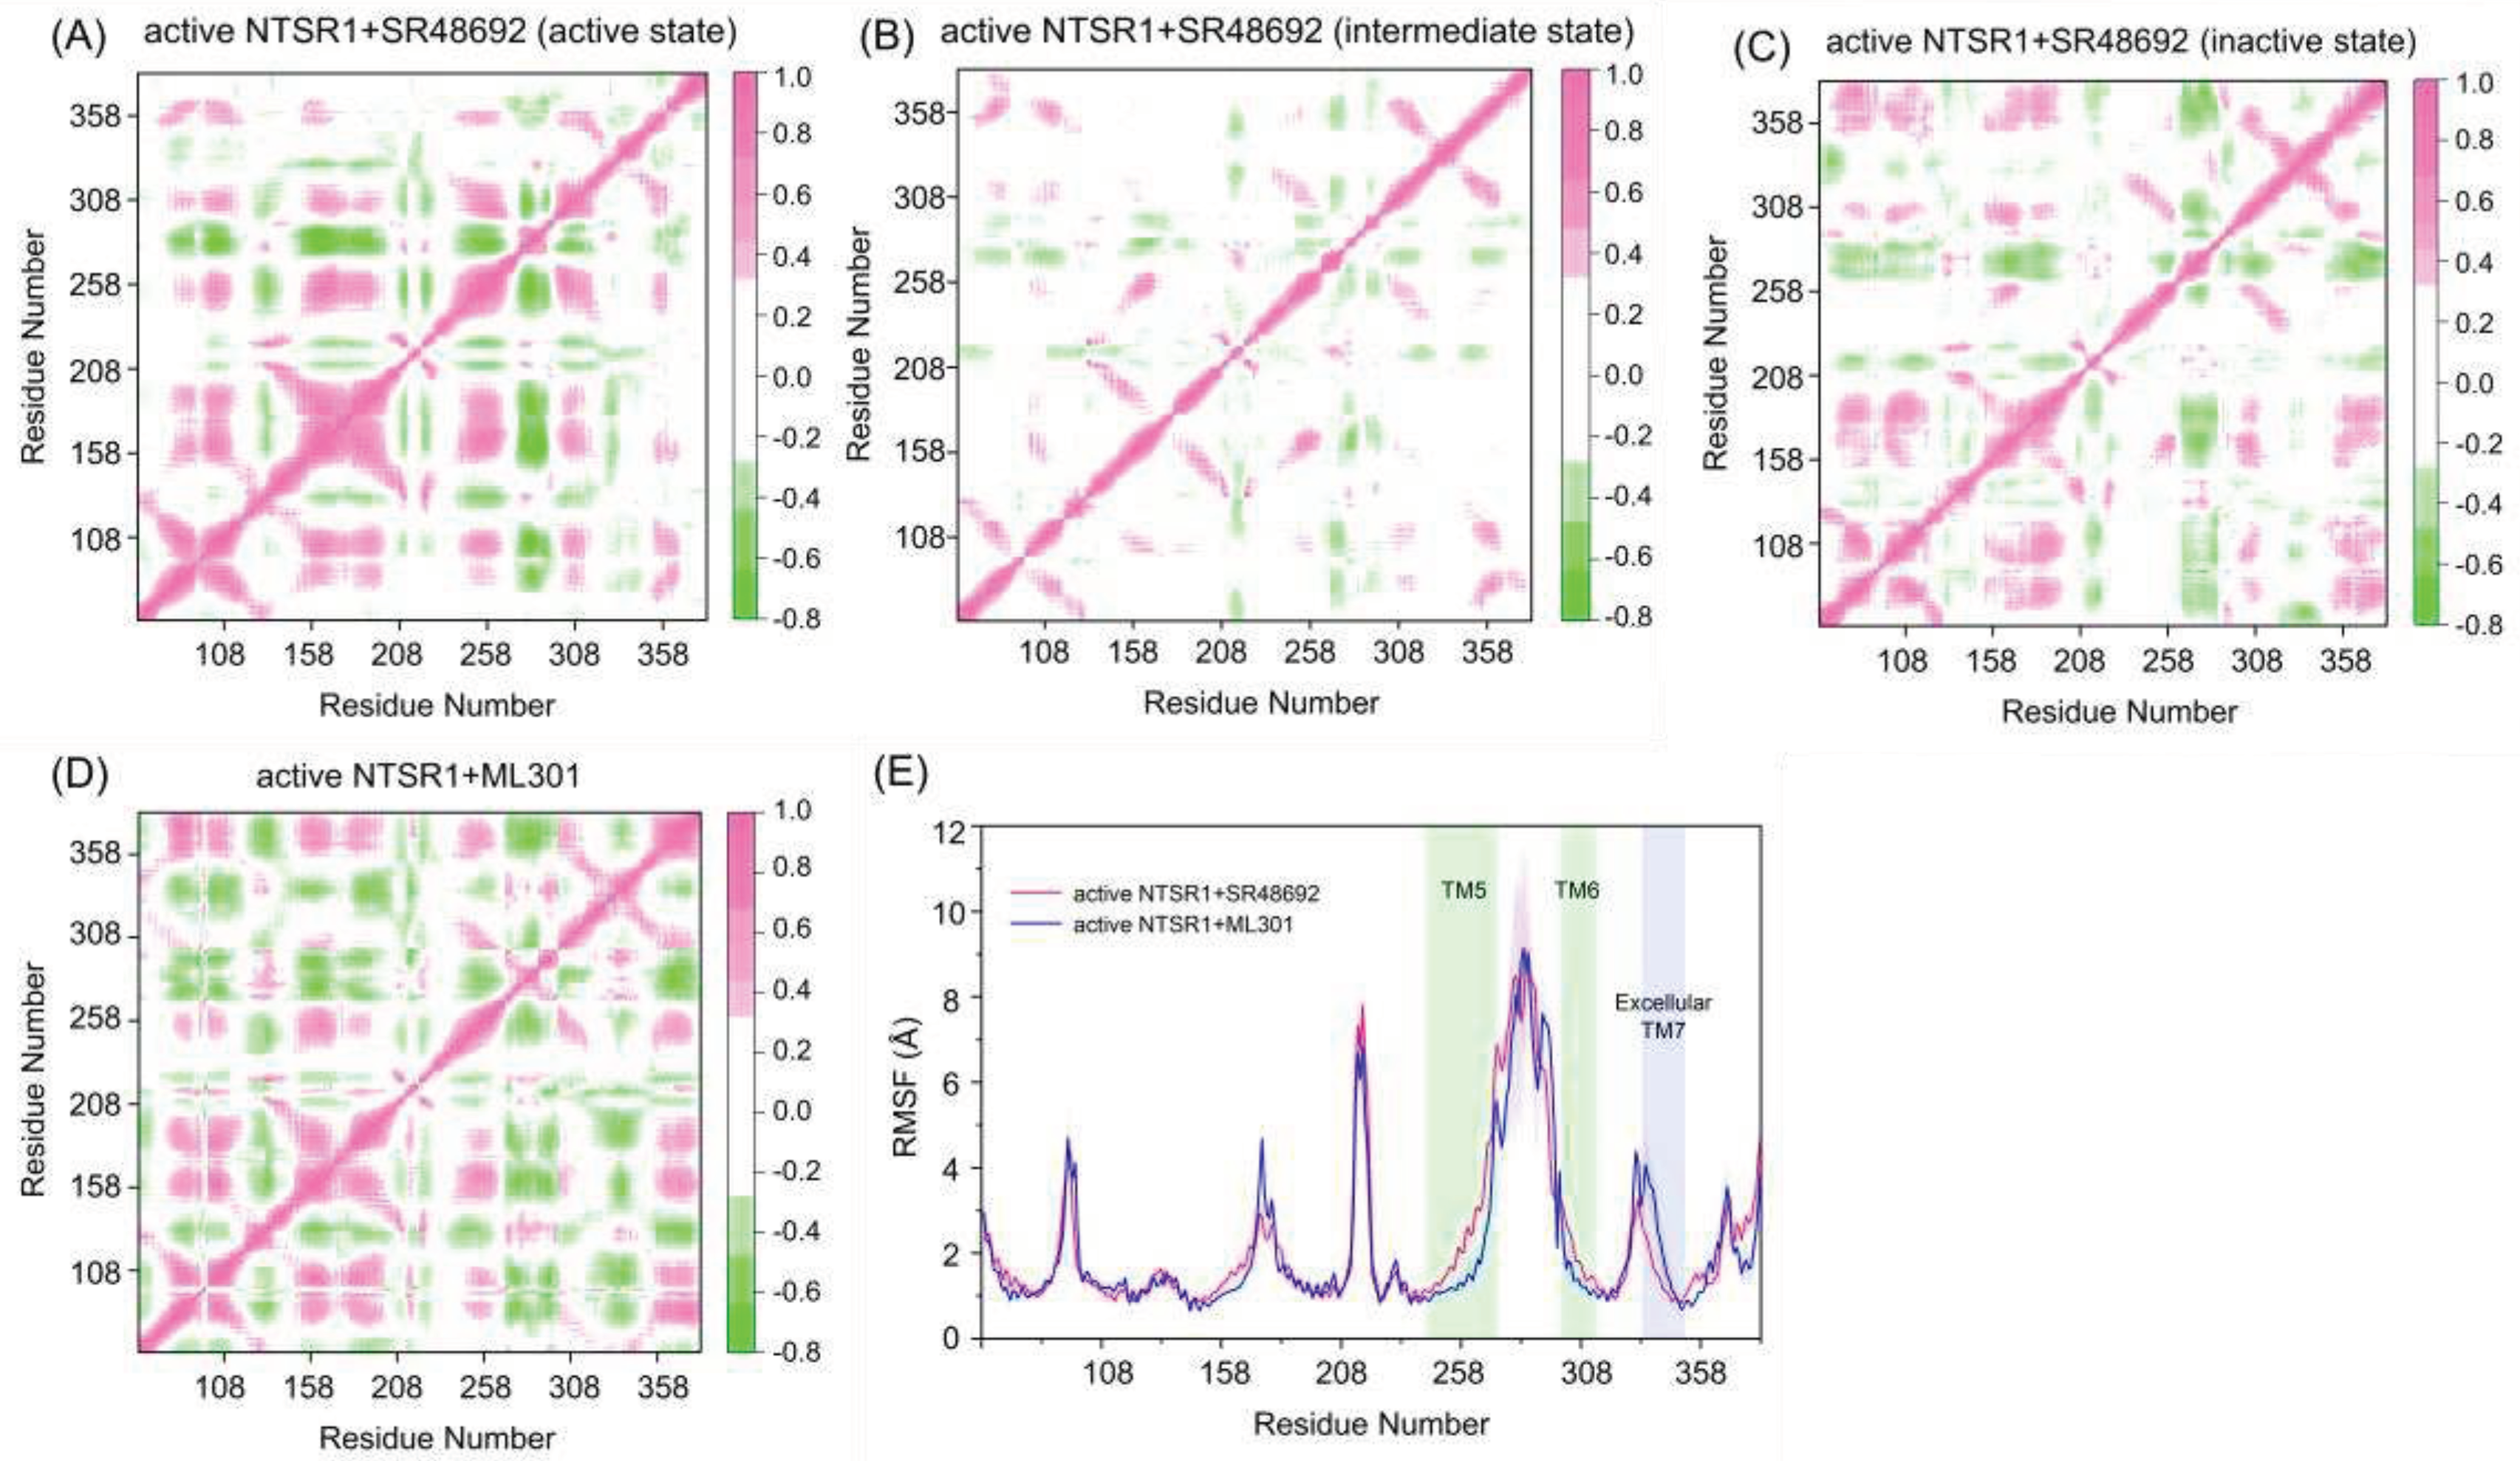
To reveal the dynamic movement of protein domains within the receptor, we conducted dynamic cross-correlation matrix analysis using trajectories of representative conformations. In the active NTSR1+SR48692 system, less correlations were observed in the active (
Figure 4A), intermediate (
Figure 4B), and inactive (
Figure 4C) states. In contrast, the enhanced movements were observed in the active NTSR1+ML301 system (
Figure 4D), thus altering the protein internal structure for enhanced signal propagation, which may promote activation signal transduction.
The atomic root-mean square fluctuations (RMSFs) of Cα atoms around their original positions were subsequently quantified for each residue to compare the mobility of different regions (
Figure 4E). Major fluctuated functional regions in the two systems include TM5, TM6 and extracellular TM7. Due to the deactivation of the receptor, TM5 and TM6 of the active NTSR1+SR48692 system display remarkable inward movement and therefore fluctuate more frequently than that of the active NTSR1+ML301 system. Notably, in the active NTSR1+ML301 system, the extracellular region of TM7 experiences more fluctuation than that of the active NTSR1+SR48692 system. Because the extracellular TM7 approaches to the ligand binding site, the residues within this region might function as a trigger for discriminating the activation or deactivation signal.
3.3. The Flexibility of Leucine Moiety in Agonist ML301 Contributes to the Inward Displacement of TM7
The intramolecular interactions, including hydrogen bonds, salt bridges, polar interactions, and hydrophobic interactions, play critical roles in signal propagation within the protein [
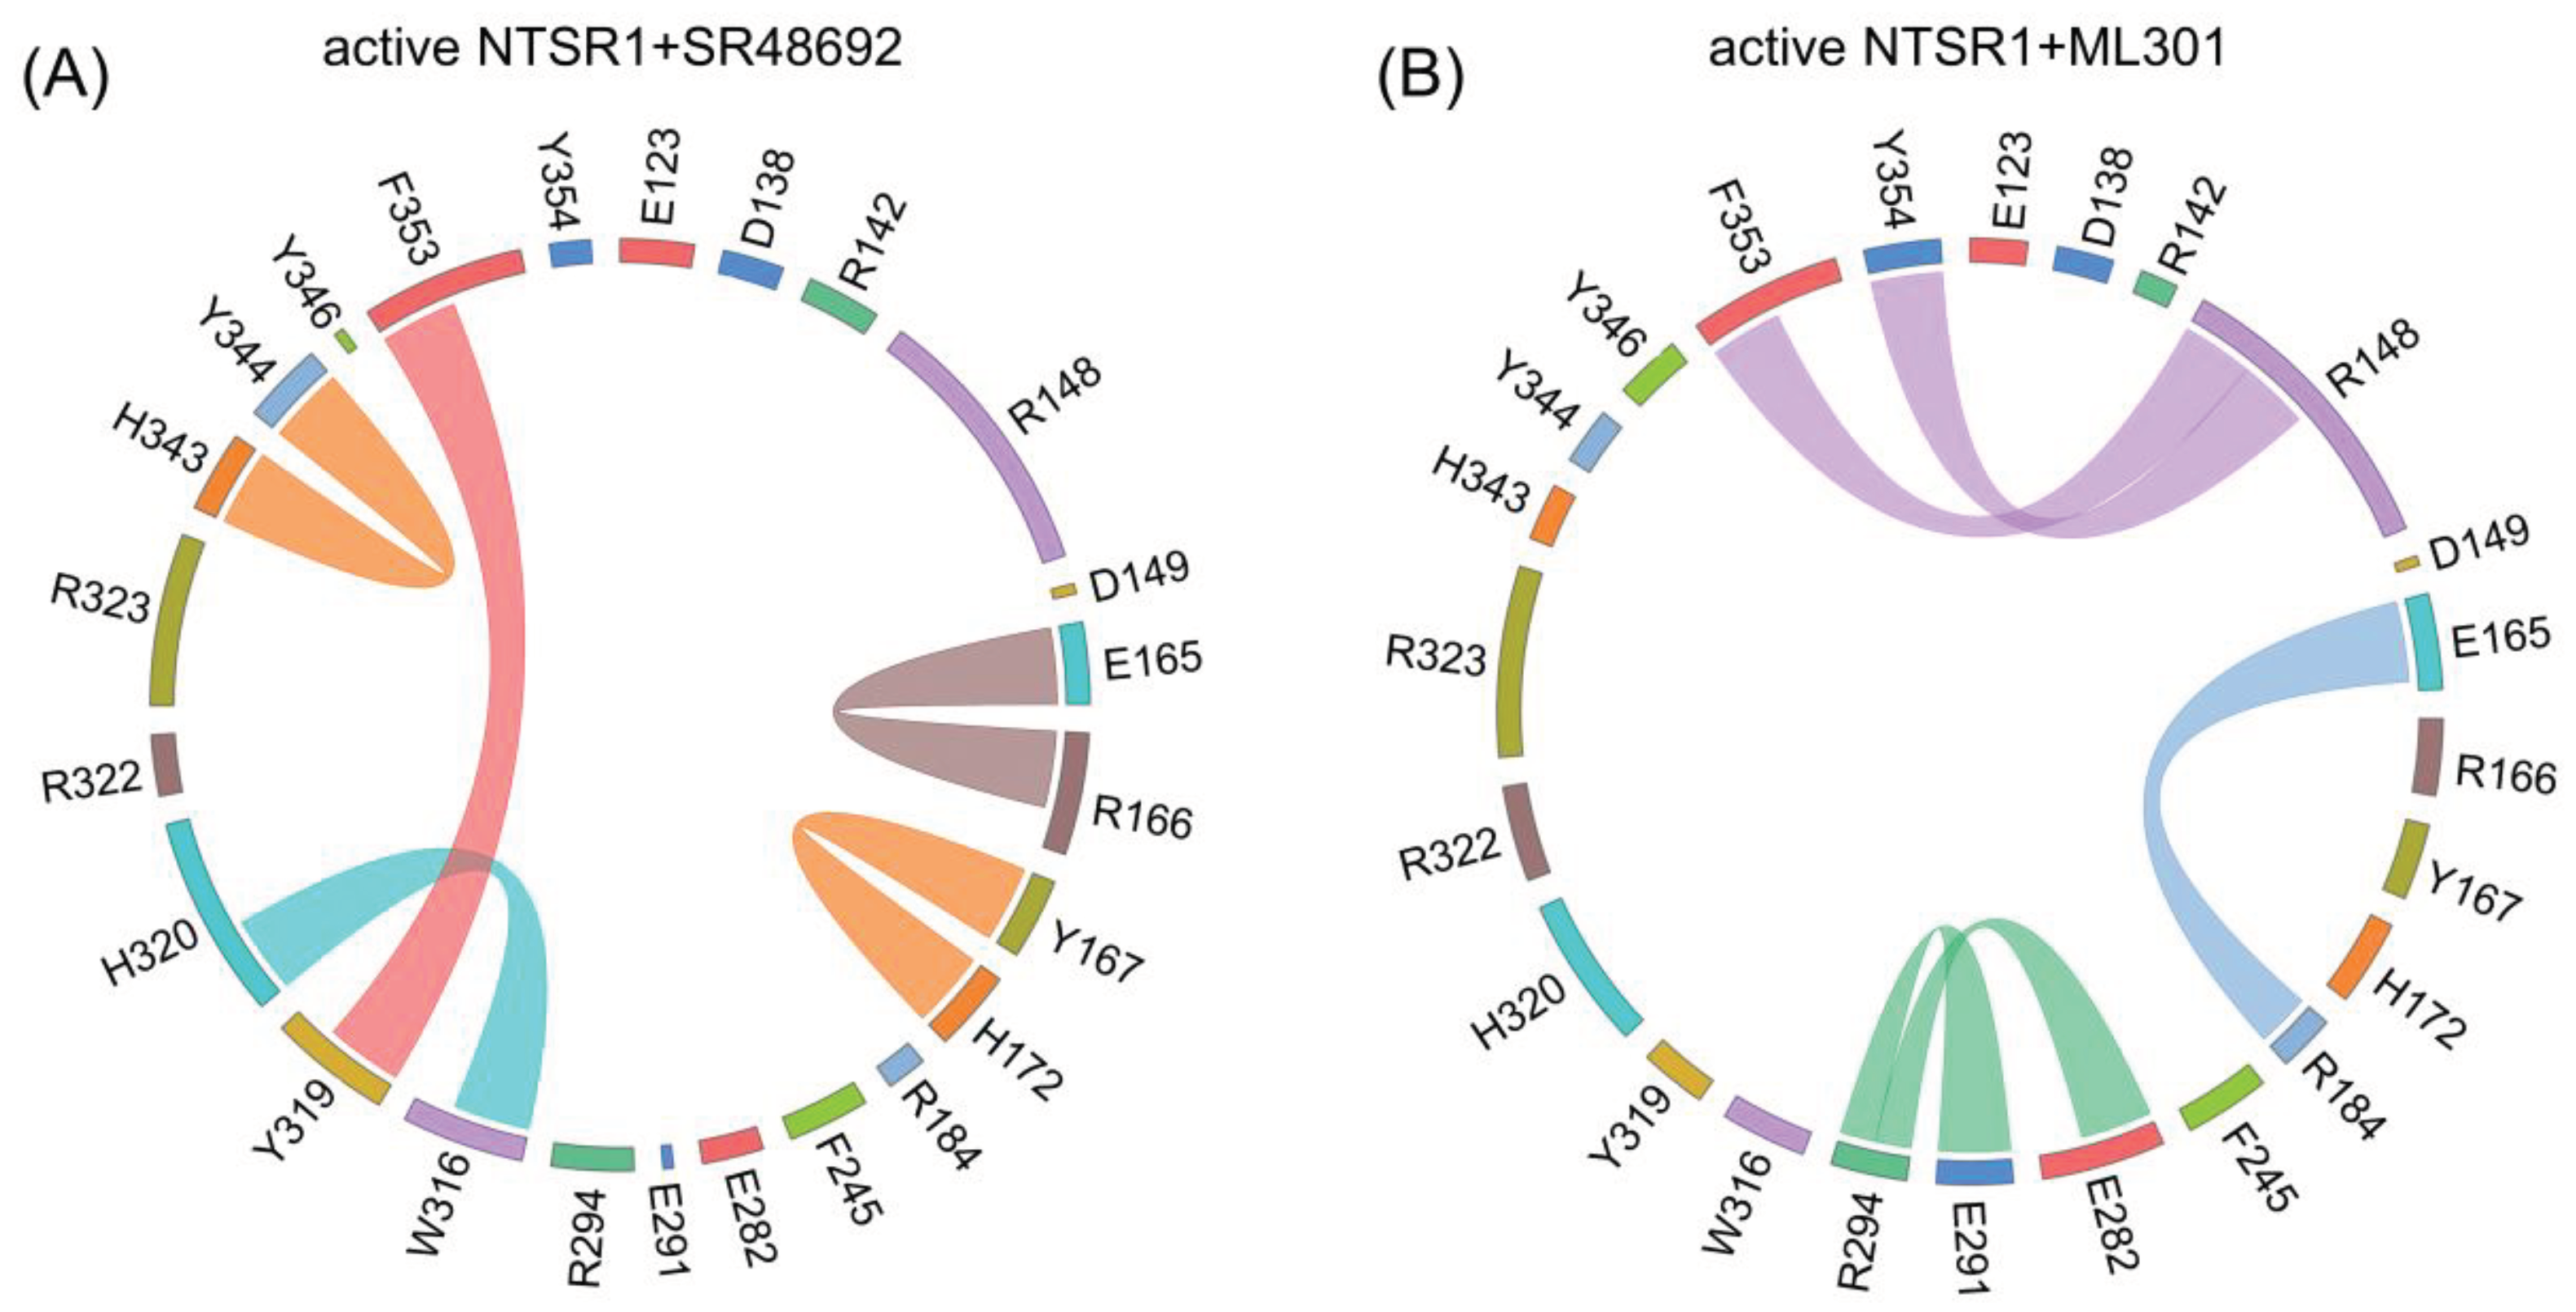
45]. To uncover distinct signal transduction, we analyzed different kinds of interactions of the active NTSR1+SR48692 system and the active NTSR1+ML301 system based on the representative trajectories. Here, proportional chord diagrams were used to describe the specific interactions that occupies over 50% of the simulation time (
Figure 5).
Proximal to the ligand binding site, F353
7.42 forms π-π stacking with Y319
6.51 in the active NTSR1+SR48692 system (
Figure 5A). In contrast, it forms selective π-cation interaction with R148
3.32 in the active NTSR1+ML301 system (
Figure 5B). During simulations, we found that the adamantane moiety of antagonist SR48692 exhibits relative rigidity with less fluctuation (RMSF: 1.13 Å). The salt bridge between ligand’s carboxyl group and R322
6.54, the π-cation interaction between R322
6.54 and Y319
6.51, and the π-π stacking between Y319
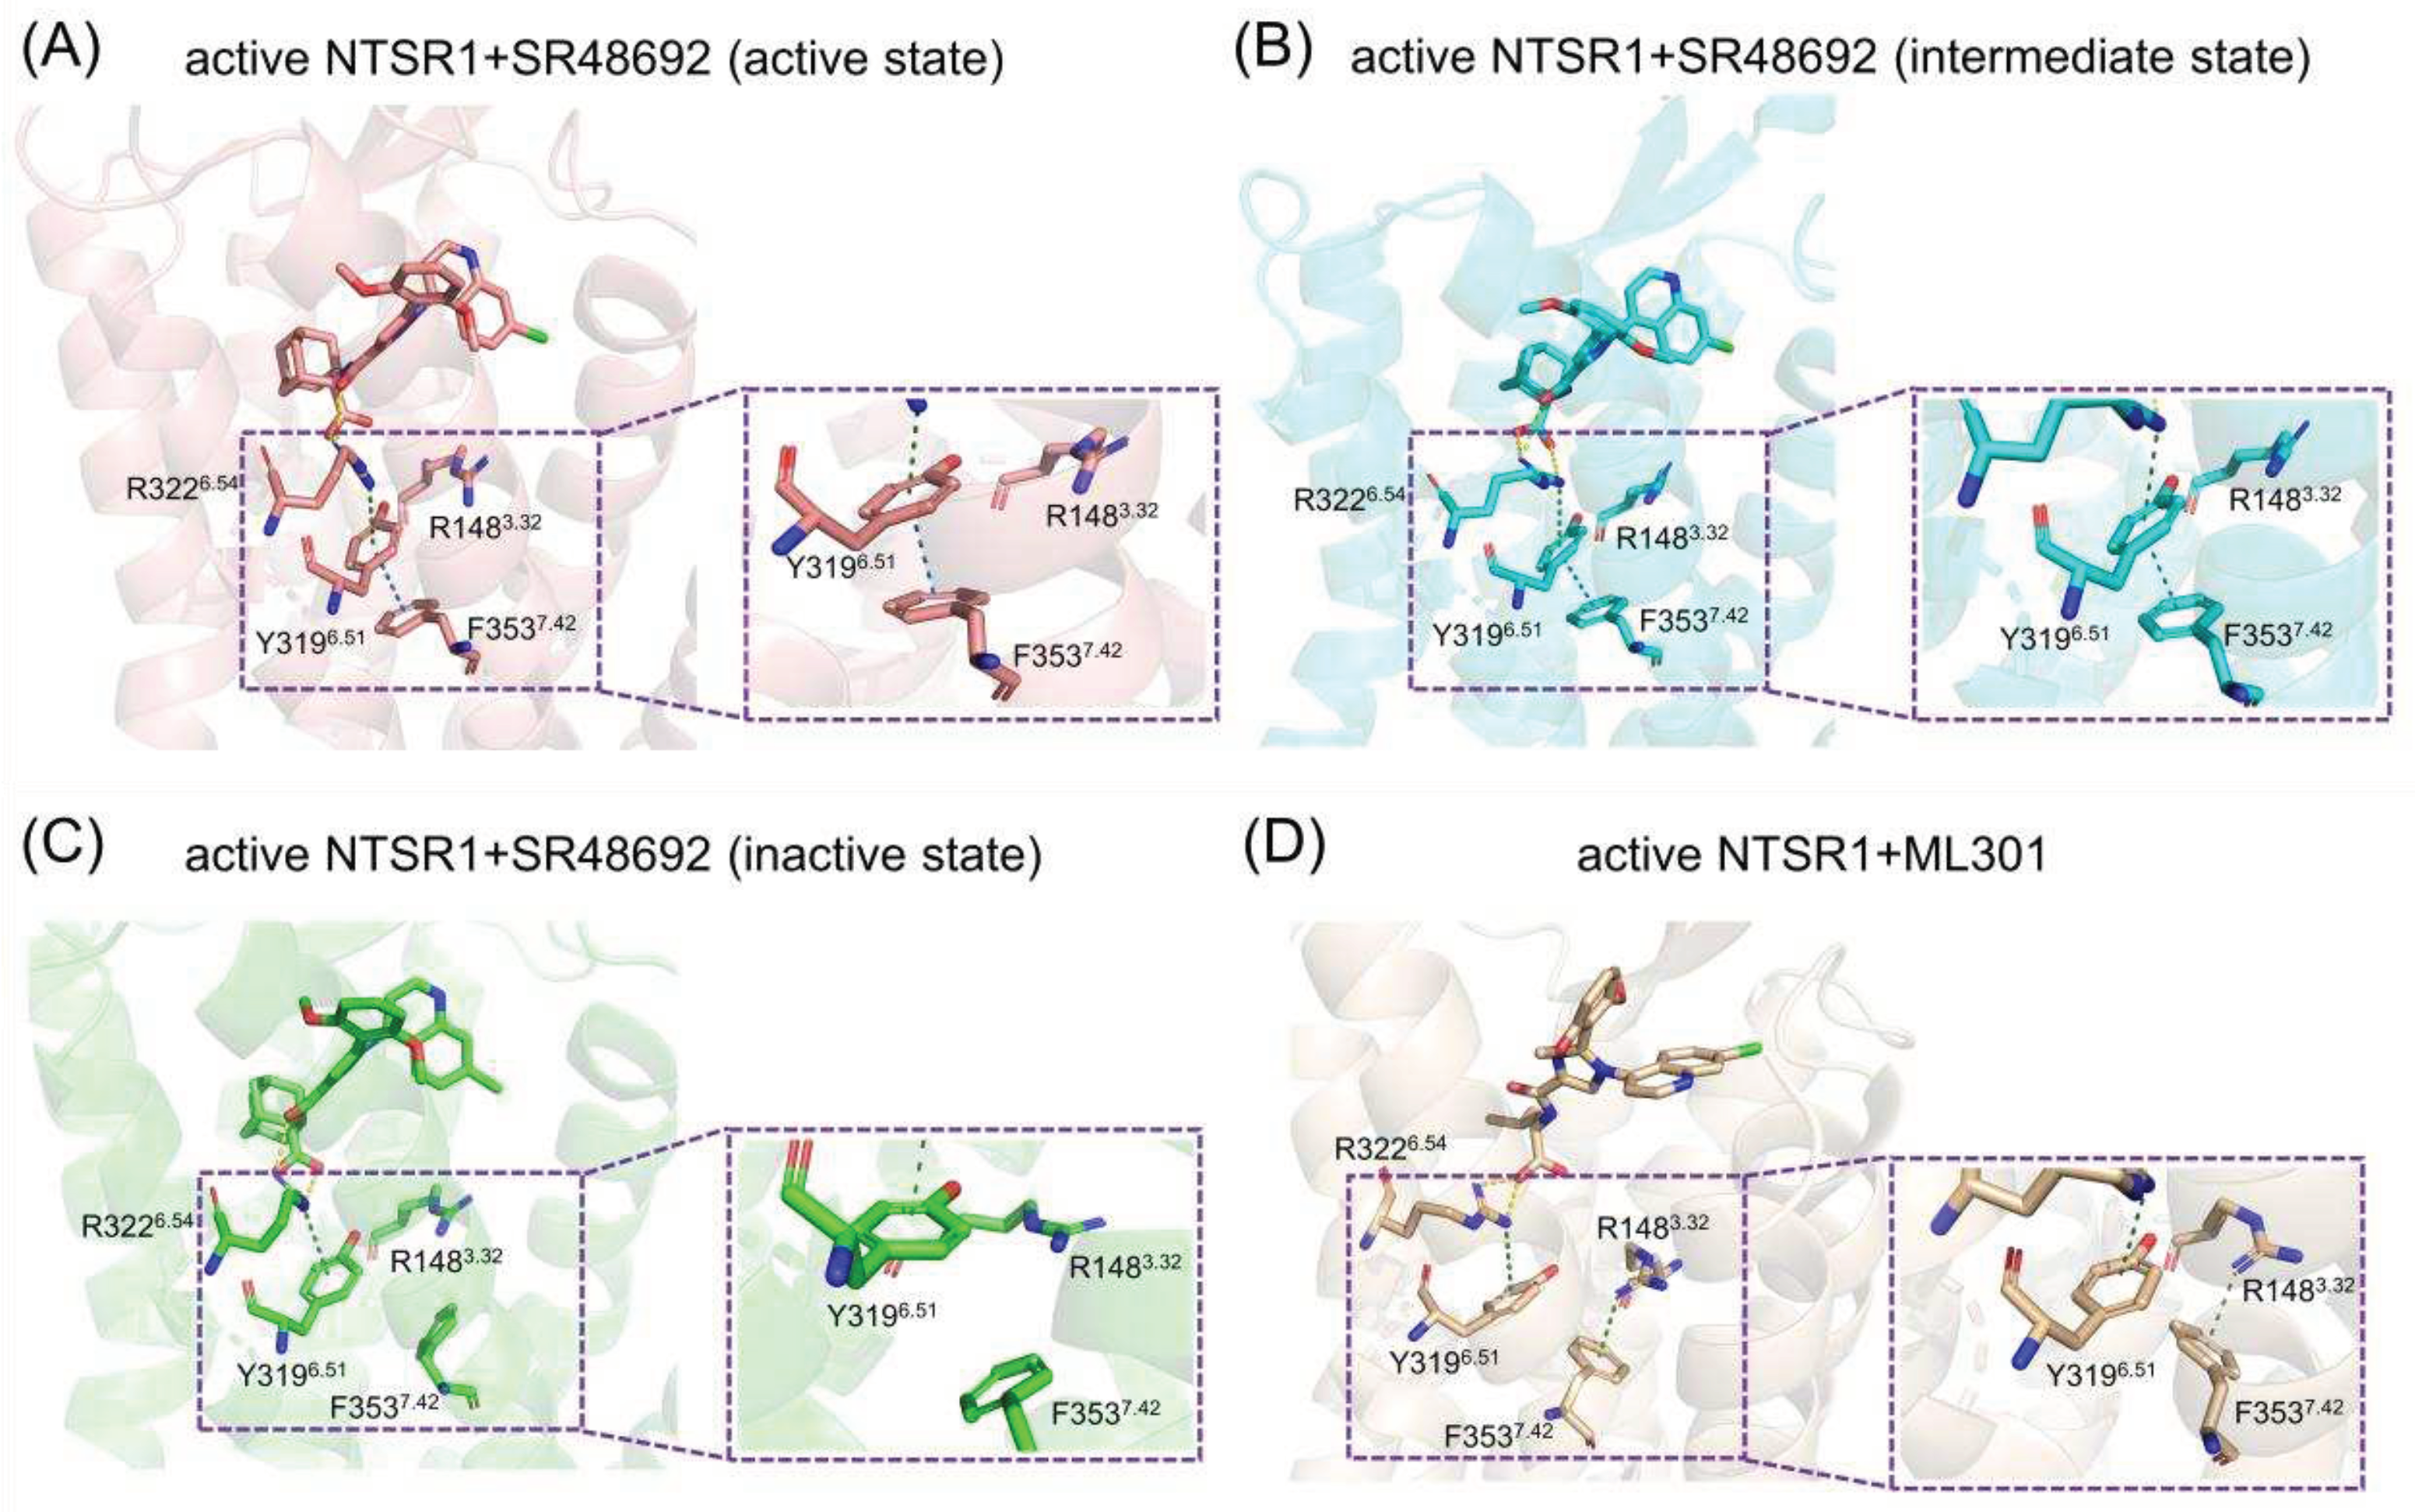
6.51 and F353
7.42, are stable, in which case the orientation of F353
7.42 hinders its interaction with R148
3.32 (
Figure 6A–C). However, the leucine moiety of agonist ML301 experiences more fluctuation (RMSF: 1.22 Å) due to its flexibility, which can interact with Y319
6.51 through the stable interaction of carboxyl group-R322
6.54-Y319
6.51. The vibration of Y319
6.51 results in the breakage of its π-π stacking with F353
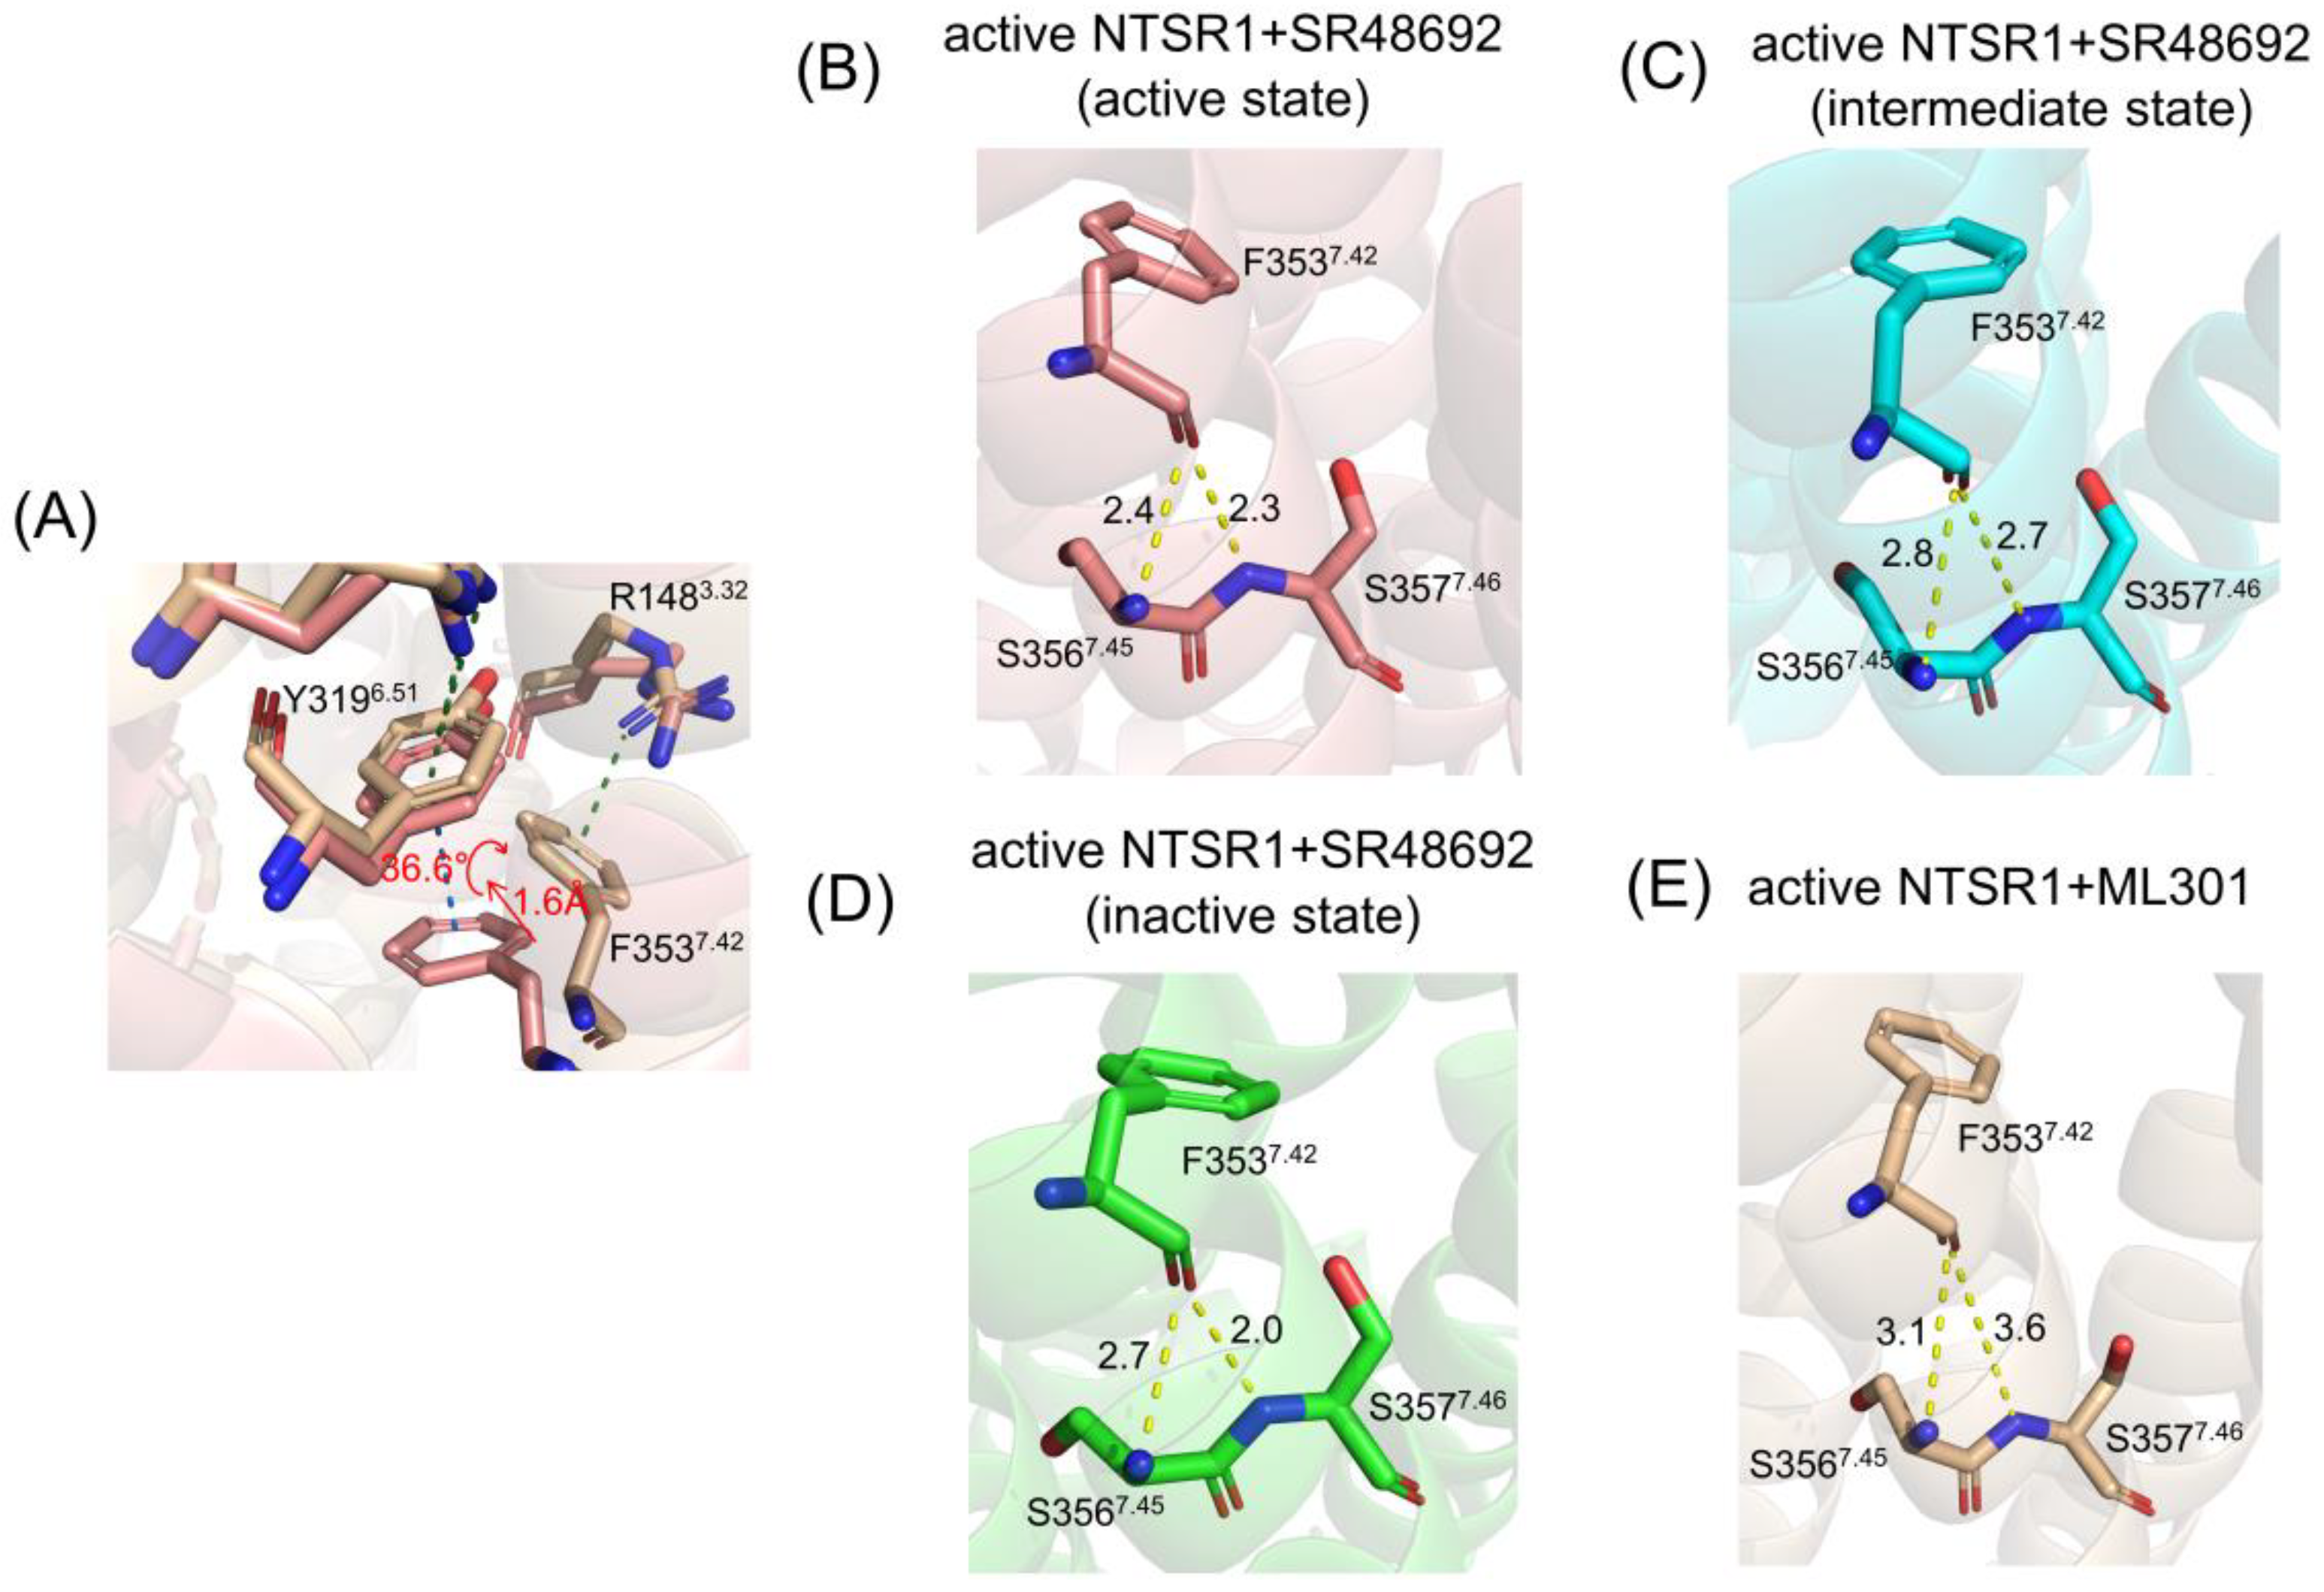
7.42 (
Figure 6D), thus driving F353
7.42 to form π-cation interaction with R148
3.32 by forwarding 1.6 Å and rotating 36.6º (
Figure 7A). Collectively, the flexibility of leucine moiety in agonist ML301 contributes to selective π-cation interaction between F353
7.42 and R148
3.32, which deciphers the first level of signal transduction.
In the second level of allosteric signaling, owing to the reorientation of F353
7.42, the hydrogen bond preference for S356
7.45/S357
7.46 is reshaped. In the active NTSR1+SR48692 system, the length of hydrogen bond between F353
7.42 and S357
7.46 is shorter than that between F353
7.42 and S356
7.45, resulting in a preference for hydrogen bond formation between F353
7.42 and S357
7.46 (
Figure 7B–D). In contrast, in the active NTSR1+ML301 system, the right rotation of the aromatic ring reacts the left rotation of oxygen atom of F353
7.42. As a result, the hydrogen bond preference experiences a transition from S357
7.46 to S356
7.45 (
Figure 7E). Whereas S356
7.45 and S357
7.46 is located at the inward and outward regions of TM7, respectively, the transition of hydrogen bond preference ultimately results in rigidity release in the outward region of TM7 and thus urges its inward displacement. The displacement of TM7, a typical feature of class A GPCR activation, has a high potential to stabilize NTSR1 active conformation, which elucidates the agonistic activity of agonist ML301. Similarly, the hydrogen bond preference between F353
7.42 and S357
7.46 resulting from the adamantane moiety of antagonist SR48692 hinders the transduction of activation signals, in which case NTSR1 adheres to the intrinsic deactivation process of class A GPCRs [
46].
3.4. Community Networks Indicate Preference for Activation Signal Transduction Originating from R1483.32
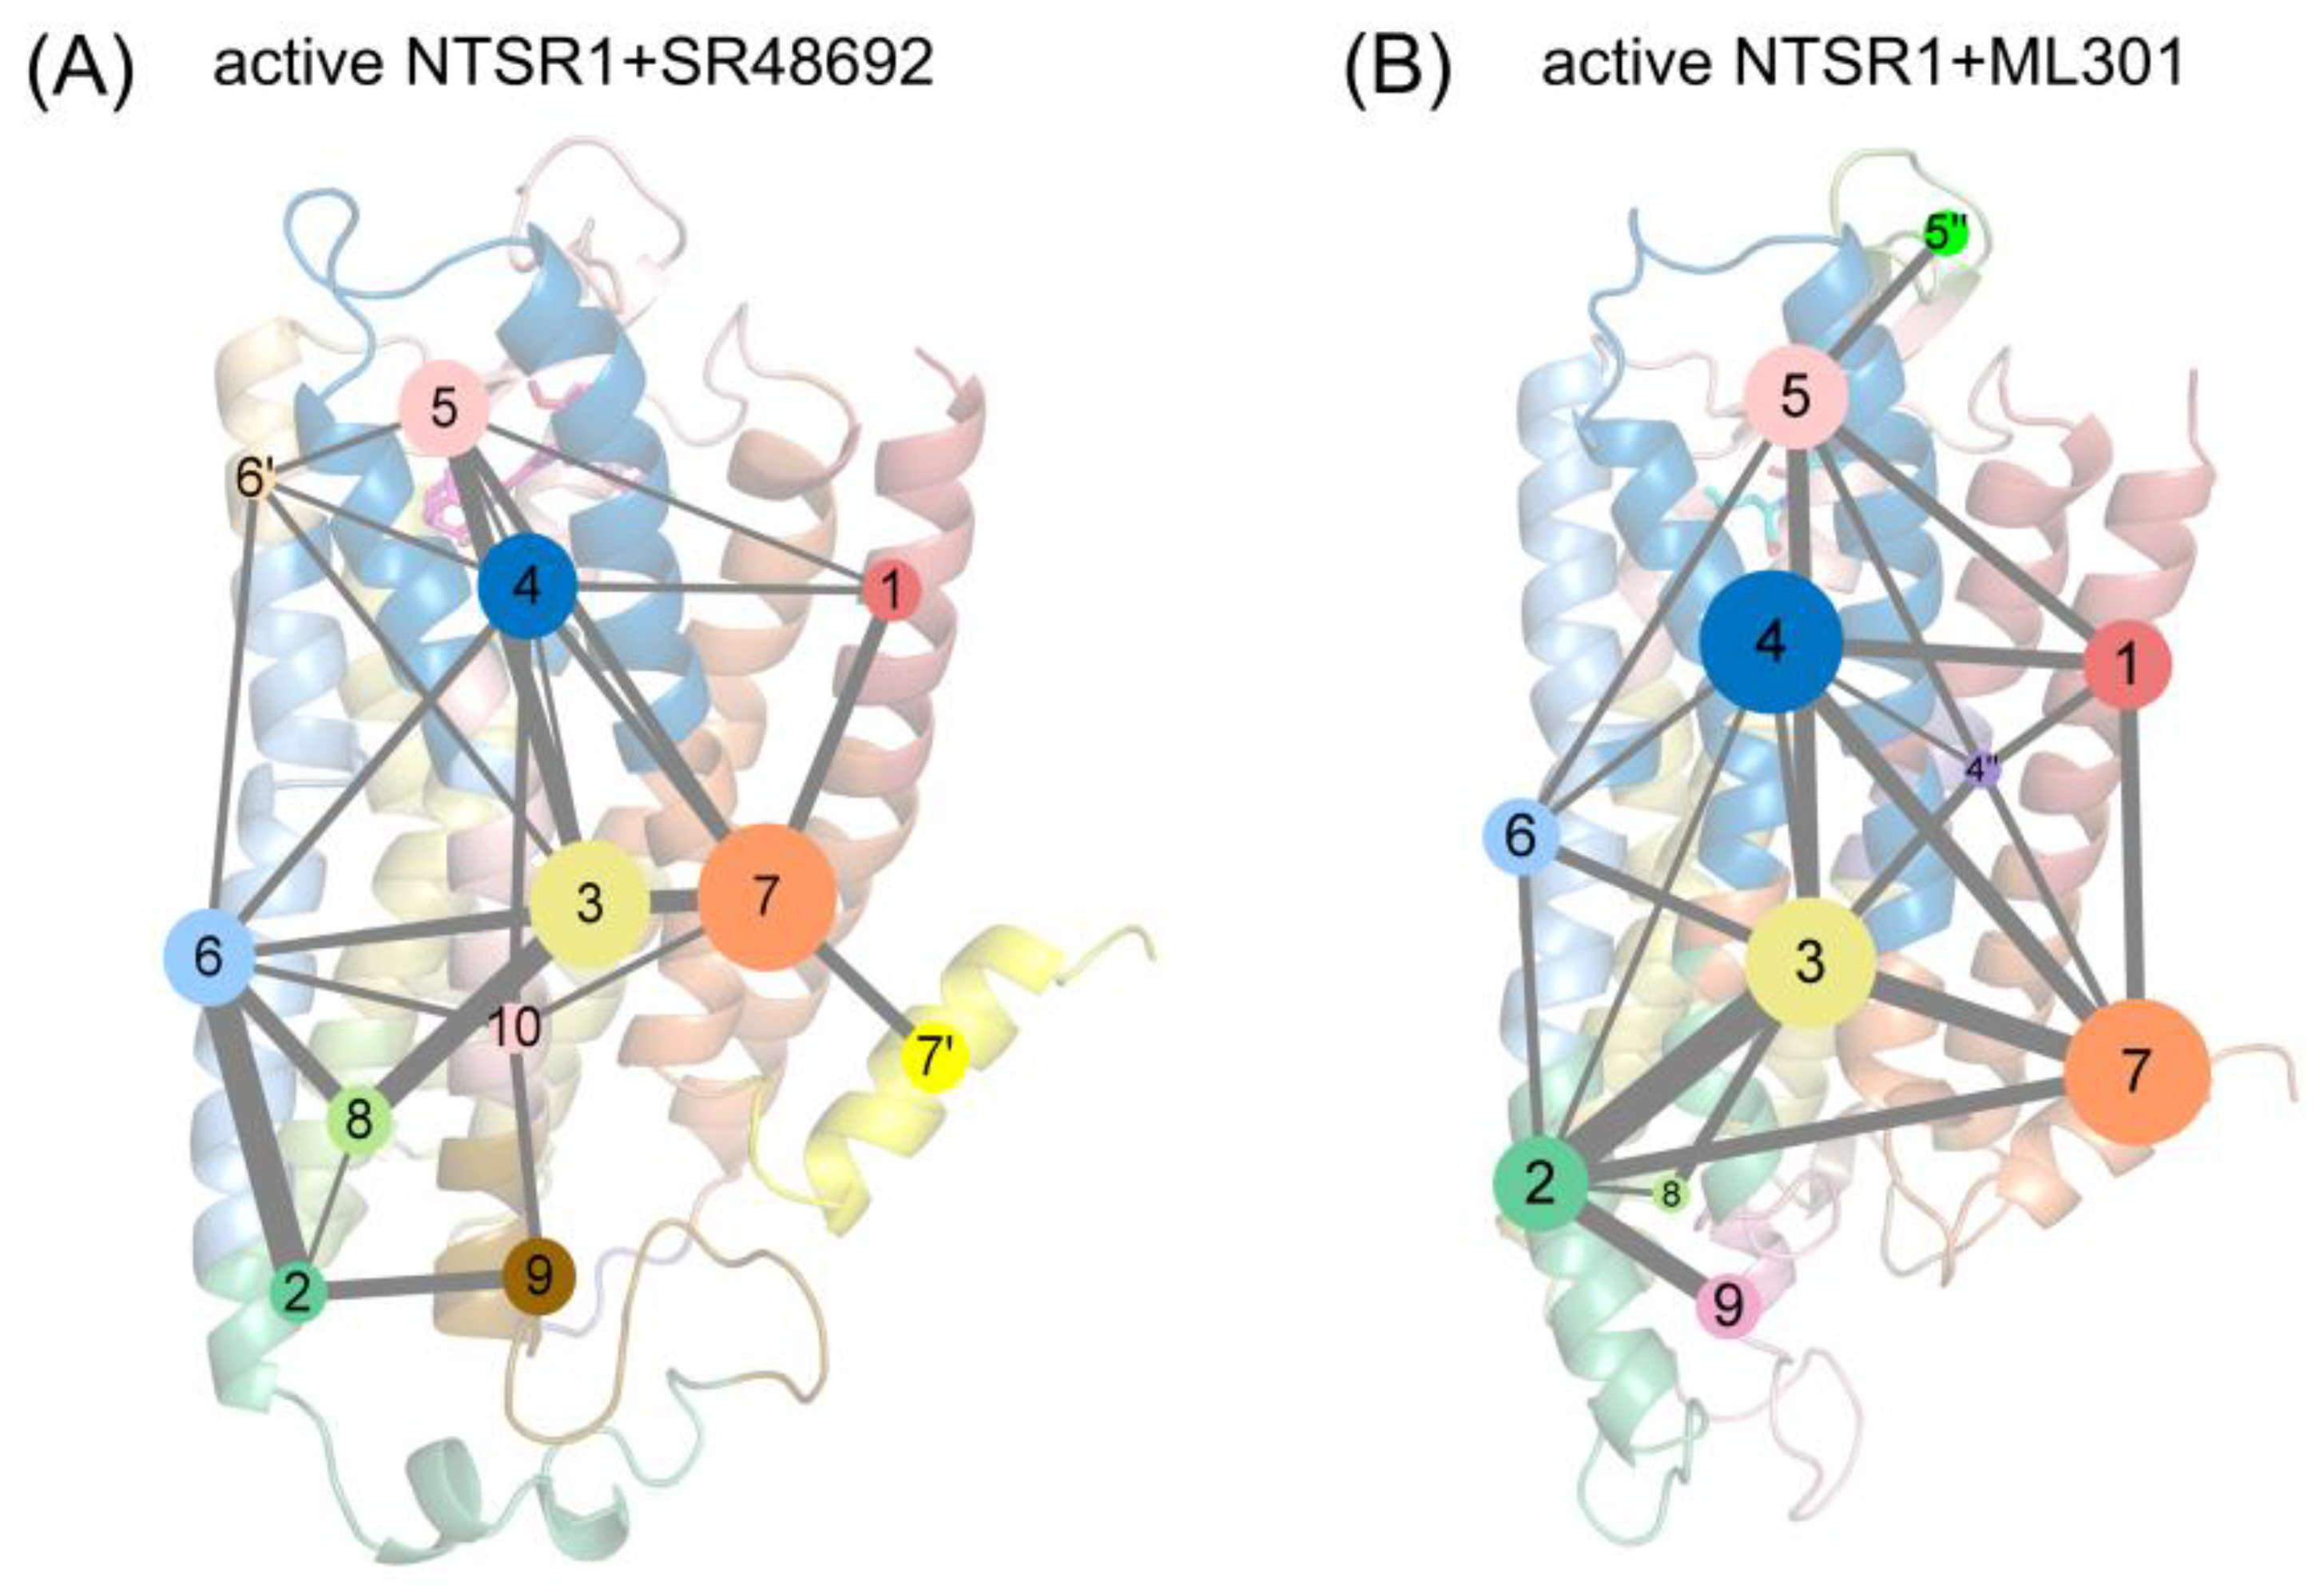
The propagation of allosteric signals within NTSR1 was further explored using community network analysis, to investigate the variational coupling among all communities. During the trajectory, residues within a cutoff distance of 4.5 Å for at least 75% of the simulation time were classified as part of the same communities, which were recognized as synergistic functional units within the overall protein. The visualized community network graphs provide clear depictions of the allosteric crosstalk paths and the corresponding intensities within NTSR1 in different systems (
Figure 8).
Distinct alterations in the topological characteristics and the intercommunity communications within NTSR1 allosteric network were observed with the binding of SR48692 and ML301. In the active NTSR1+SR48692 system, the residues that engage in the first level of signal transduction involve in Community 4, which shares relatively weak and indirect interaction with Communities 2, 7, and 9 within the position of intracellular TM5, TM6 and TM7 (
Figure 8A). It is therefore hypothesized that such weak correlation contributes to unfavorable downstream transduction of activation signals, in which case NTSR1 will exhibit a slow deactivation trend. However, in the active NTSR1+ML301 system, R148
3.32, which forms selective π-cation interaction with F353
7.42, belongs to a sub-community 4″, which forms relatively strong interaction with Communities 2 and 7 (at the position of intracellular TM5, TM6 and TM7) mediated by Community 3 (
Figure 8B). In view of this, it is implied that activation signals have more tendency to be transmitted to the intracellular TM5, TM6 and TM7.
Moreover, helix 8 of the active NTSR1+SR48692 system belongs to Community 7′ independent of Community 7, in which case gradual elimination of membrane localization of helix8, a canonical feature of class A GPCR deactivation, is more achievable (
Figure 8A). Comparatively, in the active NTSR1+ML301 system, helix8 and TM7 jointly constitute Community 7, indicating the collaborative movement of the two domains and therefore the stability of helix8 membrane localization and the active conformation (
Figure 8B).
4. Discussion
GPCRs are versatile cellular sensors for chemical stimulus, serving as promising targets for about 30% of approved drugs [
47]. The prototypical class A GPCR NTSR1 exerts dual activity both in the central nervous system and in the periphery, demonstrating brilliant therapeutic prospect. However, even with its crystallographic complex with G-proteins and β-arrestins, the activation or deactivation regulation pathway with the receptor has not been explicitly decoded, leaving blindness for drug discovery. Herein, to unravel the possible signal pathways within the receptor, we focus on a ubiquitous phenomenon, where one single moiety difference in NTSR1 modulators can evoke distinct agonistic and antagonistic downstream signaling. In order to elucidate the underpinning mechanism, we performed 12 μs GaMD simulation to broaden the conformational landscape, followed by 10.5 μs cMD simulation to capture the dynamics of activation/deactivation signal transduction and Markov state models to investigate the conformational transition timescale.
The free energy landscape revealed that antagonist and agonist induce inactive and active conformation over an extensive timescale, respectively, with representative conformations extracted from the energy basin showing canonical features of receptor activation/deactivation through the displacement of TM5, TM6 and TM7. DCCM analysis indicated that the full agonist ML301 stimulates NTSR1 internal structure to be more dynamic for activation signal propagation. Comparative RMSF data showed that extracellular TM7 may serve as the initiating region for discriminating the activation or deactivation signal. By stepwise dynamics exploration, we uncovered that flexibility of leucine indirectly accounts for selective π-cation interaction between F3537.42 and R1483.32, inducing the reorientation of F3537.42 and thus reshaping the hydrogen bond preference for S3567.45/S3577.46. It is implied that the hydrogen bond preference for S3567.45 subsequently results in outward rigidity release and inward bending of TM7, thus contributing to the stability of the active conformation. Comparatively, the rigidity of adamantane moiety in the antagonist indirectly leads to the hydrogen bond preference between F3537.42 and S3577.46, failing to block the intrinsic gradual deactivation process of class A GPCR. Such a loosely coupled allosteric network, comprising two main stages for signal transduction, links small perturbations at the extracellular ligand binding site to large conformational changes at the intracellular G-protein-binding site, explaining the cause of reverse biological effect inducing by two modulators. Furthermore, R3226.54, Y3196.51, F3537.42, R1483.32, S3567.45 and S3577.46, in which F3537.42 functions as a junction switch, may play a constructive role in NTSR1 activation. Finally, to graphically overview the signal propagation towards other regions apart from TM7, we conducted comparative community network analysis and found that the sub-community formed in the active NTSR1+ML301 network creates a favorable condition for signal transduction towards TM5, TM6 and TM7, which enhances the activation signaling to tackle the deactivation process. Taken together, our comparative MD simulations provide a mechanistic elucidation of one single moiety difference in ligands triggering inverse NTSR1 signaling.
Supplementary Materials
The following supporting information can be downloaded at the website of this paper posted on Preprints.org. Figure S1: The analogical free energy landscape of the inactive NTSR1+ML301 system (A), the inactive NTSR1+SR48692 system (B), the active NTSR1+SR48692 system (C) and the active NTSR1+ML301 system (D) in GaMD simulation (CV1: TM3-TM6 distance, CV2: NPxxY RMSD); Figure S2: The free energy landscape of the active NTSR1+SR48692 system (A) and the active NTSR1+ML301 system (B) in cMD simulation (CV1: TM3-TM6 distance, CV2: NPxxY RMSD), (C) The RMSD value of ligands in all simulations in the active NTSR1+SR48692 system and the active NTSR1+ML301 system, (D) The principal pattern of motion of the active NTSR1+SR48692 system; Figure S3: Implied timescale test for MSMs in the active NTSR1+SR48692 system (A) and the active NTSR1+ML301 system (C) at different lag times and Chapman-Kolmogorov test of metastable states for the active NTSR1+SR48692 system (B) and the active NTSR1+ML301 system (D). Table S1: Frequency of Y3196.51-F3537.42 and F3537.42-R1483.32 interaction in the representative trajectories in the active NTSR1+SR48692 system and the active NTSR1+ML301 system.
Author Contributions
Conceptualization, S.L., G.X. and Z.C.; methodology and validation, X.L., X.S., J.F., M.L. and Y.Z.; formal analysis, investigation and data curation, X.L. and X.S.; resources, S.L.; writing—original draft preparation, X.L.; writing—review and editing, S.L.; visualization, X.L. and X.S., supervision, S.L., G.X. and Z.C.; project administration, S.L.; funding acquisition, Z.C. All authors have read and agreed to the published version of the manuscript.
Funding
This research was funded by the Innovative Research Team of High-Level Local Universities in Shanghai.
Institutional Review Board Statement
Not applicable.
Informed Consent Statement
Not applicable.
Data Availability Statement
Not applicable.
Conflicts of Interest
The authors declare no conflict of interest.
References
- Venkatakrishnan, A.; Deupi, X.; Lebon, G.; Tate, C.G.; Schertler, G.F.; Babu, M.M. Molecular signatures of G-protein-coupled receptors. Nature 2013, 494, 185–194. [Google Scholar] [CrossRef] [PubMed]
- Flock, T.; Ravarani, C.N.; Sun, D.; Venkatakrishnan, A.J.; Kayikci, M.; Tate, C.G.; Veprintsev, D.B.; Babu, M.M. Universal allosteric mechanism for Gα activation by GPCRs. Nature 2015, 524, 173–179. [Google Scholar] [CrossRef] [PubMed]
- Wu, Z.; Martinez-Fong, D.; Trédaniel, J.; Forgez, P. Neurotensin and its high affinity receptor 1 as a potential pharmacological target in cancer therapy. Front. Endocrinol. 2013, 3, 184. [Google Scholar] [CrossRef] [PubMed]
- Gully, D.; Labeeuw, B.; Boigegrain, R.; Oury-Donat, F.; Bachy, A.; Poncelet, M.; Steinberg, R.; Suaud-Chagny, M.F.; Santucci, V.; Vita, N. Biochemical and pharmacological activities of SR 142948A, a new potent neurotensin receptor antagonist. J. Pharmacol. Exp. Ther. 1997, 280, 802–812. [Google Scholar]
- Fan, Y.; Lai, M.H.; Sullivan, K.; Popiolek, M.; Andree, T.H.; Dollings, P.; Pausch, M.H. The identification of neurotensin NTS1 receptor partial agonists through a ligand-based virtual screening approach. Bioorganic Med. Chem. Lett. 2008, 18, 5789–5791. [Google Scholar] [CrossRef]
- Thomas, J.B.; Navarro, H.; Warner, K.R.; Gilmour, B. The identification of nonpeptide neurotensin receptor partial agonists from the potent antagonist SR48692 using a calcium mobilization assay. Bioorganic Med. Chem. Lett. 2009, 19, 1438–1441. [Google Scholar] [CrossRef]
- Peddibhotla, S.; Hedrick, M.P.; Hershberger, P.; Maloney, P.R.; Li, Y.; Milewski, M.; Gosalia, P.; Gray, W.; Mehta, A.; Sugarman, E. Discovery of ML314, a brain penetrant nonpeptidic β-arrestin biased agonist of the neurotensin NTR1 receptor. ACS Med. Chem. Lett. 2013, 4, 846–851. [Google Scholar] [CrossRef]
- Hershberger, P.M.; Hedrick, M.P.; Peddibhotla, S.; Mangravita-Novo, A.; Gosalia, P.; Li, Y.; Gray, W.; Vicchiarelli, M.; Smith, L.H.; Chung, T.D. Imidazole-derived agonists for the neurotensin 1 receptor. Bioorganic Med. Chem. Lett. 2014, 24, 262–267. [Google Scholar] [CrossRef]
- Slosky, L.M.; Bai, Y.; Toth, K.; Ray, C.; Rochelle, L.K.; Badea, A.; Chandrasekhar, R.; Pogorelov, V.M.; Abraham, D.M.; Atluri, N. β-arrestin-biased allosteric modulator of NTSR1 selectively attenuates addictive behaviors. Cell 2020, 181, 1364–1379. [Google Scholar] [CrossRef]
- Di Fruscia, P.; He, Y.; Koenig, M.; Tabrizifard, S.; Nieto, A.; McDonald, P.H.; Kamenecka, T.M. The discovery of indole full agonists of the neurotensin receptor 1 (NTSR1). Bioorganic & medicinal chemistry letters 2014, 24, 3974–3978. [Google Scholar] [CrossRef]
- Robertson, M.J.; Papasergi-Scott, M.M.; He, F.; Seven, A.B.; Meyerowitz, J.G.; Panova, O.; Peroto, M.C.; Che, T.; Skiniotis, G. Structure determination of inactive-state GPCRs with a universal nanobody. Nature Structural & Molecular Biology 2022, 1–8. [Google Scholar] [CrossRef]
- Yin, W.; Li, Z.; Jin, M.; Yin, Y.-L.; De Waal, P.W.; Pal, K.; Yin, Y.; Gao, X.; He, Y.; Gao, J. A complex structure of arrestin-2 bound to a G protein-coupled receptor. Cell Res. 2019, 29, 971–983. [Google Scholar] [CrossRef]
- Kato, H.E.; Zhang, Y.; Hu, H.; Suomivuori, C.-M.; Kadji, F.M.N.; Aoki, J.; Krishna Kumar, K.; Fonseca, R.; Hilger, D.; Huang, W. Conformational transitions of a neurotensin receptor 1–Gi1 complex. Nature 2019, 572, 80–85. [Google Scholar] [CrossRef]
- Huang, W.; Masureel, M.; Qu, Q.; Janetzko, J.; Inoue, A.; Kato, H.E.; Robertson, M.J.; Nguyen, K.C.; Glenn, J.S.; Skiniotis, G. Structure of the neurotensin receptor 1 in complex with β-arrestin 1. Nature 2020, 579, 303–308. [Google Scholar] [CrossRef] [PubMed]
- Deluigi, M.; Klipp, A.; Klenk, C.; Merklinger, L.; Eberle, S.A.; Morstein, L.; Heine, P.; Mittl, P.R.; Ernst, P.; Kamenecka, T.M. Complexes of the neurotensin receptor 1 with small-molecule ligands reveal structural determinants of full, partial, and inverse agonism. Science Advances 2021, 7, eabe5504. [Google Scholar] [CrossRef]
- Hansson, T.; Oostenbrink, C.; van Gunsteren, W. Molecular dynamics simulations. Curr. Opin. Struct. Biol. 2002, 12, 190–196. [Google Scholar] [CrossRef]
- Klepeis, J.L.; Lindorff-Larsen, K.; Dror, R.O.; Shaw, D.E. Long-timescale molecular dynamics simulations of protein structure and function. Curr. Opin. Struct. Biol. 2009, 19, 120–127. [Google Scholar] [CrossRef]
- Byun, J.A.; VanSchouwen, B.; Akimoto, M.; Melacini, G. Allosteric inhibition explained through conformational ensembles sampling distinct “mixed” states. Comput. Struct. Biotechnol. J. 2020, 18, 3803–3818. [Google Scholar] [CrossRef]
- Wang, Y.; Li, M.; Liang, W.; Shi, X.; Fan, J.; Kong, R.; Liu, Y.; Zhang, J.; Chen, T.; Lu, S. Delineating the activation mechanism and conformational landscape of a class BG protein-coupled receptor glucagon receptor. Comput. Struct. Biotechnol. J. 2022, 20, 628–639. [Google Scholar] [CrossRef] [PubMed]
- Zhang, H.; Chu, G.; Wang, G.; Yao, M.; Lu, S.; Chen, T. Mechanistic Understanding of the Palmitoylation of Go Protein in the Allosteric Regulation of Adhesion Receptor GPR97. Pharmaceutics 2022, 14, 1856. [Google Scholar] [CrossRef] [PubMed]
- Marasco, M.; Kirkpatrick, J.; Nanna, V.; Sikorska, J.; Carlomagno, T. Phosphotyrosine couples peptide binding and SHP2 activation via a dynamic allosteric network. Comput. Struct. Biotechnol. J. 2021, 19, 2398–2415. [Google Scholar] [CrossRef]
- Lu, S.; Chen, Y.; Wei, J.; Zhao, M.; Ni, D.; He, X.; Zhang, J. Mechanism of allosteric activation of SIRT6 revealed by the action of rationally designed activators. Acta Pharm. Sin. B 2021, 11, 1355–1361. [Google Scholar] [CrossRef] [PubMed]
- Qiu, Y.; Yin, X.; Li, X.; Wang, Y.; Fu, Q.; Huang, R.; Lu, S. Untangling dual-targeting therapeutic mechanism of epidermal growth factor receptor (EGFR) based on reversed allosteric communication. Pharmaceutics 2021, 13, 747. [Google Scholar] [CrossRef] [PubMed]
- Lu, S.; Qiu, Y.; Ni, D.; He, X.; Pu, J.; Zhang, J. Emergence of allosteric drug-resistance mutations: New challenges for allosteric drug discovery. Drug Discov. Today 2020, 25, 177–184. [Google Scholar] [CrossRef]
- Ni, D.; Li, X.; He, X.; Zhang, H.; Zhang, J.; Lu, S. Drugging K-RasG12C through covalent inhibitors: Mission possible? Pharmacology & therapeutics 2019, 202, 1–17. [Google Scholar] [CrossRef]
- Wang, J.; Arantes, P.R.; Bhattarai, A.; Hsu, R.V.; Pawnikar, S.; Huang, Y.m.M.; Palermo, G.; Miao, Y. Gaussian accelerated molecular dynamics: Principles and applications. Wiley Interdiscip. Rev. : Comput. Mol. Sci. 2021, 11, e1521. [Google Scholar] [CrossRef]
- Miao, Y.; McCammon, J.A. Graded activation and free energy landscapes of a muscarinic G-protein–coupled receptor. Proc. Natl. Acad. Sci. 2016, 113, 12162–12167. [Google Scholar] [CrossRef] [PubMed]
- Miao, Y.; McCammon, J.A. Mechanism of the G-protein mimetic nanobody binding to a muscarinic G-protein-coupled receptor. Proc. Natl. Acad. Sci. 2018, 115, 3036–3041. [Google Scholar] [CrossRef]
- Waterhouse, A.; Bertoni, M.; Bienert, S.; Studer, G.; Tauriello, G.; Gumienny, R.; Heer, F.T.; de Beer, T.A.P.; Rempfer, C.; Bordoli, L. SWISS-MODEL: Homology modelling of protein structures and complexes. Nucleic Acids Res. 2018, 46, W296–W303. [Google Scholar] [CrossRef]
- Lomize, M.A.; Lomize, A.L.; Pogozheva, I.D.; Mosberg, H.I. OPM: Orientations of proteins in membranes database. Bioinformatics 2006, 22, 623–625. [Google Scholar] [CrossRef]
- Lee, J.; Cheng, X.; Swails, J.M.; Yeom, M.S.; Eastman, P.K.; Lemkul, J.A.; Wei, S.; Buckner, J.; Jeong, J.C.; Qi, Y. CHARMM-GUI input generator for NAMD, GROMACS, AMBER, OpenMM, and CHARMM/OpenMM simulations using the CHARMM36 additive force field. J. Chem. Theory Comput. 2016, 12, 405–413. [Google Scholar] [CrossRef]
- Lu, S.; He, X.; Yang, Z.; Chai, Z.; Zhou, S.; Wang, J.; Rehman, A.U.; Ni, D.; Pu, J.; Sun, J. Activation pathway of a G protein-coupled receptor uncovers conformational intermediates as targets for allosteric drug design. Nat. Commun. 2021, 12, 4721. [Google Scholar] [CrossRef] [PubMed]
- Dickson, C.J.; Madej, B.D.; Skjevik, Å.A.; Betz, R.M.; Teigen, K.; Gould, I.R.; Walker, R.C. Lipid14: The amber lipid force field. J. Chem. Theory Comput. 2014, 10, 865–879. [Google Scholar] [CrossRef]
- Maier, J.A.; Martinez, C.; Kasavajhala, K.; Wickstrom, L.; Hauser, K.E.; Simmerling, C. ff14SB: Improving the accuracy of protein side chain and backbone parameters from ff99SB. Journal of chemical theory and computation 2015, 11, 3696–3713. [Google Scholar] [CrossRef]
- Wang, J.; Wolf, R.M.; Caldwell, J.W.; Kollman, P.A.; Case, D.A. Development and testing of a general amber force field. J. Comput. Chem. 2004, 25, 1157–1174. [Google Scholar] [CrossRef] [PubMed]
- Jorgensen, W.L.; Chandrasekhar, J.; Madura, J.D.; Impey, R.W.; Klein, M.L. Comparison of simple potential functions for simulating liquid water. J. Chem. Phys. 1983, 79, 926–935. [Google Scholar] [CrossRef]
- Darden, T.; York, D.; Pedersen, L. Particle mesh Ewald: An N⋅ log (N) method for Ewald sums in large systems. J. Chem. Phys. 1993, 98, 10089–10092. [Google Scholar] [CrossRef]
- Ryckaert, J.-P.; Ciccotti, G.; Berendsen, H.J. Numerical integration of the cartesian equations of motion of a system with constraints: Molecular dynamics of n-alkanes. Journal of computational physics 1977, 23, 327–341. [Google Scholar] [CrossRef]
- Roe, D.R.; Cheatham III, T.E. PTRAJ and CPPTRAJ: Software for processing and analysis of molecular dynamics trajectory data. J. Chem. Theory Comput. 2013, 9, 3084–3095. [Google Scholar] [CrossRef]
- Amadei, A.; Linssen, A.B.; Berendsen, H.J. Essential dynamics of proteins. Proteins: Structure, Function, and Bioinformatics 1993, 17, 412–425. [Google Scholar] [CrossRef]
- Zhou, R.; Berne, B.J.; Germain, R. The free energy landscape for β hairpin folding in explicit water. Proc. Natl. Acad. Sci. 2001, 98, 14931–14936. [Google Scholar] [CrossRef]
- Newman, M.E. Modularity and community structure in networks. Proc. Natl. Acad. Sci. 2006, 103, 8577–8582. [Google Scholar] [CrossRef] [PubMed]
- Sethi, A.; Eargle, J.; Black, A.A.; Luthey-Schulten, Z. Dynamical networks in tRNA: Protein complexes. Proc. Natl. Acad. Sci. 2009, 106, 6620–6625. [Google Scholar] [CrossRef]
- Scherer, M.K.; Trendelkamp-Schroer, B.; Paul, F.; Pérez-Hernández, G.; Hoffmann, M.; Plattner, N.; Wehmeyer, C.; Prinz, J.-H.; Noé, F. PyEMMA 2: A software package for estimation, validation, and analysis of Markov models. J. Chem. Theory Comput. 2015, 11, 5525–5542. [Google Scholar] [CrossRef] [PubMed]
- Chandel, T.I.; Zaman, M.; Khan, M.V.; Ali, M.; Rabbani, G.; Ishtikhar, M.; Khan, R.H. A mechanistic insight into protein-ligand interaction, folding, misfolding, aggregation and inhibition of protein aggregates: An overview. Int. J. Biol. Macromol. 2018, 106, 1115–1129. [Google Scholar] [CrossRef]
- Dror, R.O.; Arlow, D.H.; Maragakis, P.; Mildorf, T.J.; Pan, A.C.; Xu, H.; Borhani, D.W.; Shaw, D.E. Activation mechanism of the β 2-adrenergic receptor. Proc. Natl. Acad. Sci. 2011, 108, 18684–18689. [Google Scholar] [CrossRef] [PubMed]
- Hauser, A.S.; Attwood, M.M.; Rask-Andersen, M.; Schiöth, H.B.; Gloriam, D.E. Trends in GPCR drug discovery: New agents, targets and indications. Nat. Rev. Drug Discov. 2017, 16, 829–842. [Google Scholar] [CrossRef]
Figure 1.
Graphic abstract of one ‘driver chemical group’ triggering inverse downstream signaling. (A) The abridged general view of NTSR1 antagonist SR48692 and full agonist ML301 inducing activation/deactivation signal transduction via the switch function of F3537.42. (B) The structure and biological activity of SR48692 and ML301.
Figure 2.
The free energy landscapes of the inactive NTSR1+SR48692 system (A), the inactive NTSR1+ML301 system (B), the active NTSR1+SR48692 system (C) and the active NTSR1+ML301 system (D) are shown by simulation trajectory projection. Collective variable 1 (CV1): TM5-TM7 distance, CV2: TM2-TM6 distance. Color scale on the right is evaluated through density. The red stars denote the positions of representative structures extracted using K-means clustering.
Figure 3.
The free energy landscapes of the active NTSR1+SR48692 system (A) and the active NTSR1+ML301 system (C) in cMD simulation. The unit of free energy values is kcal/mol. Color scale on the right is evaluated through free energy. (B) The representative conformations of the active NTSR1+SR48692 system in cMD simulation. Active state, tangerine; intermediate state, cyan; inactive state, green. (D) The transition timescale among representative conformations of the active NTSR1+SR48692 system, represented by the mean first passage time.
Figure 4.
The dynamic cross-correlation matrix analysis of the active NTSR1+SR48692 system (active state) (A), the active NTSR1+SR48692 system (intermediate state) (B), the active NTSR1+SR48692 system (inactive state) (C), and the active NTSR1+ML301 system (D). Color scales are shown on the right. The interactions whose absolute correlation coefficients are less than 0.3 are colored white for clarity. (E) The RMSF analysis of the active NTSR1+SR48692 system (pink curve) and the active NTSR1+ML301 system (blue curve).
Figure 5.
The specific interactions within the active NTSR1+SR48692 system (A) and the active NTSR1+ML301 system (B) revealed by proportional chord diagram. The chords connecting two residues denote specific interactions that occupies over 50% of the simulation time.
Figure 5.
The specific interactions within the active NTSR1+SR48692 system (A) and the active NTSR1+ML301 system (B) revealed by proportional chord diagram. The chords connecting two residues denote specific interactions that occupies over 50% of the simulation time.
Figure 6.
The interaction analysis of the active NTSR1+SR48692 system (active state) (A), the active NTSR1+SR48692 system (intermediate state) (B), the active NTSR1+SR48692 system (inactive state) (C) and the active NTSR1+ML301 system (D). Y3196.51-F3537.42-R1483.32 interactions are zoomed for clarity.
Figure 7.
(A) The residue superimposed analysis of the active NTSR1+SR48692 system (active state) (tangerine) and the active NTSR1+ML301 system (wheat). The preference for hydrogen bonds among F3537.42-S3567.45/S3577.46 in the active NTSR1+SR48692 system (active state) (B), the active NTSR1+SR48692 system (intermediate state) (C), the active NTSR1+SR48692 system (inactive state) (D), and the active NTSR1+ML301 system (E).
Figure 8.
The community network analysis of the active NTSR1+SR48692 system (A) and the active NTSR1+ML301 system (B). Each sphere represents a corresponding community whose number of residue components is indicated with the sphere area. While the sticks connecting different spheres visualize the inter-community connections, and the thickness of these sticks is proportional to the value of edge connectivity.
|
Disclaimer/Publisher’s Note: The statements, opinions and data contained in all publications are solely those of the individual author(s) and contributor(s) and not of MDPI and/or the editor(s). MDPI and/or the editor(s) disclaim responsibility for any injury to people or property resulting from any ideas, methods, instructions or products referred to in the content. |
© 2023 by the authors. Licensee MDPI, Basel, Switzerland. This article is an open access article distributed under the terms and conditions of the Creative Commons Attribution (CC BY) license (http://creativecommons.org/licenses/by/4.0/).
