1. Introduction
Mixed gases of various compositions are used in the semiconductor and display industries, and CO
2, CF
4, SF
6, and N
2O are mainly emitted as waste gases. Perfluorocarbons (PFCs) such as CF
4, SF
6, CHF
3, and C
3F
8 are widely used in etching, deposition, and cleaning processes in semiconductor and display industries.[
1,
2,
3] PFCs have a great impact on global warming because their global warming potential (GWP) and lifetime are very high compared to CO
2 and CH
4.
Table 1 shows the GWP and lifetime of greenhouse gases. PFCs were designated as one of the six major greenhouse gases in the 1997 Kyoto Protocol and regulated internationally for their emissions. [
4,
5] Emissions of PFCs are increasing with the growth of the semiconductor and display industries. As international interest in carbon reduction increases, reduction of PFCs is necessary.[
6,
7]
As a way to reduce PFCs emissions, process optimization, recycling/recovery, and reduction technologies are proposed. Among gases with low GWP, there is no gas that can replace PFC, and it takes a long time to develop alternative gases. In addition, semiconductor and display manufacturing processes are complex, making it difficult to optimize processes for reduction or implement recycling and recovery facilities.[
8,
9,
10,
11] Scrubbers used in the semiconductor and display industries were initially developed to remove air pollutants. As interest in greenhouse gas emissions increased, scrubbers were developed and improved to handle greenhouse gases as well.[
12]
There are various types of scrubbers such as burn, heat, and plasma, and the treatment efficiency is high in the order of heat, burn, and plasma.[
13] In order to increase PFCs treatment, wet treatment facilities are combined at the rear of the reduction device to be used as burn-wet, plasma-wet, etc.[
14] In industrial sites, burn-wet scrubbers are mainly used. Research on the plasma-wet type, which has higher PFCs destruction removal efficiency (DRE) than the burn-wet type, is being actively conducted, and its utilization in the field is increasing accordingly. Plasma scrubber research was mainly conducted by improving the plasma torch[
15] and improving the wet processing structure.[
16] However, the DRE of PFCs was mainly measured and only the type of by-product gas of each PFCs was confirmed, but no study was conducted on the amount of by-product gas generated by each PFC.
In this study, the DRE and by-product gas generation rate of the Plasma-wet scrubber, which is increasingly used in the field, was measured. Plasma-wet scrubbers were divided into etch type and water film type, and the DRE and by-product gas generation rates for the two scrubber types were measured and compared.
Table 1.
Global warming potential and Lifetime of greenhouse gases(AR6)[
17].
Table 1.
Global warming potential and Lifetime of greenhouse gases(AR6)[
17].
| Greenhouse gases |
Lifetime (year) |
GWP100
|
| CO2
|
50‒200 |
1 |
| CH4
|
12 |
27 |
| CF4
|
50 000 |
7 380 |
| SF6
|
3 200 |
24 300 |
| C2F6
|
10 000 |
12 400 |
| CHF3
|
222 |
14 600 |
| C3F8
|
2 600 |
9 290 |
| C4F8
|
3 200 |
10 200 |
| NF3
|
500 |
17 400 |
2. Materials and Methods
2.1. Composition of Plasma-Wet Scrubber
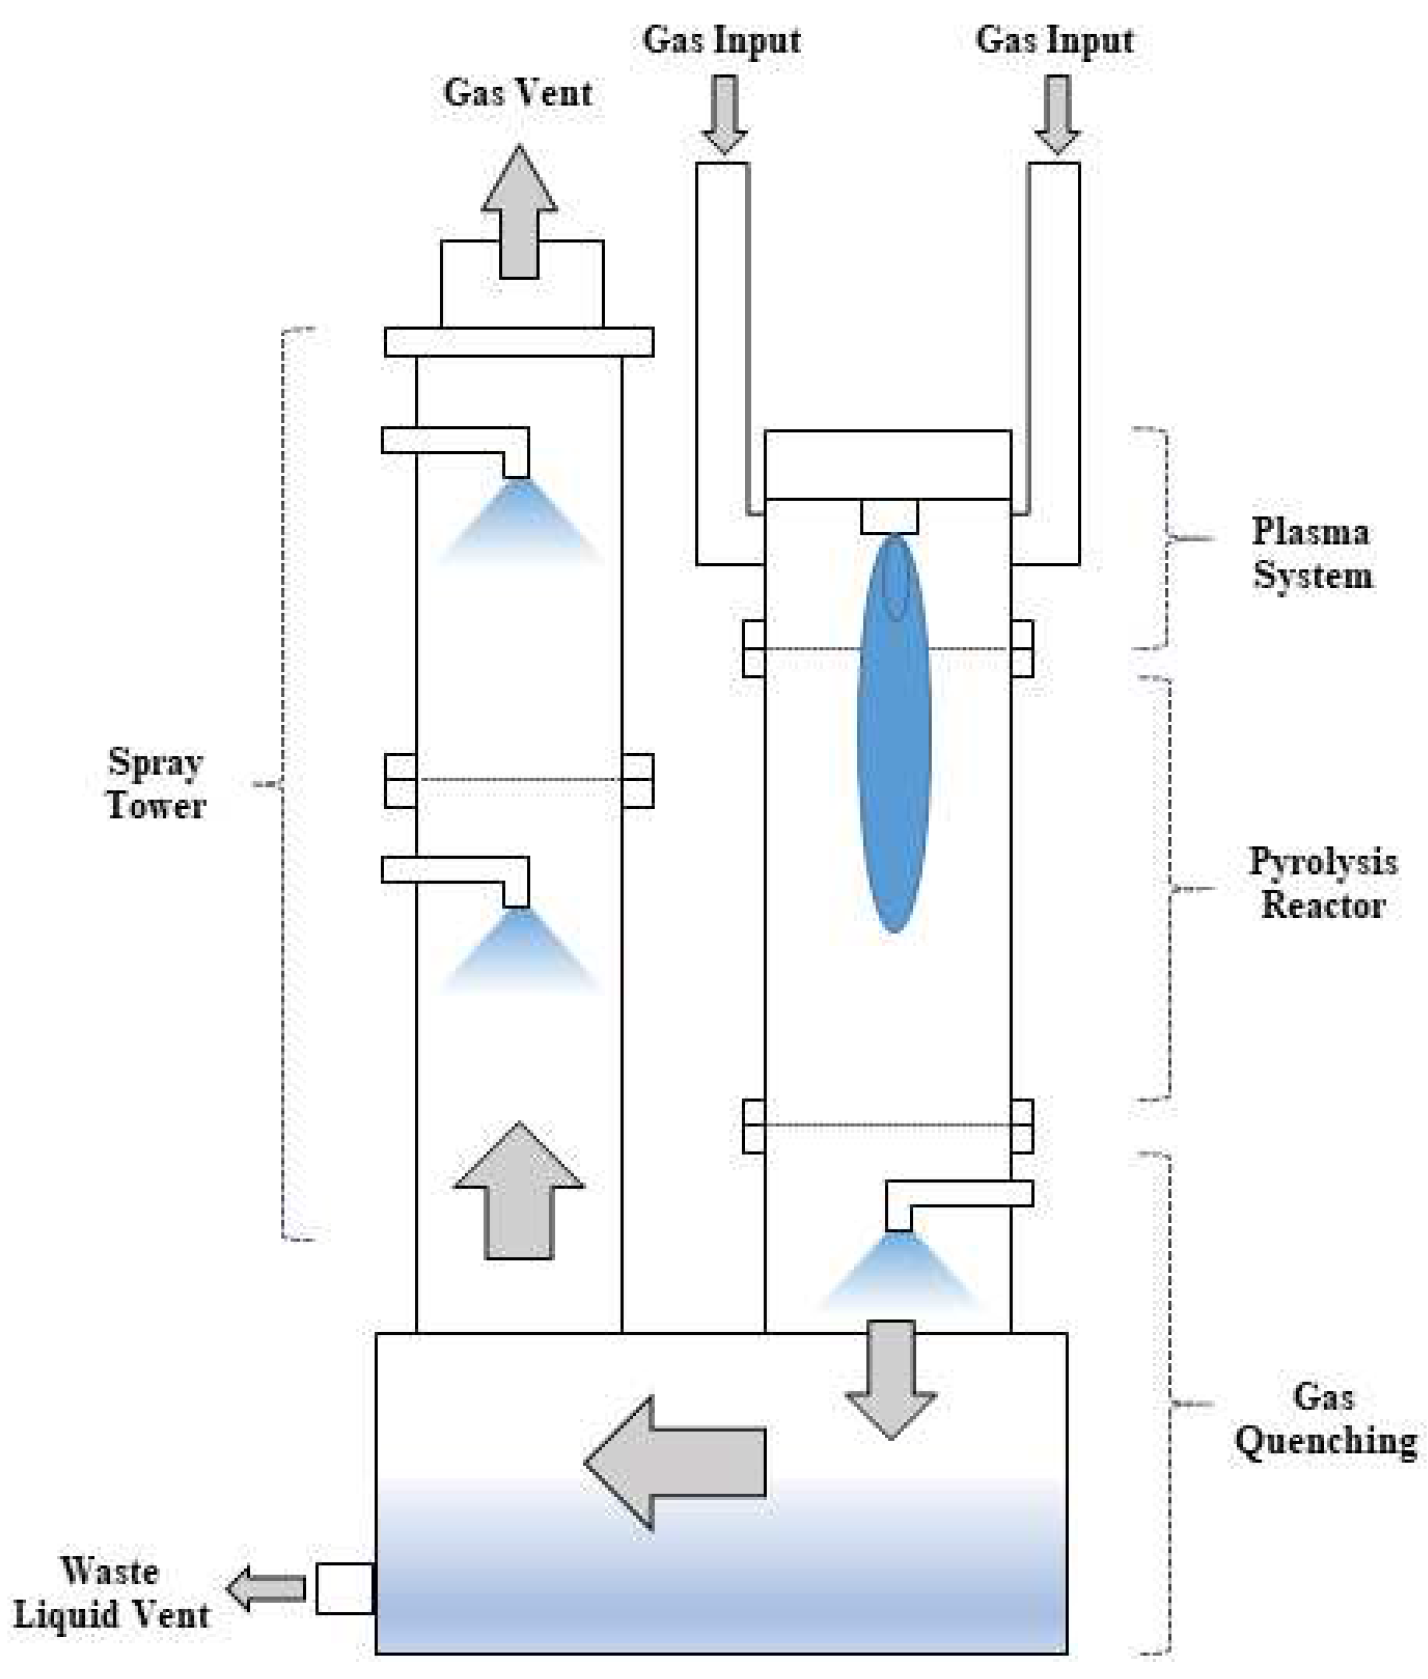
Figure 1 shows the configuration of Plasma-wet scrubber. Plasma-wet scrubber is composed of inlet part, plasma system, pyrolysis reactor, gas quenching part and wastewater circulation tank, wet spray tower, and outlet part. When waste gas such as PFCs enters the inlet part, it comes into contact with the arc plasma generated by the plasma system and rises up in the pyrolysis reactor to decompose. The high-temperature gas is cooled in the quenching part, and by-products are treated in the wet spray tower, and the wastewater is stored in the circulation tank and discharged. The treated gas is discharged through the outlet part.[
18]
Figure 2 shows the setup of the plasma-wet scrubber used in this study. Plasma-wet scrubber is divided into an etch type for waste gas treatment in the etching process and a water film type for waste gas treatment in the chemical vapor deposition (CVD) process. In the case of the etch type, water is sprayed from the gas quenching part located below the pyrolysis reactor part. In the case of the water film type, a water film is formed inside the pyrolysis reactor.
2.2. Experiment Setup and Methods
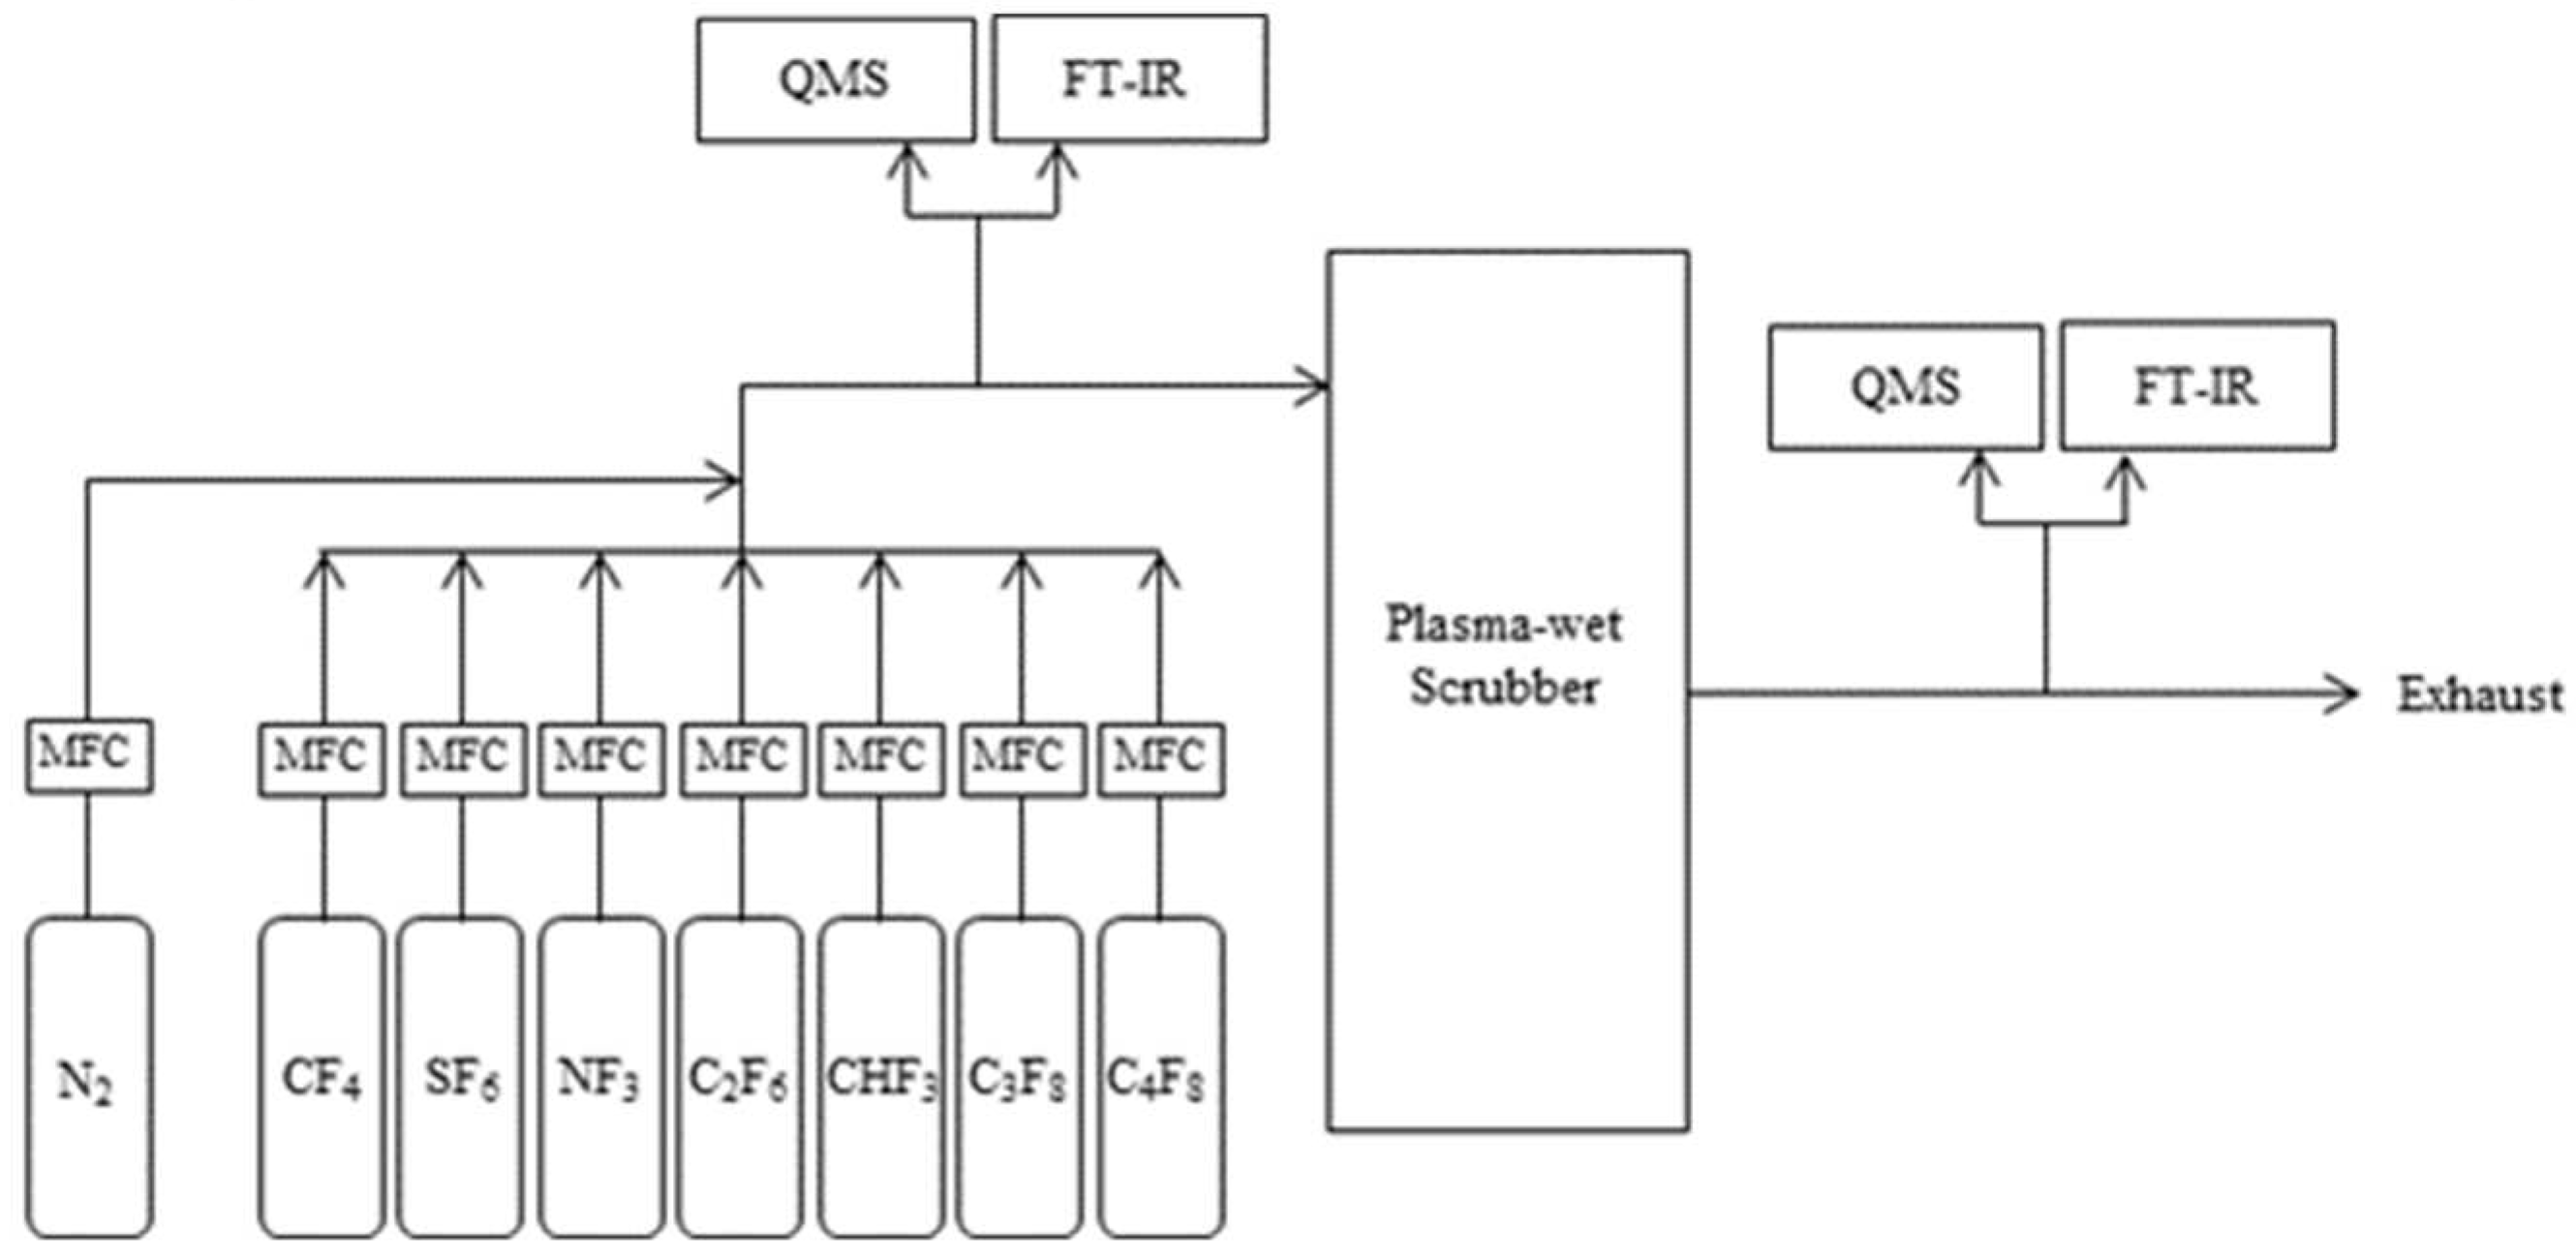
Figure 3 illustrates the experiment set up that was used in this study. The kinds of gas used were CF
4, SF
6, NF
3, CHF
3, C
2F
6, C
3F
8, and C
4F
8, and high purity (99.999 %) was used. The flow rate of the target gas was adjusted using a mass flow meter (MFC; M3030V, LINE TECH Co., Korea), and the concentration of the PFCs gas was adjusted to 4 000 to 5 000 μmol/mol by mixing with nitrogen gas (99.999 %) to be injected into the plasma-wet scrubber (NSPW600Plus, GnBS eco, Korea). The flow rate injected into the Plasma-wet scrubber is 100, 300 L/min, which includes nitrogen and air, which are essential during scrubber operation. Plasma-wet scrubbers range in power from 6 to 11 kW. FTIR (Gasmet DX4000, Gasmet Co., USA) was used to measure the inlet and outlet concentrations of the Plasma-wet scrubber. For the gas cell of FT-IR, a 60 cm long cell was used in the inlet measurement and a 500 cm long cell was used in the outlet measurement. The inlet and outlet flow rates of the plasma-wet scrubber were measured using QMS (isepa-S, el Co., Korea).
Table 2 shows the experimental operating conditions of detail.
2.3 Calculation of PFCs
The DRE of PFCs can be defined as follows[
19]:
Where,
: Inlet volume-flow of PFCs (L/min)
: Outlet volume-flow of PFCs (L/min)
: Inlet concentration of PFCs (μmol/mol)
: outlet concentration of PFCs (μmol/mol)
: inlet flow of PFCs (L/min)
: outlet flow of PFCs (L/min)
The Generation rate of by-products can be defined as follows:
Where,
: Outlet volume-flow of by-products (L/min)
: Outlet concentration of by-products (μmol/mol)
3. Results
3.1. Decomposition of PFCs in Etch Type
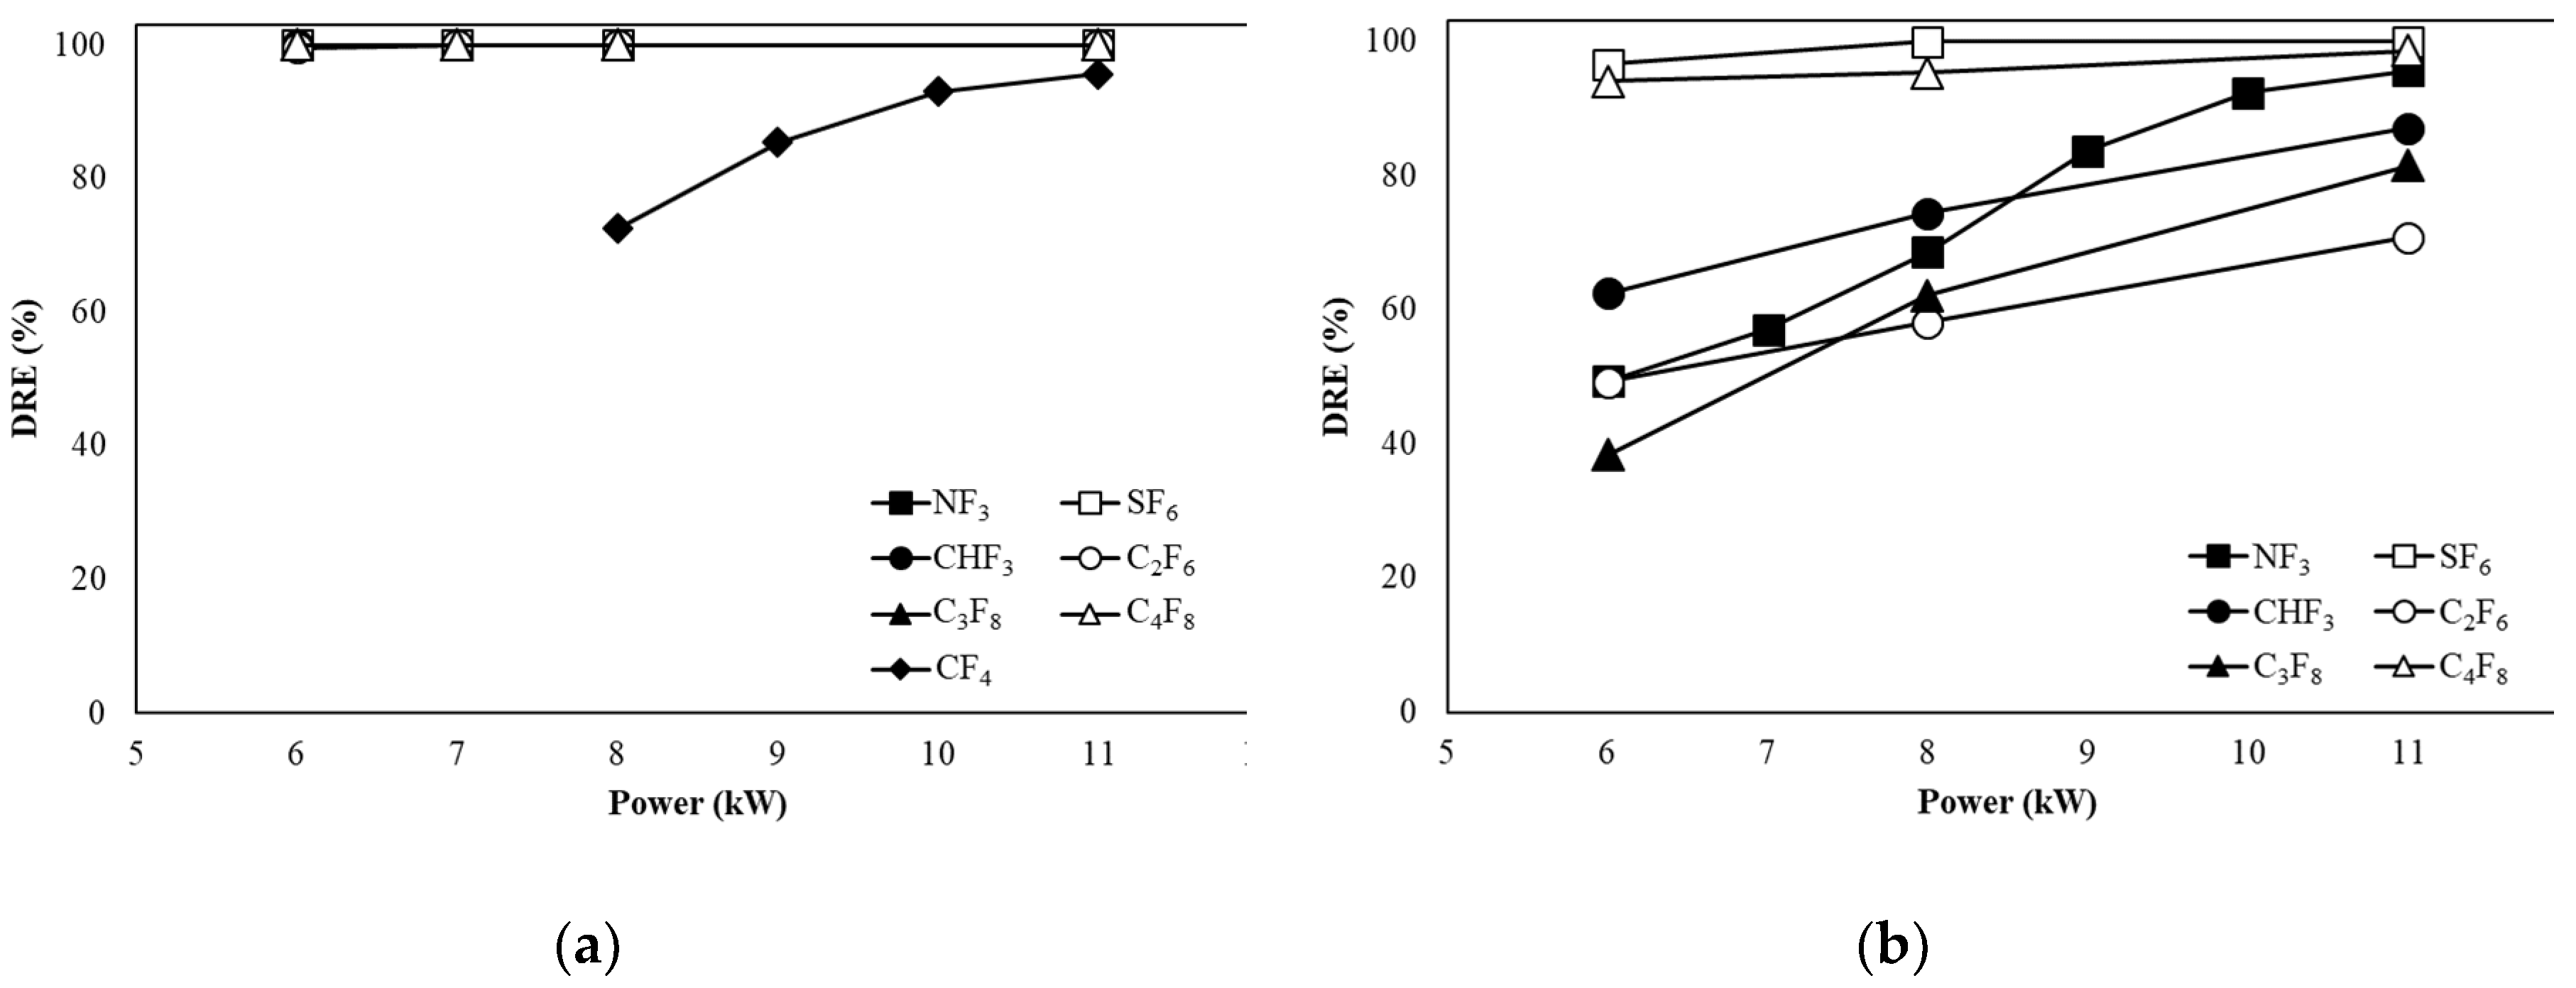
Figure 4a shows the DREs of CF
4, SF
6, CHF
3, C
2F
6, C
3F
8, and C
4F
8 when the flow rate is 100 L/min in the etch type. The DREs of SF
6, NF
3, CHF
3, C
2F
6, C
3F
8, and C
4F
8 were maintained above 99 % regardless of power change. The DRE of CF
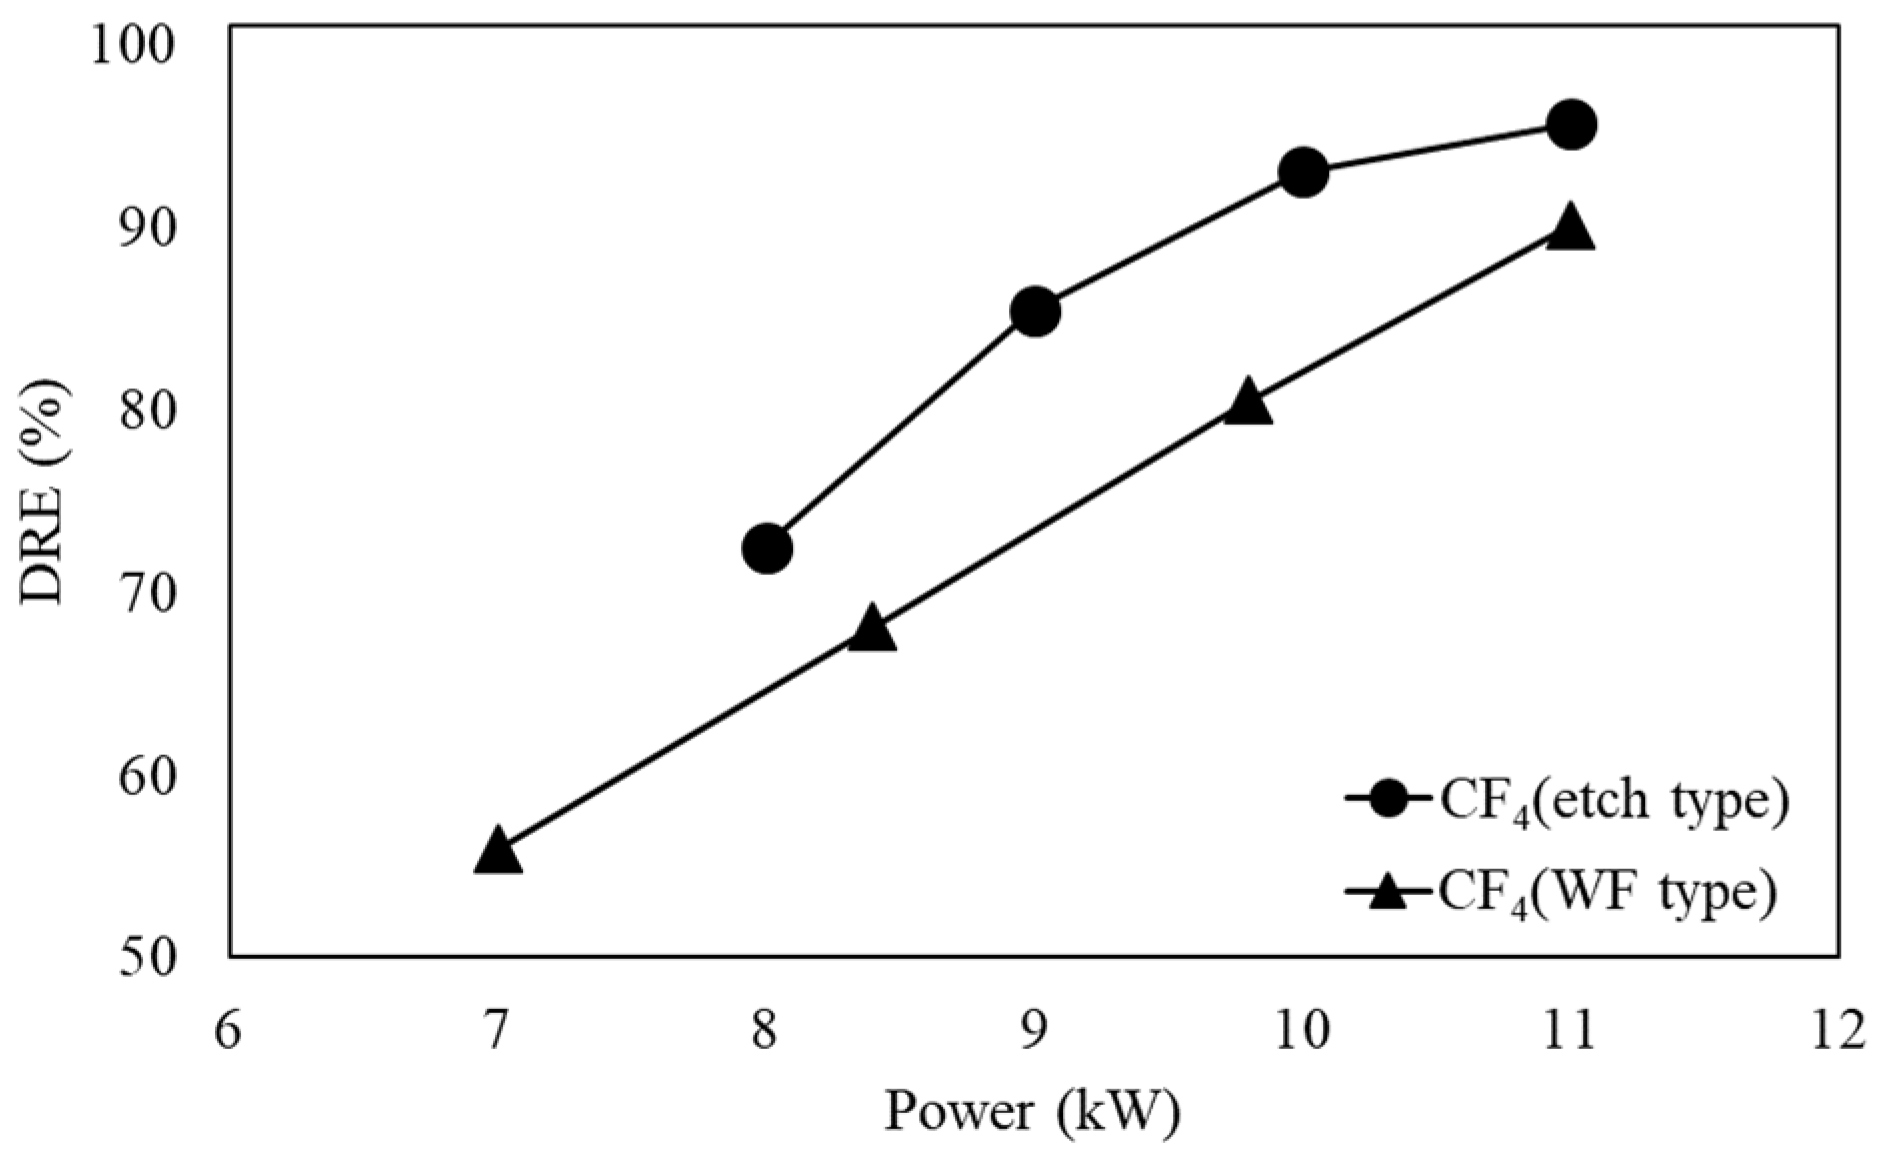
4 increased from 72.45 % at 8 kW to 95.60 % at 11 kW with increasing power, but the DRE was lower compared to other gases.
Figure 4b shows the DREs of SF
6, CHF
3, C
2F
6, C
3F
8, and C
4F
8 when the flow rate is 300 L/min in the etch type. As the power is higher, the DRE of SF
6 increases from 96.57 % to 99.99 %, and the DRE is 99.99 % at the power of 8 kW, maintaining the DRE up to 11 kW. The DRE of NF
3 increases from 49.32 % to 95.57 % as the power increases, and from 10 kW, the DRE is over 90 %. The DRE of C
4F
8 increases from 94 % to 98.59 % as the power increases, and from 6 kW, the efficiency is higher than 90 %. In the case of CHF
3, C
2F
6, and C
3F
8, as the power increased, the DRE increased from 62.42 %, 49.17 %, and 38.35 % to 87.06 %, 70.74 %, and 81.45 %, respectively.
3.2. Decomposition of PFCs in WF Type
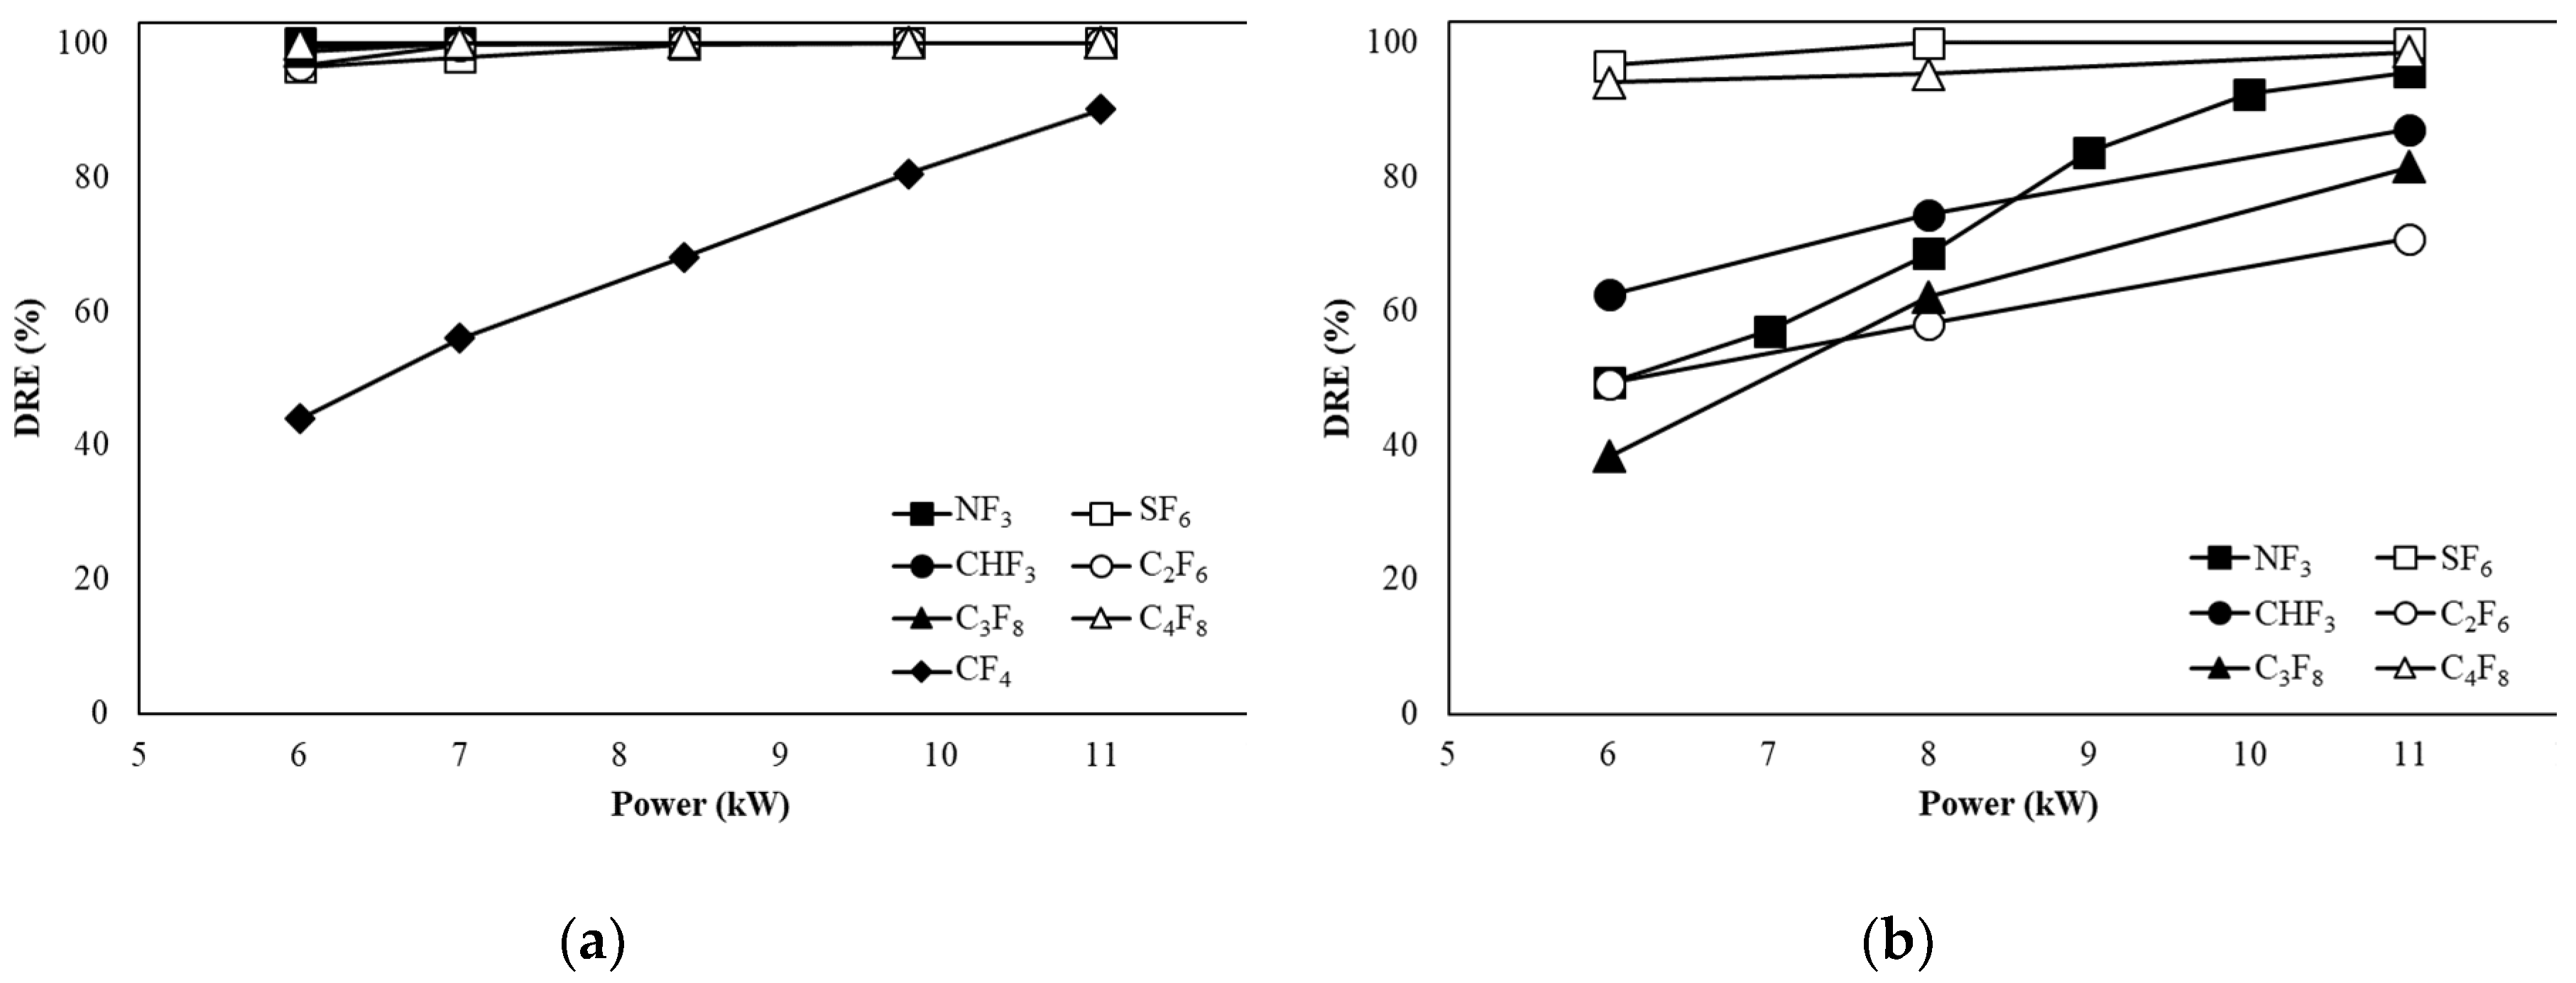
Figure 5a shows the DREs of CF
4, SF
6, CHF
3, C
2F
6, C
3F
8, and C
4F
8 when the flow rate is 100 L/min in the water film(WF) type. As the power increased, the DREs of SF
6, CHF
3, C
2F
6, C
3F
8, and C
4F
8 increased from 96.44 %, 99.30 %, 96.60 %, 98.74 %, and 99.93 % to 99.99 %, respectively. In the case of CF
4, the DRE value increased from 43.96 % to 90.06 % as the power increased from 6 to 11 kW, but the DRE was lower compared to other gases. In the case of NF
3, the DRE was 99.99 % from 6 kW regardless of the power increase.
Figure 5b shows the DREs of SF
6, CHF
3, C
2F
6, C
3F
8, and C
4F
8 when the flow rate is 300 L/min in the WF type. In the case of SF
6, it increased from 88.91 % to 94.39 % as the power increased. In the case of NF
3, CHF
3, C
2F
6, C
3F
8, and C
4F
8, the DRE at 6 kW was as low as 60.21 %, 58.21 %, 54.08 %, 32.67 %, and 46.60 %. However, the DREs of NF
3, CHF
3, C
2F
6, C
3F
8, and C
4F
8 at 11 kW were 99.80 %, 95.34 %, 85.38 %, 88.49 %, and 98.22 %, respectively.
3.3. DRE of Etch and WF Type
Figure 6 shows the DRE of CF
4 in the etch type and WF type when the flow rate is 100 L/min. When CF
4 is decomposed, it requires a high temperature. In the case of the WF type, the temperature inside the reactor is lower than that of the etch type due to the water film, so the decomposition of CF
4 did not occur well.
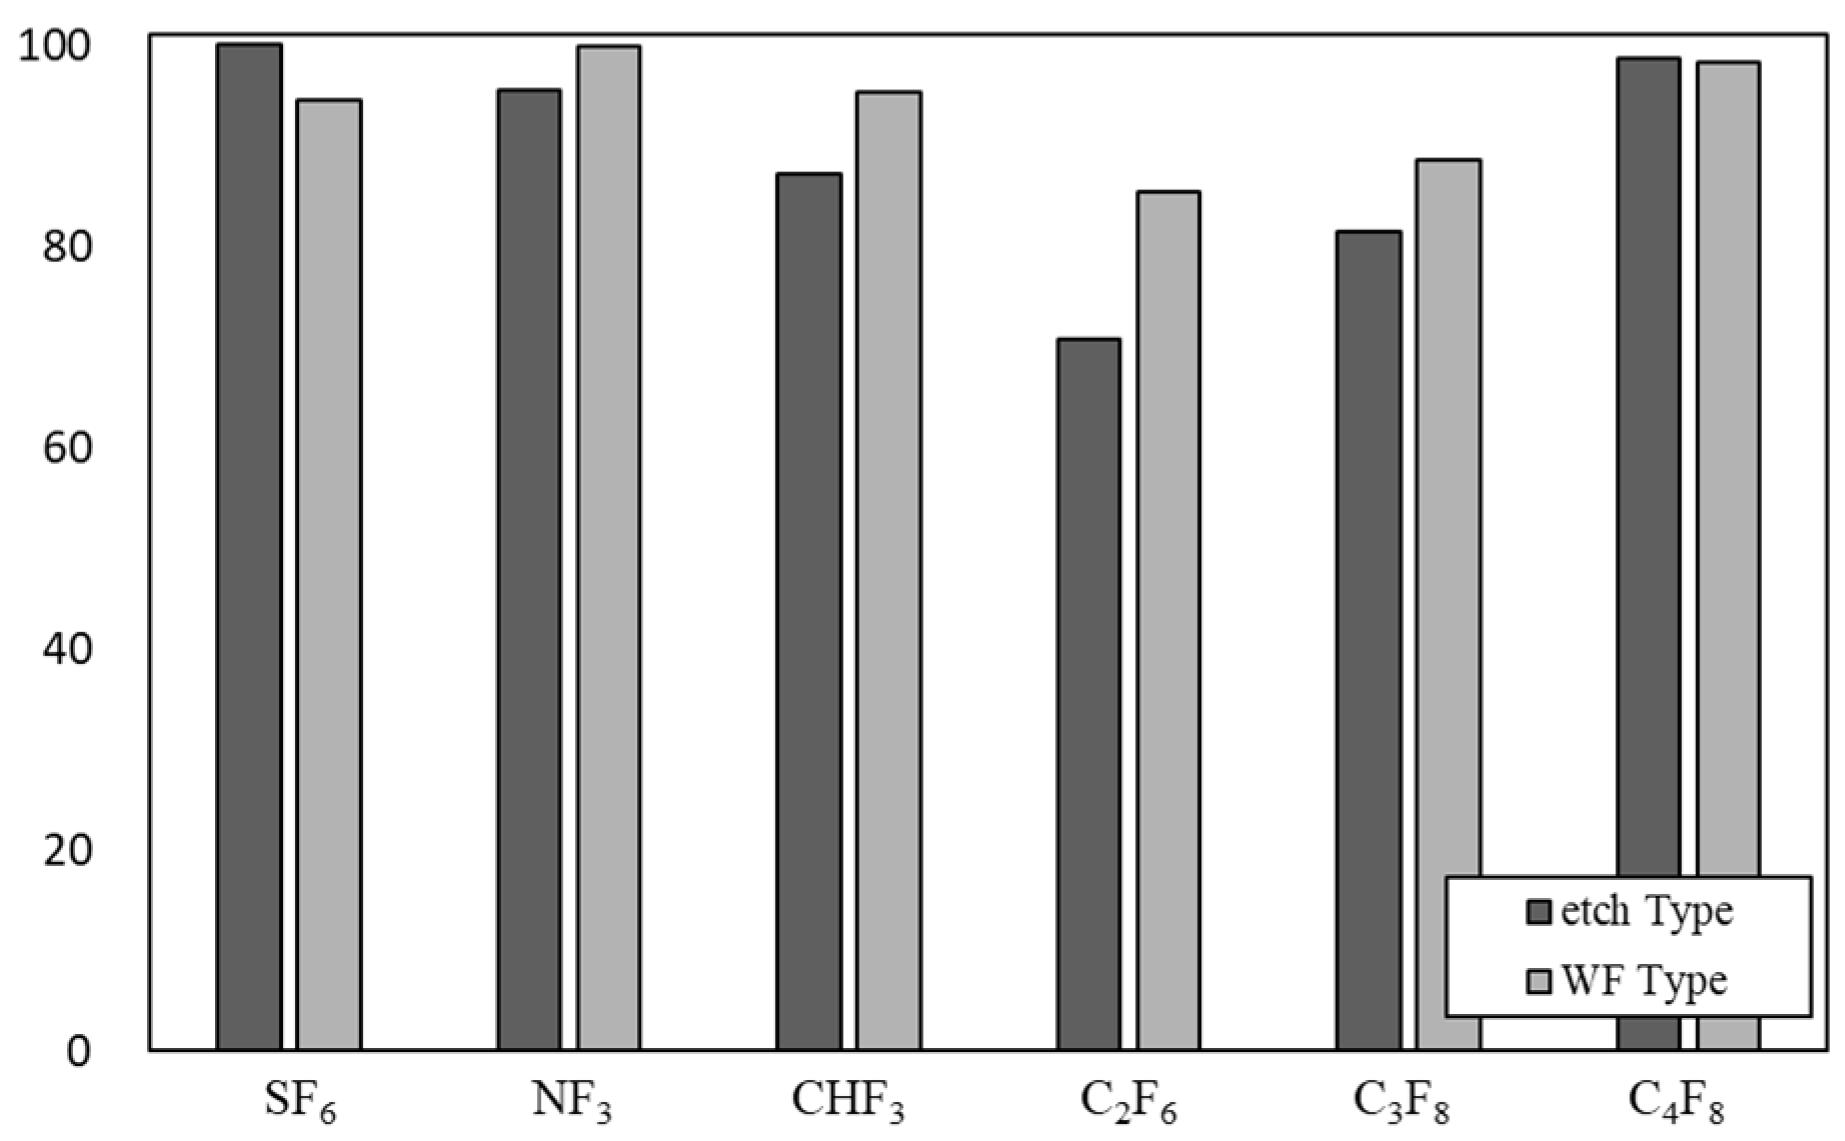
Figure 7 shows the DRE of SF
6, NF
3, CHF
3, C
2F
6, C
3F
8, and C
4F
8 in the etch type and WF type when the flow rate is 300 L/min and the power is 11 kW. In the case of SF
6, the DRE of the etch type was higher than that of the WF type. In the WF type, due to the water film, the temperature inside the reactor was lower than that of the etch type, which inhibited the decomposition of SF
6, which requires a high temperature for decomposition. In the case of NF
3, CHF
3, C
2F
6, and C
3F
8, DRE was higher in the WF type than in etch type. The water film prevented recombination of each gas and the conversion to HF occurred well. In the case of C
4F
8, the DREs of the etch type and the WF type were similar.
3.4. Rate of by-Product Gas Generation
The rate of by-product gas generation was calculated by the amount of by-product gas generation for C
2F
6, CHF
3, C
3F
8, and C
4F
8 where F gases such as CF
4 and C
2F
6 are generated as by-product gases. The amount of by-product gas generation was measured at a flow rate of 100 L/min and power of 7 kW.
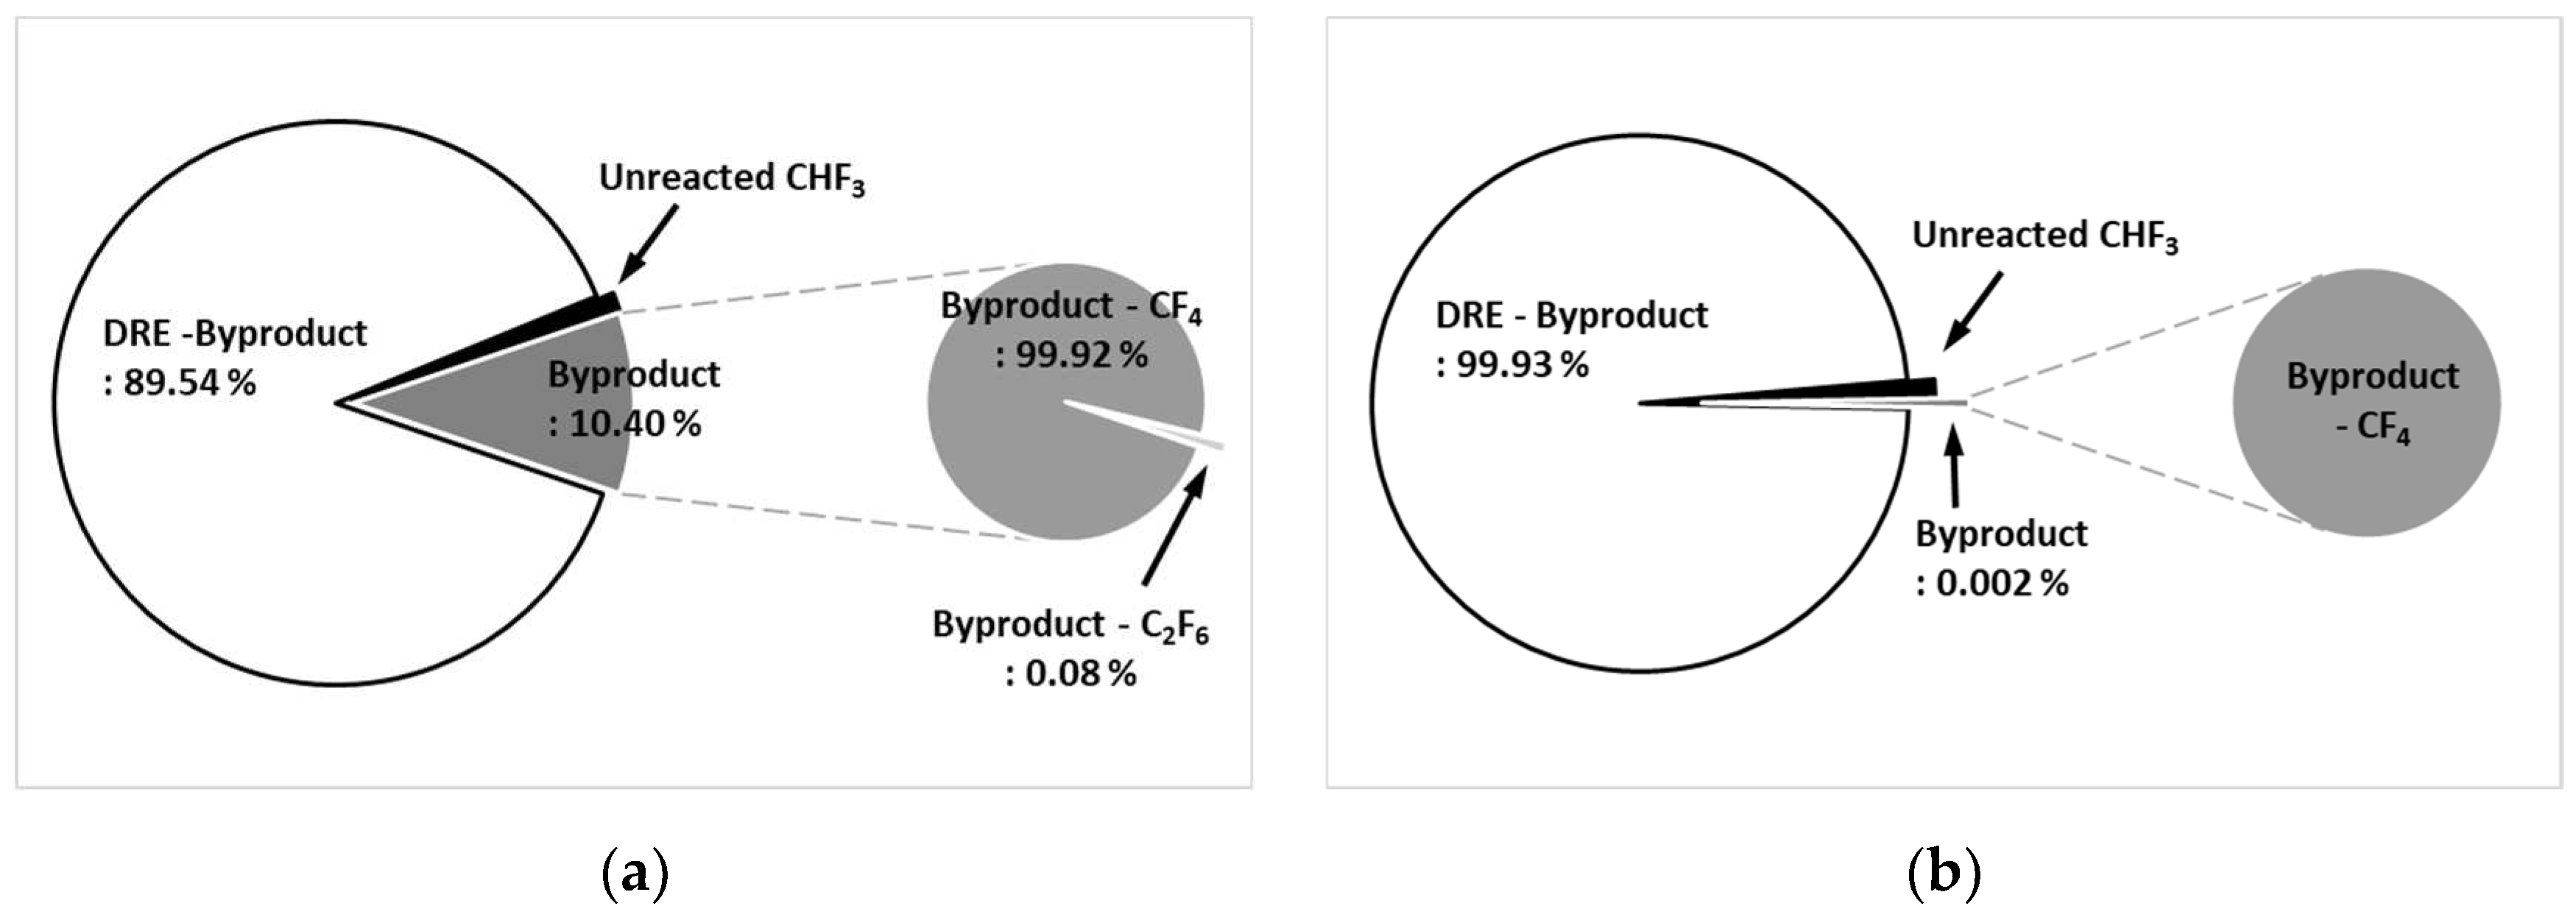
Figure 8a shows the by-product gas generation rate of CHF
3 in the etch type. The pure DRE calculated considering the by-product gas generation rate was 89.54 %, and the by-product gas generation rate was confirmed to be 10.40 %. As for by-product gas, CF
4 was high at 99.92 % of the by-product gas generation rate, and C
2F
6 was generated as little as 0.08 %.
Figure 8b shows the by-product gas generation rate of CHF
3 in WF type. It was confirmed that the pure DRE calculated considering the by-product gas generation rate was 99.93 % and the by-product gas generation rate was 0.002 %, showing a very low generation rate. A small amount of CF
4 was generated as a by-product gas.
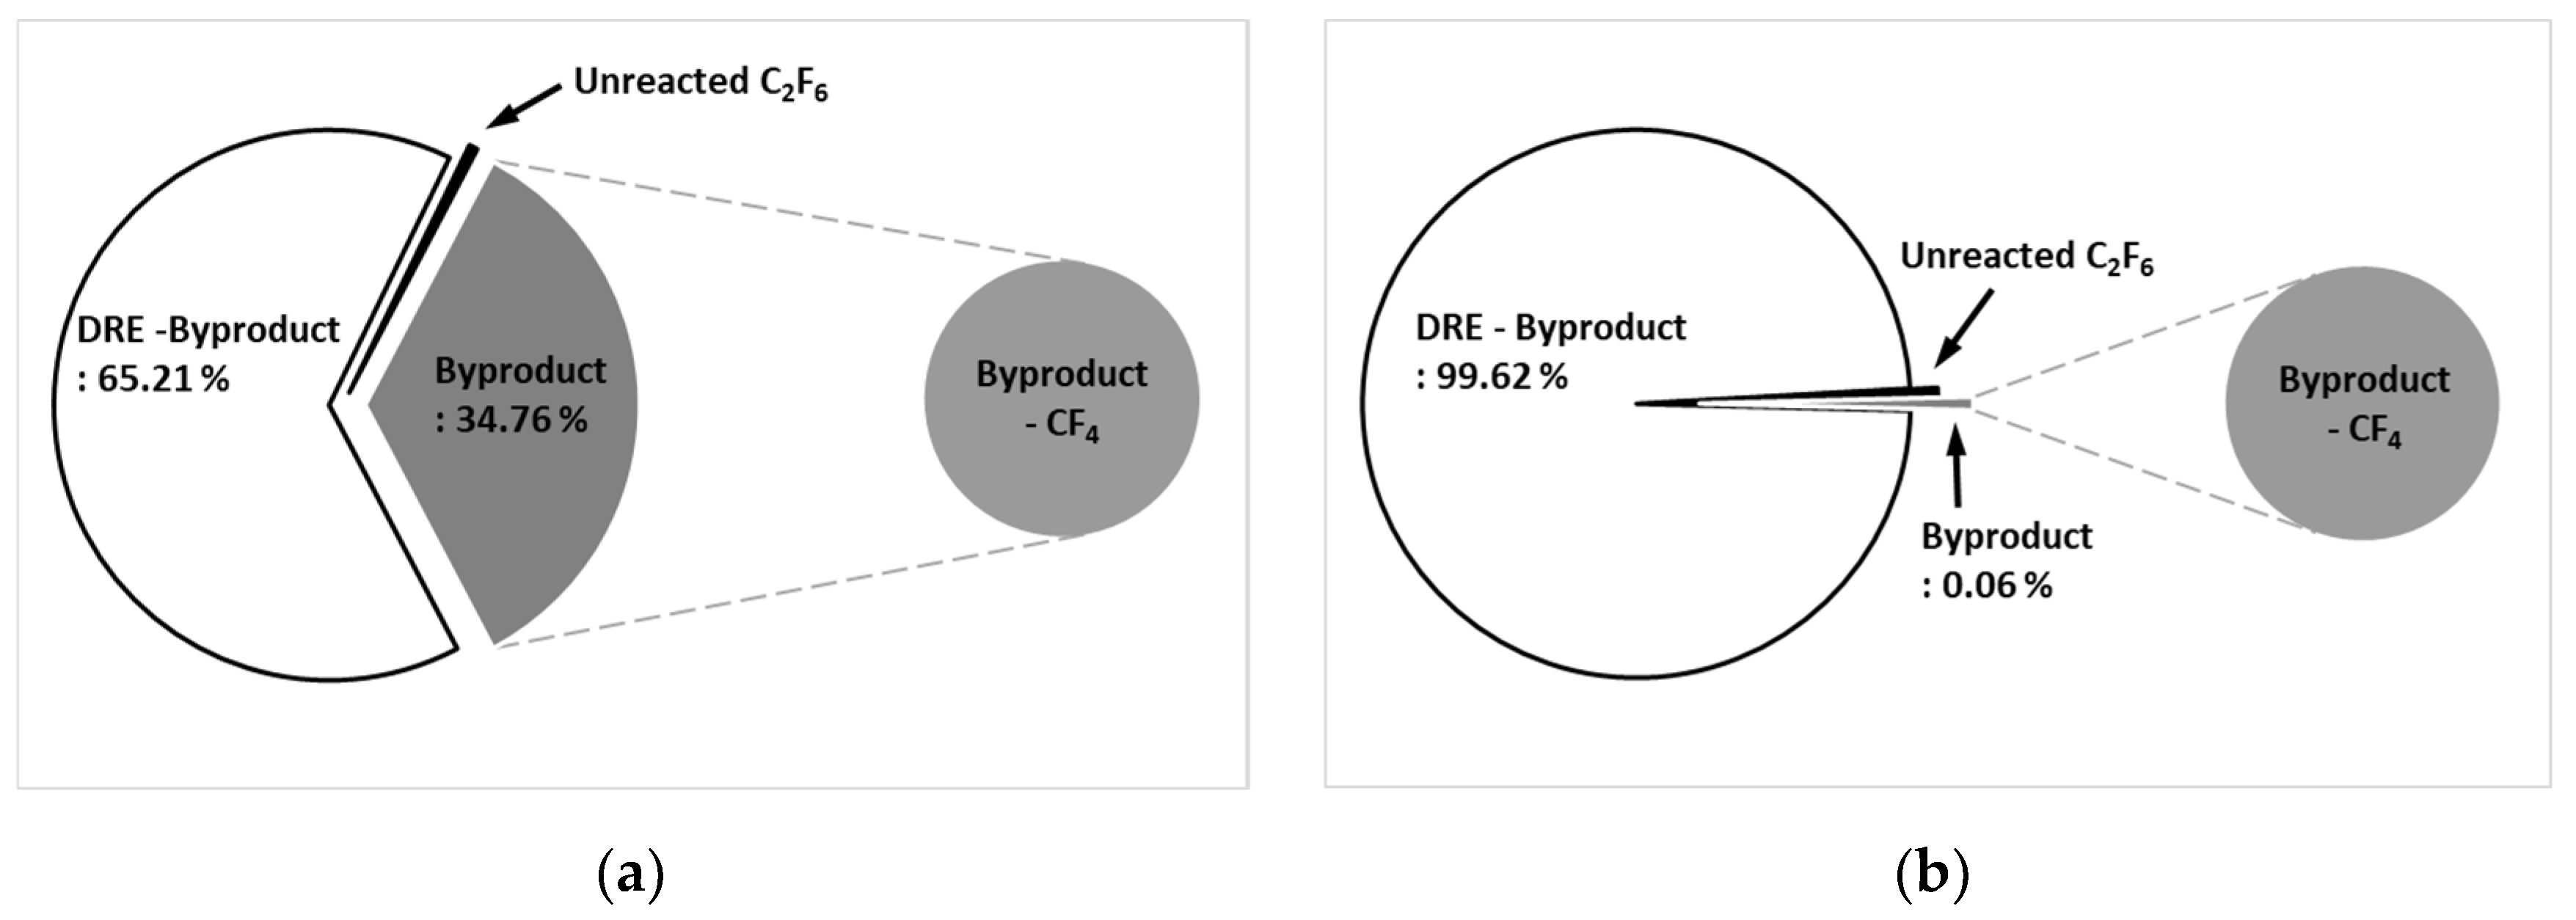
Figure 9a shows the by-product gas generation rate of C
2F
6 in the etch type. The pure DRE calculated considering the by-product gas generation rate was 65.21 %, and the by-product gas generation rate was confirmed to be 34.76 %. Only CF
4 was generated as a by-product gas.
Figure 9b shows the by-product gas generation rate of C
2F
6 in WF type. It was confirmed that the pure DRE calculated considering the by-product gas generation rate was 99.62 % and the by-product gas generation rate was 0.06 %, showing a very low generation rate. A small amount of CF
4 was generated as a by-product gas even in the WF type.
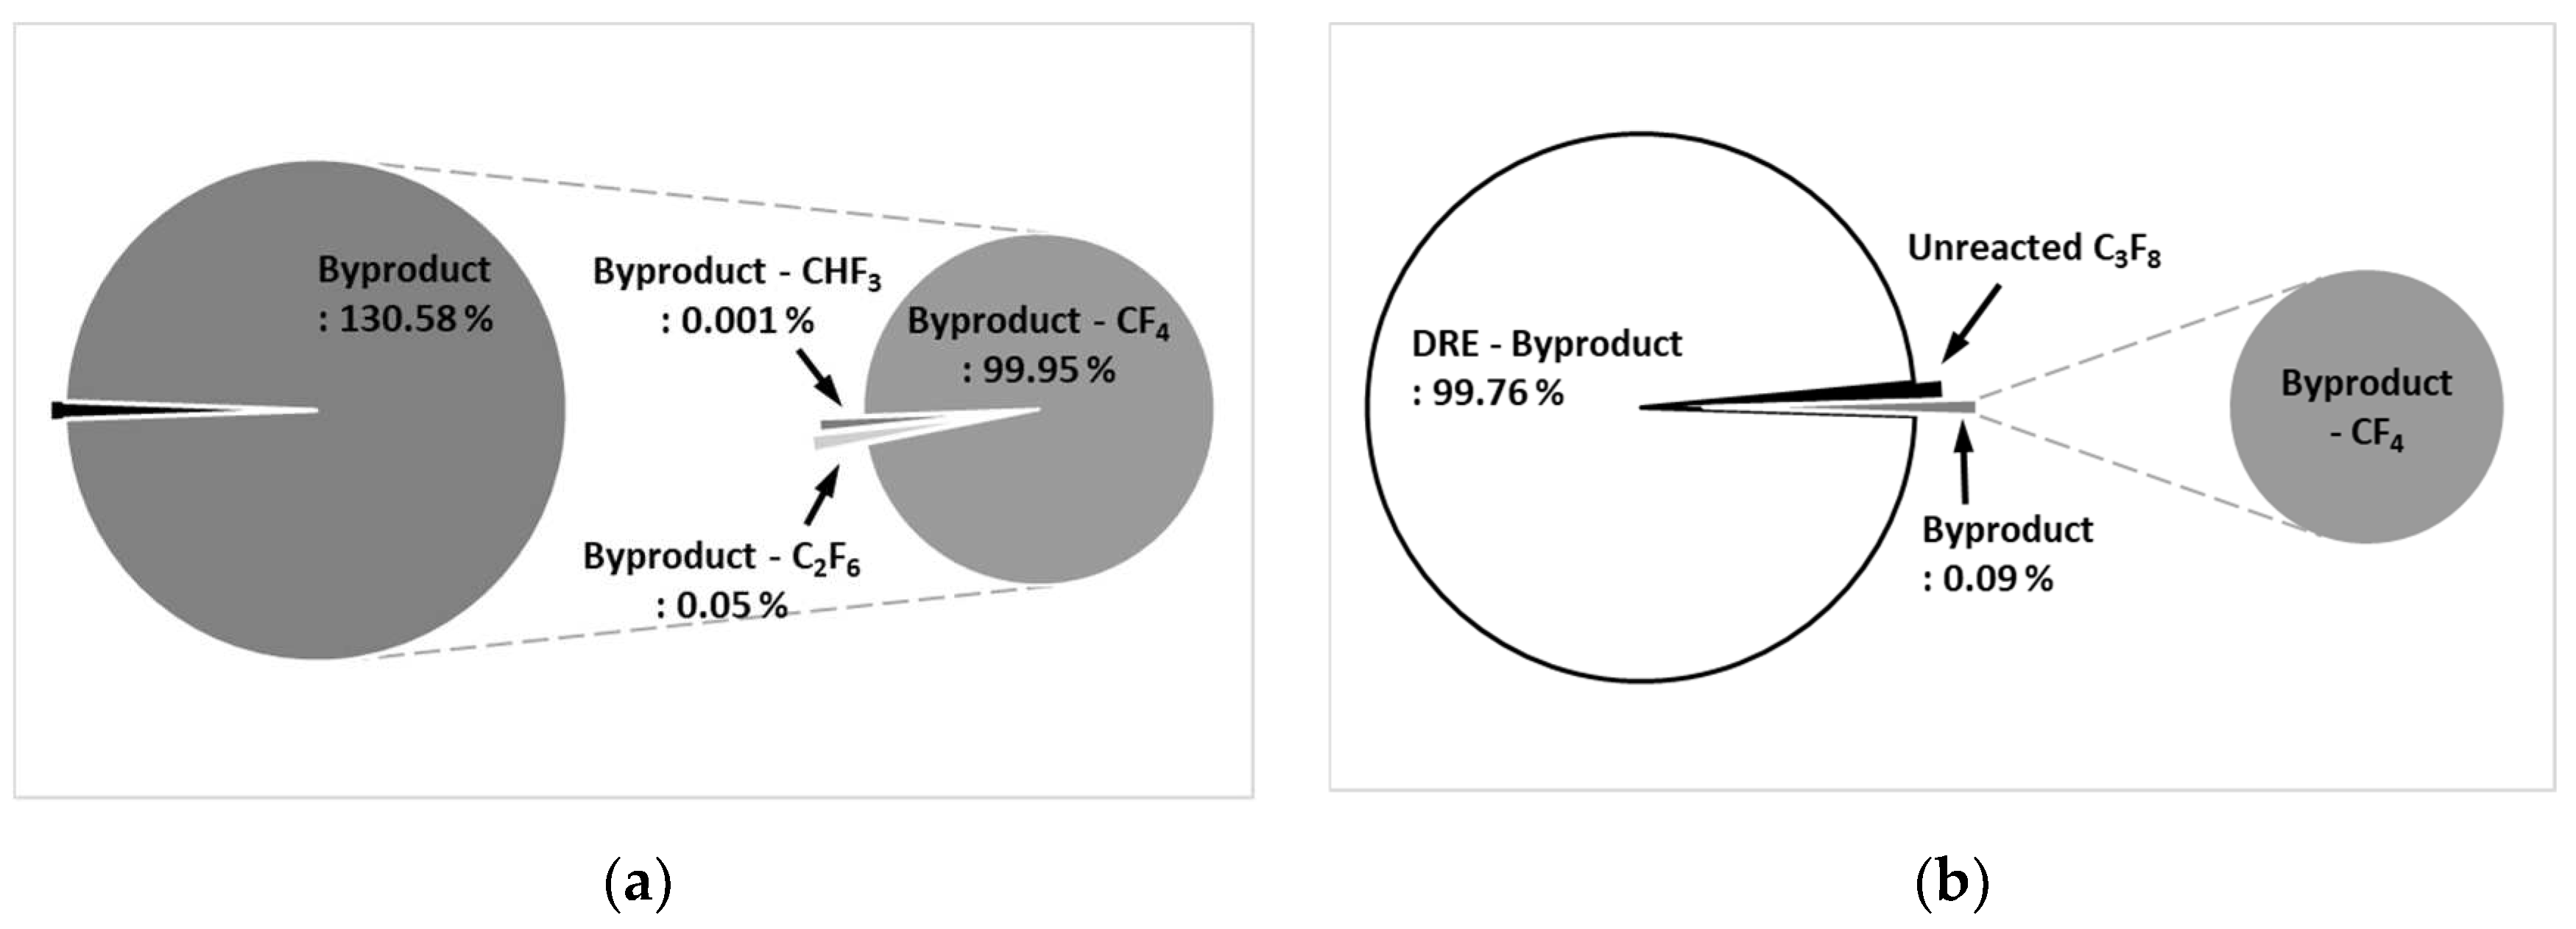
Figure 10a shows the by-product gas generation rate of C
3F
8 in the etch type. The by-product gas generation rate of C
3F
8 is 130.58 %, and more by-product gas is generated than the amount of injected C
3F
8. As for by-product gas, CF
4 was high at 99.92 %, C
2F
6 was 0.05 %, and CHF
3 was low at 0.001 %.
Figure 10b shows the by-product gas generation rate of C
3F
8 in WF type. The by-product gas generation rate of C
3F
8 was 0.09 %, and the pure DRE calculated considering the by-product gas generation rate was confirmed to be 99.76 %. In the WF type, a small amount of CF
4 was generated as a by-product of C
3F
8.
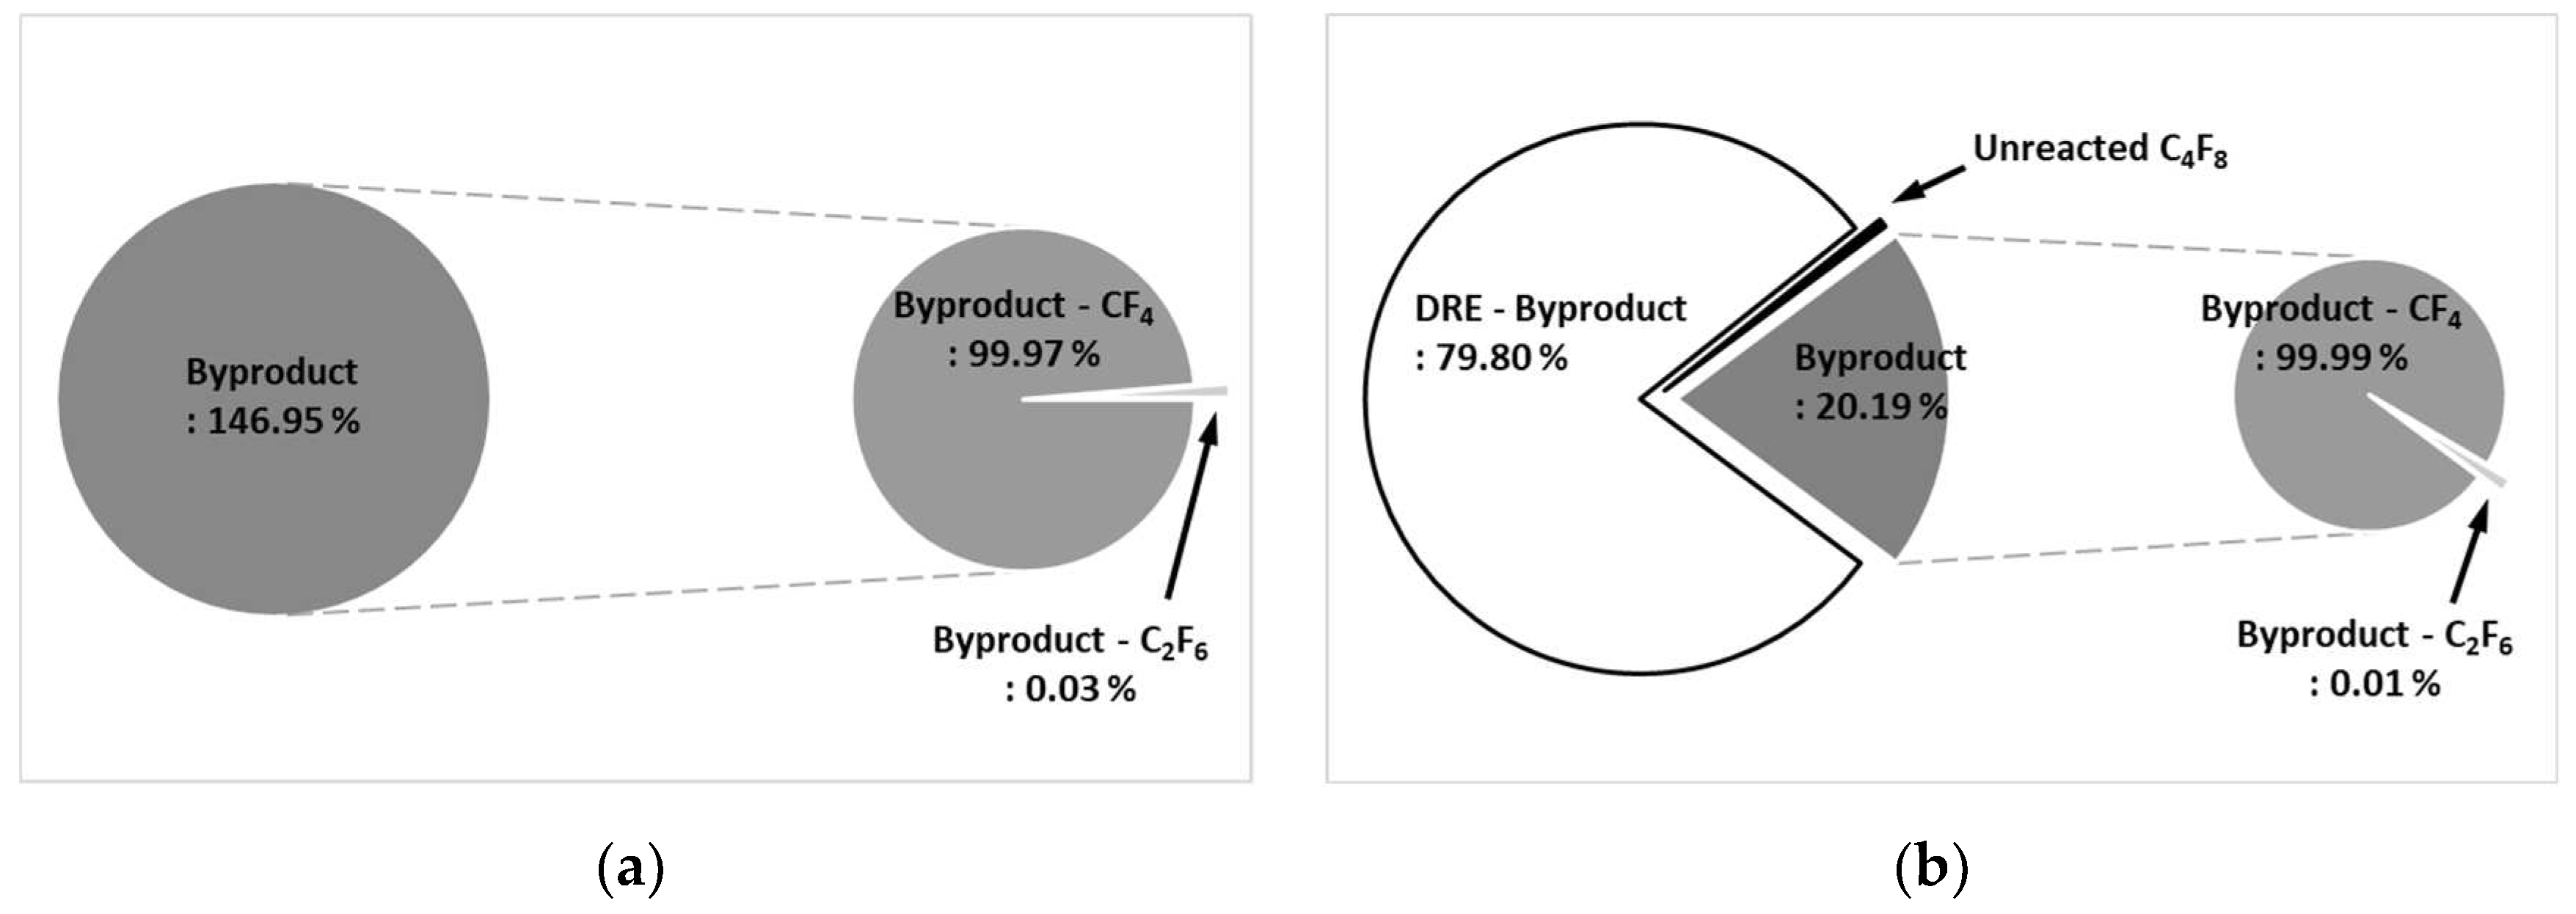
Figure 11a shows the by-product gas generation rate of C
4F
8 in the etch type. The by-product gas generation rate of C
4F
8 is 146.95 %, and more by-product gas is generated than the amount of injected C
4F
8. Among the by-product gases, CF
4 was high at 99.97 % and C
2F
6 was low at 0.03 %.
Figure 11b shows the by-product gas generation rate of C
4F
8 in WF type. The by-product gas generation rate of C
4F
8 was 20.19 %, which was less than that of the etch type, and the pure DRE calculated considering the by-product gas generation rate was confirmed to be 79.80 %. In the WF type, as a by-product gas of C
4F
8, CF
4 was generated at 99.99 % and C
2F
6 at 0.01 % among the by-product gas generation rates. The rate of by-product gas generation in the WF type is significantly lower than that of the etch type. In the WF type, the water film prevents the recombination of PFCs, which generate a lot of by-product gases, and facilitates conversion to HF, so that the generated by-products can be treated well.
4. Conclusions
In this study, in order to find out the decomposition characteristics of each type of plasma-wet scrubber, an experiment was conducted to find the DRE and by-product gas generation rate according to the parameter change of the etch type and WF type plasma-wet scrubbers. At 100 L/min and 11 kW in the etch type, the DRE of CF4 was 95.60 %, and the other gases maintained 99.99 % from 6 to 11 kW. At 300 L/min and 11 kW, the reduction efficiencies of SF6, NF3, CHF3, C2F6, C3F8, and C4F8 were 99.99 %, 95.57 %, 87.06 %, 70.74 %, 81.45 %, and 98.59 %, respectively. At 100 L/min and 11 kW in the WF type, the DRE of CF4 was 90.06 % and the DRE of SF6 was 96.44 %, and most of the other gases showed a DRE of 99.99 %. In addition, at 300 L/min and 11 kW, the DREs of SF6, NF3, CHF3, C2F6, C3F8, and C4F8 were 94.39 %, 99.80 %, 95.34 %, 85.38 %, 88.49 %, and 98.22 %, respectively.
In the etch type, the DRE of CF4 and SF6 was smaller than that of the WF type. It seems that the temperature inside the reactor is lower than that of the etch type, so that decomposition does not occur properly, and the DRE is lowered. In addition, the DRE of WF was high at the total gas flow rate of 300 L/min. It seems that recombination was prevented by the water film and the DRE was increased. Therefore, in the process using CF4 and SF6, the etch type is considered, and in the process using other gases, the WF type is considered.
It was confirmed that the by-product gas generation rate showed a significant decrease in the WF type compared to the etch type. This seems to have reduced the generation of by-product gases by converting to HF before being decomposed into by-product gases such as CF4 and C2F6 due to water film, and by-products being treated. Therefore, in the case of a process using C3F8 and C4F8, which generate a lot of by-product gas, the use of the WF type is considered. The performance of each type of plasma scrubber was confirmed, and it is thought that it can be used as basic data for carbon neutrality in the semiconductor and display industries.
Acknowledgments
This work was supported by Korea Evaluation Institute of Industrial Technology (KEIT) through “Next-generation Intelligent Semiconductor Technology Development Project”, fund by the Korea Ministry of Trade, Industry and Energy (MOTIE). (No.20016238) and Korea Environment Industry &Technology Institute (KEITI) through "Climate Change R&D Project for New Climate Regime.", funded by Korea Ministry of Environment (MOE) (No.2022003560008).
References
- Illuzzi, F.; Thewissen, H. Perfluorocompounds emission reduction by the semiconductor industry. J. Integr. Environ. Sci. 2010, 7, 201–210. [Google Scholar] [CrossRef]
- Chung, J.K.; Lee, K.Y.; Lee, S.G.; Lee, E.M.; Mo, S.H.; Lee, D.K.; Kim, S.G. The development of scrubber for F-gas reduction from electronic industry using pressure swing adsorption method and porous media combustion method. Clean Technol. 2017, 23, 181–187. [Google Scholar]
- Choi, S.-S.; Park, D.-W.; Watanabe, T. Thermal plasma decomposition of fluorinated greenhouse gases. Nucl. Eng. Technol. 2012, 44, 21–32. [Google Scholar] [CrossRef]
- Han, S.-H.; Park, H.-W.; Kim, T.-H.; Park, D.-W. Large scale treatment of perfluorocompounds using a thermal plasma scrubber. Clean Technol. 2011, 17, 250–258. [Google Scholar]
- Chang, M.B.; Chang, J.-S. Abatement of PFCs from semiconductor manufacturing processes by nonthermal plasma technologies: A critical review. Ind. Eng. Chem. Res. 2006, 45, 4101–4109. [Google Scholar] [CrossRef]
- Choi, S.; Hong, S.H.; Lee, H.S.; Watanabe, T. A comparative study of air and nitrogen thermal plasmas for PFCs decomposition. Chem. Eng. J. 2012, 185, 193–200. [Google Scholar] [CrossRef]
- Kuroki, T.; Tanaka, S.; Okubo, M.; Yamamoto, T. CF4 decomposition using low-pressure pulse-modulated radio frequency plasma. JSME Int. J. Ser. B Fluids Therm. Eng. 2005, 48, 440–447. [Google Scholar] [CrossRef]
- Chen, S.-H.; Živný, O.; Mašláni, A.; Chau, S.-W. Abatement of fluorinated compounds in thermal plasma flow. J. Fluor. Chem. 2019, 217, 41–49. [Google Scholar] [CrossRef]
- Hong, Y.C.; Kim, H.S.; Uhm, H.S. Reduction of perfluorocompound emissions by microwave plasma-torch. Thin Solid Film. 2003, 435, 329–334. [Google Scholar] [CrossRef]
- Kiehlbauch, M.W.; Graves, D.B. Temperature resolved modeling of plasma abatement of perfluorinated compounds. J. Appl. Phys. 2001, 89, 2047–2057. [Google Scholar] [CrossRef]
- Li, Y.D.; Paganessi, J.E.; Rufin, D. Emission reduction of perfluorocompounds in semiconductor manufacturers via capture and recycle. 2000.
- Park, H.-W.; Cha, W.B.; Uhm, S. Highly efficient thermal plasma scrubber technology for the treatment of perfluorocompounds (PFCs). Appl. Chem. Eng 2018, 29, 10–17. [Google Scholar]
- Yoon, J.; Kim, Y.; Song, H. Effect of Inlet Shape on Thermal Flow Characteristics for Waste Gas in a Thermal Decomposition Reactor of Scrubber System. Appl. Chem. Eng. 2018, 29, 510–518. [Google Scholar]
- Park, H.-W.; Choi, S.; Park, D.-W. Effect of reaction gases on PFCs treatment using arc plasma process. Clean Technol. 2013, 19, 113–120. [Google Scholar] [CrossRef]
- Kim, T.-W.; Jo, G.-Y.; Lee, S.-M.; Lee, K.-H.; Jin, Y.-J.; Son, B.-K. A Study on Direct Current Arc Plasma Torch Design with Preserve Nozzle for Perfluorinated Compounds (PFCs) Decomposition in Cement Kiln. Appl. Sci. Converg. Technol. 2021, 30, 137–140. [Google Scholar] [CrossRef]
- Lim, M.S.; Kim, S.C.; Chun, Y.N. Decomposition of PFC gas using a water jet plasma. J. Mech. Sci. Technol. 2011, 25, 1845–1851. [Google Scholar] [CrossRef]
- EPA (2023). Inventory of U.S. Greenhouse Gas Emissions and Sinks: 1990-2021. U.S. Environmental
Protection Agency, EPA 430-R-23-002. https://www.epa.gov/ghgemissions/inventory-us-greenhouse-gasemissions-
and-sinks-1990-2021.
- Moon, G.-H.; Kim, J.-Y. Study on treatment characteristics of perfluorinated compounds using a high temperature plasma. Appl. Chem. Eng. 2019, 30, 108–113. [Google Scholar]
- Lee, J.-Y.; Lee, J.-B.; Moon, D.-M.; Souk, J.-H.; Lee, S.-Y.; Kim, J.-S. Evaluation method on destruction and removal efficiency of perfluorocompounds from semiconductor and display manufacturing. Bull. Korean Chem. Soc. 2007, 28, 1383–1388. [Google Scholar]
|
Disclaimer/Publisher’s Note: The statements, opinions and data contained in all publications are solely those of the individual author(s) and contributor(s) and not of MDPI and/or the editor(s). MDPI and/or the editor(s) disclaim responsibility for any injury to people or property resulting from any ideas, methods, instructions or products referred to in the content. |
© 2023 by the authors. Licensee MDPI, Basel, Switzerland. This article is an open access article distributed under the terms and conditions of the Creative Commons Attribution (CC BY) license (https://creativecommons.org/licenses/by/4.0/).
