Submitted:
03 July 2023
Posted:
04 July 2023
You are already at the latest version
Abstract
Keywords:
1. Introduction
2. Materials and Methods
2.1. Materials Synthesis
2.2. Material Characterization
2.3. Electrochemical Characterization
3. Results and Discussion
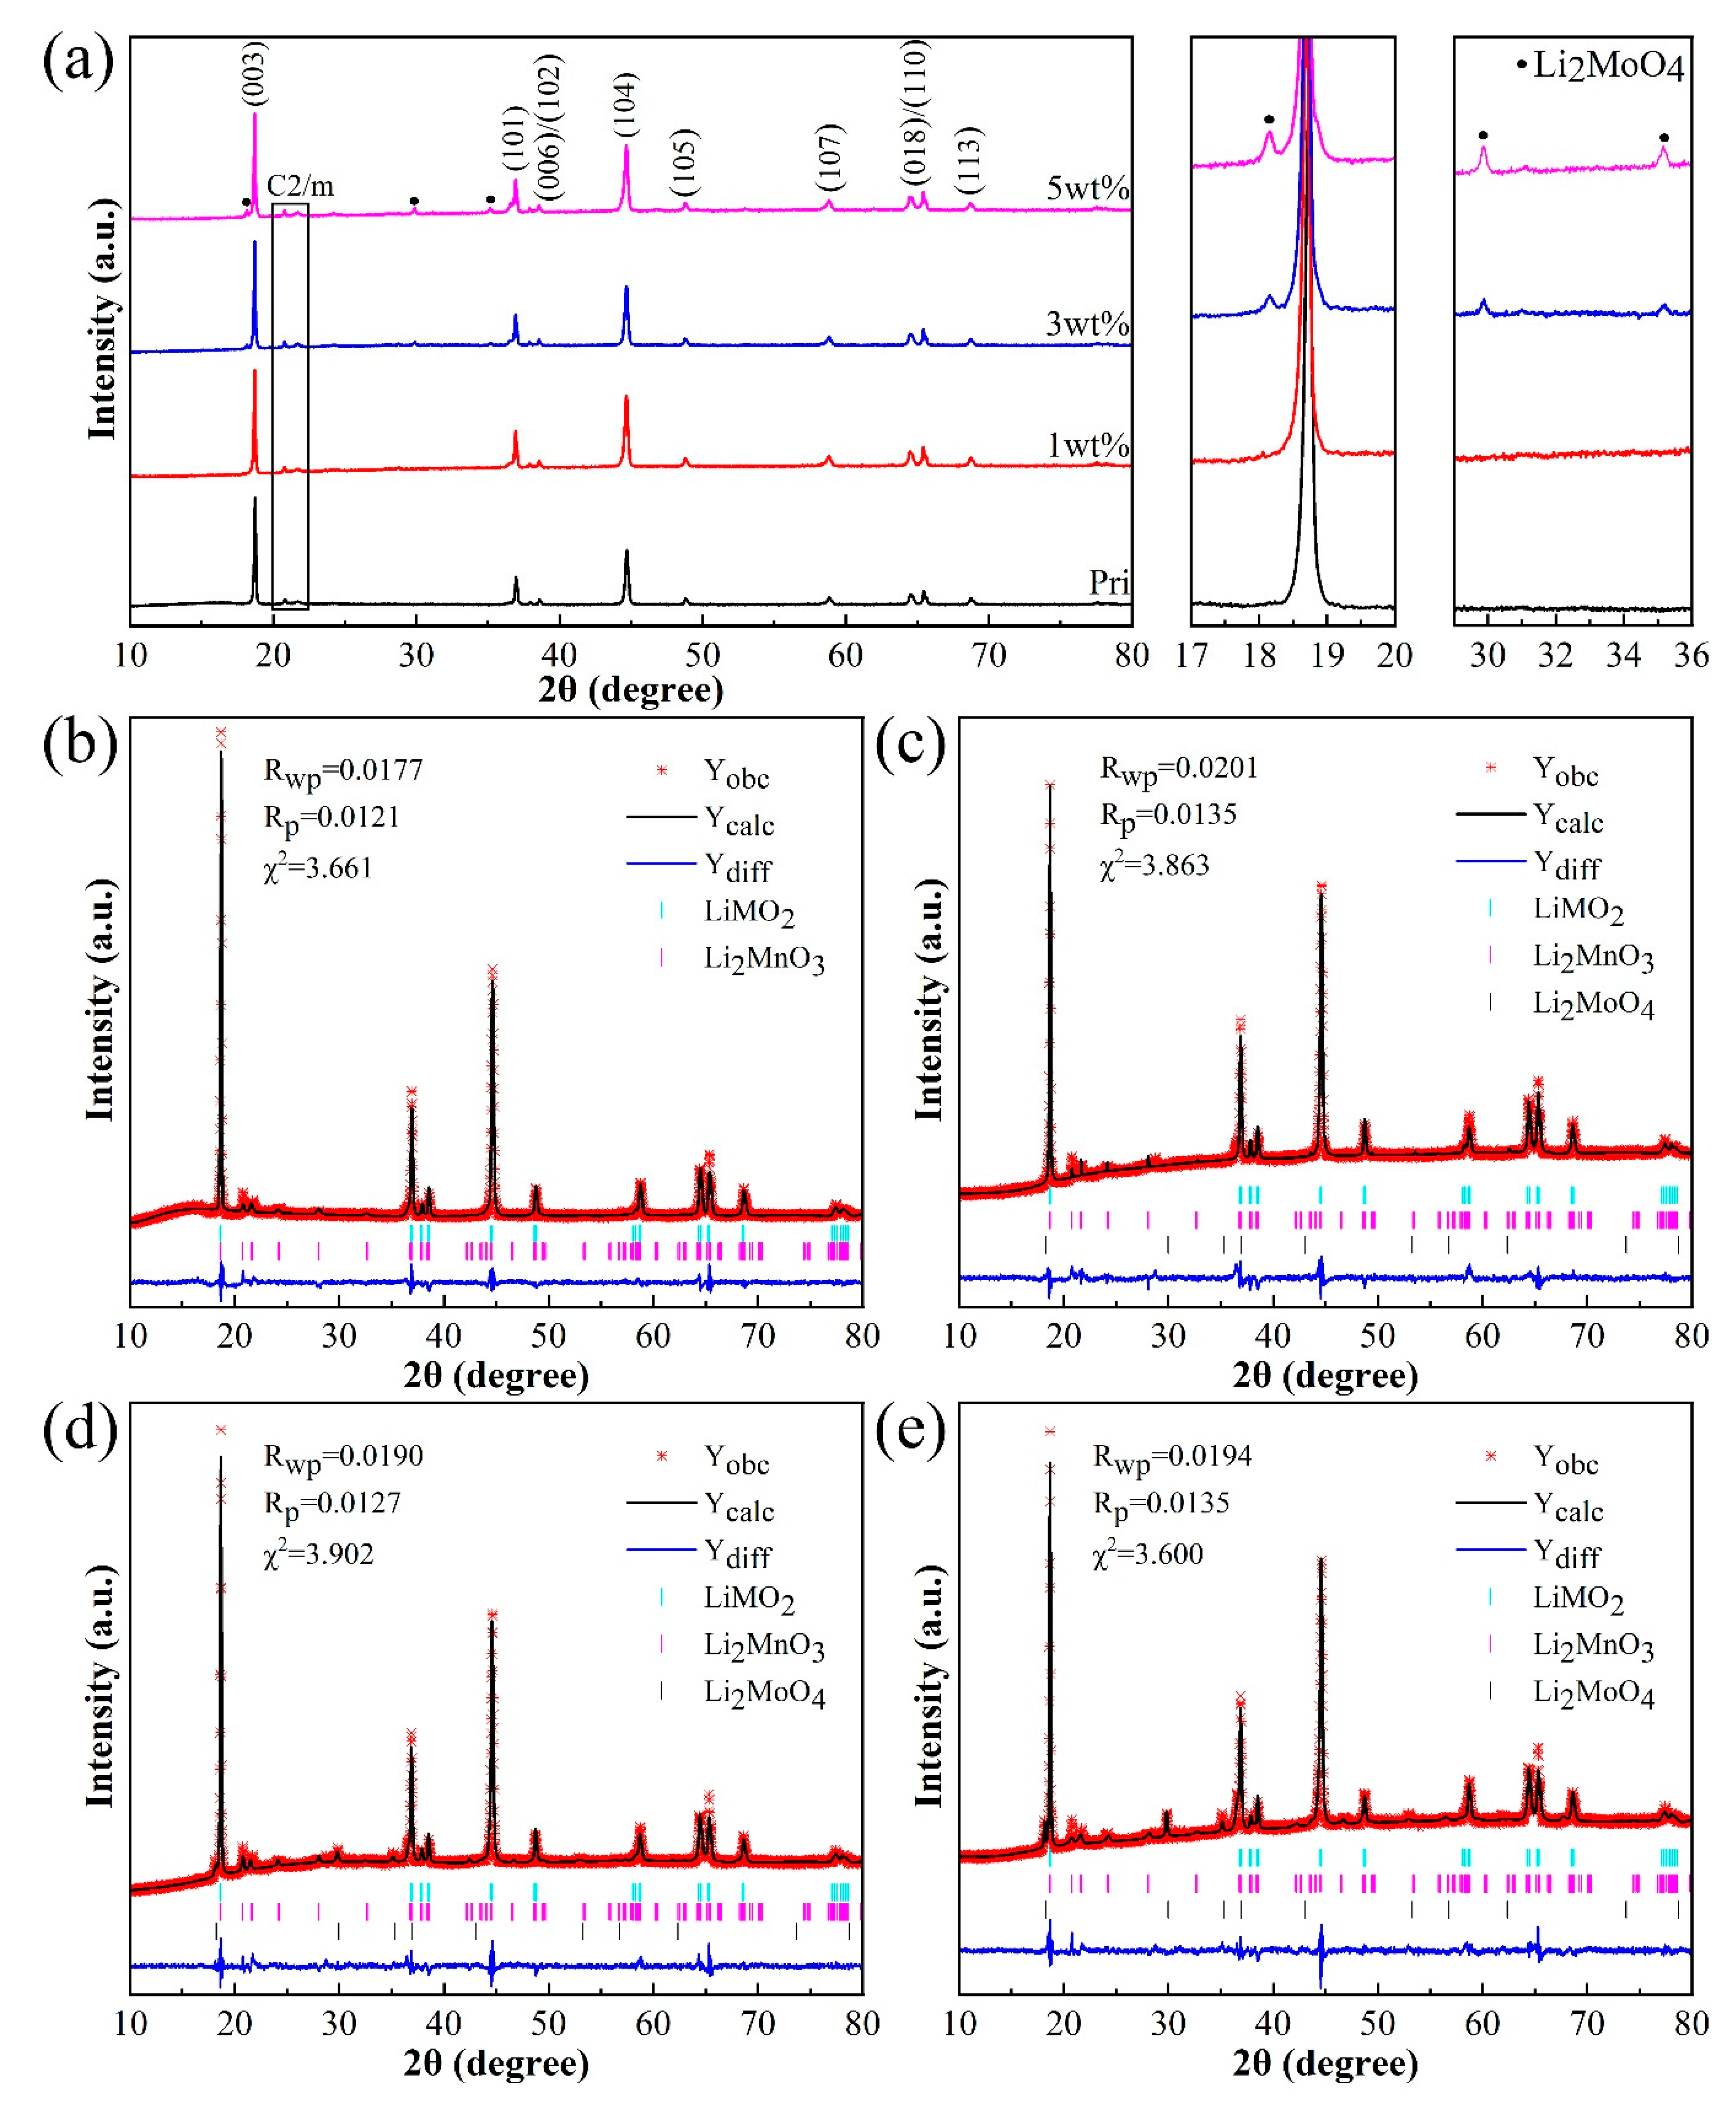
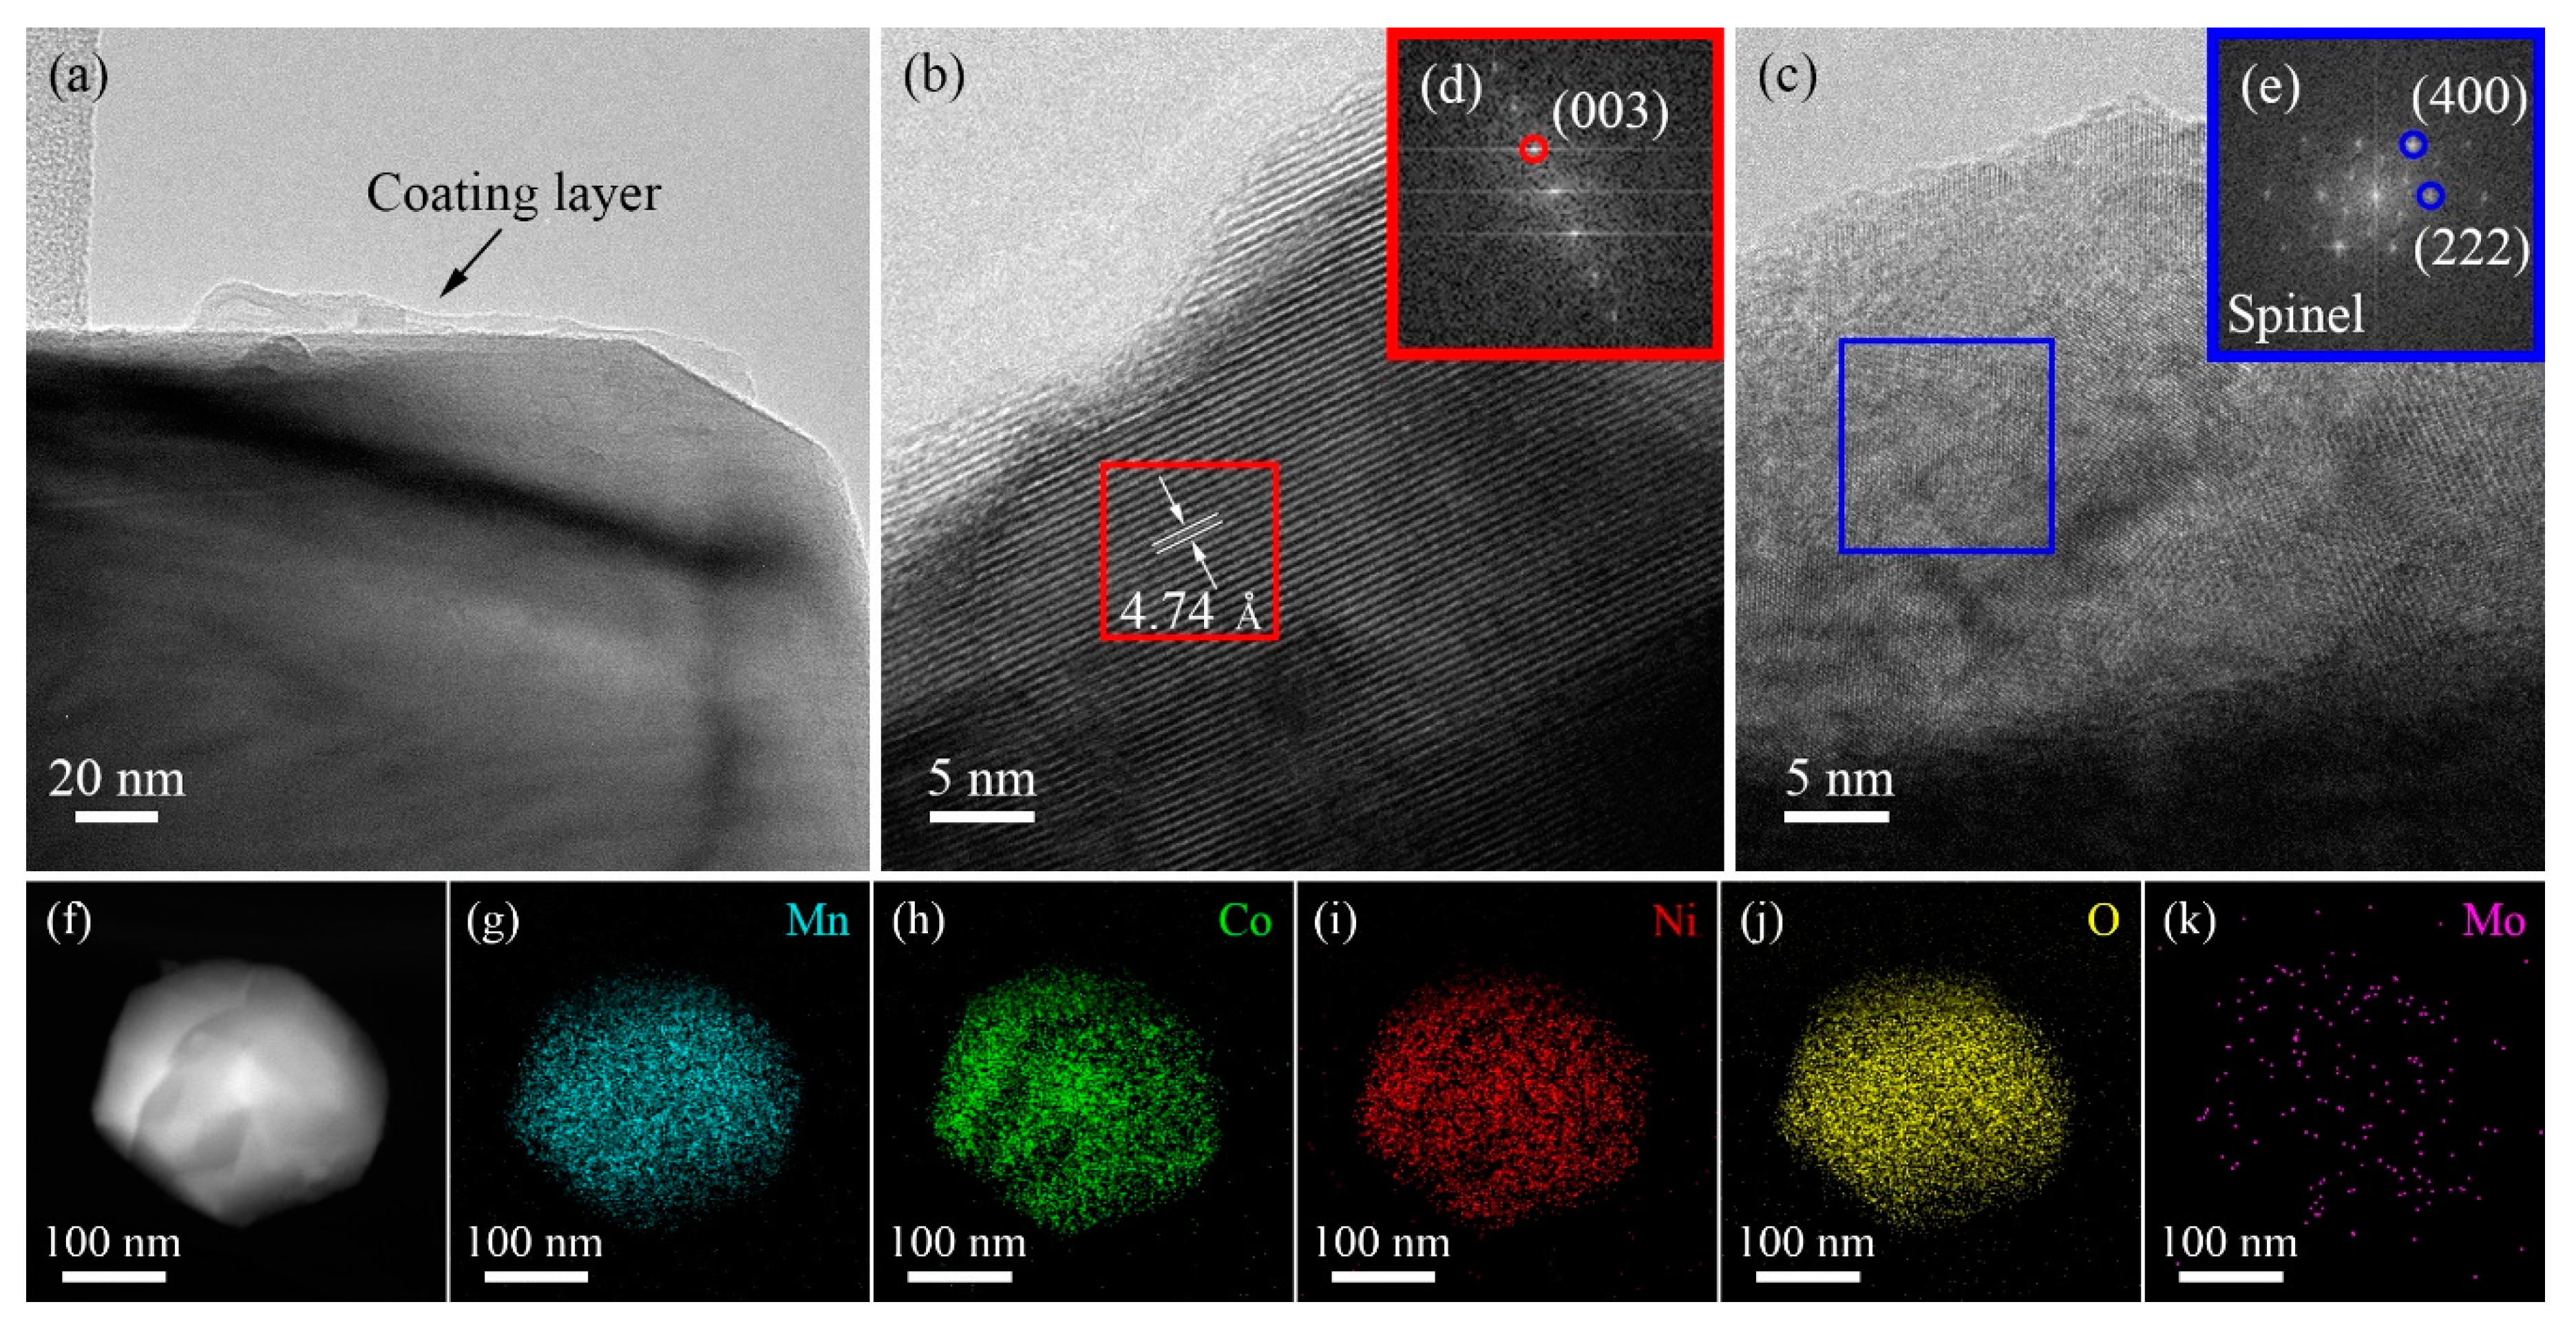
3.1. Material Characterizations
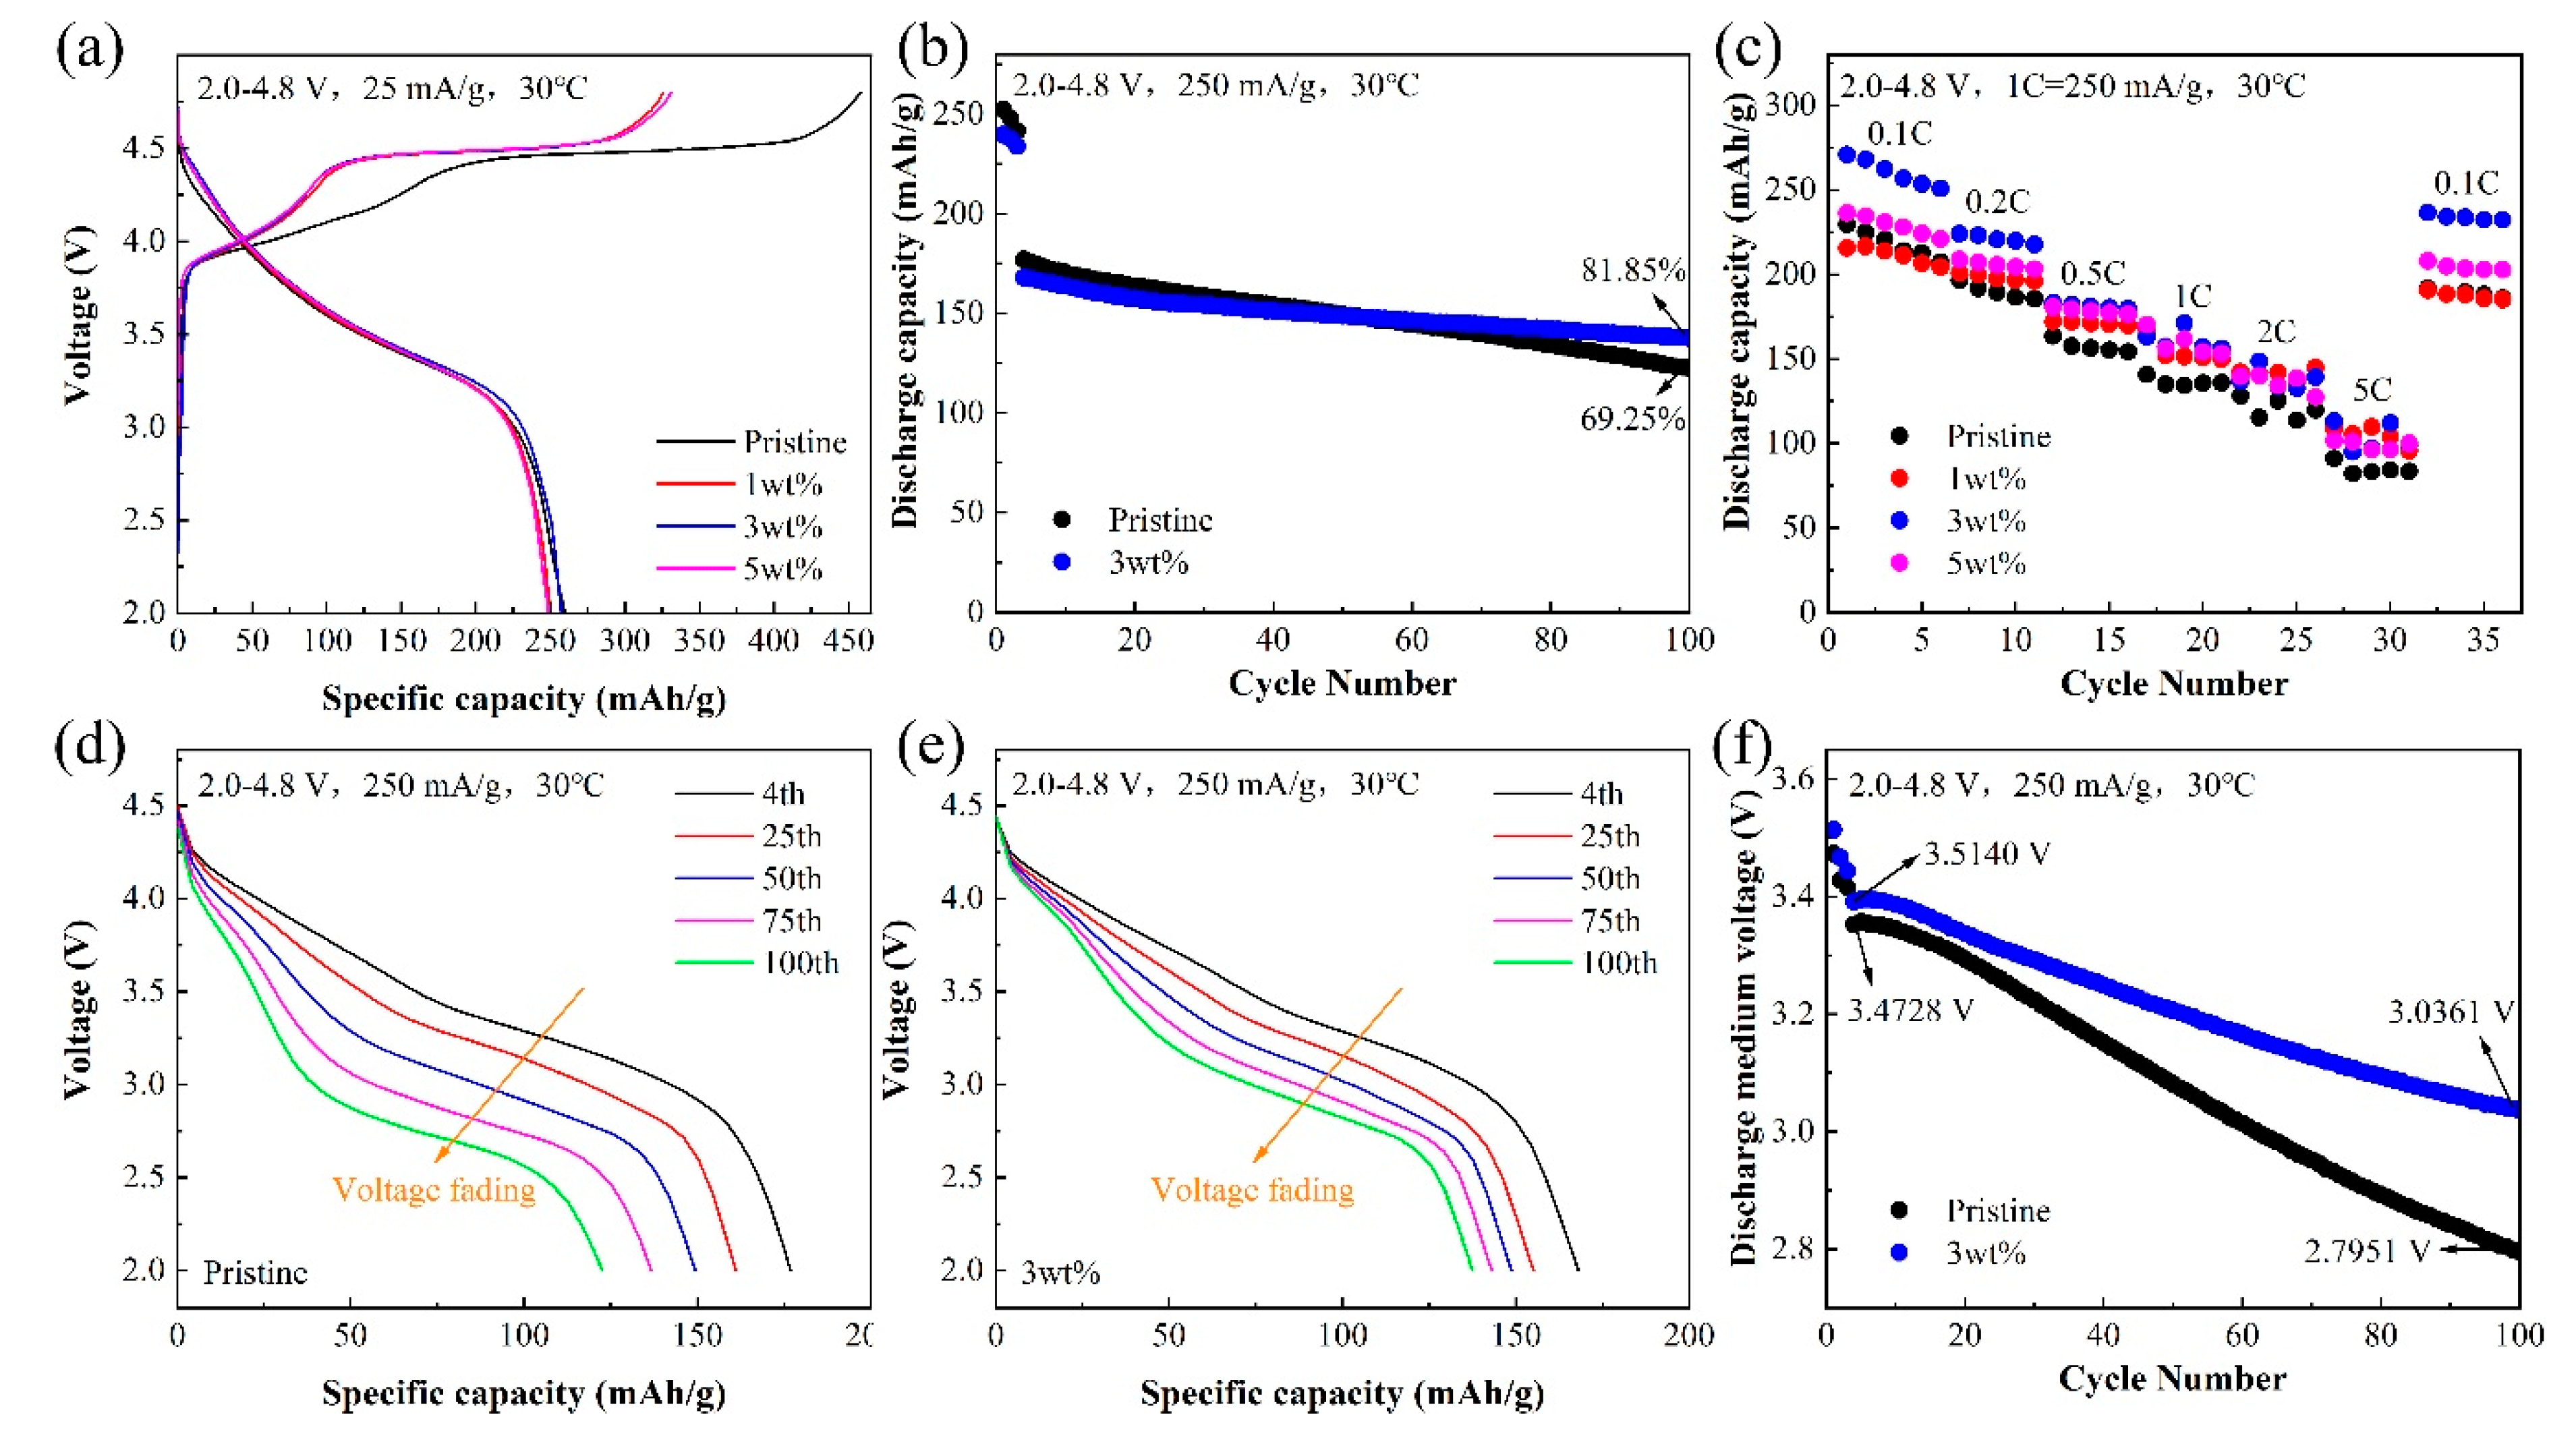
3.2. Electrochemical Performances

4. Conclusions
Supplementary Materials
Author Contributions
Funding
Institutional Review Board Statement
Informed Consent Statement
Data Availability Statement
Conflicts of Interest
References
- Liu J, Wang J, Ni Y, Zhang K, Cheng F, Chen J. Recent breakthroughs and perspectives of high-energy layered oxide cathode materials for lithium ion batteries. Materials Today 2021, 43, 132–165. [Google Scholar] [CrossRef]
- Wang M J, Yu F D, Sun G, Wang J, Zhou J G, Gu D M, Wang Z B. Co-regulating the surface and bulk structure of Li-rich layered oxides by a phosphor doping strategy for high-energy Li-ion batteries. Journal of Materials Chemistry A 2019, 7, 8302–8314. [Google Scholar] [CrossRef]
- Lin T G, Seaby T, Hu Y X, Ding S S, Liu Y, Luo B, Wang L Z. Understanding and Control of Activation Process of Lithium-Rich Cathode Materials. Electrochemical Energy Reviews 2022, 5 (Suppl. 2). [Google Scholar] [CrossRef]
- Mei J, Chen Y Z, Xu W J, He W, Wang L, Xie Q S, Peng D L. Multi-strategy synergistic Li-rich layered oxides with fluorine-doping and surface coating of oxygen vacancy bearing CeO2 to achieve excellent cycling stability. Chemical Engineering Journal 2022, 431. [Google Scholar] [CrossRef]
- Zheng H F, Hu Z Y, Liu P F, Xu W J, Xie Q S, He W, Luo Q, Wang L S, Gu D D, Qu B H, Zhu Z Z, Peng D L. Surface Ni-rich engineering towards highly stable Li1.2Mn0.54Ni0.13Co0.13O2 cathode materials. Energy Storage Materials 2020, 25, 76–85. [Google Scholar] [CrossRef]
- Huang Z, Xiong T F, Lin X, Tian M Y, Zeng W H, He J W, Shi M Y, Li J N, Zhang G B, Mai L Q, Mu S C. Carbon dioxide directly induced oxygen vacancy in the surface of lithium-rich layered oxides for high-energy lithium storage. Journal of Power Sources 2019, 432, 8–15. [Google Scholar] [CrossRef]
- Liu S, Liu Z P, Shen X, Li W H, Gao Y R, Banis M N, Li M S, Chen K, Zhu L, Yu R C, Wang Z X, Sun X L, Lu G, Kong Q Y, Bai X D, Chen L Q. Surface Doping to Enhance Structural Integrity and Performance of Li-Rich Layered Oxide. Advanced Energy Materials 2018, 8. [Google Scholar] [CrossRef]
- Ji X Q, Xia Q, Xu Y X, Feng H L, Wang P F, Tan Q Q. A review on progress of lithium-rich manganese-based cathodes for lithium ion batteries. Journal of Power Sources 2021, 487. [Google Scholar] [CrossRef]
- Luo D, Cui J X, Zhang B K, Fan J M, Liu P Z, Ding X K, Xie H X, Zhang Z H, Guo J J, Pan F, Lin Z. Ti-Based Surface Integrated Layer and Bulk Doping for Stable Voltage and Long Life of Li-Rich Layered Cathodes. Advanced Functional Materials 2021, 31. [Google Scholar] [CrossRef]
- He W, Guo W, Wu H, Lin L, Liu Q, Han X, Xie Q, Liu P, Zheng H, Wang L, Yu X, Peng D-L. Challenges and Recent Advances in High Capacity Li-Rich Cathode Materials for High Energy Density Lithium-Ion Batteries. Advanced Materials 2021, 33. [Google Scholar] [CrossRef]
- Peng J M, Li Y, Chen Z Q, Liang G M, Hu S J, Zhou T F, Zheng F H, Pan Q C, Wang H Q, Li Q Y, Liu J W, Guo Z P. Phase Compatible NiFe2O4 Coating Tunes Oxygen Redox in Li-Rich Layered Oxide. Acs Nano 2021, 15, 11607–11618. [Google Scholar] [CrossRef] [PubMed]
- Kim J M, Zhang X H, Zhang J G, Manthiram A, Meng Y S, Xu W. A review on the stability and surface modification of layered transition-metal oxide cathodes. Materials Today 2021, 46, 155–182. [Google Scholar] [CrossRef]
- Hall D S, Gauthier R, Eldesoky A, Murray V S, Dahn J R. New Chemical Insights into the Beneficial Role of Al2O3 Cathode Coatings in Lithium-ion Cells. Acs Applied Materials & Interfaces 2019, 11, 14095–14100. [Google Scholar]
- Zhou Z W, Luo Z Y, He Z J, Zheng J C, Li Y J, Yan C, Mao J. Suppress voltage decay of lithium-rich materials by coating layers with different crystalline states. Journal of Energy Chemistry 2021, 60, 591–598. [Google Scholar] [CrossRef]
- Zheng J M, Gu M, Xiao J, Polzin B J, Yan P, Chen X L, Wang C M, Zhang J G. Functioning Mechanism of AlF3 Coating on the Li- and Mn-Rich Cathode Materials. Chemistry of Materials 2014, 26, 6320–6327. [Google Scholar] [CrossRef]
- Ding X, Li Y X, Chen F, He X D, Yasmin A, Hu Q, Wen Z Y, Chen C H. In situ formation of LiF decoration on a Li-rich material for long-cycle life and superb low-temperature performance. Journal of Materials Chemistry A 2019, 7, 11513–11519. [Google Scholar] [CrossRef]
- Zheng F H, Yang C H, Xiong X H, Xiong J W, Hu R Z, Chen Y, Liu M L. Nanoscale Surface Modification of Lithium-Rich Layered-Oxide Composite Cathodes for Suppressing Voltage Fade. Angewandte Chemie-International Edition 2015, 54, 13058–13062. [Google Scholar] [CrossRef]
- Zhang X D, Shi J L, Liang J Y, Yin Y X, Zhang J N, Yu X Q, Guo Y G. Suppressing Surface Lattice Oxygen Release of Li-Rich Cathode Materials via Heterostructured Spinel Li4Mn5O12 Coating. Advanced Materials 2018, 30. [Google Scholar] [CrossRef]
- Toby B, H. EXPGUI, a graphical user interface for GSAS. Journal of Applied Crystallography 2001, 34, 210–213. [Google Scholar] [CrossRef]
- Pang W K, Lin H F, Peterson V K, Lu C Z, Liu C E, Liao S C, Chen J M. Effects of Fluorine and Chromium Doping on the Performance of Lithium-Rich Li1+XMO2 (M=Ni, Mn, Co) Positive Electrodes. Chemistry of Materials 2017, 29, 10299–10311. [Google Scholar] [CrossRef]
- Zhu Z, Gao R, Waluyo I, Dong Y H, Hunt A, Lee J, Li J. Stabilized Co-Free Li-Rich Oxide Cathode Particles with An Artificial Surface Prereconstruction. Advanced Energy Materials 2020, 10. [Google Scholar] [CrossRef]
- Yi L H, Liu Z S, Yu R Z, Zhao C X, Peng H F, Liu M H, Wu B, Chen M F, Wang X Y. Li-Rich Layered/Spinel Heterostructured Special Morphology Cathode Material with High Rate Capability for Li-Ion Batteries. Acs Sustainable Chemistry & Engineering 2017, 5, 11005–11015. [Google Scholar] [CrossRef]
- Lou M, Zhong H, Yu H T, Fan S S, Xie Y, Yi T F. Li1.2Mn0.54Ni0.13Co0.13O2 hollow hierarchical microspheres with enhanced electrochemical performances as cathode material for lithium-ion battery application. Electrochimica Acta 2017, 237, 217–226. [Google Scholar] [CrossRef]
- Zheng H F, Zhang C Y, Zhang Y G, Lin L, Liu P F, Wang L S, Wei Q L, Lin J, Sa B S, Xie Q S, Peng D L. Manipulating the Local Electronic Structure in Li-Rich Layered Cathode Towards Superior Electrochemical Performance. Advanced Functional Materials 2021, 31. [Google Scholar] [CrossRef]
- Teng T, Xiao L, Shen L, Ran J J, Xiang G, Zhu Y R, Chen H. Simultaneous Li2MoO4 coating and Mo6+ doping improves the structural stability and electrochemical properties of nickel-rich LiNi0.83Co0.11Mn0.06O2. Applied Surface Science 2022, 601. [Google Scholar] [CrossRef]
- Yang P H, Zhang S C, Wei Z W, Guan X G, Xia J, Huang D Y, Xing Y L, He J, Wen B H, Liu B, Xu H Z. A Gradient Doping Strategy toward Superior Electrochemical Performance for Li-Rich Mn-Based Cathode Materials. Small 2023. [Google Scholar] [CrossRef]
- Zheng J, Deng S N, Shi Z C, Xu H J, Xu H, Deng Y F, Zhang Z, Chen G H. The effects of persulfate treatment on the electrochemical properties of Li[Li0.2Mn0.54Ni0.13Co0.13]O2 cathode material. Journal of Power Sources 2013, 221, 108–113. [Google Scholar] [CrossRef]
- Guo W B, Zhang C Y, Zhang Y G, Lin L, He W, Xie Q S, Sa B S, Wang L S, Peng D L. A Universal Strategy toward the Precise Regulation of Initial Coulombic Efficiency of Li-Rich Mn-Based Cathode Materials. Advanced Materials 2021, 33. [Google Scholar] [CrossRef]
- Zhu W, Tai Z G, Shu C Y, Chong S K, Guo S W, Ji L J, Chen Y Z, Liu Y N. The superior electrochemical performance of a Li-rich layered cathode material with Li-rich spinel Li4Mn5O12 and MgF2 double surface modifications. Journal of Materials Chemistry A 2020, 8, 7991–8001. [Google Scholar] [CrossRef]
- Ren X Y, Du J L, Pu Z H, Wang R B, Gan L, Wu Z. Facile synthesis of Li2MoO4 coated LiNi1/3Co1/3Mn1/3O2 composite as a novel cathode for high-temperature lithium batteries. Ionics 2020, 26, 1617–1627. [Google Scholar] [CrossRef]
- Chen J X, Huang Z, Zeng W H, Ma J J, Cao F, Wang T T, Tian W X, Mu S C. Surface Engineering and Trace Cobalt Doping Suppress Overall Li/Ni Mixing of Li-rich Mn-based Cathode Materials. Acs Applied Materials & Interfaces 2022, 14, 6649–6657. [Google Scholar] [CrossRef]


| Samples | I(003)I(104) | c | a | c/a | Ni2+in Li layer (%) | Li2MoO4 content (wt%) |
| Pristine | 1.692 | 14.245782 | 2.854563 | 4.990529899 | 3.83 | 0 |
| 1wt% | 1.258 | 14.257465 | 2.855348 | 4.993249509 | 5.36 | - |
| 3wt% | 1.526 | 14.248178 | 2.854860 | 4.990849989 | 3.88 | 3.0158 |
| 5wt% | 1.332 | 14.262967 | 2.856606 | 4.992976630 | 4.30 | 4.7180 |
Disclaimer/Publisher’s Note: The statements, opinions and data contained in all publications are solely those of the individual author(s) and contributor(s) and not of MDPI and/or the editor(s). MDPI and/or the editor(s) disclaim responsibility for any injury to people or property resulting from any ideas, methods, instructions or products referred to in the content. |
© 2023 by the authors. Licensee MDPI, Basel, Switzerland. This article is an open access article distributed under the terms and conditions of the Creative Commons Attribution (CC BY) license (http://creativecommons.org/licenses/by/4.0/).


