Preprint
Article

Ballast Pick-Up Velocity in the Vertical Pipe of an Excavating Machine Slurry System

Altmetrics

Downloads

101

Views

18

Comments

0

This version is not peer-reviewed

Submitted:

02 July 2023

Posted:

04 July 2023

You are already at the latest version

Alerts
Abstract
Abstract:Ballast pick-up velocity is a crucial parameter in the design of a slurry system in excavating devices, it influences transportation stability, safety, and economy of the system. In this study, a vertical pipe hydraulic experiment with different ballast sizes under water condition was conducted to investigate the ballast pick-up velocity in the shield slurry system. Thereafter, the coupling method of computational fluid dynamics and the discrete element method (CFD-DEM) was employed to establish a numerical model of the ballast pick-up velocity in the shield slurry system, and its applicability was verified by comparing the experiment results. Additionally, the ballast pick-up process under actual working conditions was studied, and the influence of ballast size and concentration on pick-up velocity was investigated. Overall, the primary findings of the study are as follows: 1) The numerical method can be applied to predict both the single ballast and ballast group pick-up velocity. 2) The pick-up process of the ballast group can be divided into four stages. 3) The conveying velocity of the ballast should be higher than the pick-up velocity of the single ballast to facilitate smooth discharge. 4) For a certain increase in ballast concentration, the pick-up velocity tends to be stable.
Keywords: 
Subject: Engineering  -   Mechanical Engineering

1. Introduction

With an increasing demand for utilising underground spaces, the application of various excavating devices is growing rapidly. During excavations, a slurry system is widely used to transport the soil excavated underground in front of the cutter-head to the surface. The slurry shield machine and shaft boring machine commonly adopt a slurry system to manage waste ballast. The slurry shield machine conducts excavations in the horizontal direction and the shaft boring machine vertically excavates to a target depth. For both excavating machines, the slurry system can be divided into two parts: the tunnel section and the ground section. Applying the slurry pump as the driver and the slurry as the vehicle, the excavated ballast is absorbed and delivered along the transporting pipe. in the ground section, the slurry system filters out the ballast, which enables the reuse of the slurry.
A schematic of the slurry system is shown in Figure 1. In the slurry shield machine, shown in Figure 1 (a), the pipe of the slurry system is primarily arranged horizontally, while the vertical pipes are generally placed between the tunnel and ground sections at a height of 10-30 m. In the shaft boring machine, shown in Figure 1 (b), the pipes are primarily arranged vertically, with a height equal to the excavation depth.
Compared with ballast transportation in horizontal pipes, vertical pipes require a significantly higher velocity and energy consumption to lift the ballast, owing to the pressure loss. An insufficient capacity to carry the ballast in the vertical pipe may result in pipe jams, abnormal wear, and excess pressure loss. Therefore, studying the pick-up process of ballast in a vertical pipe is essential for the design of the slurry system.
In the pipe system hydraulic transportation design, pressure loss and ballast pick-up velocity must be involved. However, when the flow rate is much greater than the ballast pick-up velocity, excess energy is consumed, which reduces the economic benefits. Conversely, if the flow rate is less than the ballast pick-up velocity, the ballast would deposit at the bottom of the pipe, which limits the safe operation of the tunnelling project. Therefore, understanding the ballast pick-up velocity is important for the design of the pipeline conveying system.
Many experimental and numerical studies have been conducted on the ballast pick-up velocity in pipes. Van Wijk et al. [1] reported that the mineral pick-up velocity significantly impacts the transportation stability of vertical pipes in deep-sea mining. Zhang et al. [2] studied the ballast pick-up velocity and blockage mechanisms in vertical pipes by monitoring the mass flow rate, pressure fluctuation, and motion state information. Liu et al. [3] studied the influence of lateral vibrations on the ballast pick-up velocity in vertical pipelines and concluded that the ballast pick-up velocity significantly impacts the pipeline system’s stability, safety, and energy consumption rate. Several studies [4,5,6] have investigated the ballast pick-up velocity in horizontal pipes by building a pneumatic conveying platform and analysing the influences of the pipe diameter, ballast shape, and stacking height. Other studies [7,8,9] have determined the ballast pick-up velocity using the weighing method and the image method, based on the pipeline experiment platform. In addition, experimental studies [10,11,12,13,14,15] have been conducted on the ballast pick-up velocity in the gas-solid two-phase flow system, where the impact of physical properties and motion state on the ballast pick-up velocity and the force characteristics were analysed.
In summary, the ballast pick-up velocity has been evaluated primarily through experimental studies by building a corresponding experimental platform through the weighing and graph method. As is evident from the previous research, the gas-solid two-phase flow system has been studied, while the object was mainly the horizontal pipe; furthermore, water was considered as the transportation medium. However, limited research has been conducted on vertical pipes with a slurry medium. Although ballast pick-up velocity results were directly observed via experimental methods, there were certain limitations. Different experimental platforms were required for other observed objects, which utilise vast resources and funds. To guarantee the accuracy of experimental results, the media was often required to be transparent. Furthermore, measurement methods and instruments required high specifications. Under actual working conditions, the conveying medium in the pipeline was always turbid and accompanying ballasts of a much larger size. Therefore, the existing research results cannot be directly used to predict the ballast incipient velocity under actual conditions.
With the rapid development of computer technology, various numerical simulation methods [16] have been applied to solve solid-liquid two-phase flow problems. Two methods, namely the Euler-Euler method and the Euler-Lagrangian method, have been commonly used to solve fluid-solid problems. The Euler-Euler multiphase model offers the advantage of considering the ballast volume effect on the fluid. Although there is limited research on the ballast pick-up velocity in pipes employing this method, there are more applications for ballast movement in multiphase flows. For example, Fatahi et al. [17] obtained the trajectory, residence time, and velocity of minerals in the machine, and Zhou et al. [18] obtained the volume fraction and the axial velocity of the ballast in the vertical pipe.
In addition, Zeng et al. [19] used the coupling method of computational fluid dynamics and the discrete element method (CFD-DEM) to obtain the influence of the ballast shape, ballast movement trajectory, and gas flow field distribution on the wear characteristics of the natural gas pipeline. Moreover, applying this approach, Petit et al. [20] studied the influence of airflow velocity on the result of the sand screening. Li et al. [21] also studied the ballast adsorption phenomenon and flow process in the gas-solid two-phase flow vortex through this method. Li et al. [22] introduced a specific application of the CFD-DEM method to transport ballast adsorbents in gas-cooled reactors in nuclear engineering. Naukkarinen et al. [23] used this method to study the ballast filtration process of the ion membrane. Furthermore, Zhao et al. [24] proposed a new wall roughness model and discrete random walk model based on this method to study the ballast flow characteristics in the turbulent flow of the horizontal tube under the dilute phase and dense phase conditions. Uzi et al. [25] applied this method to study the sodium chloride dissolution process in the brine, which proved the adaptability when analysing the ballast transport characteristics under the dilute phase flow conditions. Vango et al. [26] used the CFD-DEM unresolved method to study the flow characteristics of the fluidised bed under the dense phase flow conditions. Based on the time relaxation, a smoothing model was established with the strengthened robustness.
In summary, compared with experiments, simulation methods offer distinct advantages in terms of the completeness and convenience of capturing ballast movement information, scalability of the model, and applicability of working conditions. Therefore, in this study, the CFD-DEM method was used to investigate the ballast pick-up velocity in the vertical pipeline with the shield slurry system. First, an experiment of the ballast pick-up velocity in water was performed. Following the investigation, a simulation model of the single ballast and ballast group pick-up velocity was constructed, which was verified using the experimental results. Finally, based on the numerical simulation method, the incipient motion of the ballast group in the slurry was analysed to conduct a further study related to the influence of the ballast size and concentration on the pick-up velocity.

2. Ballast pick-up velocity theoretical modelling

2.1. Ballast motion model

Based on the discrete phase model, the ballast in the vertical pipeline interacts with the slurry, ballast, and inner pipe wall during the pick-up process. The translation and rotation of the ballast are accomplished by solving the Newton equation of motion as follows:
m b , i d u b , i dt = j F C , ij + F bs , i + F g , i
I b , i d ω b , i d t = ( M t , i j + M r , i j )
where ub,i and ωb,i are the ith ballast translational and angular velocity, respectively; mb,i is the ballast mass; FC,ij represents the contact force between the ballast-ballast and the ballast-pipe, where the contact force follows the Hertz-Mindlin non-slip model [27]; Fbs,i is the interaction force between the slurry and the ballast, which is described later; Fg,i is the gravity of the ballast; Ib,i represents the ballast inertia moment; Mt,ij is the ballast tangential torque; Mr,ij is the ballast rolling friction torque.

2.2. Slurry flow model

Regarding the slurry flow in the vertical pipeline, the Euler-Euler multiphase flow model was chosen as the corresponding solution where the slurry was treated as a single continuous phase. Described by the volume-averaged governing equations, the slurry obeys the continuity and momentum equations.
The continuity equation is as follows.
t ( ε s ρ s ) + ( ε s ρ s u s ) = 0
The momentum equation is as follows.
t ( ε s ρ s u s ) + ( ε s ρ s u s u s ) = ε s p + ( ε s τ s ) + ε s ρ s g + S
where εs is the slurry volume fraction; ρs is the slurry density; us represents the slurry velocity; p represents the slurry pressure; τs indicates the slurry shear stress; g is the acceleration of gravity; S reflects a term of the momentum exchange between ballast and slurry in a grid element.

2.3. Slurry-ballast interaction

The solution operations for the fluid phase and ballast phase are coupled together by the slurry volume fraction εs and the interaction force Fbs,i. In this study, the minimum mesh size of the numerical model was 15 mm, while the size of the target ballast was in the range of 15-75 mm. The slurry volume fraction εs was calculated by the porous model [28], which has been proven to be applicable when the ballast size is larger than the fluid grid. The interaction force between the ballast and slurry on the unit grid is given as:
S = i = 1 m F bs , i Δ V = i = 1 m ( F d , i + F p , i + F S , i + F M , i ) Δ V
where ∆V is the calculated grid volume, m indicates the number of ballasts in a single grid. The interaction force Fbs,i contains variable forces; considering a series of forces such as the drag force Fd,i, pressure gradient force Fp,i, Saffman lift force FS,i, and the Magnus lift force FM,i, which plays an important role in solid-liquid flows [29].
The drag force Fd,i [30] can be calculated based on the free stream drag force model as follows.
F d , i = 0 . 125 π d b 2 C d ρ s | u bs rel | u bs rel
C d = { 24 / Re b 24 ( 1 . 0 + 0 . 15 Re b 0 . 687 ) / Re b 0 . 44 Re b 0 . 5 0 . 5 < Re b 1000 Re b > 1000
Re b = ε s ρ s d b | u bs rel | μ s
The pressure gradient force Fp,i [31] is written as follows.
F p , i = - V b d p dx = - V b ( ρ s g + ρ s u s d u s dx )
The Saffman lift force FS,i [32] is expressed as follows.
F S , i = 1.61 d b 2 ( μ s ρ s ) 1 / 2 | ω s | - 1 / 2 [ ( u s - u b ) × ( ω s ) ]
The Magnus lift force FM,i [33] is given by.
F M , i = 0 . 125 π d b 2 ρ s [ ( 0 . 5 ω s - ω b ) × ( u s - u b ) ]
where Cd is the drag coefficient; db is the ballast size; us is the slurry velocity; ub is the ballast velocity; ubsrel is the velocity difference between the slurry and ballast; Reb implies the ballast Reynolds number; μs is the slurry viscosity; ωs is the local fluid rotation, which is defined as ωs = ∇ × us; ωb is the ballast rotation.
The CFD-DEM coupling procedure was achieved using CFD software (ANSYS FLUENT 15.0) and DEM software (EDEM 2020). Firstly, the slurry flow field was solved in the CFD software. Subsequently, the DEM provided ballast position and velocity information, and the interaction force Fbs,i was calculated according to Eq. (6)-(11). In the EDEM software, the position and velocity of ballasts were updated based on Eqs. (1) and (2). According to updated ballast status, the slurry volume fraction εs was calculated. Finally, the interaction force Fbs,i reacted on the fluid phase, based on Newton’s third law.

2.4. Simulation model and boundary conditions

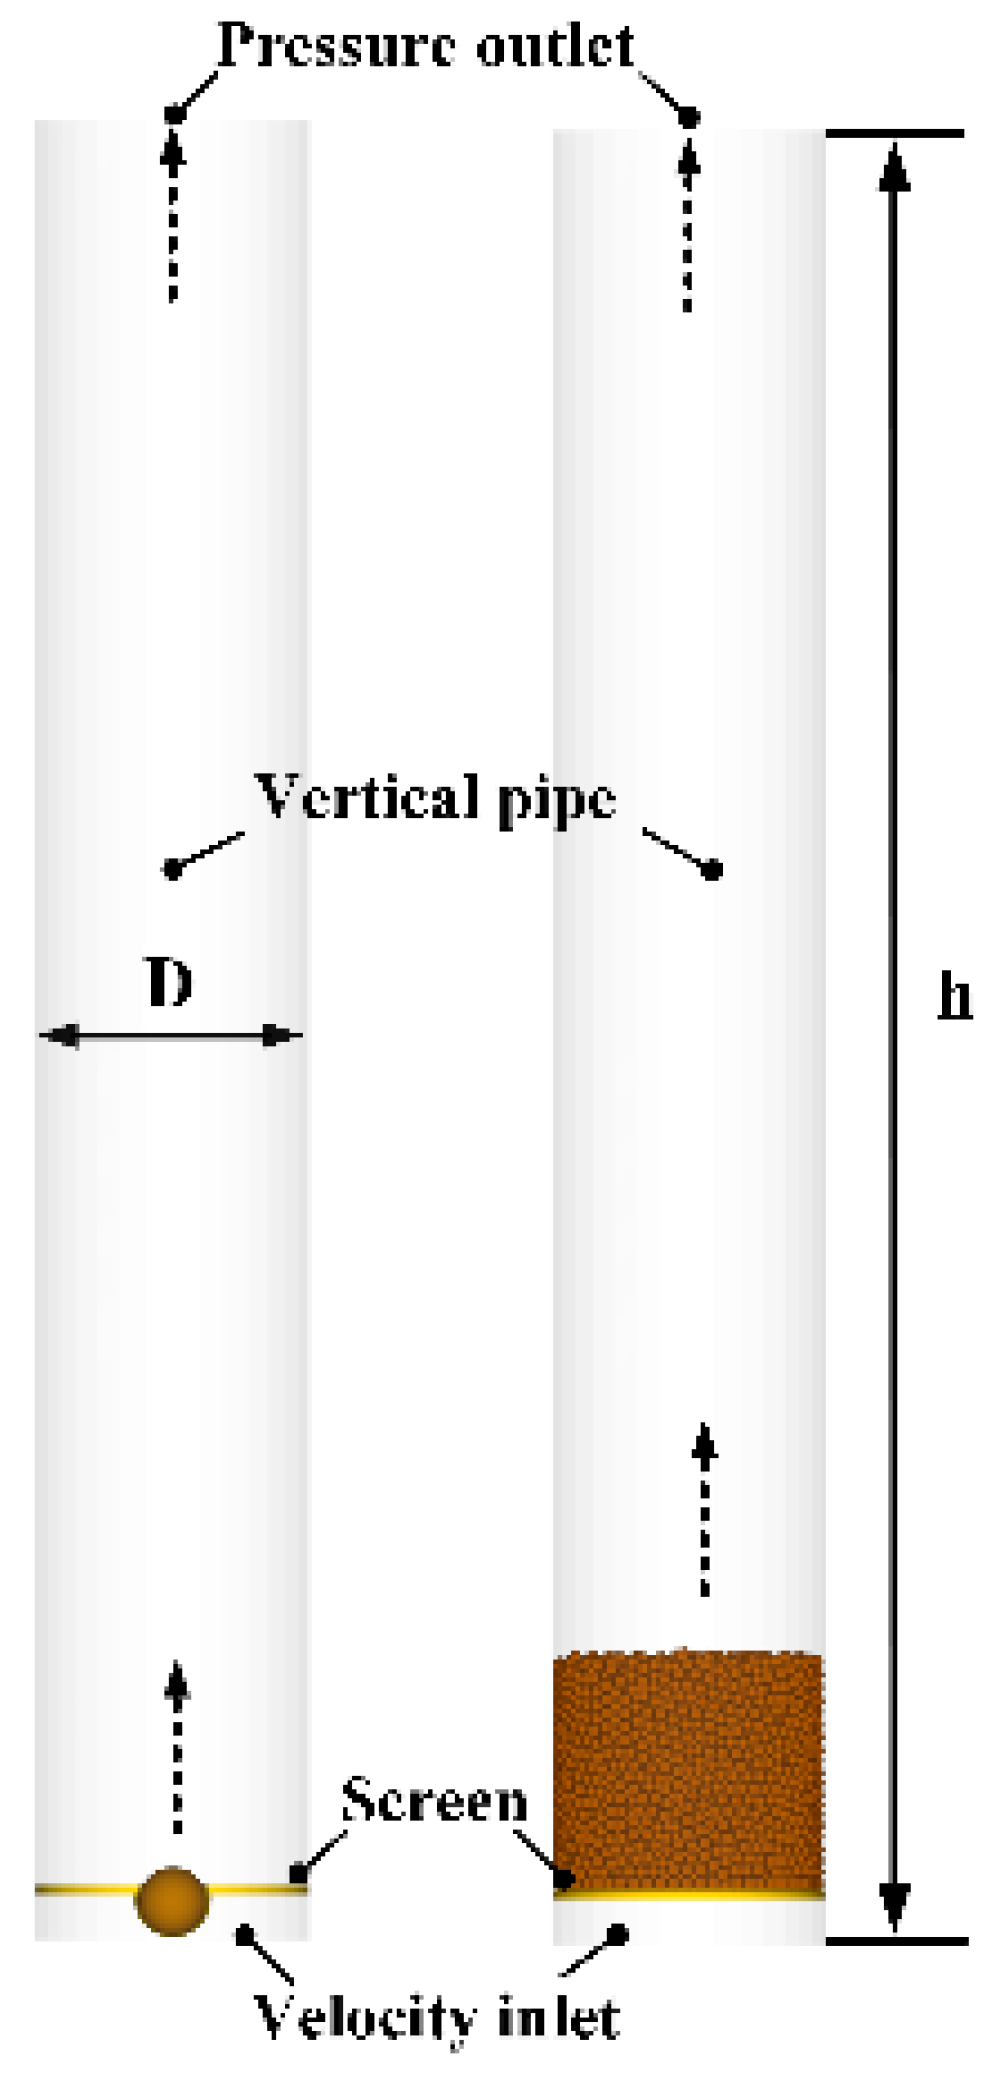
The numerical model of the ballast pick-up velocity in the vertical pipe was established by the CFD-DEM method, as shown in Figure 2. The model mainly consisted of two parts: a vertical pipe and the ballasts. The pipe diameter was 300 mm, and the bottom part of the pipe was set as the velocity inlet for both conditions, while the top part of the pipe was employed as the pressure outlet. Furthermore, the slurry density was 1100 kg/m3, and the lower limit value of slurry viscosity was 0.01 Pa⋅s. The slurry properties were tested using a rotation viscosimeter, which has been used in previous work [34]. The rheological property model for the slurry was given, as shown in Eq. (12), while the non-Newtonian fluid model (power-law model) in CFD software was used to describe the slurry rheological characteristics.
τ s = 2 . 1 γ 0 . 22
where γ shows the slurry shear rate; τs is shear stress.
The no-slip boundary was adopted for the inner pipe wall. Furthermore, a user-defined function was applied to define the inlet velocity at the bottom, while the API programme removed the ballast that flowed through the top outlet. The pipe entrance velocity was in the range of 0.3-3.5 m/s. The slurry Reynolds number Res was between 4950 and 115500, which implied that the slurry flow state in the pipe was turbulent. Therefore, the standardised k - ε turbulence model was used for the solution. The velocity and pressure of the numerical model were solved using the simple coupled method. The convective and diffusive terms were discretised by the second-order upwind and the second-order central difference method, respectively. The convergence criteria of the continuity and the energy residual were set as 10-5. To guarantee the stability of the convergence, the time calculation step size used in the CFD software was 0.004 s, while the time calculation applied in the DEM software had a step size of 0.0002 s.
As previously mentioned, a user-defined function was applied to endow the fluid at the inlet with a varying velocity over time. Because the ballast stress was in a state of dynamic equilibrium under this condition, for the single ballast, the judgement criteria for reaching the pick-up velocity was the transformation from static to upward movement to a dynamic force balance state of the ballast. In the simulation, for a single ballast, the pipe entrance velocity us was defined by the velocity function in Eq. (13). As a piecewise function, the entrance velocity was constant at 0 m/s during the period 0 < t < 0.5 s, and increased uniformly during the period t ≥ 0.5 s.
{ u s = 0 0 t 0.5 u s = 0.2 ( t 0.5 ) t 0.5
In terms of the ballast group, the pipe entrance velocity us was set as a periodic increasing function, where the initial velocity was 0 m/s. For every 2 s, the pipeline entrance velocity would be set stable, while for the next 1 s, the velocity would be increased by 0.05 m/s. Hence, for each 3 s, the velocity would be initially stable and then increased by 0.05 m/s for the next 3 s.
u s = 0.05 [ t + 1 3 ] 0 t 60 s
where [(T+1)/3] represents the integer part of (t+1)/3.

3. Model verification

To verify the accuracy of the simulation model, the ballast pick-up process was initially studied by experiments, following which the corresponding simulation model was constructed. Moreover, in the final stage, the simulation was compared with the experiment result.

3.1. Experimental scheme

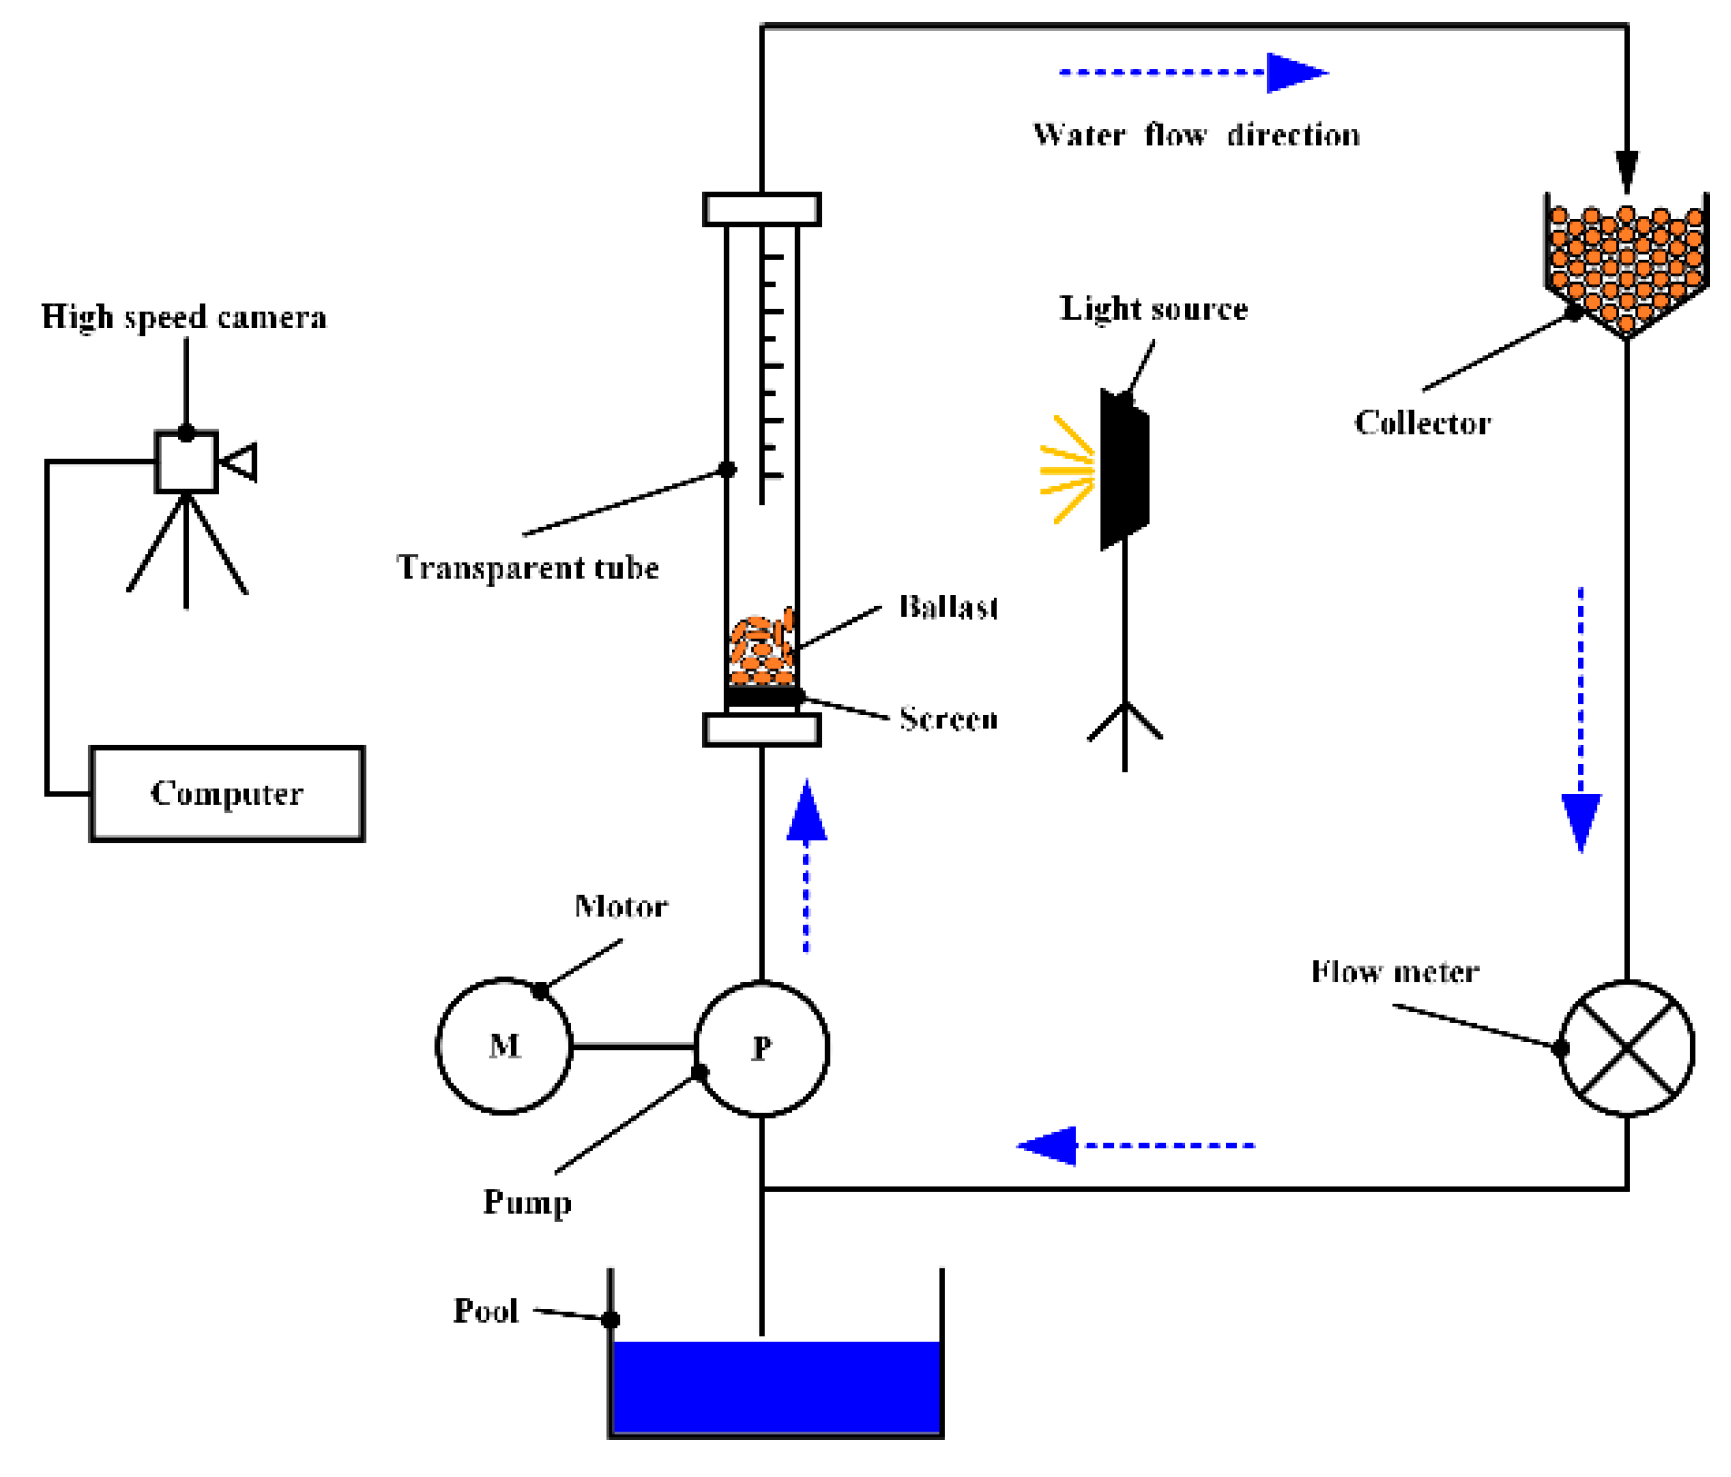
The experiments were conducted for the ballast with a diameter of 10-50 mm in the water to study the ballast pick-up velocity, with the vertical pipe diameter and lifting height being 200 mm and 4 m, respectively. For the convenience of observation, a 2 m long transparent plexiglass pipe was installed in the middle of the pipe. The water flow rate of the vertical pipe was increased as the initial step by adjusting the pump working frequency. Following the monitoring of the ballast motion state information via the high-speed camera (Phantom V310, Vision Research Inc.), the ballast pick-up velocity was determined by the image and weight-loss methods. The working principle of the experimental platform is shown in Figure 3.
The ballast in the experiment was made of cement to ensure the sphericity of the ballast, thereby leading to the difference in ballast density between the experiment and the working condition. With the approximately spherical ballast production of ballast size 10-50 mm by a granulator, the experimental parameters of hydraulic lifting for the single ballast and the ballast group are listed in Table 1.

3.2. Ballast group verification

In terms of the ballast group, first, the ballasts weighing 10 kg were arranged above the screen with the same ballast size. In line with the experiment, when the ballast could be lifted and distributed throughout the pipeline and more than 80 % of the ballast was transported out of the pipeline, the minimum corresponding water velocity was considered as the pick-up velocity of the ballast group. The ballast transport concentration is defined as follows:
Cv = V b V p × 100 %
where Vb is ballast volume in the initial stage of accumulation; Vp is the volume of the transparent plexiglass.
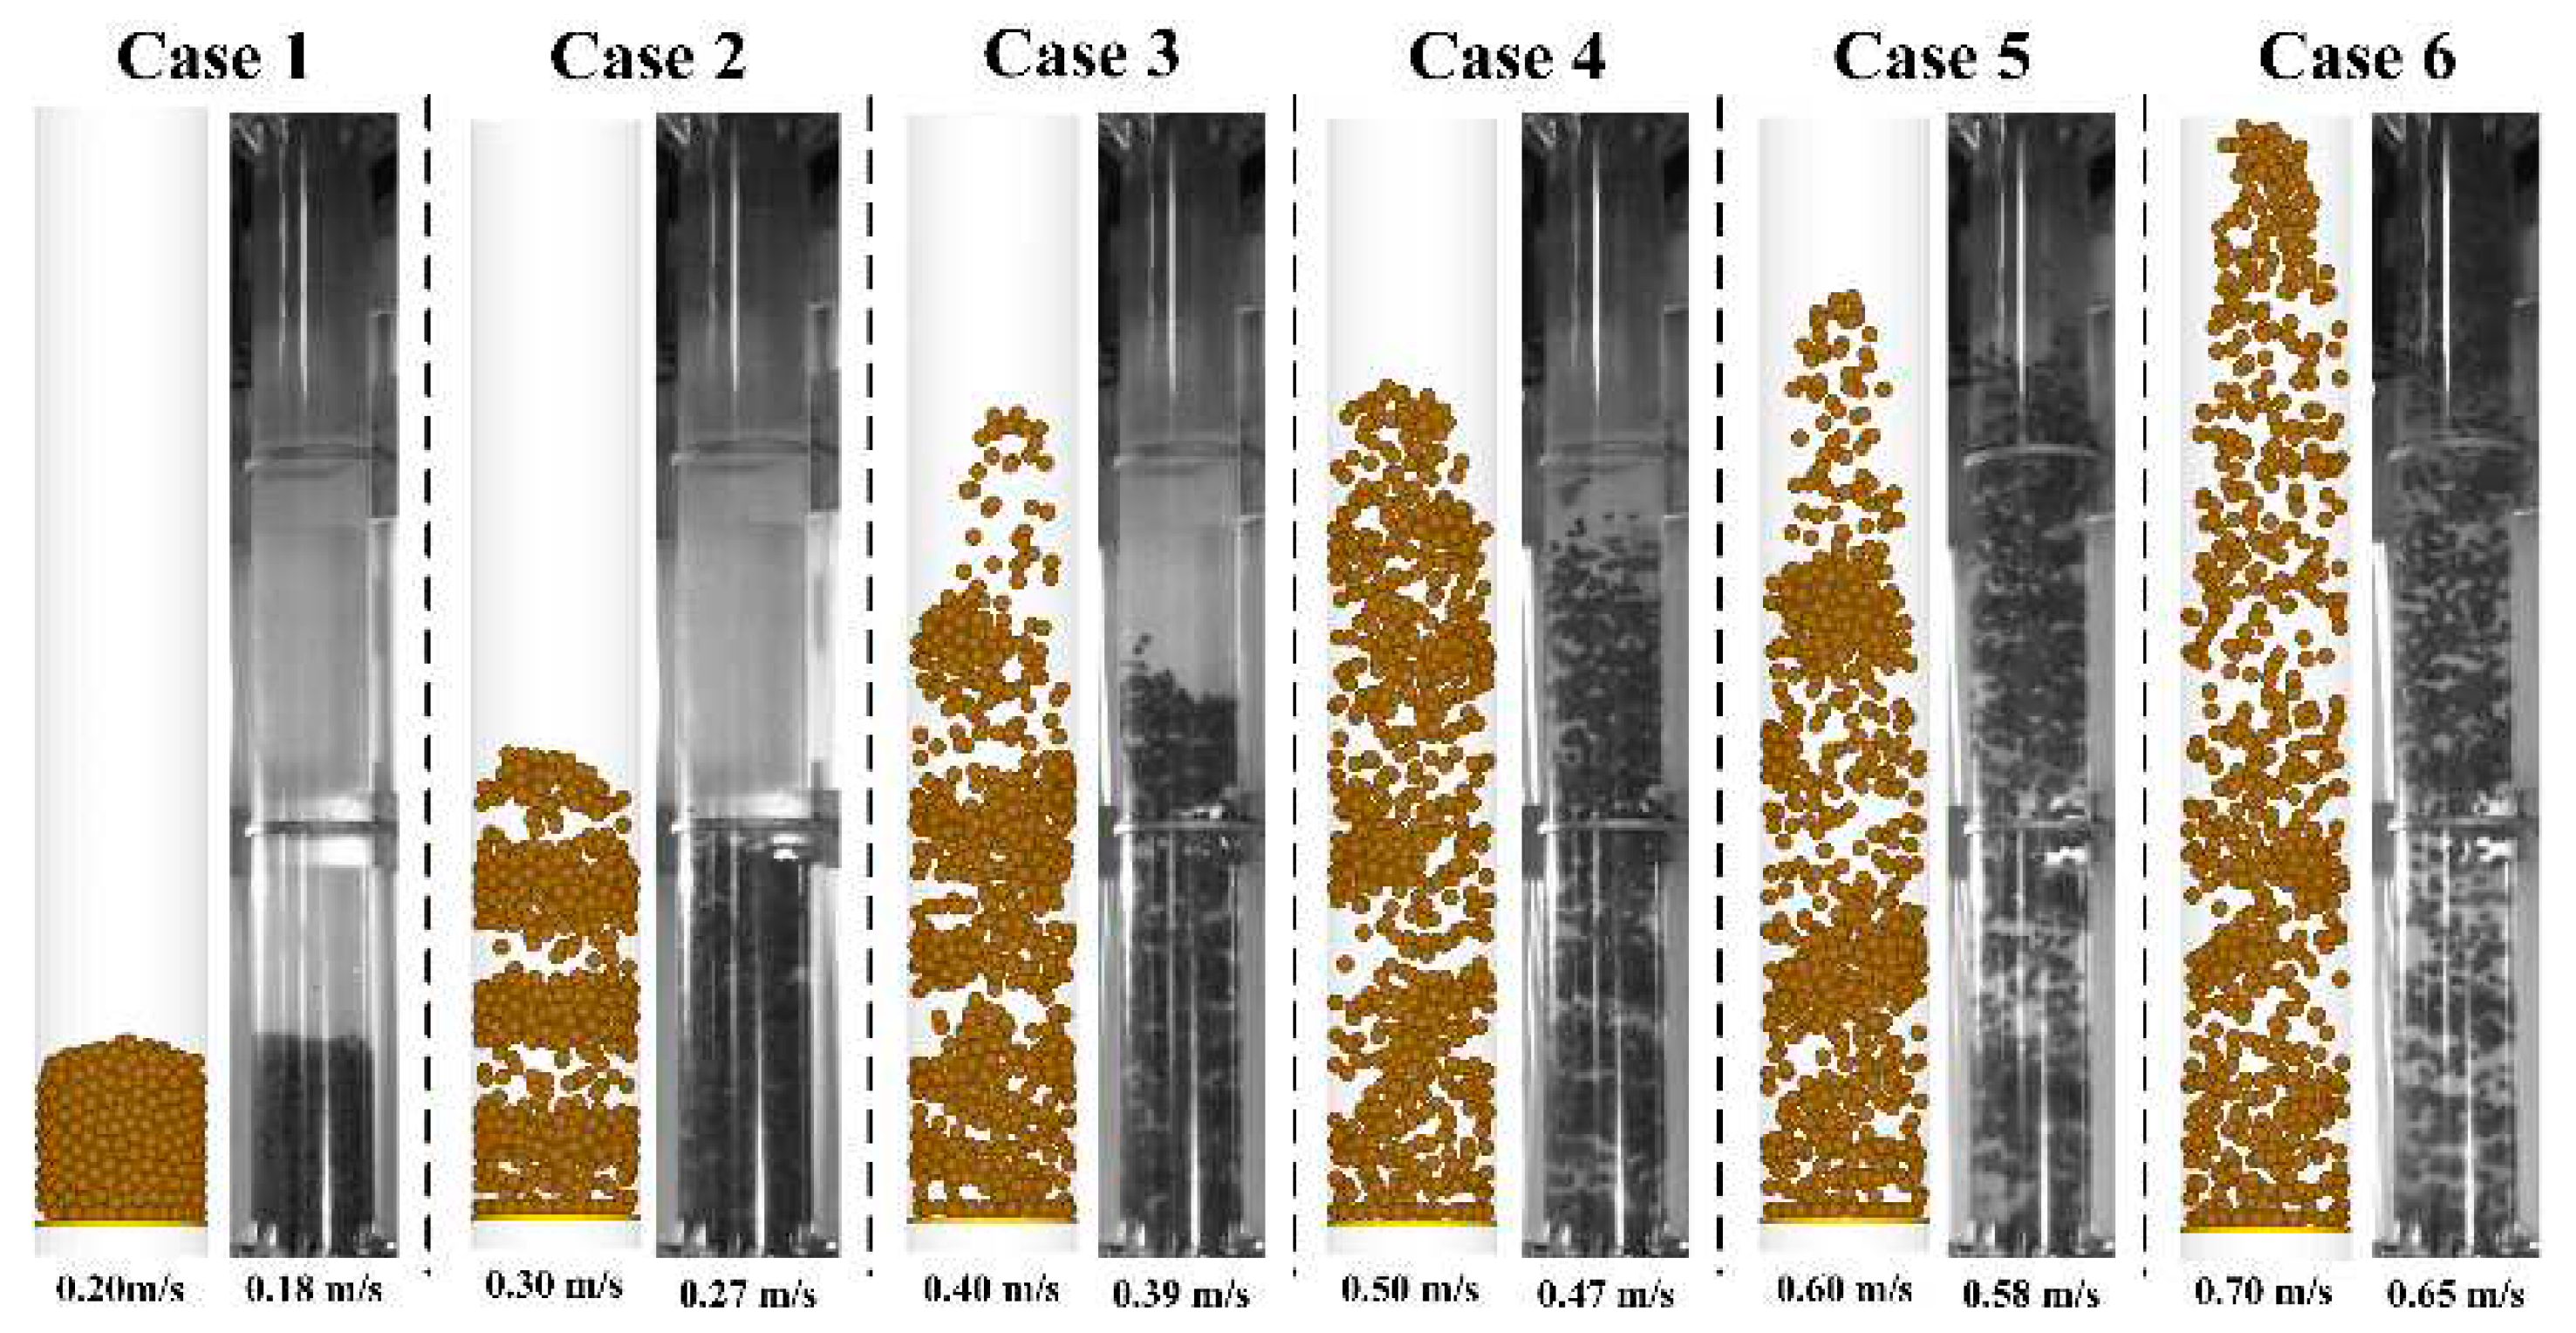
According to Eq. (14), six groups of simulation cases under different water velocities were conducted for the ballast group, where the simulation time of each group was 10 s. The distribution state of the ballast group in the simulation conditions was compared with the experimental results, as shown in Figure 4. With the increase in water flow rate, the velocity difference between the ballast and water increased, thereby increasing the liquid force acting on the ballast, and thus increasing the hovering height of ballast in the vertical pipeline. It can be concluded that the simulation results of the 20 mm ballast group distribution state under the different water velocities are consistent with the experimental observation results.
In the simulation, the ballast group pick-up velocity was determined according to the ballast distribution state and the ballast residual mass rate, as listed in Table 2.
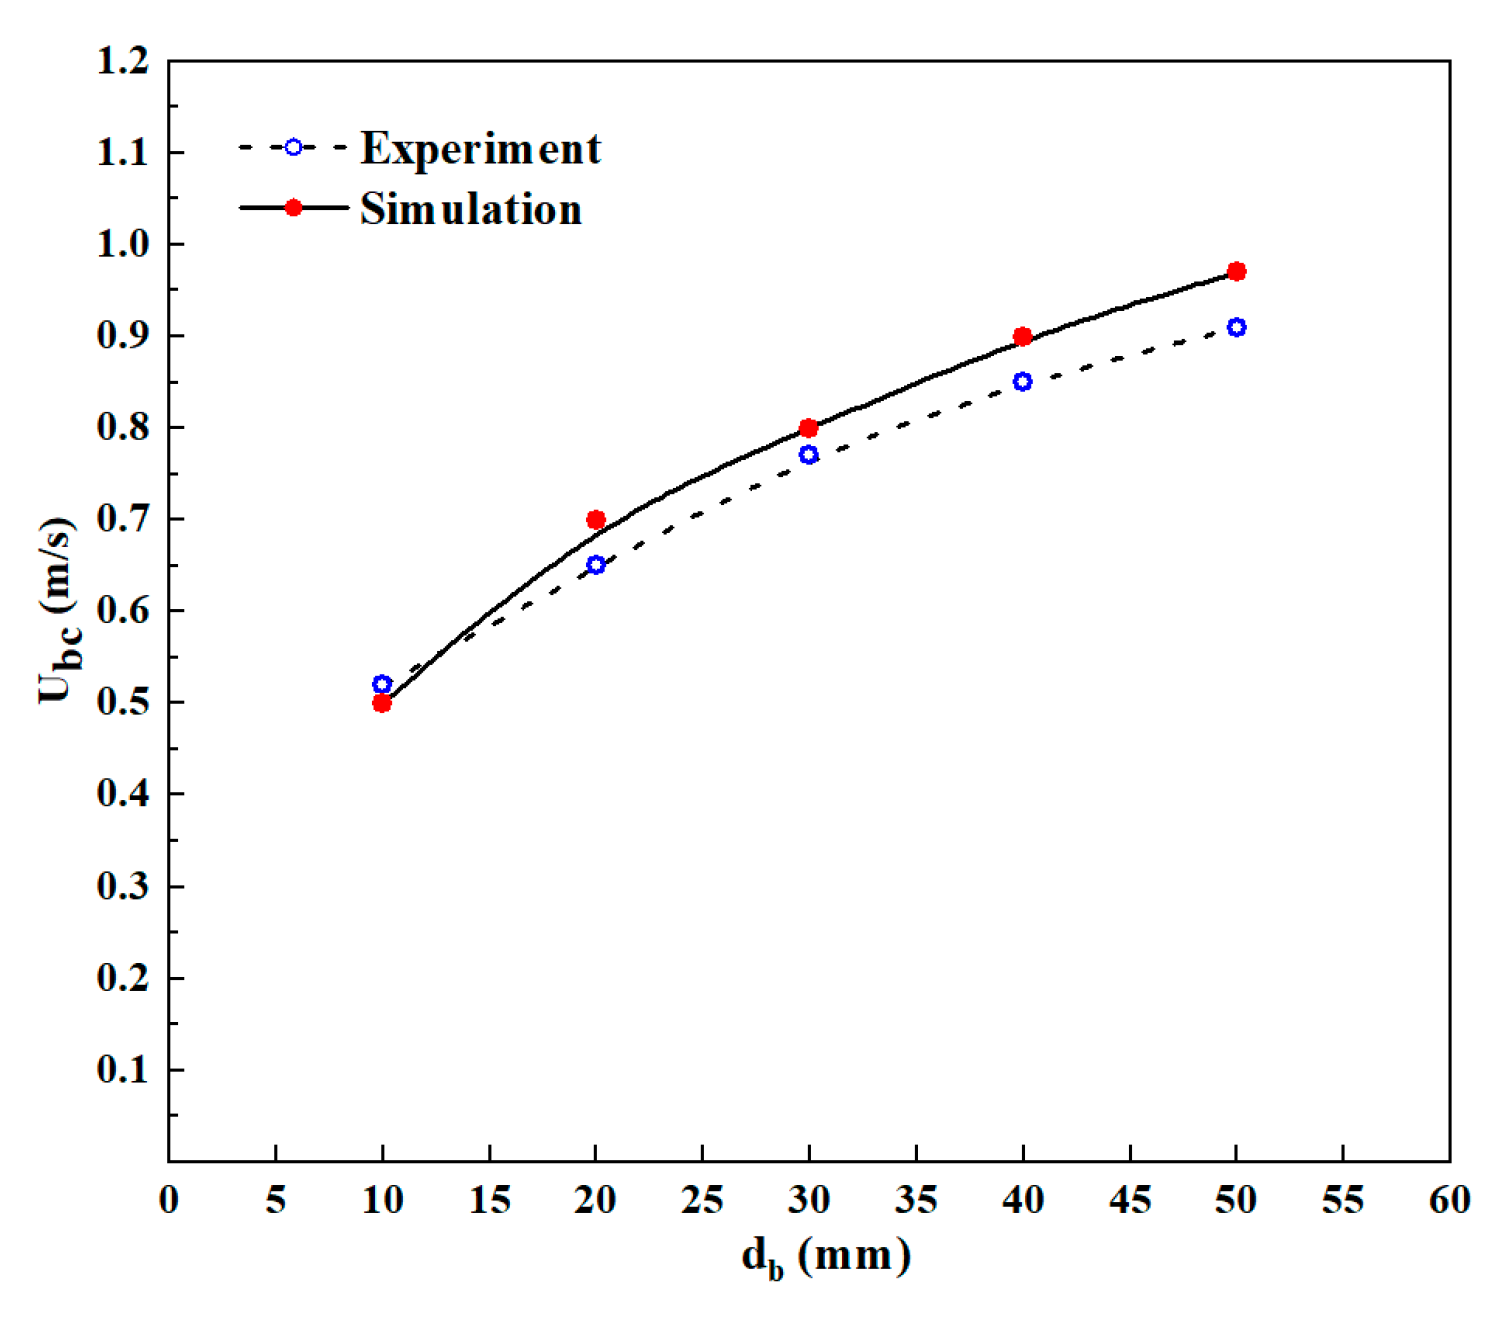
Under the different water velocity conditions, divergence existed in terms of the ballast lifting height and concentration degree, as shown in Figure 4. As mentioned previously, the ballast group pick-up velocity was determined according to the ballast group distribution state. The pick-up velocity of the 10 kg weighted ballast group under the different ballast sizes was obtained through simulation. The comparison with the experimental results is shown in Figure 5, where the maximum error rate was 7.69 %, and the average error rate was 5.61 %. While for the trend of variation, both the experiment and simulation provided a similar result. Hence, it can be determined that the simulation model is proven to be reliable.

4. Ballast group flow characteristics

Based on the simulation model above, the ballast group initiation process and the influence factors of the pick-up velocity in the actual working condition were studied. The specific parameters used in the simulation are listed in Table 3.

4.1. Ballast group initiation process in the vertical pipe

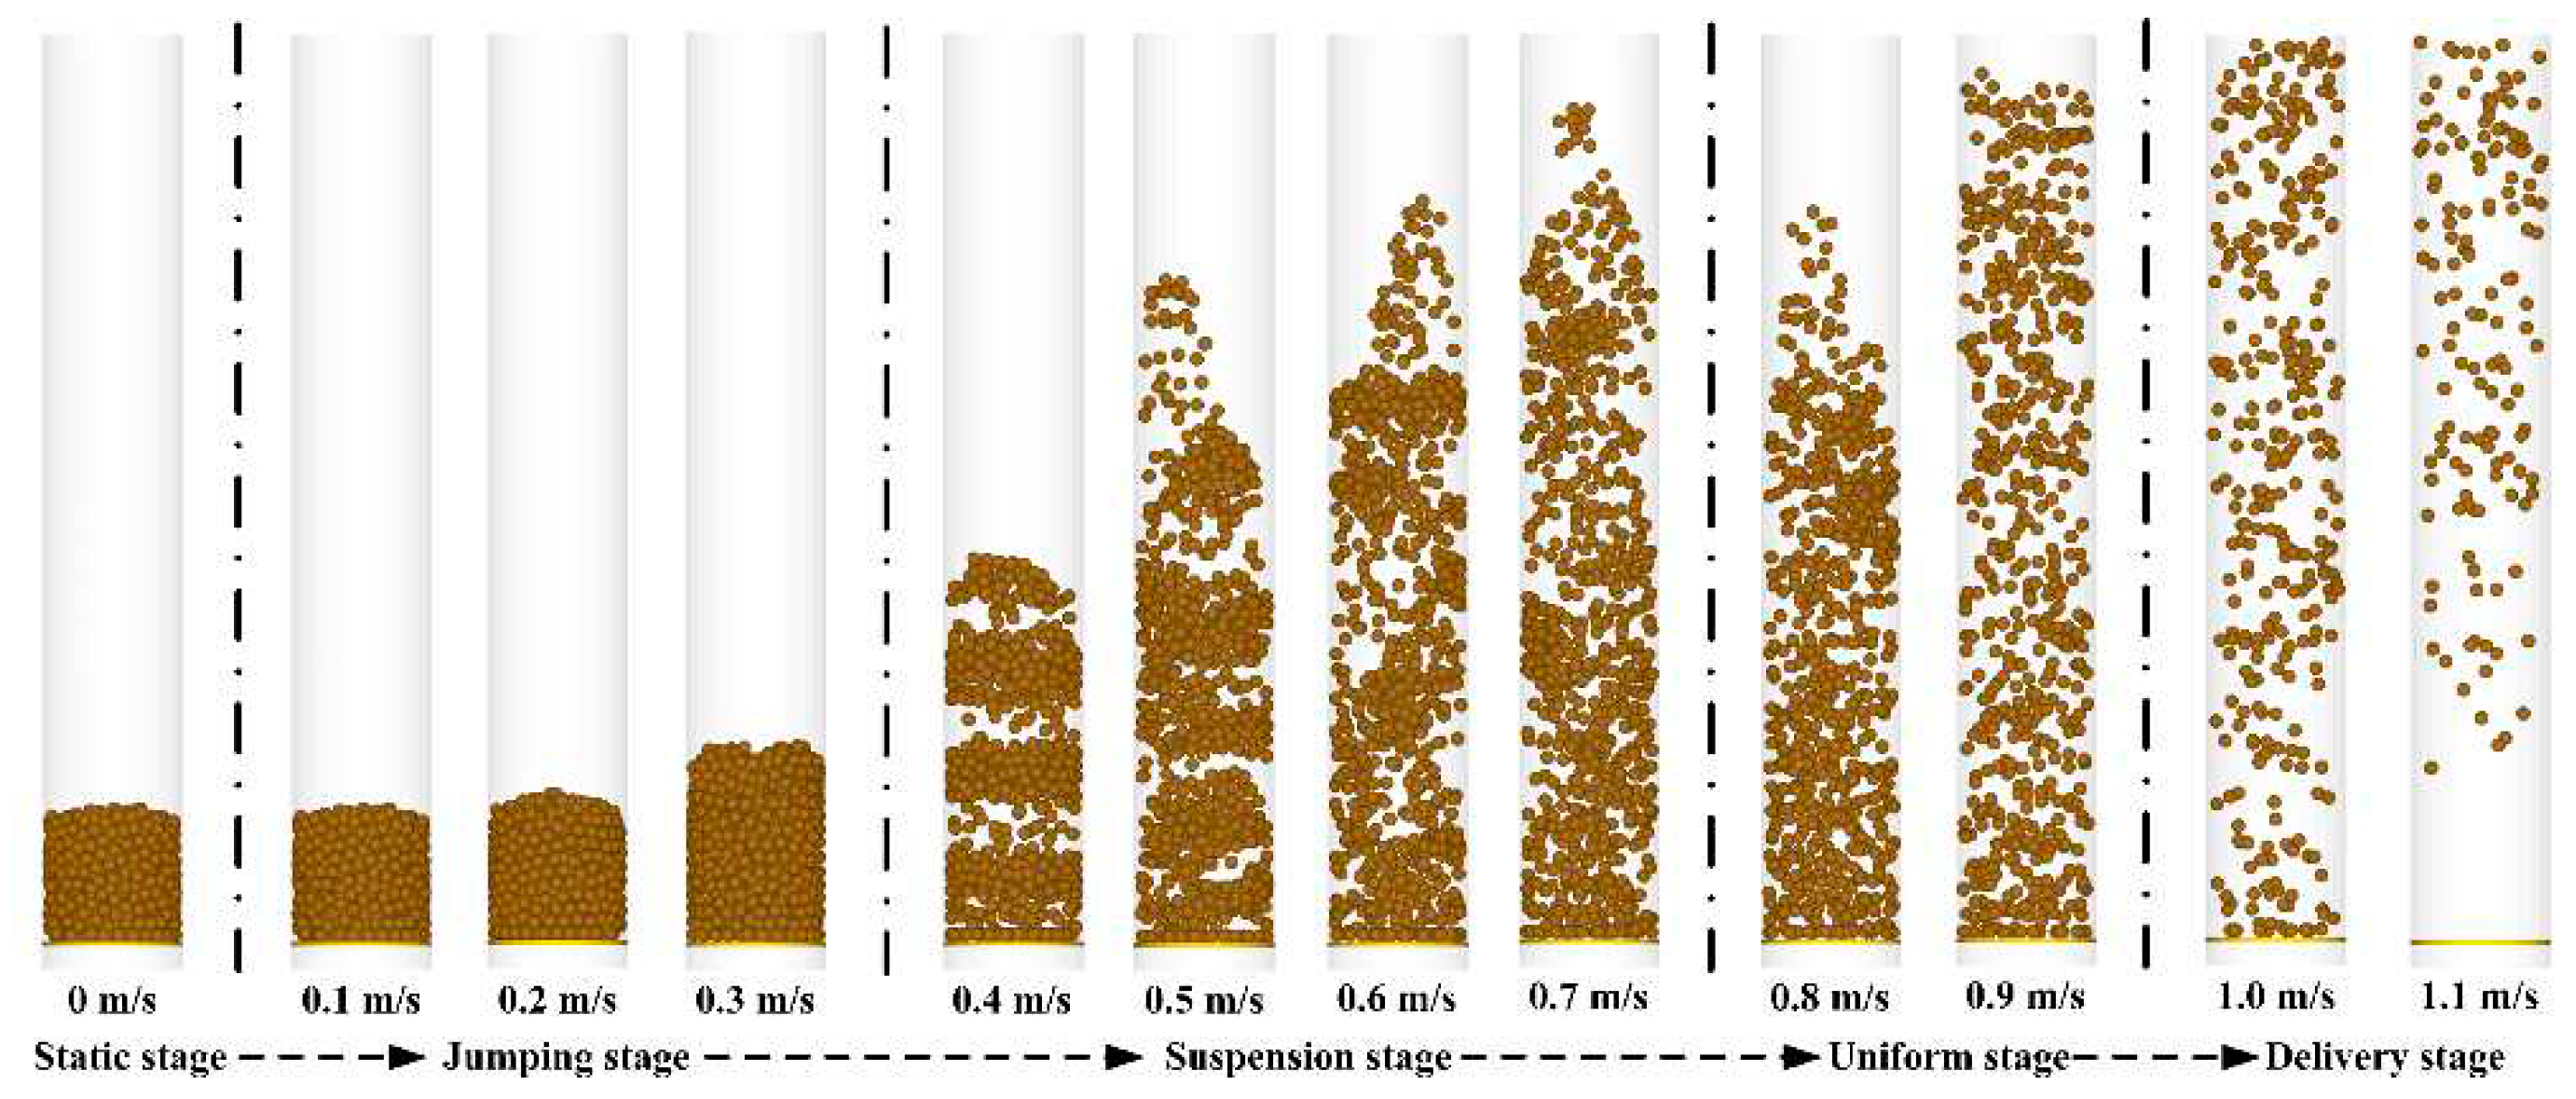
As shown in Figure 6, the ballast group’s initiation process in the vertical pipeline was studied when the slurry velocity increased from 0.1 to 1.1 m/s. Based on the four aspects (including the distribution state, velocity vector, average velocity, and mass residual rate of the ballast group), the initiation process of the ballast group was divided into four stages; jumping, suspension, uniform, and delivery. According to the ballast distribution state, in the jumping stage, the ballast mainly settled at the bottom of the pipe with the slurry velocity ranging between 0.1 and 0.2 m/s. Moreover, the ballast group distribution state appeared similar to that in the static stage. When the slurry velocity was at 0.3 m/s, the ballast group was lifted slightly. Further, as the slurry velocity increased to 0.4 m/s, the ballast group entered the suspension stage. While the slurry velocity was between 0.4 and 0.5 m/s, the ballast group changed from the bottom accumulation to the middle-upper intermittent distribution. In addition, when the slurry velocity was between 0.6 and 0.7 m/s, the ballast group switched to a uniform distributed state. Further, when the slurry velocity increased to 0.8 m/s, the ballast group entered the uniform stage, which exhibited greater uniform distribution than the suspension stage. Finally, when the slurry velocity was 1.0 m/s, the ballast group entered the delivery stage, where the ballast at the bottom was significantly reduced compared with other stages. With a gradual shift to the upper part of the pipe, the ballast group was finally transported out of the pipeline. Similar phenomena can also be observed in the experiment.
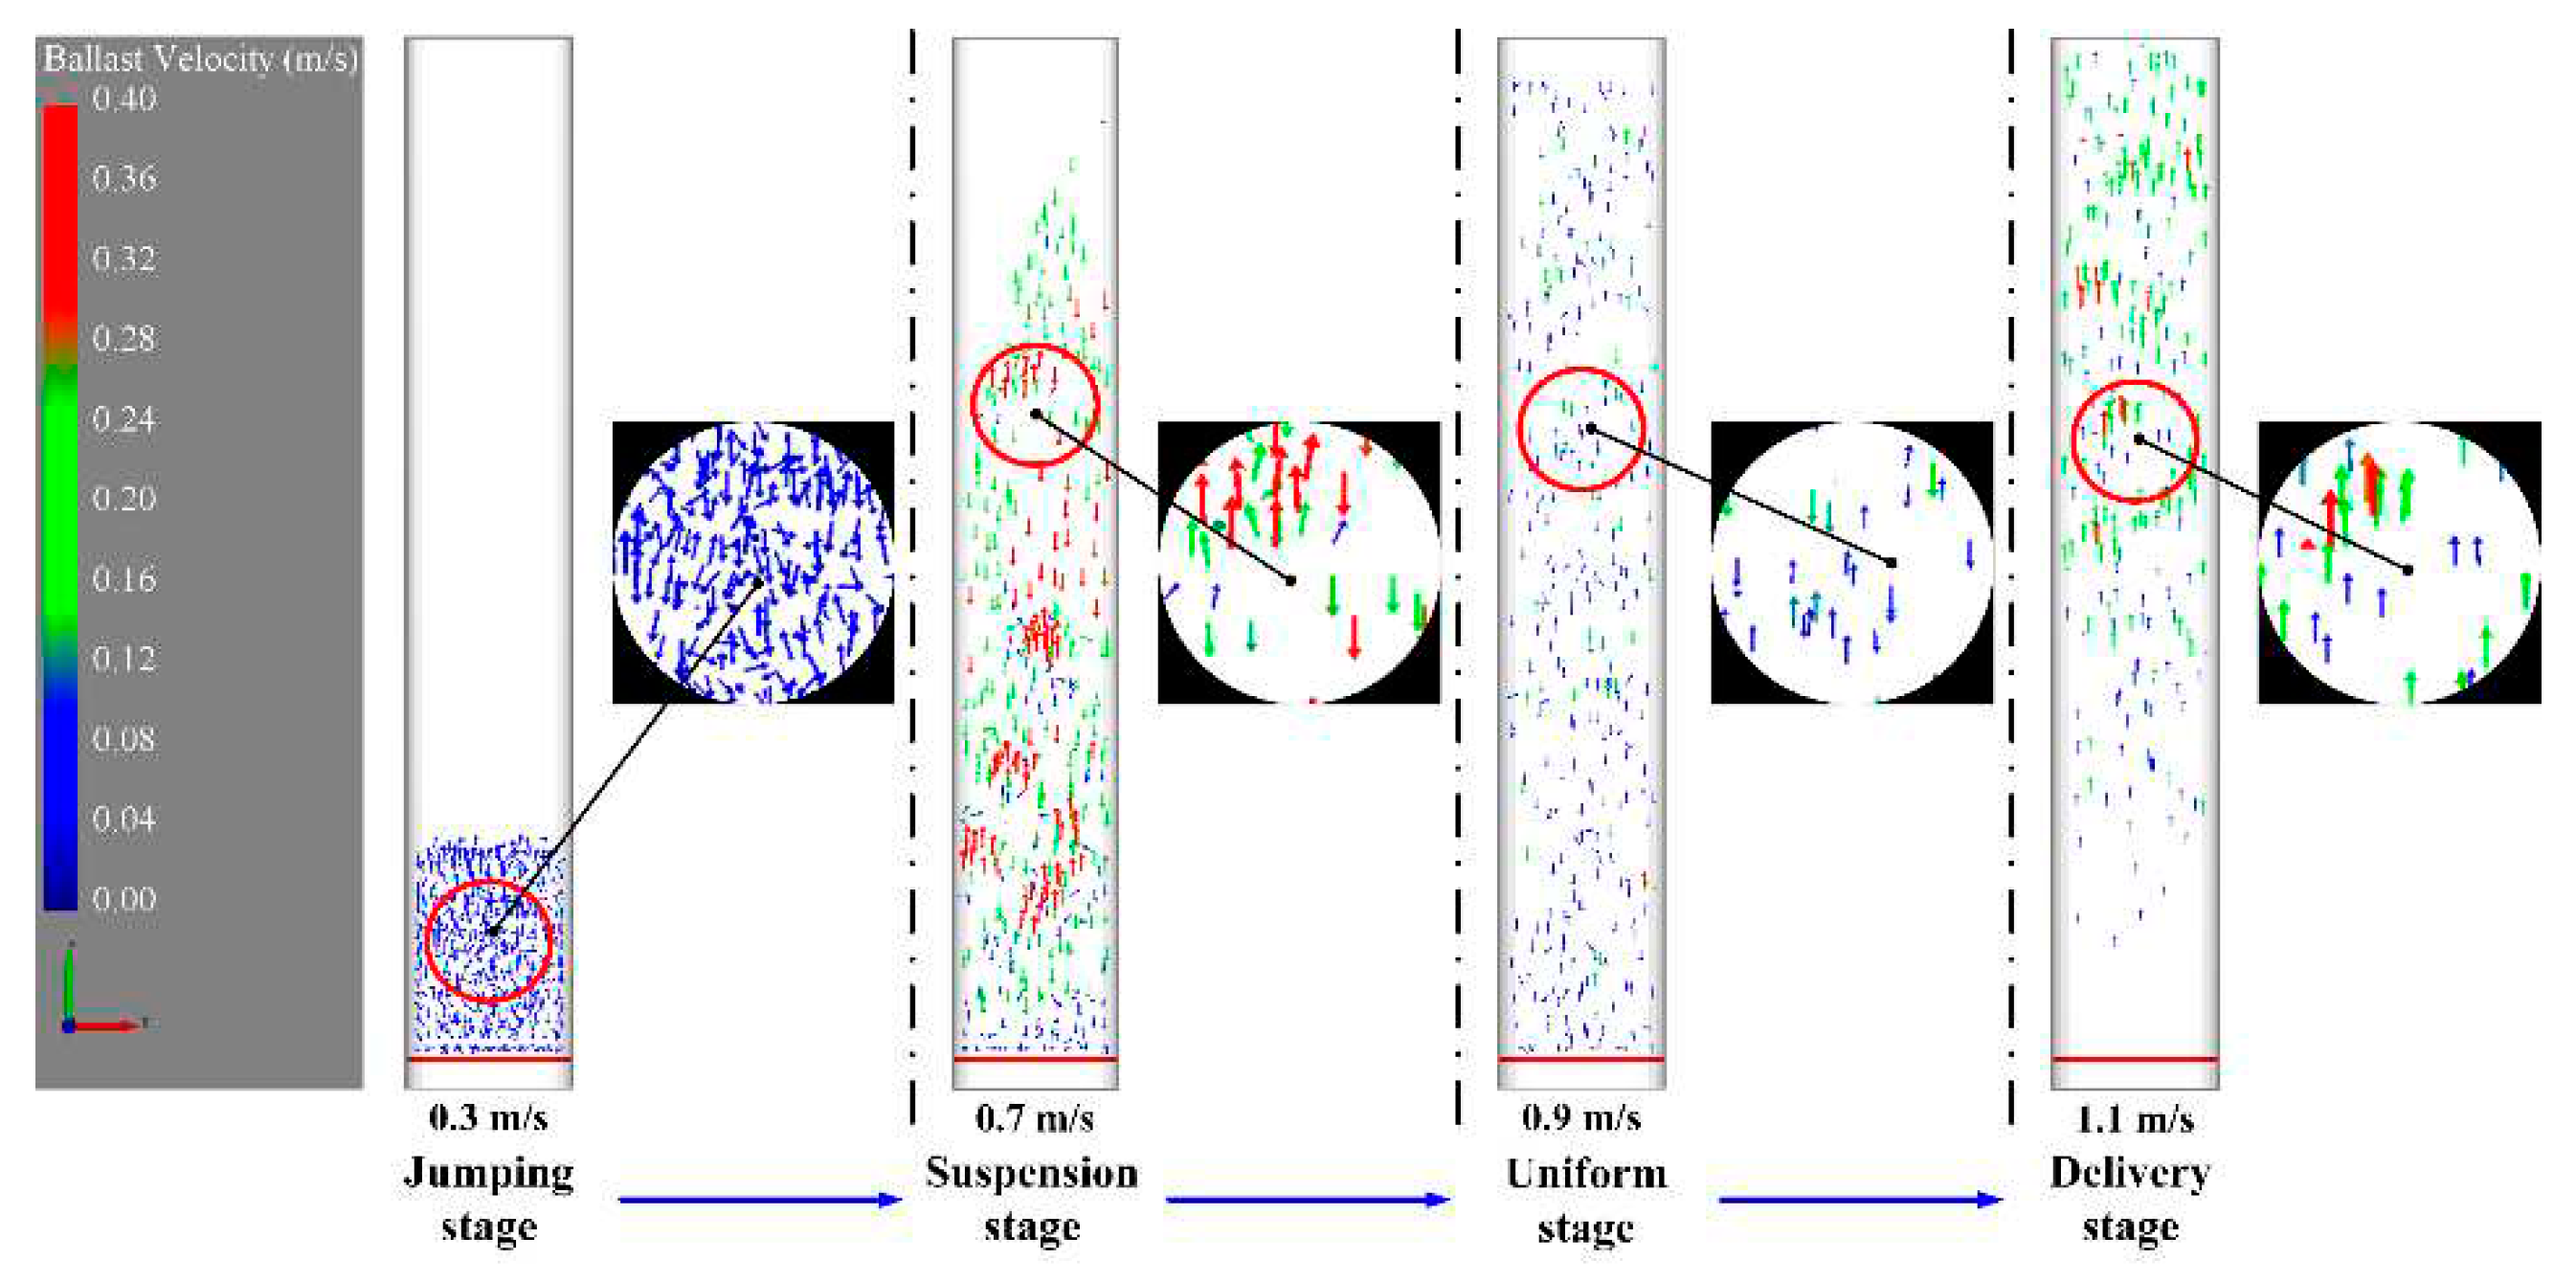
The ballast velocity vector diagram can be used to obtain the ballast motion direction and velocity during the initiation process, as shown in Figure 7. When the slurry velocity was 0.3 m/s, the ballast group was located at the jumping stage. It can be observed that the ballast group exhibited a phenomenon of ascending and descending alternately, with no visible movement trend and a small motion velocity. However, at the slurry velocity of 0.7 m/s, the ballast group was in the stage of suspension, where an apparent downward movement was observed. At this stage, the ballast group in the central area of the pipe was initially lifted upward, and after reaching a certain height, the group moved towards the inner pipe wall and exhibited a downward trend. Furthermore, for the slurry velocity of 0.9 m/s, the ballast group reached the force equilibrium state at the uniform stage. With a motion trend similar to the jumping stage, the ballast velocity experienced a significant decline. Finally, when the slurry velocity was 1.1 m/s, the ballast group was in the delivery stage, where the upward motion of the ballast was visible and the falling movement disappeared. Moreover, the ballast lifting velocity was higher than the downward falling speed. During the delivery stage, the pick-up velocity of the 30 mm single ballast was 1.0 m/s. Furthermore, when the slurry velocity appeared higher than the single ballast pick-up velocity, the whole ballast group was uplifted, enabling the ballast to be smoothly exported outside the pipeline.
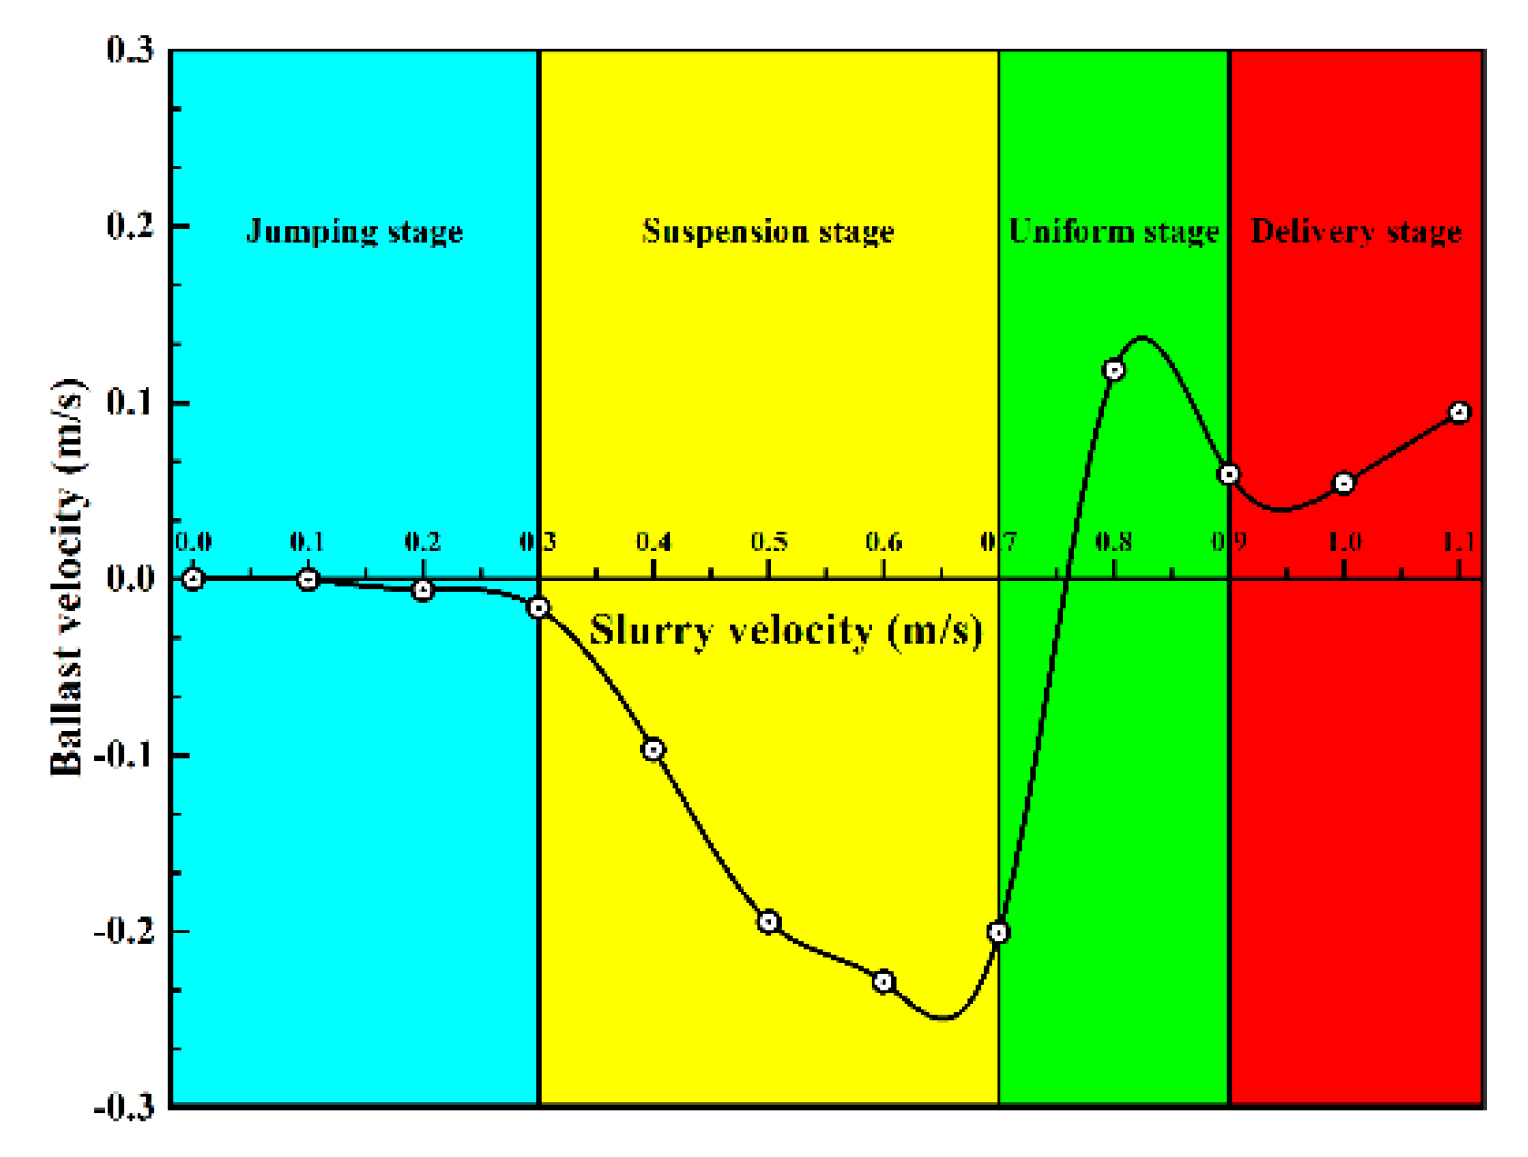
Considering the various directions of the ballast movement during the initiation process, the upward motion was set as a positive value, while the downward motion was set as a negative value. The average velocity of ballasts under the different slurry flow rate conditions is displayed in Figure 8. It can be observed that the average velocity was relatively small during the jumping stage. When the slurry velocity increased from 0.1 to 0.3 m/s, the ballast group fell, while the velocity exhibited a slightly increasing trend. Subsequently, with the increase from 0.3 to 0.65 m/s, the ballast group entered the suspension stage, where the ballast group falling velocity continued to increase rapidly. Furthermore, when the slurry velocity increased from 0.65 to 0.75 m/s, the upward motion of the ballast was enhanced, and the falling velocity of the ballast group exhibited a downward trend. When the slurry velocity increased from 0.75 to 0.9 m/s, the ballast group entered the uniform stage where the average velocity was higher than 0 m/s, and the movement trend of the ballast group was an overall upward lifting. However, when the slurry velocity increased from 0.8 to 0.95 m/s, the upward lifting velocity of the ballast group decreased, owing to the balance of the interaction between the remaining ballast in the pipeline and slurry. Finally, when the slurry velocity exceeded 0.95 m/s, the ballast group entered the delivery stage. Following a further increase in the slurry velocity, the ballast group motion velocity gradually increased, while the ballast exhibited an upward motion trend, with the disappearance of the falling phenomenon. During this stage, the ballast group was smoothly transported outside the pipe.
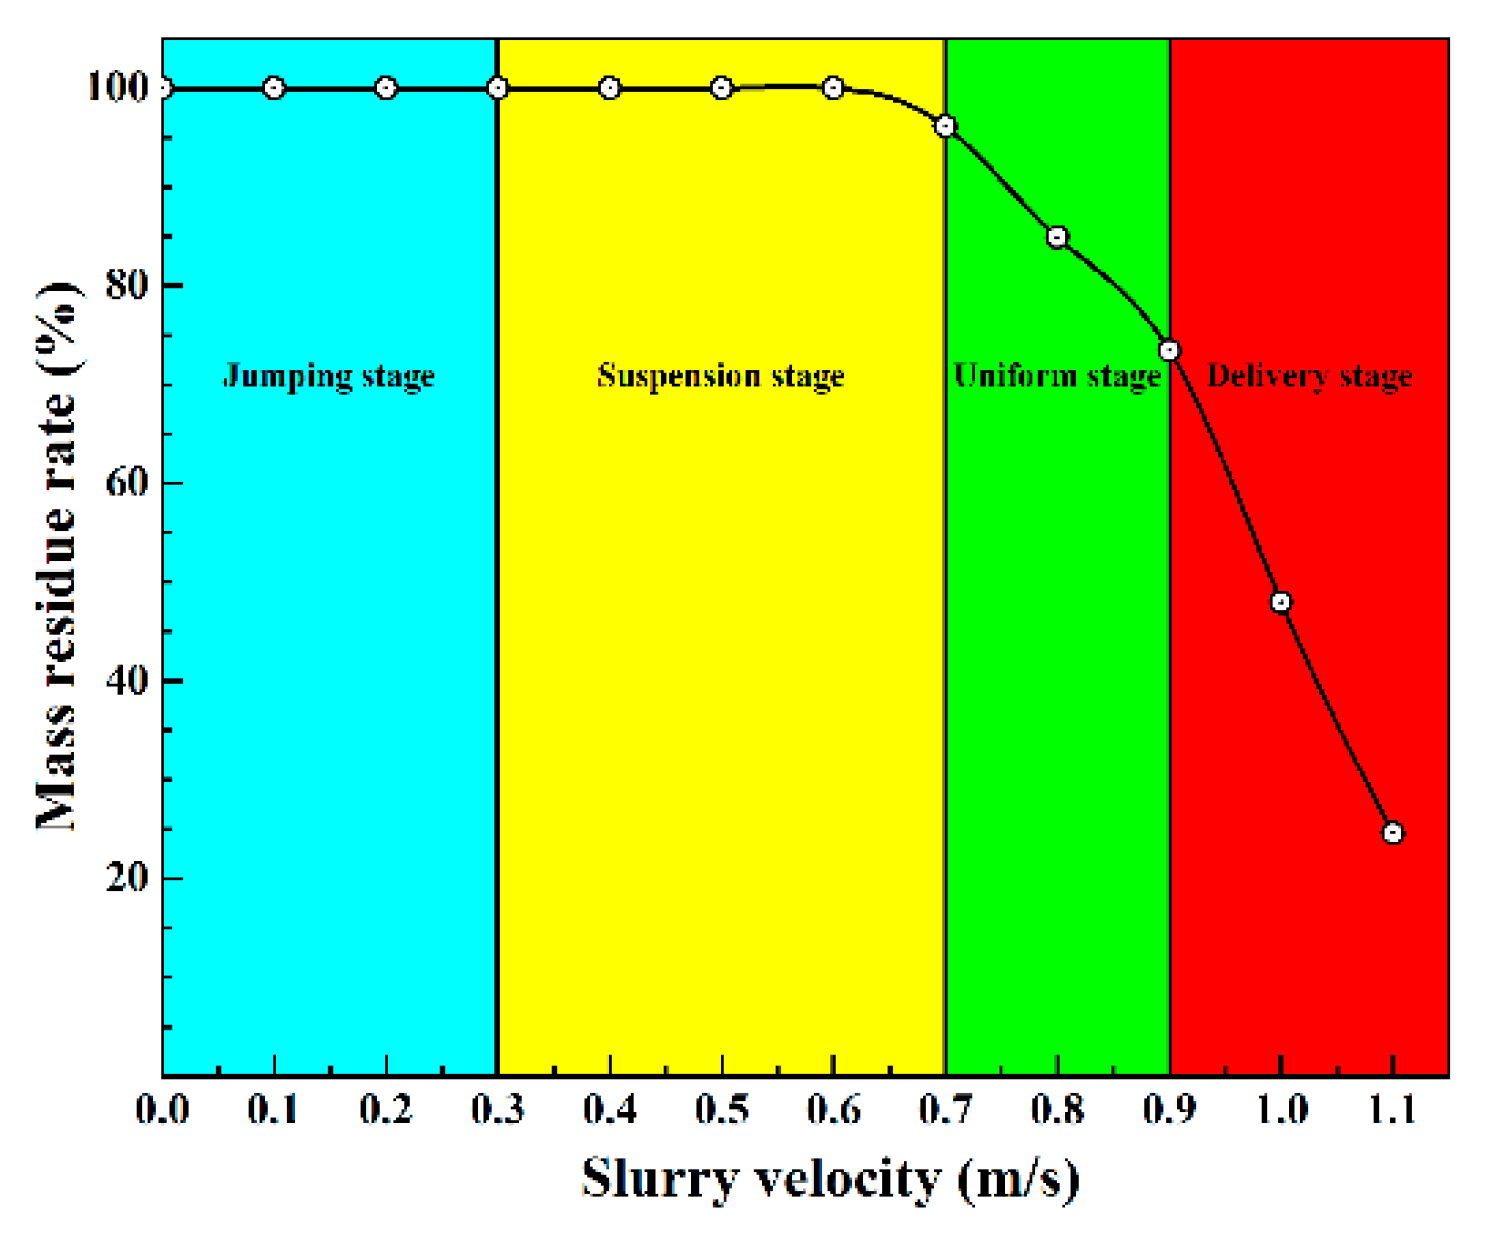
After analysing the ballast mass residual rate in the pipeline at the different motion stages, the variation curve was obtained, as shown in Figure 9. It is evident that in the velocity range of 0.0 and 0.6 m/s, the ballast group experienced the jumping stage and the initial suspension stage, where the ballast in the pipeline could not be discharged. Therefore, the ballast mass residual rate was 100 %. Regarding the slurry velocity between 0.6 and 0.9 m/s, the ballast group was at the end of the suspension stage or the uniform stage, while only part of the ballast was discharged until the end of the suspension stage. Furthermore, when the slurry velocity was higher than 0.9 m/s, the ballast group entered the delivery stage, and the ballast in the pipe gradually decreased until it was completely discharged.

4.2. Effect of ballast size on pick-up velocity

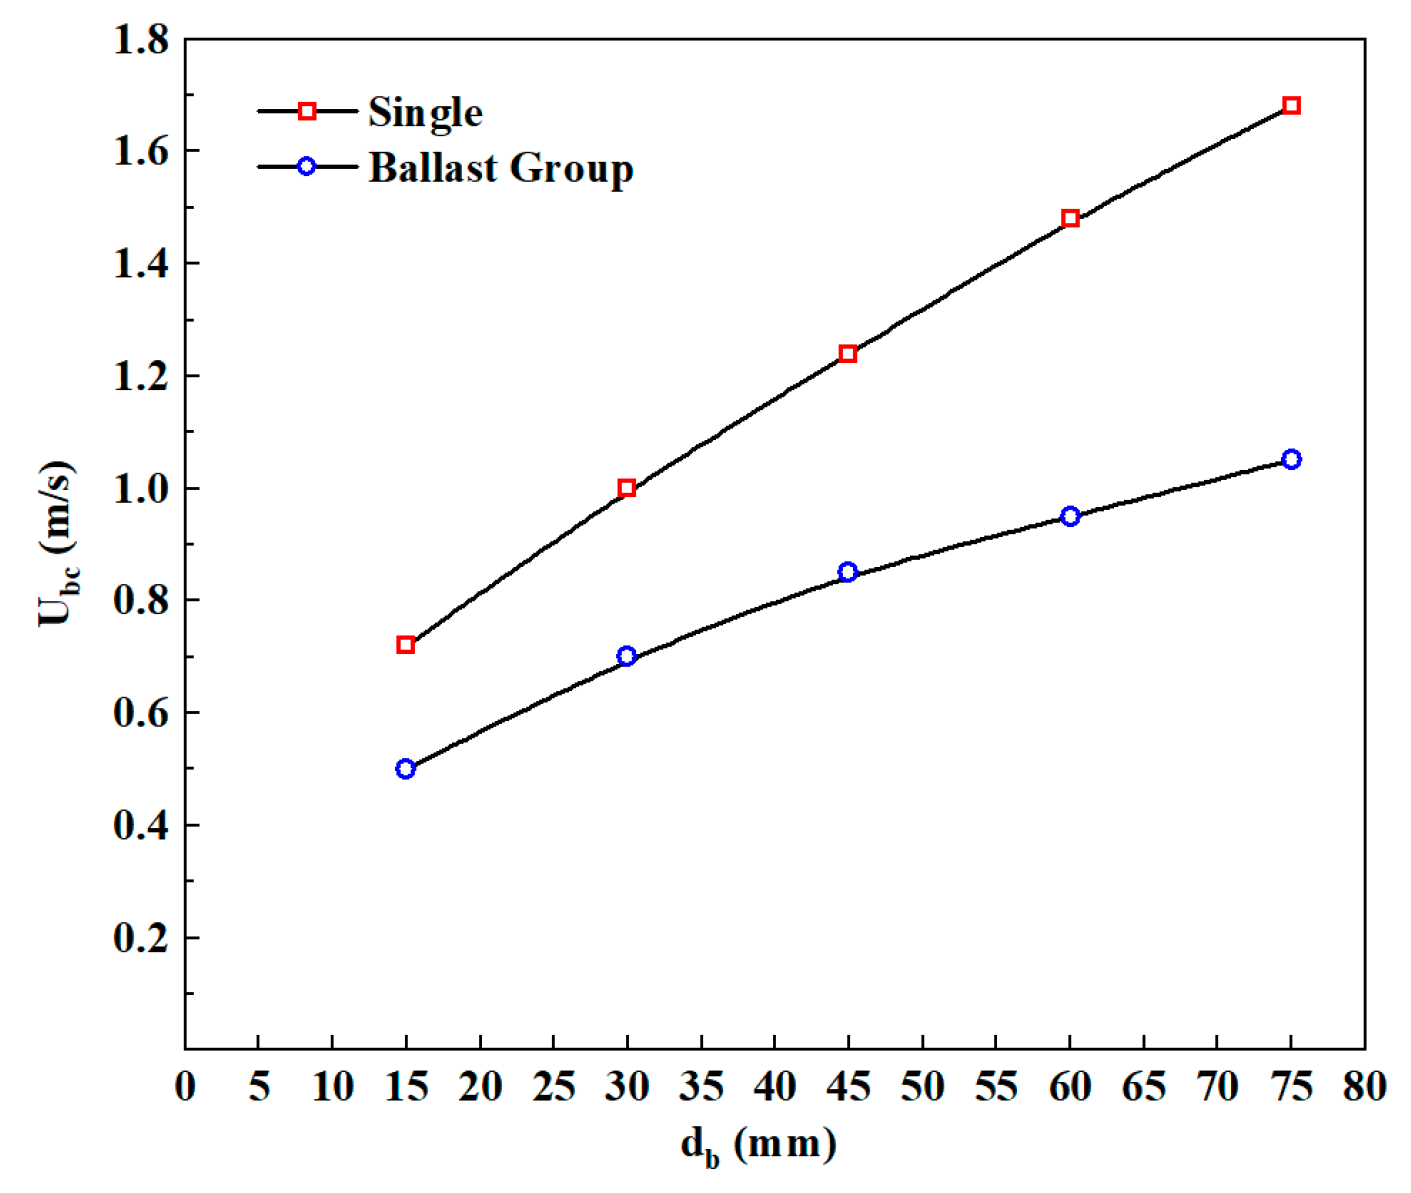
Under the actual working conditions, the pick-up velocity of the 30 kg ballast group was analysed, and the comparison of the pick-up velocity between a single ballast and the ballast group is shown in Figure 10. It can be seen that for both conditions, the pick-up velocity exhibited an increasing trend with increasing diameter, while the slope of the ballast group decreased. The pick-up velocity of a single ballast was higher than that of the ballast group with the same ballast size. For example, the pick-up velocity corresponding to a 30 mm single ballast was 1.00 m/s, while that of the ballast group with the same size and the total weight of 30 kg was only 0.70 m/s. As the size increased to 60 mm, the ballast group pick-up velocity reached 0.95 m/s.

4.3. Effect of ballast concentration on pick-up velocity

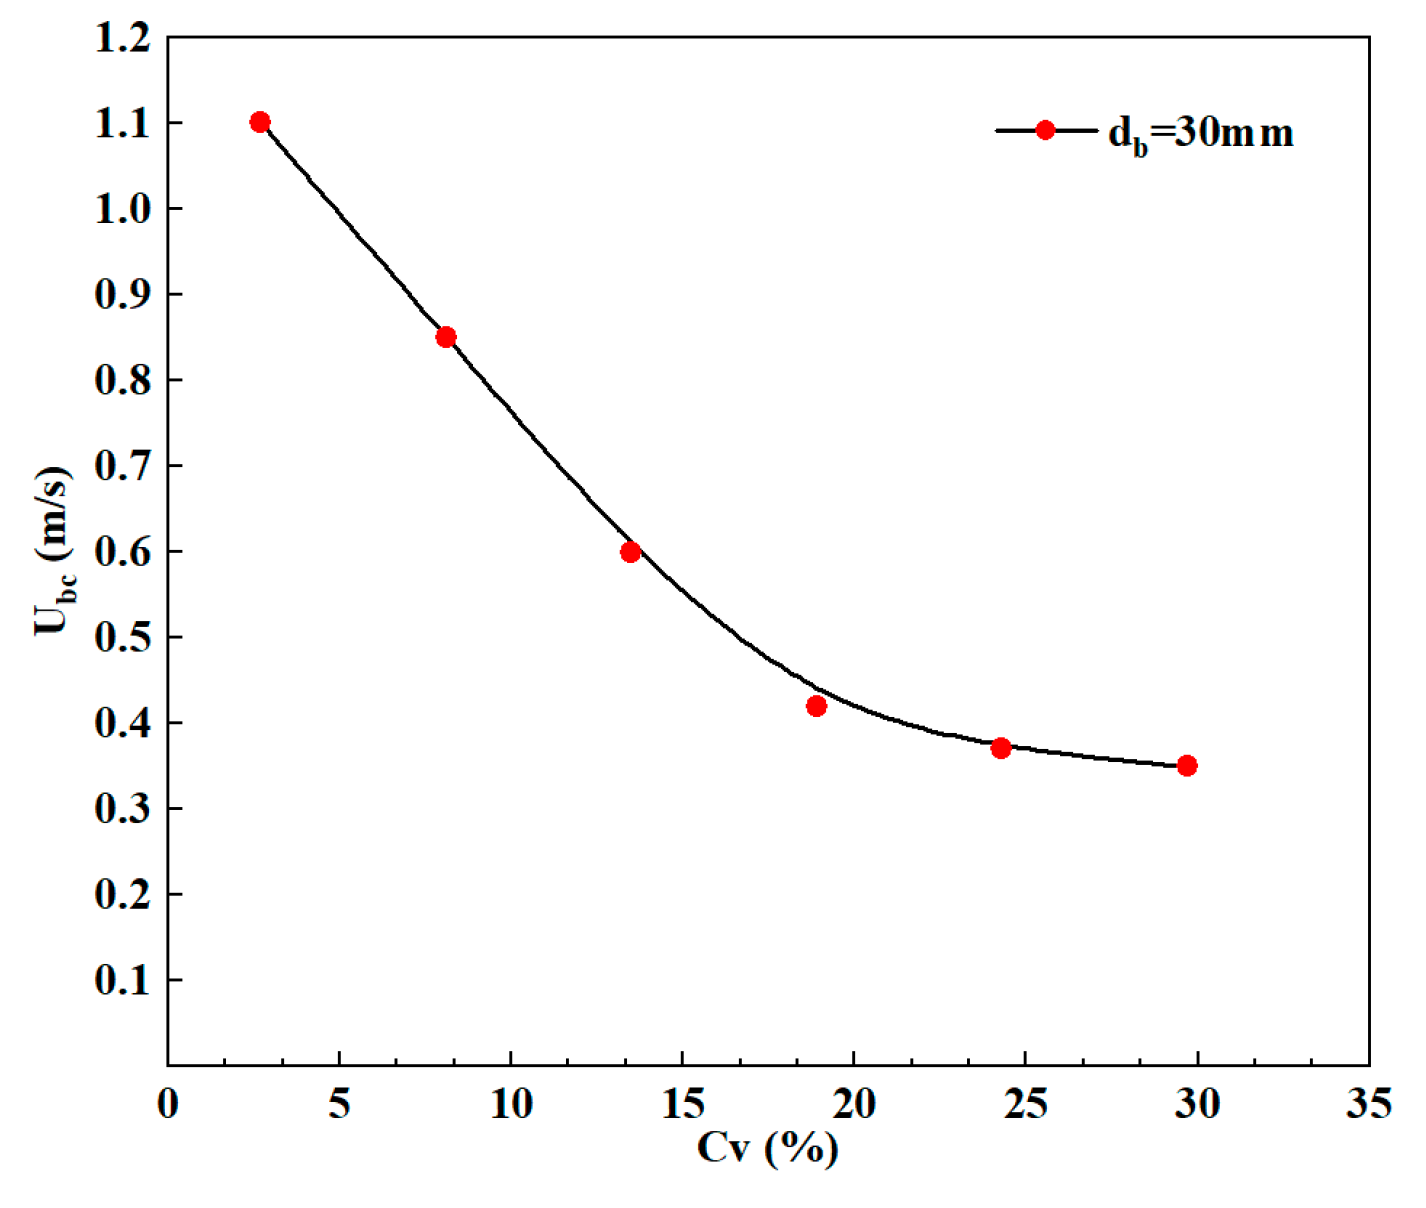
The ballast concentration Cv in the slurry system experienced a transformation, owing to the tunnelling speed and geology during practical operation. As shown in Figure 11, the ballast pick-up velocity ubc with a diameter of 30 mm under the different concentration conditions was obtained through analysis. When Cv increased from 2.7 to 18.7 %, ubc rapidly decreased from 1.1 to 0.42 m/s. However, when Cv was higher than 18.7 %, ubc decreased slowly and gradually tended to be stable. According to the simulation and experiment results, the increase in the ballast concentration significantly reduced the ballast group pick-up velocity. This is because the collision force between the ballast reduced the effective ballast gravity such that the demand for drag force of the ballast was reduced accordingly. The increase in ballast concentration improved the ballast collision frequency. When Cv was between 2.7 and 18.7 %, the ballast collision frequency increased from 20 to 523. Therefore, it is evident that the ballast collisions may be beneficial for picking up the ballast in the vertical pipe and significantly reducing the ballast pick-up velocity. In addition, with the increase in Cv from 18.7 to 24 %, the frequency of ballast collisions increased from 523 to 615, which is close to saturation. Generally, the transportation of a single ballast with a large size should be prevented during the transportation to lower the risk of blockage in the vertical pipe.

5. Conclusion

This study determined the ballast group pick-up velocity by using the hydraulic lifting experimental platform. Based on the CFD-DEM method, a simulation model of the ballast pick-up velocity was constructed. In addition, the influencing factors of the ballast pick-up velocity under the actual working conditions were also studied. The main findings of the study are as follows:
(1) The simulation model of the ballast pick-up velocity was proposed based on the experiment of the ballast pick-up velocity. Moreover, the accuracy of the simulation model was verified by comparison with the experimental results.
(2) Based on the simulation model, the ballast initiation process was studied. It was observed that when the conveying speed of the ballast group was higher than the pick-up velocity of a single ballast, the ballast in the pipeline could be smoothly discharged.
(3) The ballast pick-up velocity increased with the increase in ballast size. In the working conditions, the ballast pick-up velocity with a diameter of 75 mm was as high as 1.68 m/s. Thus, the minimum slurry velocity should be higher than 2 m/s, which implies that the minimum flow rate of the slurry pump should be controlled over 510 m3/h.
(4) The increase in the ballast concentration evidently reduced the ballast pick-up velocity. However, the ballast pick-up velocity was less affected when the local ballast concentration in the vertical pipe increased to more than 18.7 %. It is suggested that the local ballast concentration in the vertical pipe of the slurry system should be controlled by approximately 20 %.
In engineering applications, due to the limits of the environment, the slurry system consists of vertical, horizontal, and inclined parts. It is not sufficient to study only the ballast pick-up velocity in the vertical pipe; further studies on the horizontal and inclined pipes are required. Meanwhile, the follow-up research will focus on the prediction model of the ballast pick-up velocity.

Funding

The study is supported by Hunan Province Major Science and Technology Project (Grant No 2019GK1010) and the Fundamental Research Funds for Central Universities of the Central South University (Grant No 2017zzts089). The supports are gratefully acknowledged by the authors.

Conflicts of Interest

The authors declare no conflict of interest.

Appendix

Notation Definition Units
ub ballast translational velocity m/s
ωb,i ballast angular velocity rad/s
mb,i ballast mass kg
FC,ij contact force N
FD,i fluid drag force N
Fp,i pressure gradient force N
FM,i Magnus lift force N
FS,i Saffman lift force N
Fg,i ballast gravity N
Ib,i ballast inertia moment kg·m²
Mt,ij tangential torque N·m
Mr,ij rolling friction torque N·m
Cd ballast drag coefficient
ρs slurry density kg/m3
ubsrel relative velocity m/s
Re Reynolds number
db ballast size mm
μs slurry viscosity Pa·s
εs slurry volume fraction
us slurry flow velocity m/s
τs slurry shear stress Pa
p slurry pressure Pa
g acceleration of gravity m/s2
S momentum exchange term kg/(m·s)2
γ slurry shear stress rate s-1
Fbs,i interaction force N
∆V calculated grid volume m3
t simulation time s
Cv ballast concentration %
mbg ballast stacking quality kg
ρb ballast density kg/m3
h pipe height m
D pipe diameter mm
ubc ballast pick-up velocity m/s
API Application Programming Interface

References

  1. Van Wijk, JM, Talmon, AM, Van Rhee. C Stability of vertical hydraulic transport processes for deep ocean mining: An experimental study. Ocean Eng 2016; 125: 203-213.
  2. Zhang, H.; Liu, M.; Li, T.; Huang, Z.; Bo, H.; Dong, Y. Experimental study on plug formation characteristics of a novel draft tube type feeder for vertical pneumatic conveying of coarse particles. Powder Technol. 2016, 301, 730–736. [Google Scholar] [CrossRef]
  3. Liu, Y.; Chen, L. Numerical investigation on the pressure loss of coarse particles hydraulic lifting in the riser with the lateral vibration. Powder Technol. 2020, 367, 105–114. [Google Scholar] [CrossRef]
  4. Kalman, H.; Satran, A.; Meir, D.; Rabinovich, E. Pickup (critical) velocity of particles. Powder Technol. 2005, 160, 103–113. [Google Scholar] [CrossRef]
  5. Rabinovich, E.; Kalman, H. Pickup velocity from particle deposits. Powder Technol. 2009, 194, 51–57. [Google Scholar] [CrossRef]
  6. Gomes, L.; Mesquita, A.A. Effect of particle size and sphericity on the pickup velocity in horizontal pneumatic conveying. Chem. Eng. Sci. 2013, 104, 780–789. [Google Scholar] [CrossRef]
  7. Anantharaman, A.; Cahyadi, A.; Hadinoto, K.; Chew, J.W. Impact of particle diameter, density and sphericity on minimum pickup velocity of binary mixtures in gas-solid pneumatic conveying. Powder Technol. 2016, 297, 311–319. [Google Scholar] [CrossRef]
  8. Zhou, J.-W.; Xu, L.-G.; Du, C.-L. Prediction of lump coal particle pickup velocity in pneumatic conveying. Powder Technol. 2019, 343, 599–606. [Google Scholar] [CrossRef]
  9. Goy, S.P.; Chew, J.W.; Hadinoto, K. Effects of binary particle size distribution on minimum pick-up velocity in pneumatic conveying. Powder Technol. 2011, 208, 166–174. [Google Scholar] [CrossRef]
  10. Dasani, D.; Cyrus, C.; Scanlon, K.; Du, R.; Rupp, K.; Henthorn, K.H. Effect of particle and fluid properties on the pickup velocity of fine particles. Powder Technol. 2009, 196, 237–240. [Google Scholar] [CrossRef]
  11. Khan, T.S.; Dai, Y.; Alshehhi, M.S.; Khezzar, L. Experimental flow characterization of sand particles for pneumatic transport in horizontal circular pipes. Powder Technol. 2016, 292, 158–168. [Google Scholar] [CrossRef]
  12. Hayden, K.S.; Park, K.; Curtis, J.S. Effect of particle characteristics on particle pickup velocity. Powder Technol. 2003, 131, 7–14. [Google Scholar] [CrossRef]
  13. Soepyan FB, Cremaschi S, McLaury BS, et al. Pick-up velocity to initiate particle motion in horizontal and near-horizontal conduits. Powder Technol 2016; 292: 272-289.
  14. Dabirian R, Mohan R, Shoham O, et al. G Critical sand deposition velocity for gas-liquid stratified flow in horizontal pipes. J. Nat. Gas Sci Eng 2016; 33: 527-537.
  15. Rice, H.P.; Fairweather, M.; Peakall, J.; Hunter, T.N.; Mahmoud, B.; Biggs, S.R. Constraints on the functional form of the critical deposition velocity in solid–liquid pipe flow at low solid volume fractions. Chem. Eng. Sci. 2015, 126, 759–770. [Google Scholar] [CrossRef]
  16. Mansour, M.H.; A Zahran, A.; Rabie, L.H.; Shabaka, I.M. Experimental and numerical study of air-water flow characteristics in a horizontal duct. Proc. Inst. Mech. Eng. Part C: J. Mech. Eng. Sci. 2021, 235, 843–858. [Google Scholar] [CrossRef]
  17. Fatahi, M.; Farzanegan, A. An analysis of multiphase flow and solids separation inside Knelson Concentrator based on four-way coupling of CFD and DEM simulation methods. Miner. Eng. 2018, 126, 130–144. [Google Scholar] [CrossRef]
  18. Zhou, M.; Wang, S.; Kuang, S.; Luo, K.; Fan, J.; Yu, A. CFD-DEM modelling of hydraulic conveying of solid particles in a vertical pipe. Powder Technol. 2019, 354, 893–905. [Google Scholar] [CrossRef]
  19. Zeng, D.; Zhang, E.; Ding, Y.; Yi, Y.; Xian, Q.; Yao, G.; Zhu, H.; Shi, T. Investigation of erosion behaviors of sulfur-particle-laden gas flow in an elbow via a CFD-DEM coupling method. Powder Technol. 2018, 329, 115–128. [Google Scholar] [CrossRef]
  20. Petit, H.A.; Irassar, E.F.; Barbosa, M.R. Evaluation of the performance of the cross-flow air classifier in manufactured sand processing via CFD–DEM simulations. Comput. Part. Mech. 2017, 5, 87–102. [Google Scholar] [CrossRef]
  21. Li, L.; Qi, H.; Yin, Z.; Li, D.; Zhu, Z.; Tangwarodomnukun, V.; Tan, D. Investigation on the multiphase sink vortex Ekman pumping effects by CFD-DEM coupling method. Powder Technol. 2019, 360, 462–480. [Google Scholar] [CrossRef]
  22. Li, T.; Zhang, H.; Kuang, S.; Yan, H.; Diao, X.; Huang, Z.; Bo, H.; Dong, Y. Experimental and numerical study of coarse particle conveying in the small absorber sphere system: Overview and some recent CFD-DEM simulations. Nucl. Eng. Des. 2020, 357, 110420. [Google Scholar] [CrossRef]
  23. Naukkarinen, T.; Nikku, M.; Turunen-Saaresti, T. CFD-DEM simulations of hydrodynamics of combined ion exchange-membrane filtration. Chem. Eng. Sci. 2019, 208, 115151. [Google Scholar] [CrossRef]
  24. Zhao, H.; Zhao, Y. CFD-DEM simulation of pneumatic conveying in a horizontal pipe. Powder Technol. 2020, 373, 58–72. [Google Scholar] [CrossRef]
  25. Uzi, A.; Halevy, G.B.; Levy, A. CFD-DEM Modeling of soluble NaCl particles conveyed in brine. Powder Technol. 2020, 360, 1278–1294. [Google Scholar] [CrossRef]
  26. Vångö, M.; Pirker, S.; Lichtenegger, T. Unresolved CFD–DEM modeling of multiphase flow in densely packed particle beds. Appl. Math. Model. 2018, 56, 501–516. [Google Scholar] [CrossRef]
  27. Mindlin, R.D.; Deresiewicz, H. Elastic Spheres in Contact Under Varying Oblique Forces. J. Appl. Mech. 1953, 20, 327–344. [Google Scholar] [CrossRef]
  28. Wu, L.; Gong, M.; Wang, J. Development of a DEM–VOF Model for the Turbulent Free-Surface Flows with Particles and Its Application to Stirred Mixing System. Ind. Eng. Chem. Res. 2018, 57, 1714–1725. [Google Scholar] [CrossRef]
  29. Zhu H P, Yu A B. Discrete particle simulation of particulate systems[J]. Chem Eng Sci 2007; 62(13): 3378-3396.
  30. Sobieski, W. Switch Function and Sphericity Coefficient in the Gidaspow Drag Model for Modeling Solid-Fluid Systems. Dry. Technol. 2009, 27, 267–280. [Google Scholar] [CrossRef]
  31. Anderson TB, Jackson R. A fluid mechanical description of fluidized beds. Equations of motion. I & Ec Fund 1967; 6: 527-539.
  32. Saffman, P.G. The lift on a small sphere in a slow shear flow. J. Fluid Mech. 1965, 22, 385–400. [Google Scholar] [CrossRef]
  33. Rubinow, S.I.; Keller, J.B. The transverse force on a spinning sphere moving in a viscous fluid. J. Fluid Mech. 1961, 11, 447–459. [Google Scholar] [CrossRef]
  34. Wang, Y.; Xia, Y.; Xiao, X.; Xu, H.; Chen, P.; Zeng, G. Ballast Flow Characteristics of Discharging Pipeline in Shield Slurry System. Appl. Sci. 2019, 9, 5402. [Google Scholar] [CrossRef]
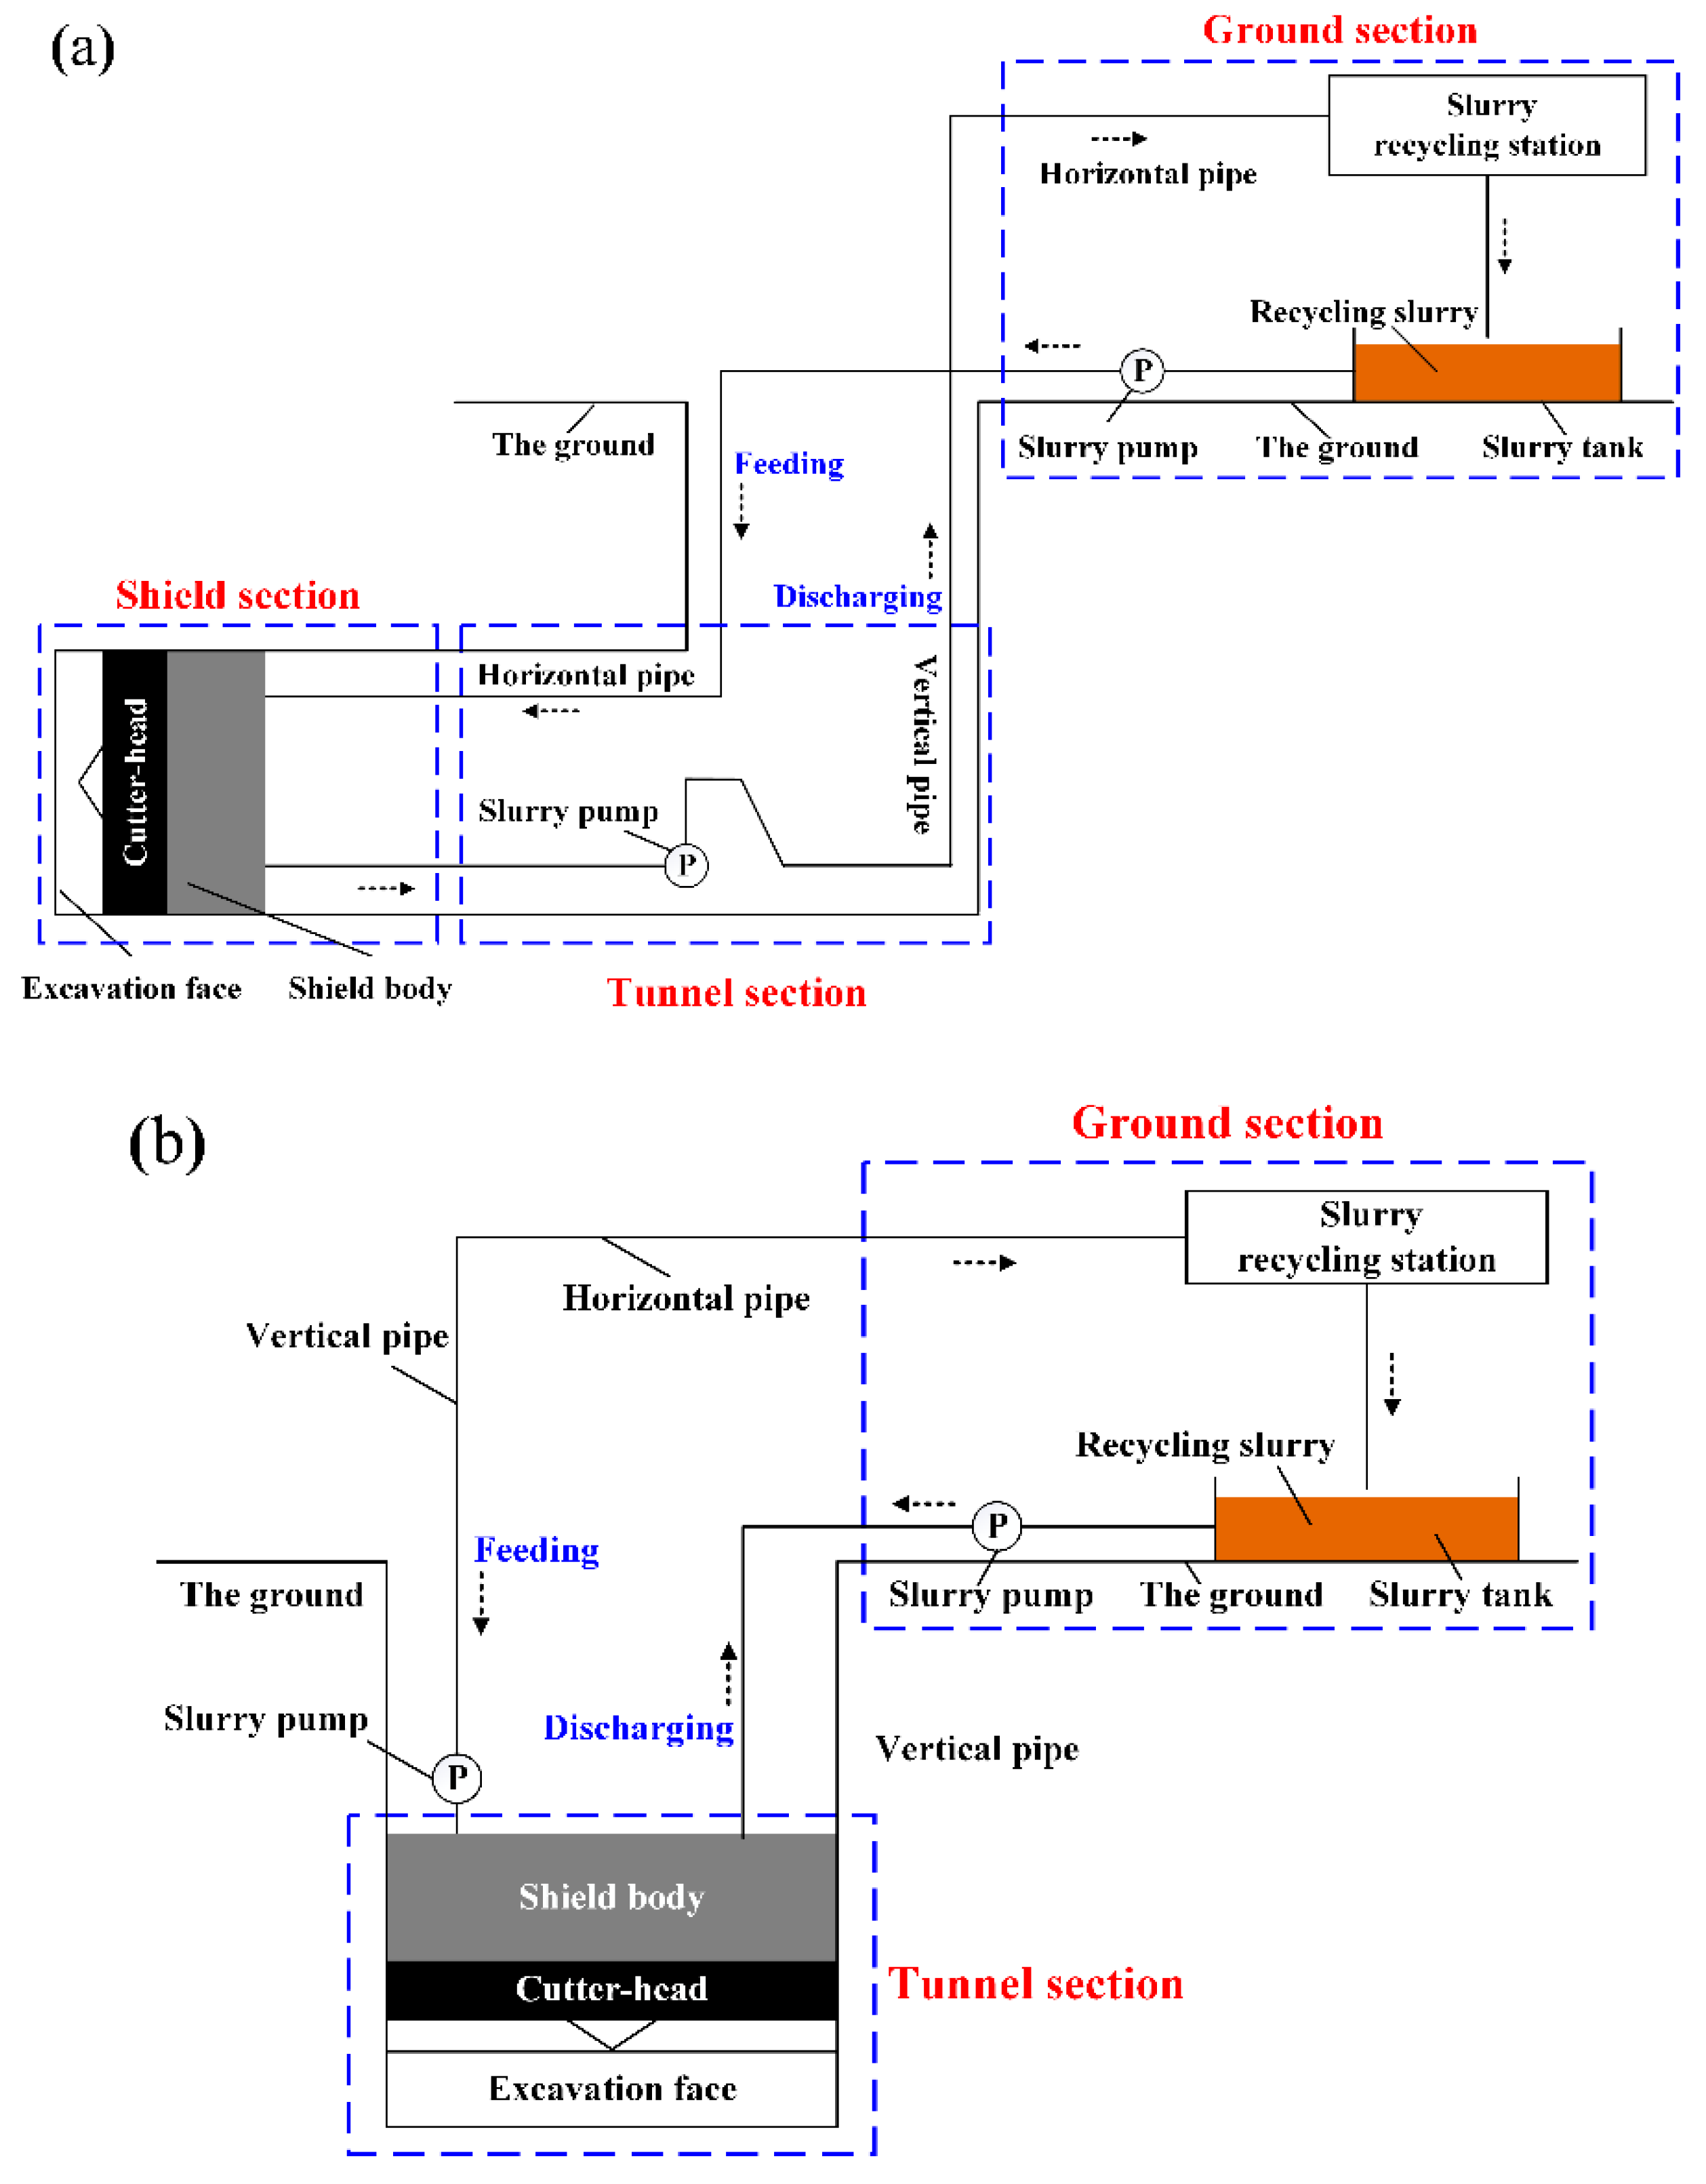
Figure 1. Pipe layout schematic diagram of the slurry system: a) slurry shield machine; b) shaft boring machine.
Preprints 78295 g001
Figure 2. Numerical model of the ballast pick-up velocity.
Preprints 78295 g002
Figure 3. Working principle of the experimental platform.
Preprints 78295 g003
Figure 4. Simulation and experiment results of 20 mm ballast group distribution state. (db = 20 mm, mbg = 10 kg, D = 200 mm, h = 2 m, Cv = 7.5 %).
Preprints 78295 g004
Figure 5. Simulation and experimental results of the ballast group pick-up velocity with different ballast sizes.
Preprints 78295 g005
Figure 6. Ballast group distribution state under different slurry velocities (db = 30 mm, mbg = 30 kg, D = 300 mm, h = 2 m, Cv = 8.1 %, t = 8 s).
Preprints 78295 g006
Figure 7. Ballast group velocity vector diagram under different stages.
Preprints 78295 g007
Figure 8. Law of ballast group average velocity under different slurry velocities.
Preprints 78295 g008
Figure 9. Variation curve of the ballast mass residual rate in the vertical pipeline.
Preprints 78295 g009
Figure 10. Single ballast and ballast group pick-up velocity under different ballast size conditions.
Preprints 78295 g010
Figure 11. Ballast group pick-up velocity under different ballast concentration conditions.
Preprints 78295 g011
Table 1. Experimental operating parameters.
Experiment parameters Value(s)
Ballast equivalent diameter (mm) 10, 20, 30, 40, 50
Ballast stacking quality (kg) 0.001-10
Ballast density (kg/m3) 2140
Water density (kg/m3) 1000
Water viscosity (Pa⋅s) 0.001
Ballast shape factor 0.91
Table 2. Ballast group pick-up velocity.
Parameters Values
Ballast diameter (mm) 10, 20, 30, 40, 50
Experiment value (m/s) 0.52, 0.65, 0.77, 0.85, 0.91
Simulation value (m/s) 0.50, 0.70, 0.80, 0.90, 0.97
Table 3. Simulation setting parameters.
Simulation Parameters Value(s) Simulation Parameters Value(s)
Ballast diameter (mm) 15-75 Sliding friction coefficient ballast-ballast 1
Ballast stacking quality (kg) 0.001-110 ballast-wall 0.5
Ballast density (kg/m3) 2650 rolling friction coefficient ballast-ballast 0.05
Slurry density (kg/m3) 1100 ballast-wall 0.15
Slurry viscosity (Pa⋅s) 0.01 restitution coefficient ballast-ballast 0.35
Ballast shape factor 0.91 ballast-wall 0.55
Disclaimer/Publisher’s Note: The statements, opinions and data contained in all publications are solely those of the individual author(s) and contributor(s) and not of MDPI and/or the editor(s). MDPI and/or the editor(s) disclaim responsibility for any injury to people or property resulting from any ideas, methods, instructions or products referred to in the content.
Copyright: This open access article is published under a Creative Commons CC BY 4.0 license, which permit the free download, distribution, and reuse, provided that the author and preprint are cited in any reuse.
Prerpints.org logo

Preprints.org is a free preprint server supported by MDPI in Basel, Switzerland.

Subscribe

© 2024 MDPI (Basel, Switzerland) unless otherwise stated