2.1. Sample Analysis Prior to Cleaning Treatment
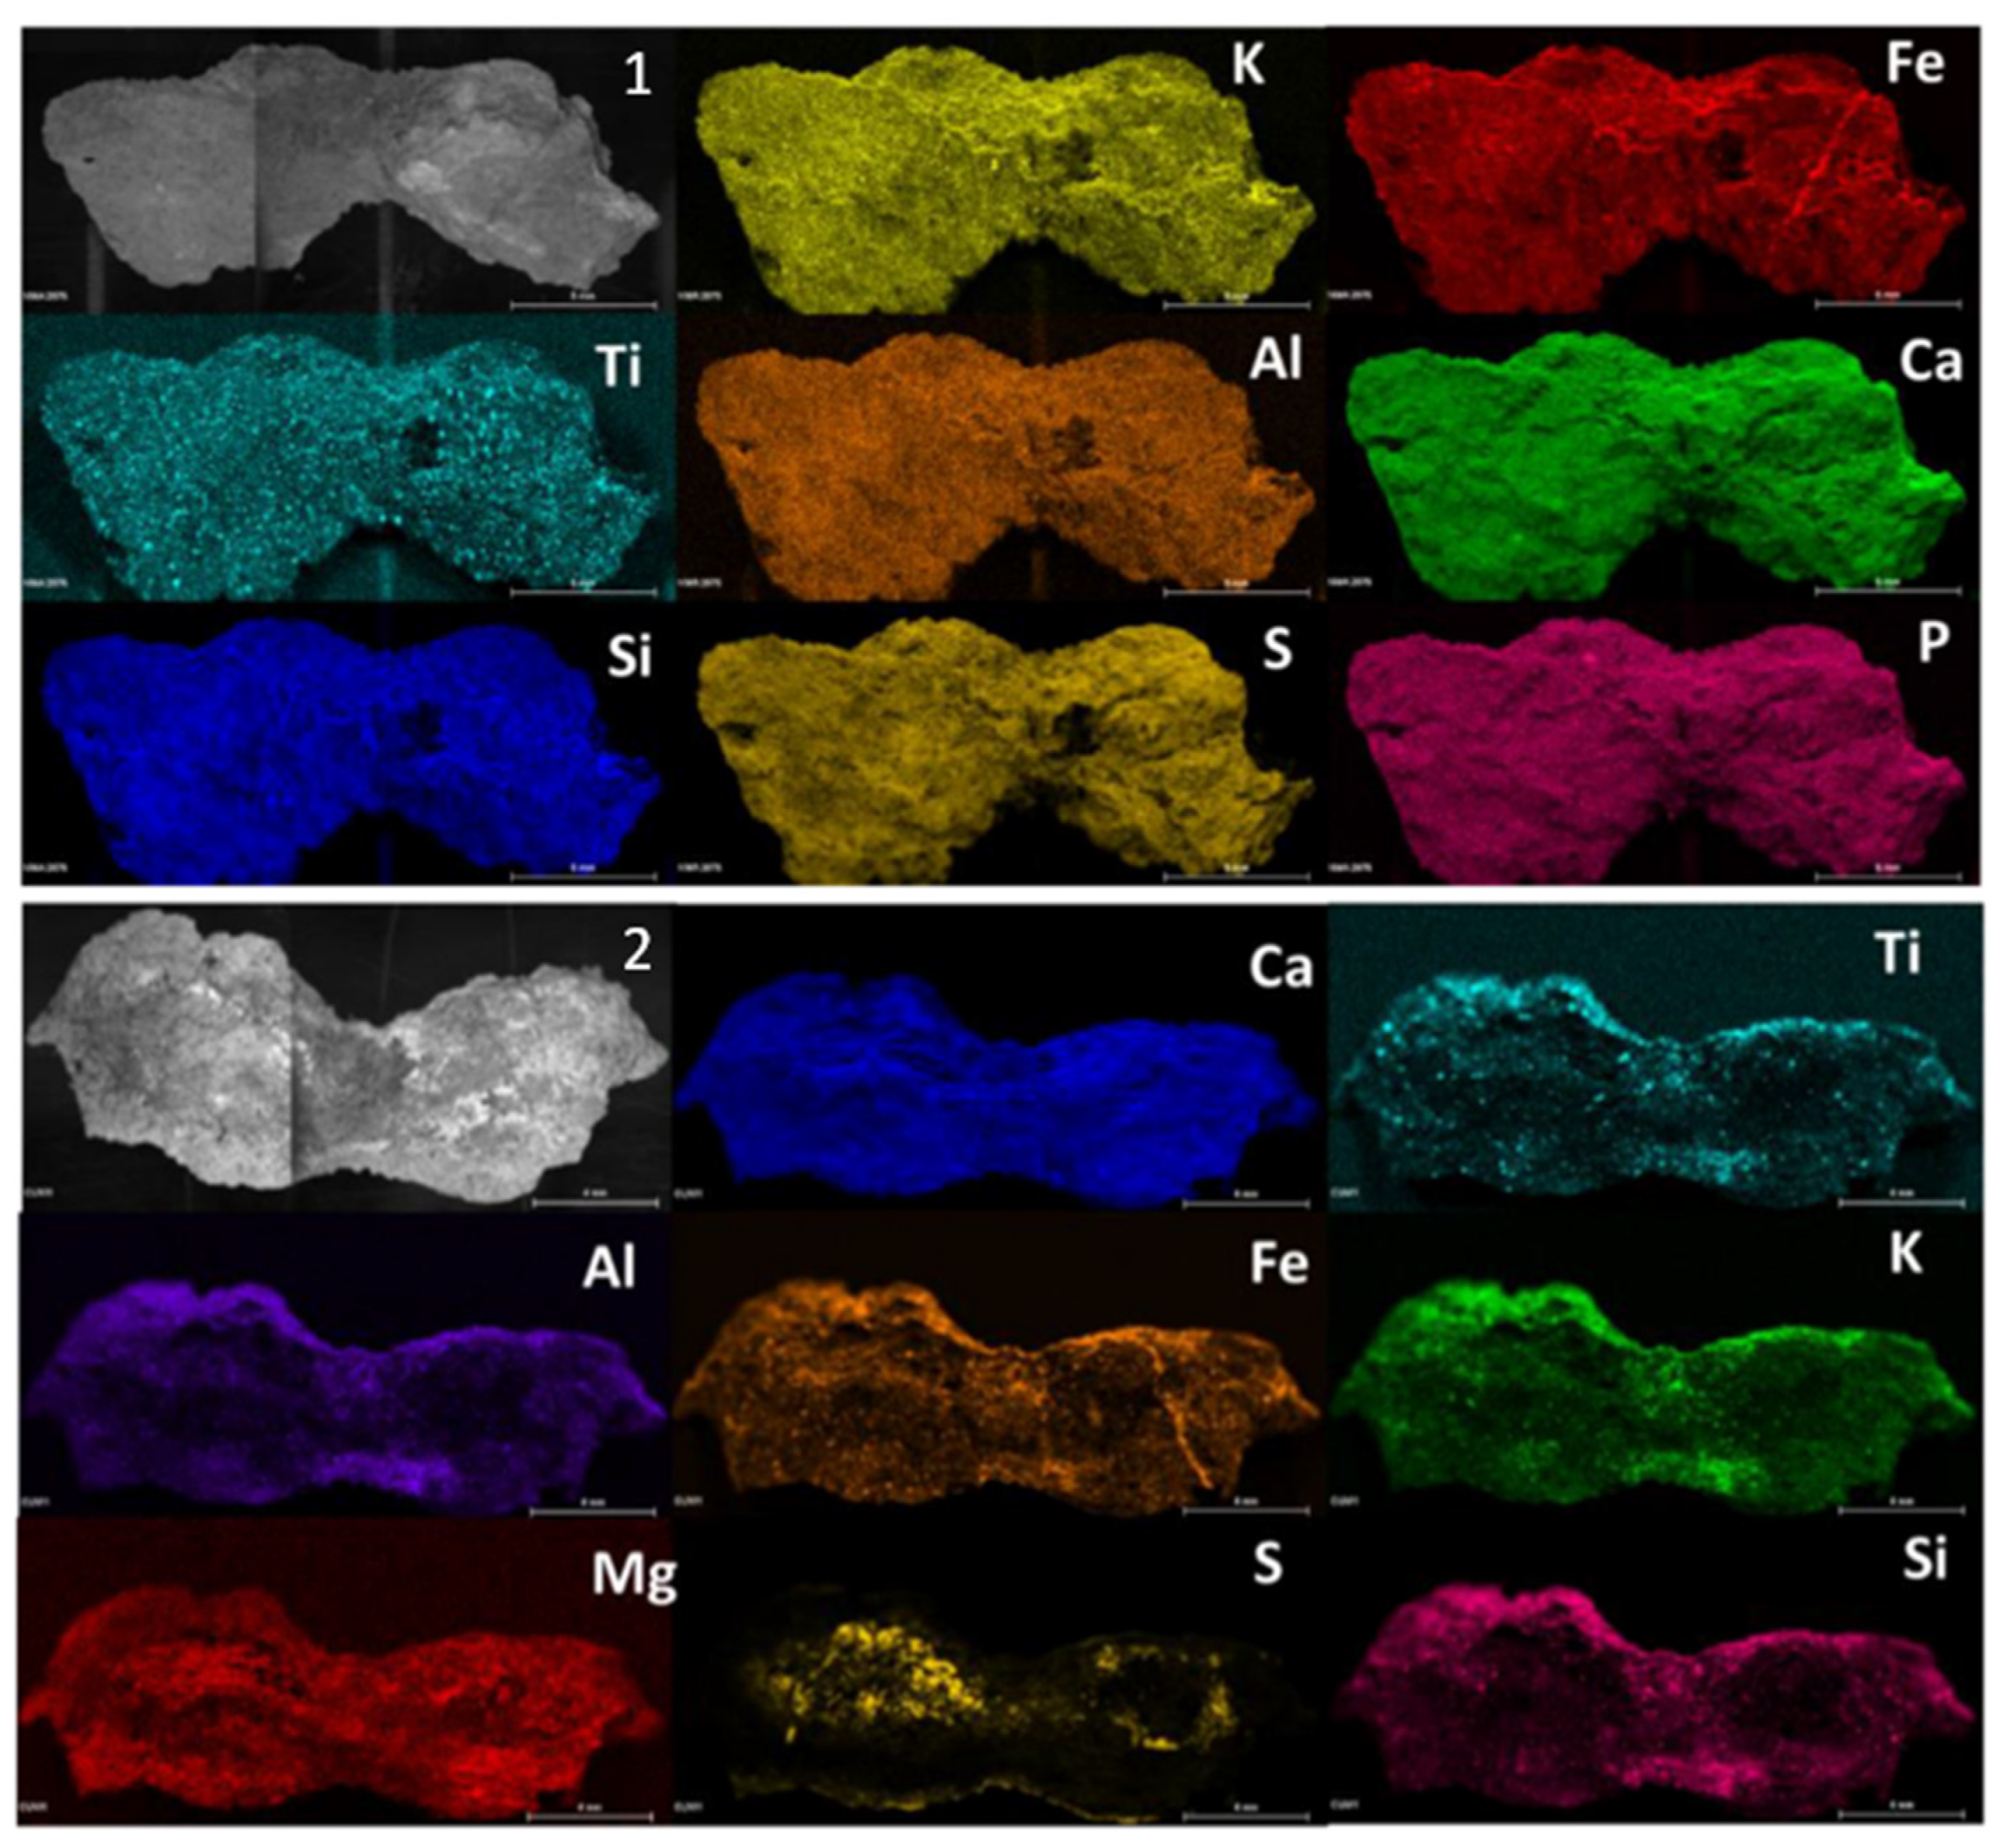
Micro X-ray fluorescence analyses were performed to define the elemental composition of the samples. For this purpose, several elemental images were acquired (
Figure 1) on the both sides of the sample CV01. Although the whitish patina was not appreciable at the naked eye on this sample, according to the restorers, the sulphur was homogeneously distributed throughout the sample exposed surface if compared to the inner face where only some areas showed the presence of the element. On the other hand, calcium maps showed the presence of this element distributed throughout the piece. The presence of magnesium stood out in the CV01 sample and was more evident on the inner face.
In all the micro-samples analysed, the presence of sulfur was less perceptible at the elemental level on the inner face, while calcium and silicon in less extent, were the major elements. The main composition of the samples coming from the rocky support was based on calcium, silicon, magnesium, aluminium, iron, potassium, titanium varying slightly in its relative presence. On the other hand, in some samples aggregates of titanium, zinc, chrome, manganese, copper and chlorine were evident corresponding to the composition of the support. In some samples, sulfur was observed also on the internal face mainly in the cracking zone of the samples (
Figure S1 in supporting information) This suggested that the formation of sulfur compounds from the exterior part could be responsible for the phenomenon of exfoliation of the support described by restorers.
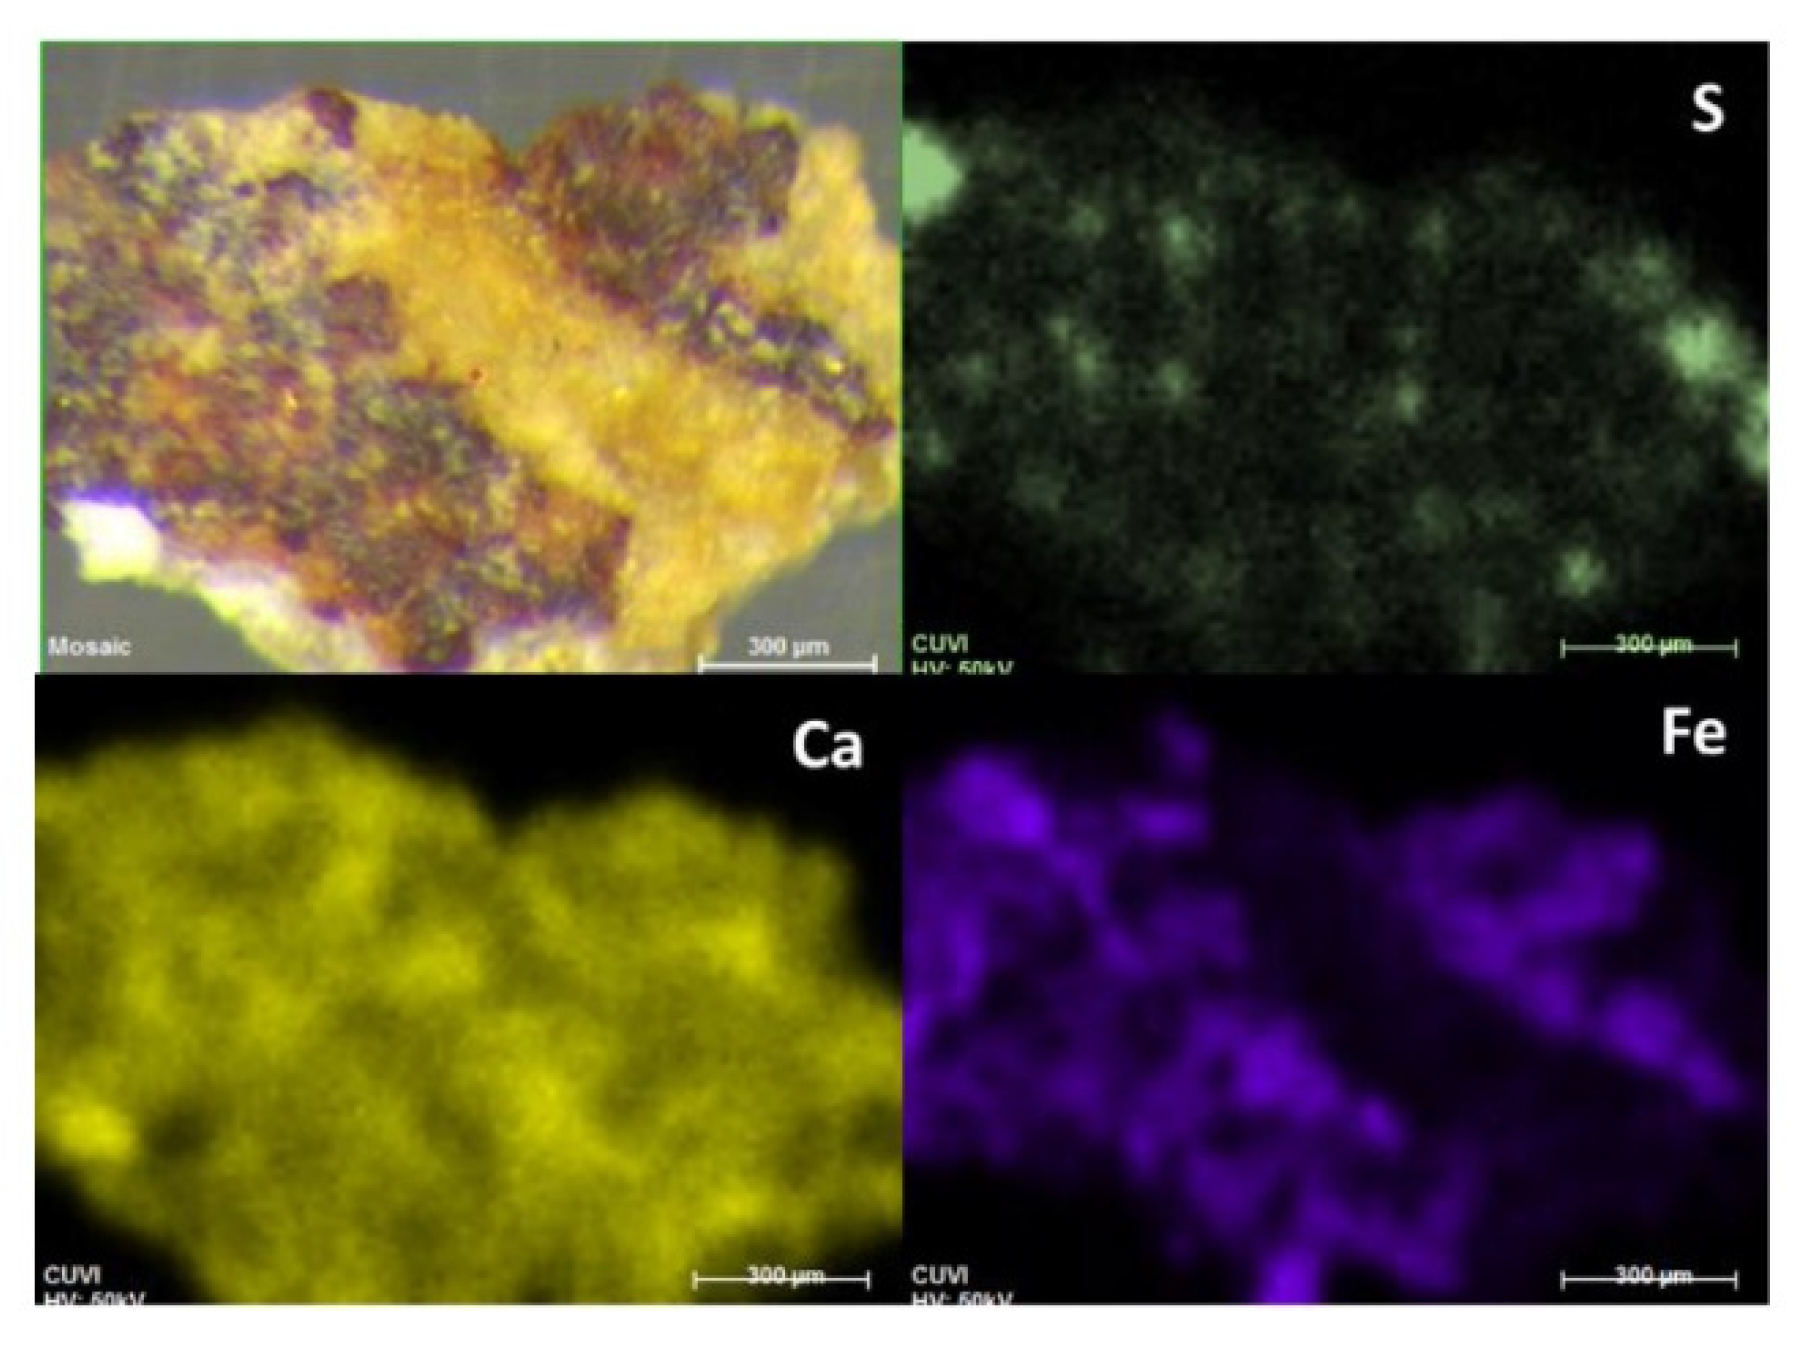
Regarding the only micro-sample that showed traces of visible red pigmentation (
Figure 2) the elemental map of iron coincided with the red area suggesting the use of iron oxide for the painting. On the other hand, the elemental maps of this sample did not show a homogeneous layer of sulphur in the surface as indicated by the rock-bearing analysis and only some S hotspots were visible.
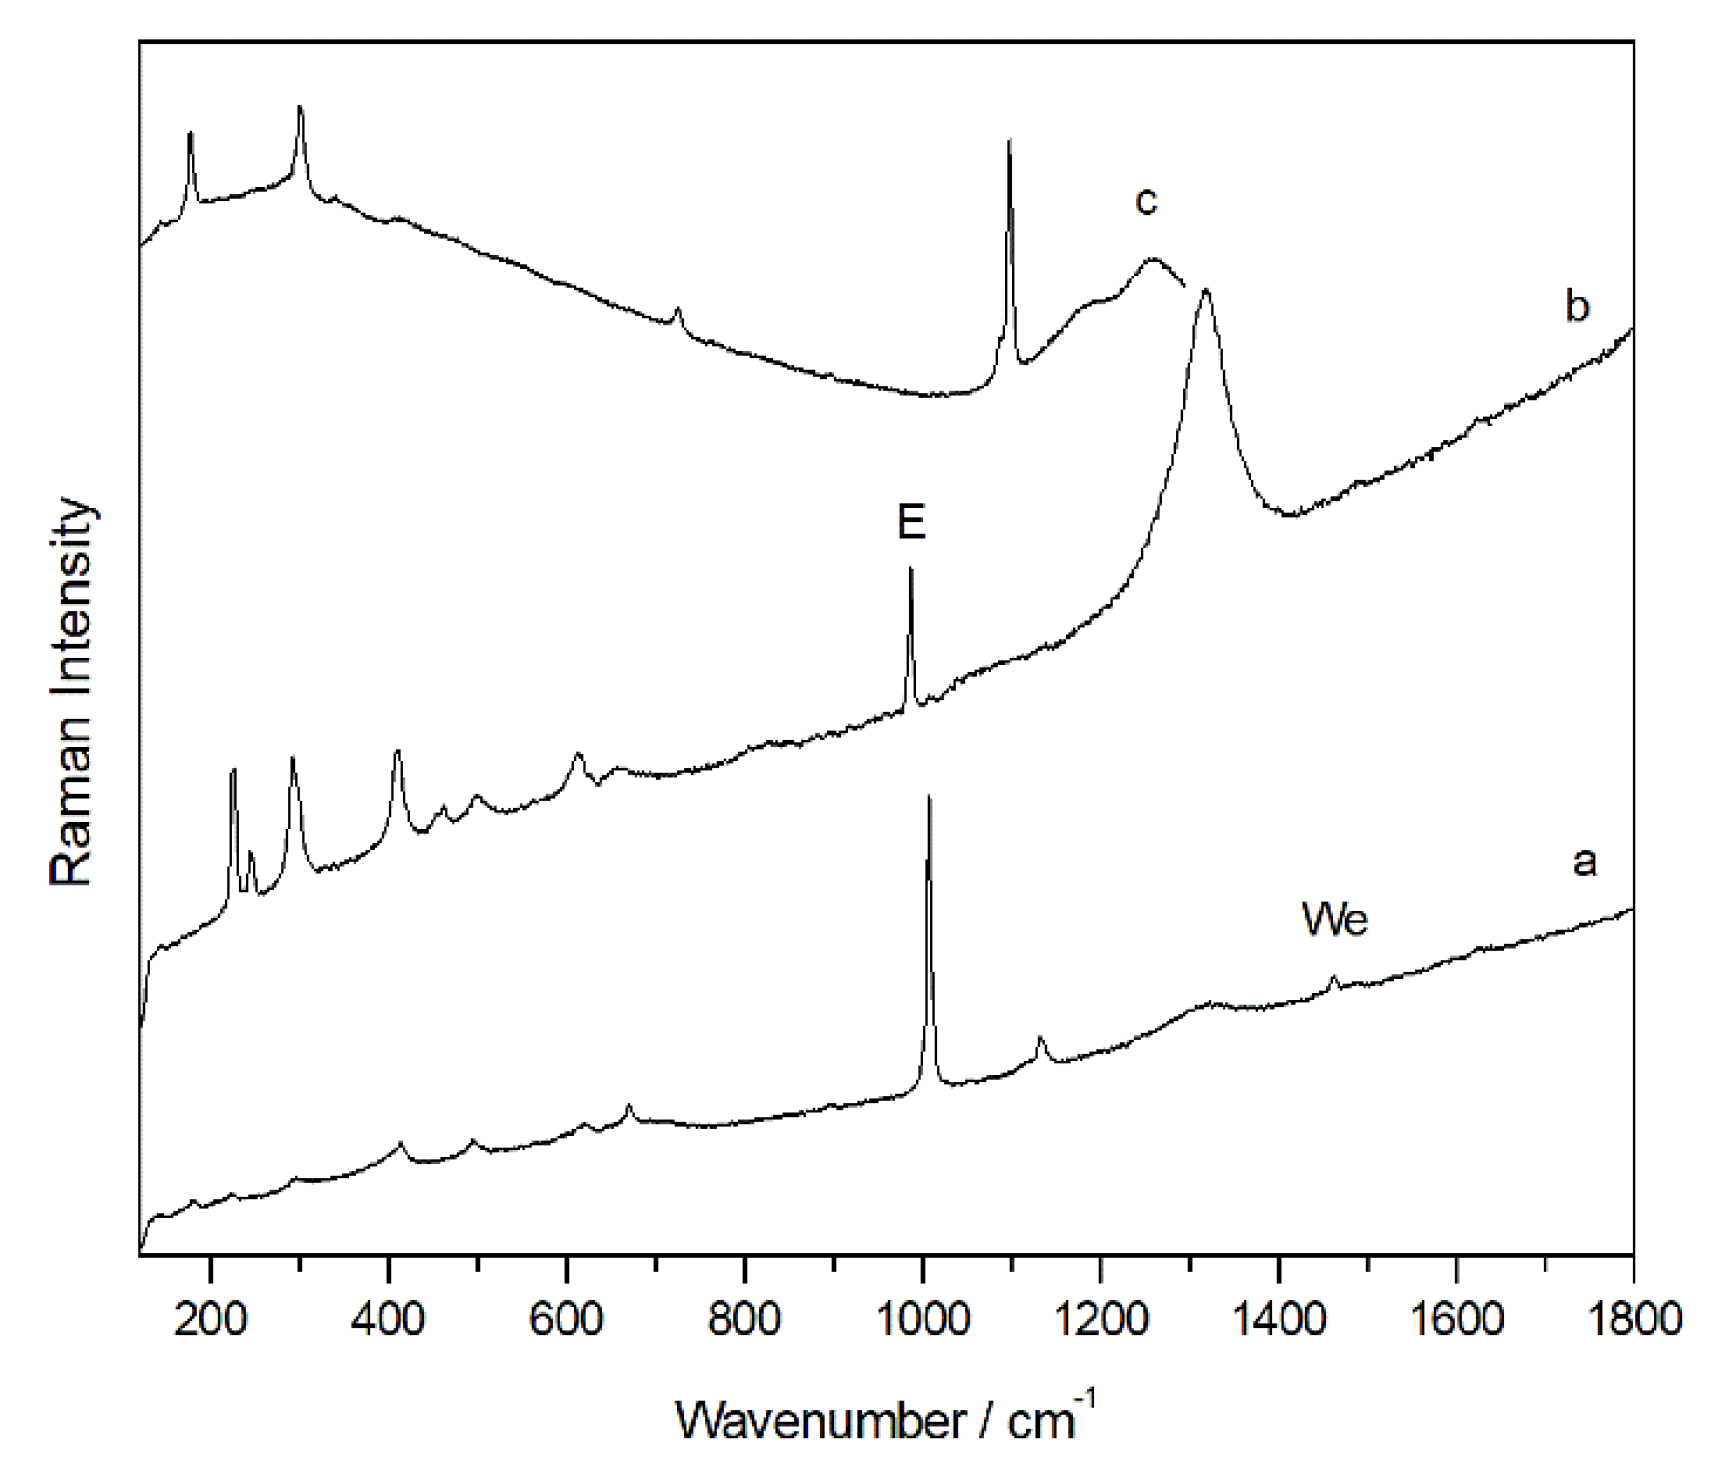
By means of Raman spectroscopy in the majority of the points analysed, on the external face of all samples, the presence of gypsum (CaSO4·2H2O, Raman bands: 180, 414, 492,620, 670, 1008 and 1135 cm-1) and calcium carbonate (CaCO3, Raman bands: 154, 282, 712 y 1986 cm-1) was largely detected. Even calcium magnesium carbonate dolomite (CaMg(CO3)2, Raman bands: 178, 300, 724 and 1098 cm-1) was identified in many analysis points, recognized like one of the main compounds of the support. Between the original compounds of the rock, Raman spectra of anatase (TiO2, Raman bands 142, 395, 514, 638 cm-1), rutile (TiO2, Raman bands: 142, 242, 446, 612 cm-1) and quartz (SiO2, Raman bands 204, 264, 354, 465, 807 cm-1) were also recorded. In red and orange grains, Raman analysis showed the presence of hematite iron oxides (Fe2O3, Raman bands: 224, 245, 294, 402, 500, 612 and 1315 cm-1) and goethite (α-FeOOH, Raman bands: 204, 246, 302, 389, 480 550 cm-1) which could be responsible for the orange colour of the stone. These oxides were found as loose grains on the surface of the sample and, therefore, their presence does not seem to be due to the presence of pigmentation in these samples.
In addition, a band at 985 cm-1 was detected in several spectra together with other compounds, mainly gypsum and calcite. This signal could belong to the magnesium sulfate heptahydrate so-called epsomite (MgSO4·7H2O) present on the surface of the sample as a degradation product of dolomite. Moreover, on the internal face, in most of the analysed points, the Raman spectrum of dolomite and calcium sulfate dihydrate or gypsum were observed. In several cases, the same Raman spectrum shows the coexistence of more than one compound at the same point of analysis. In fact, several spectra have evidenced the presence of a mixture of dolomite, gypsum and epsomite, which could clearly indicate sulfation of the original material.
This process could be favoured by the infiltration of sulfate-rich water coming from the back of the painted panel which carries sulphates from the stone and accumulates them on the surface after evaporating in the open-air. The formation of sulphates, especially with various hydration molecules, like epsomite, create an increases of the porous pressure within the rocky substrate during the hydration phase. Thus, sulfur was dissolved from rainwater, mobilised and precipitated during the crystallisation process due to rising temperatures.
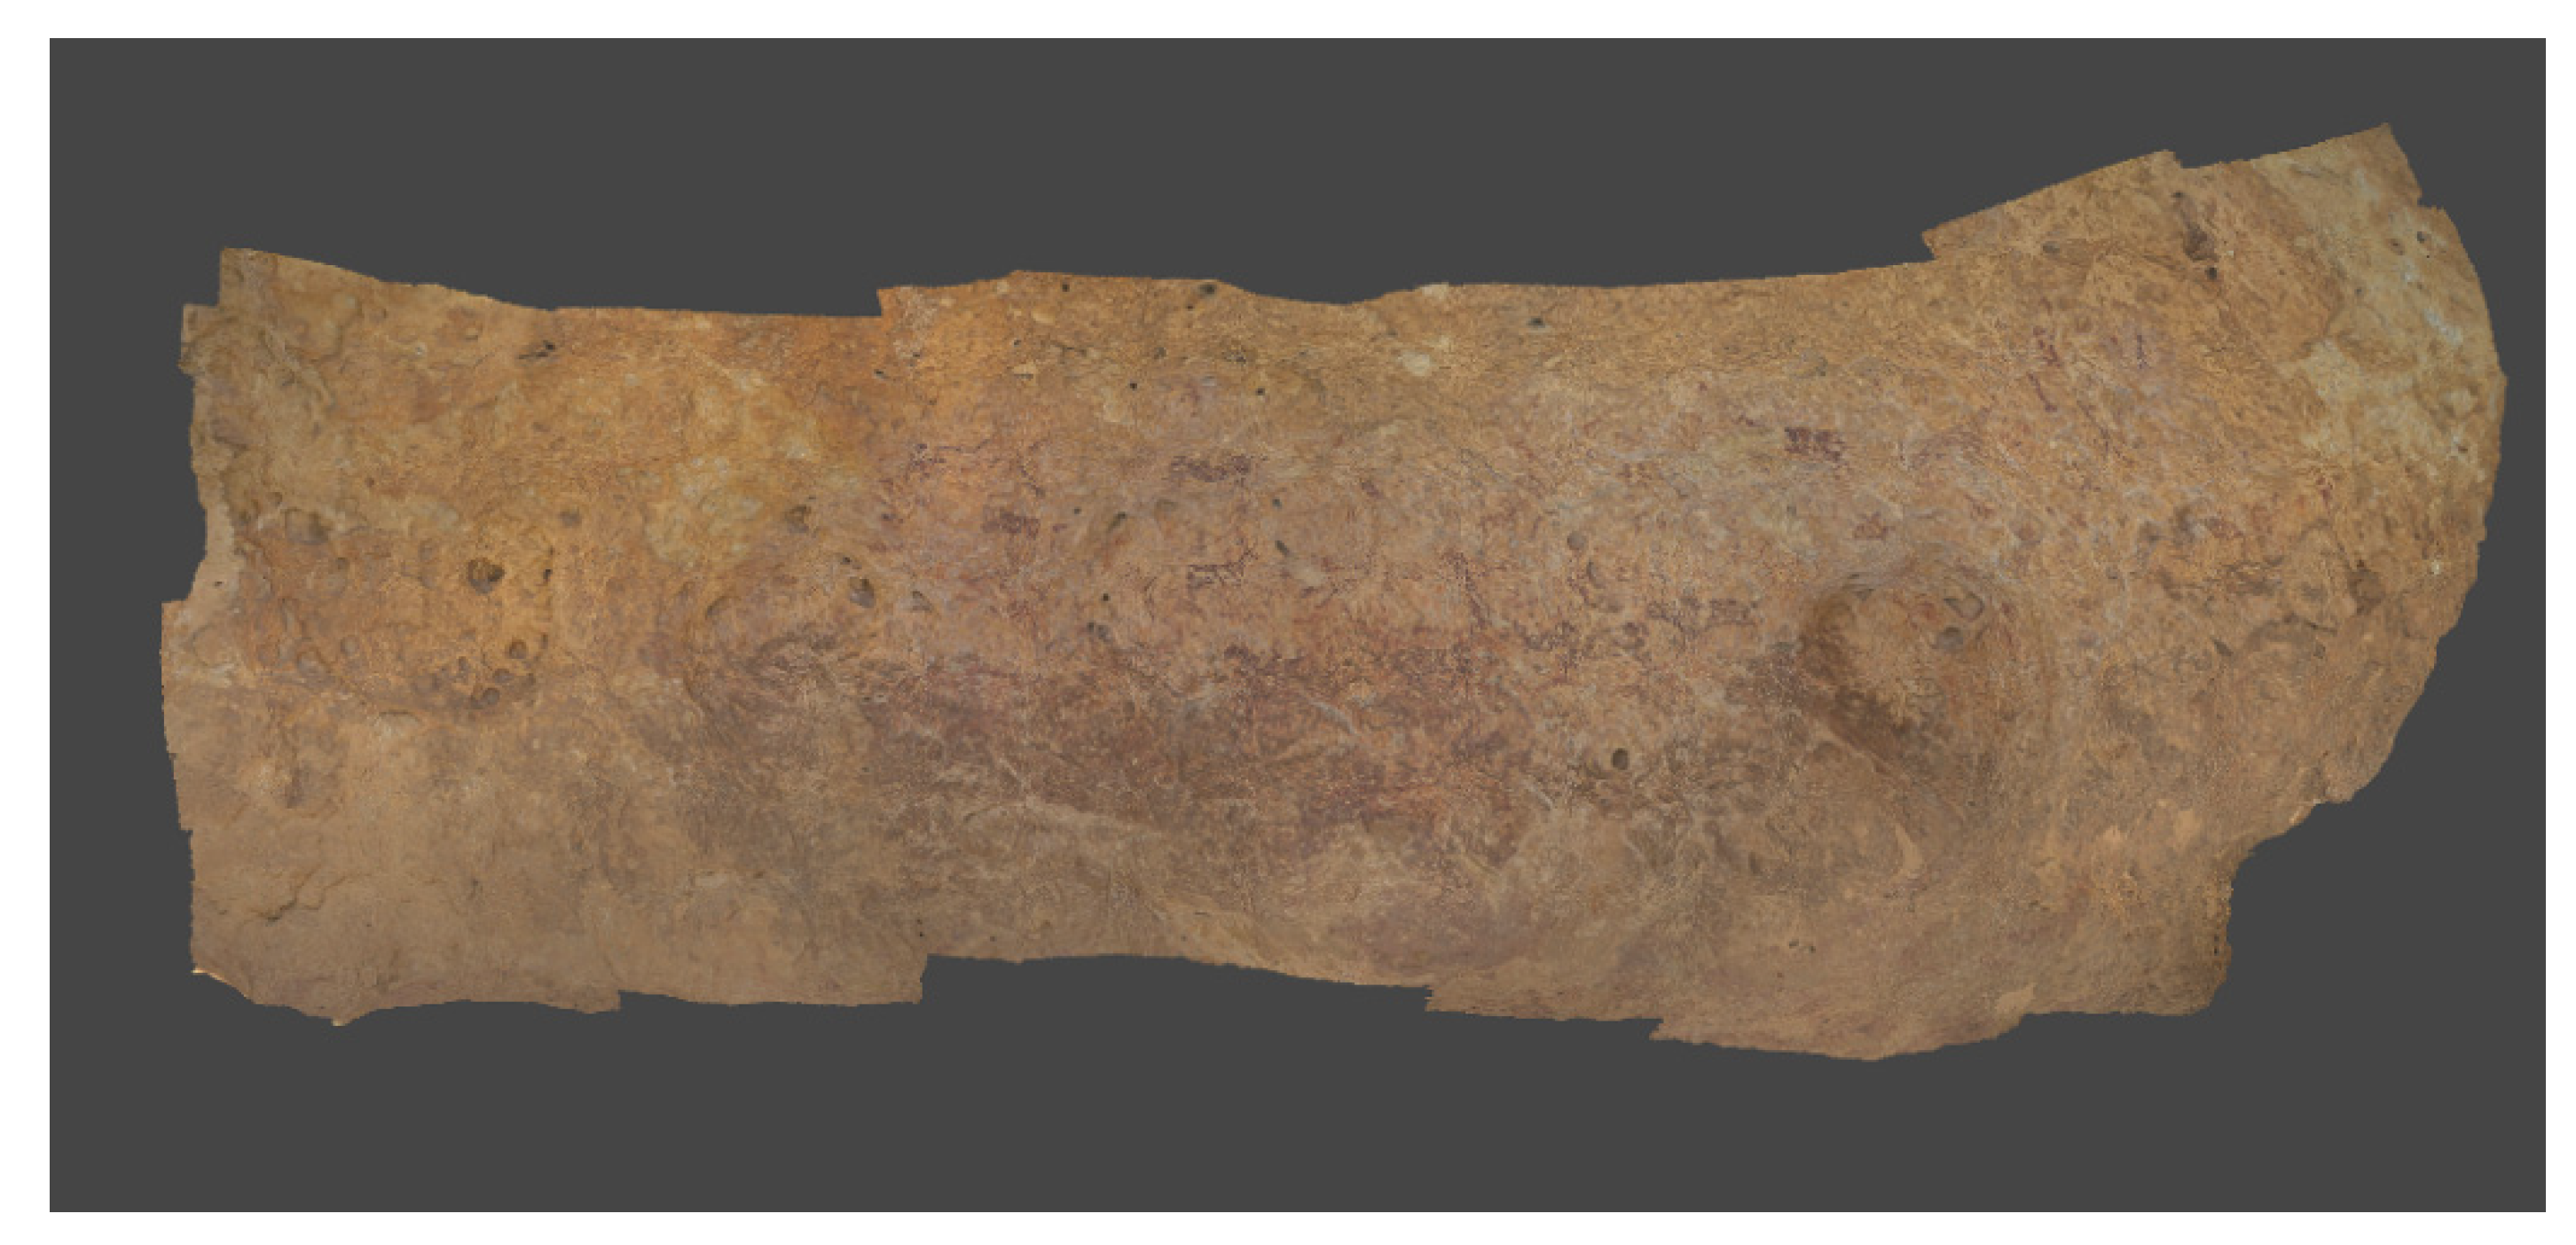
In addition, according to the archaeologists, the repeated humidification of the panel has been proven. This practice was common to all open-air rock art sites since their discovery until a couple of decades ago in order to improve the visualization of the pictographs to visitors. Considering that the white patina was located in the middle of the panel, where the pictographs were made, the anthropic factor could be possibly the reason of the formation of the sulphate patina. However, we cannot know exactly where the water used for this practice comes from (probably from the spring adjacent to rock shelter). It is not possible to know the composition of the water used when this practice was carried out. However, the water in the province of Albacete is characterised by a high hardness and presence of sulphates, so much so that just this year an osmosis plant for the treatment of drinking water to reduce the presence of salts and improve its quality.
The possibility of S being mobilised from the top of the rock shelter, as shown in other studies [
8], up to the painted wall, by a runoff process, seems to be ruled out, as a percolation process from the top of the panel was not evident. On the other hand, the sulfation of the support does not appear to be due to the presence of atmospheric contaminants, as the area where the
Cueva de la Vieja is located is not highly affected by urban traffic or industrial contamination.
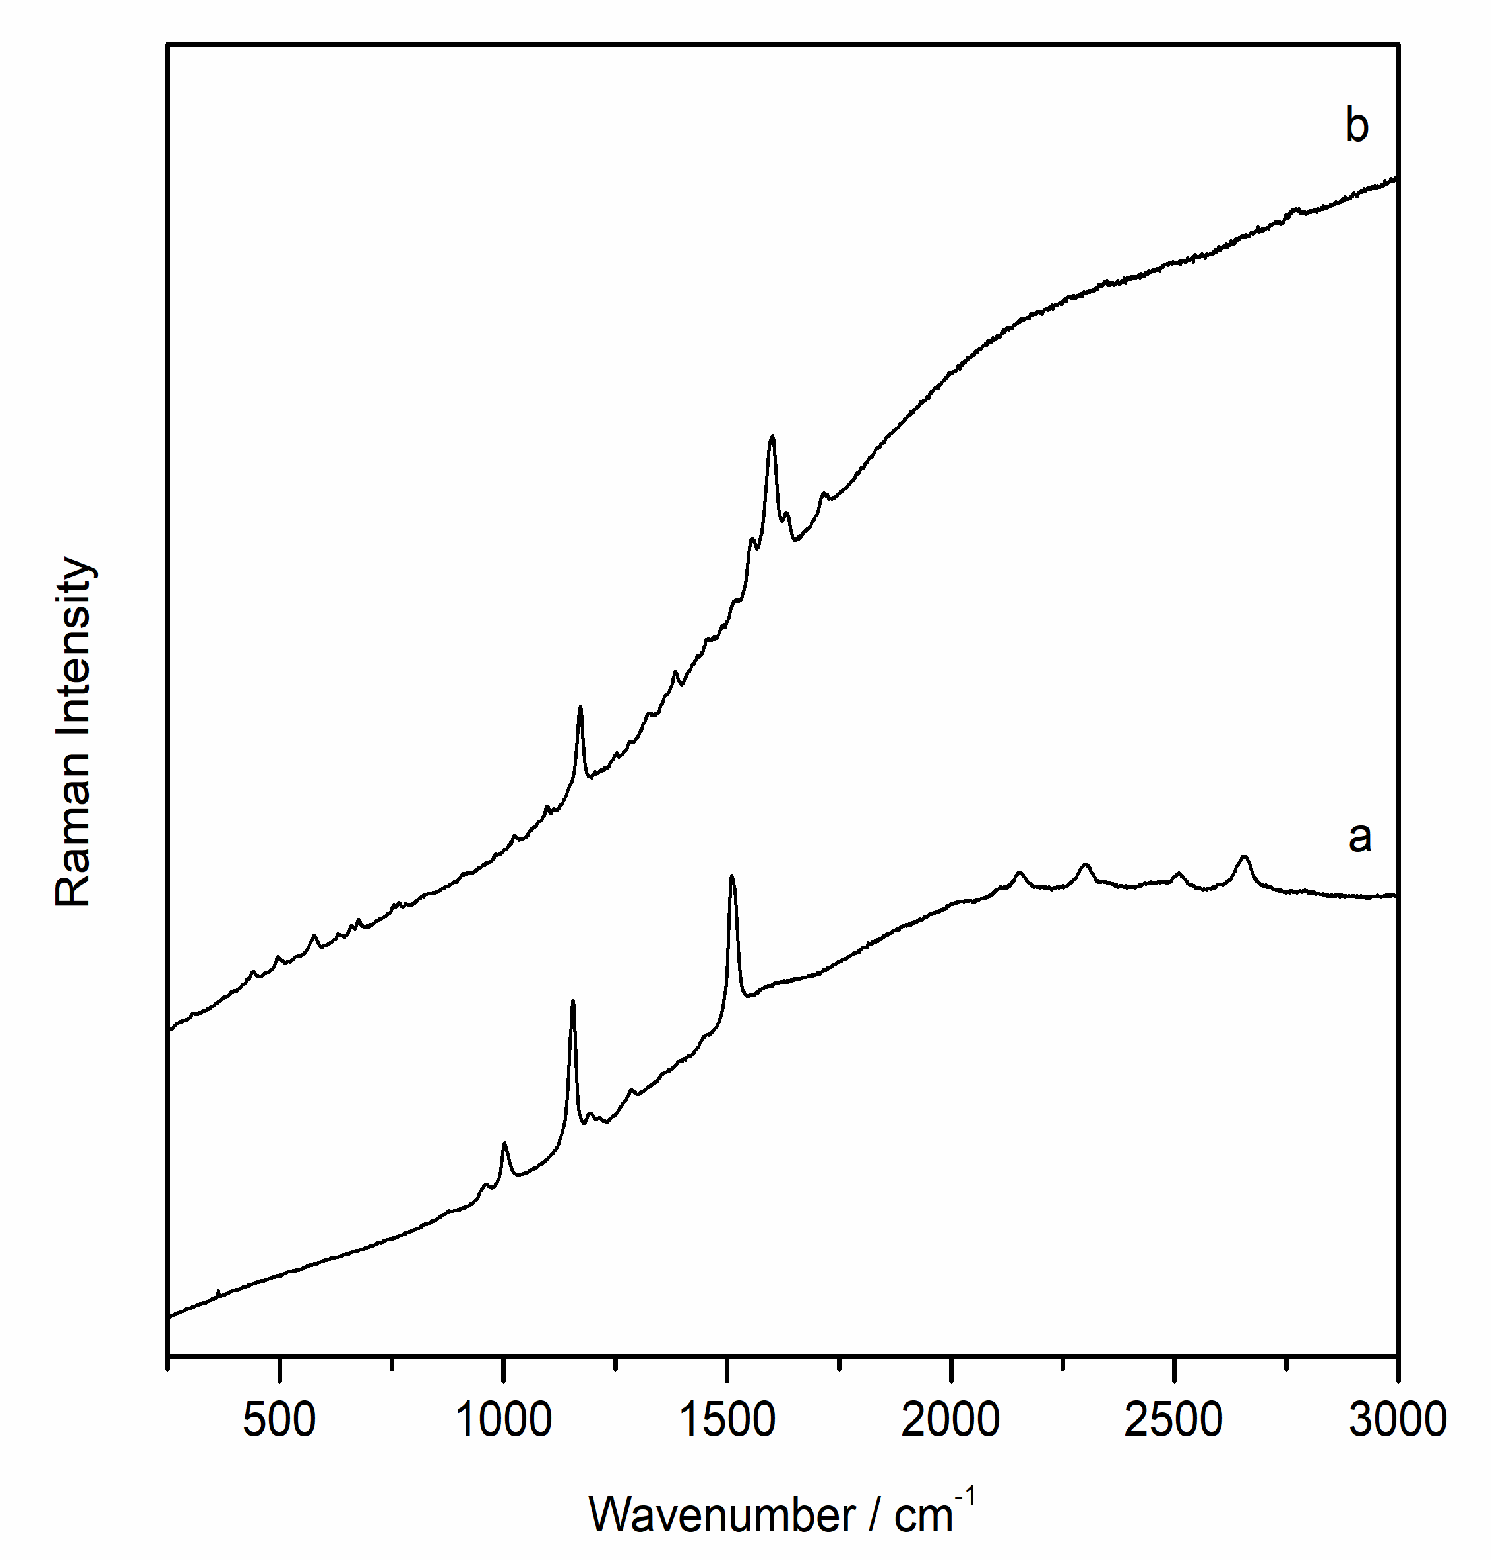
With regard to the degradation by microorganisms, it was detected in both the outer and inner parts of many samples. For example, in the inner face of the CuVi02 sample, in addition to hematite, calcite and dolomite, the presence of very well defined spectra of carotenoid pigments standed out. Specifically, Raman spectra of the carotenoid pigment astaxanthin (C
40H
52O
4,
Figure 4a), the most oxidized species among the carotenoid pigments and synthesized by species such as lichens, were recorded at several points. Its identification has been possible thanks to the main Raman bands at 1001, 1154, 1508 cm
-1 and its overtones (2150, 2298, 2509, 2654 cm
-1) that allowed distinguishing it from other carotenoid pigments such as carotene and zeaxanthin. In addition to astaxanthin, Raman spectra of scytonemin (C
36H
20N
2O
4), a pigment generally synthesized by cyanobacteria, were recorded (
Figure 4b). The highest intensity Raman bands that allowed its identification are at 1170, 1382, 1554, 1600, 1632, 1715 cm
-1.
As observed under the microscope, the outer face of the sample CuVi 03 was characterized by a homogeneous white colour. In this layer, mainly gypsum and dolomite spectra were recorded. Moreover, as observed in the image obtained with the microscope (Figure), the traces of hematite were clearly visible with Raman analyses. This could suggest the presence of pigmentation as it did not appear as loose grains as in the previous samples, suggesting an original composition. Therefore, this would indicate the loss of polychrome. Besides, Raman bands belonging to the calcium oxalates whewellite (192, 204, 220, 248, 895, 1461, 1488 cm-1) and weddelite (138, 1475 cm-1) were also detected in the same area. The presence of calcium oxalates could have favoured the preservation of pigmentation in that area.
Even in the unique sample taken from a painted area the presence of hematite was recognized by means Raman spectroscopy as pigment voluntary used. In all recorded spectra, the presence of calcium oxalate was also identified along with the broad bands between 1120 and 1650 cm
-1 that belong to the aluminosilicate compounds of the substrate. Calcium oxalates were even detected in the internal face of the sample. According to previous investigations of painted rock shelter the pictorial layer, composed mainly of hematite, was located between layers of calcium oxalate [
33] both caused by microorganism activity. The presence of this layer and one superior to the pictographs would be one of the factors that have allowed the conservation of prehistoric paintings to this day. Although the presence of calcium oxalate in the internal part of the sample with red pigmentation was also identified in our samples, its small size did not allow a more in-depth study by means of a cross-section study of the sample.
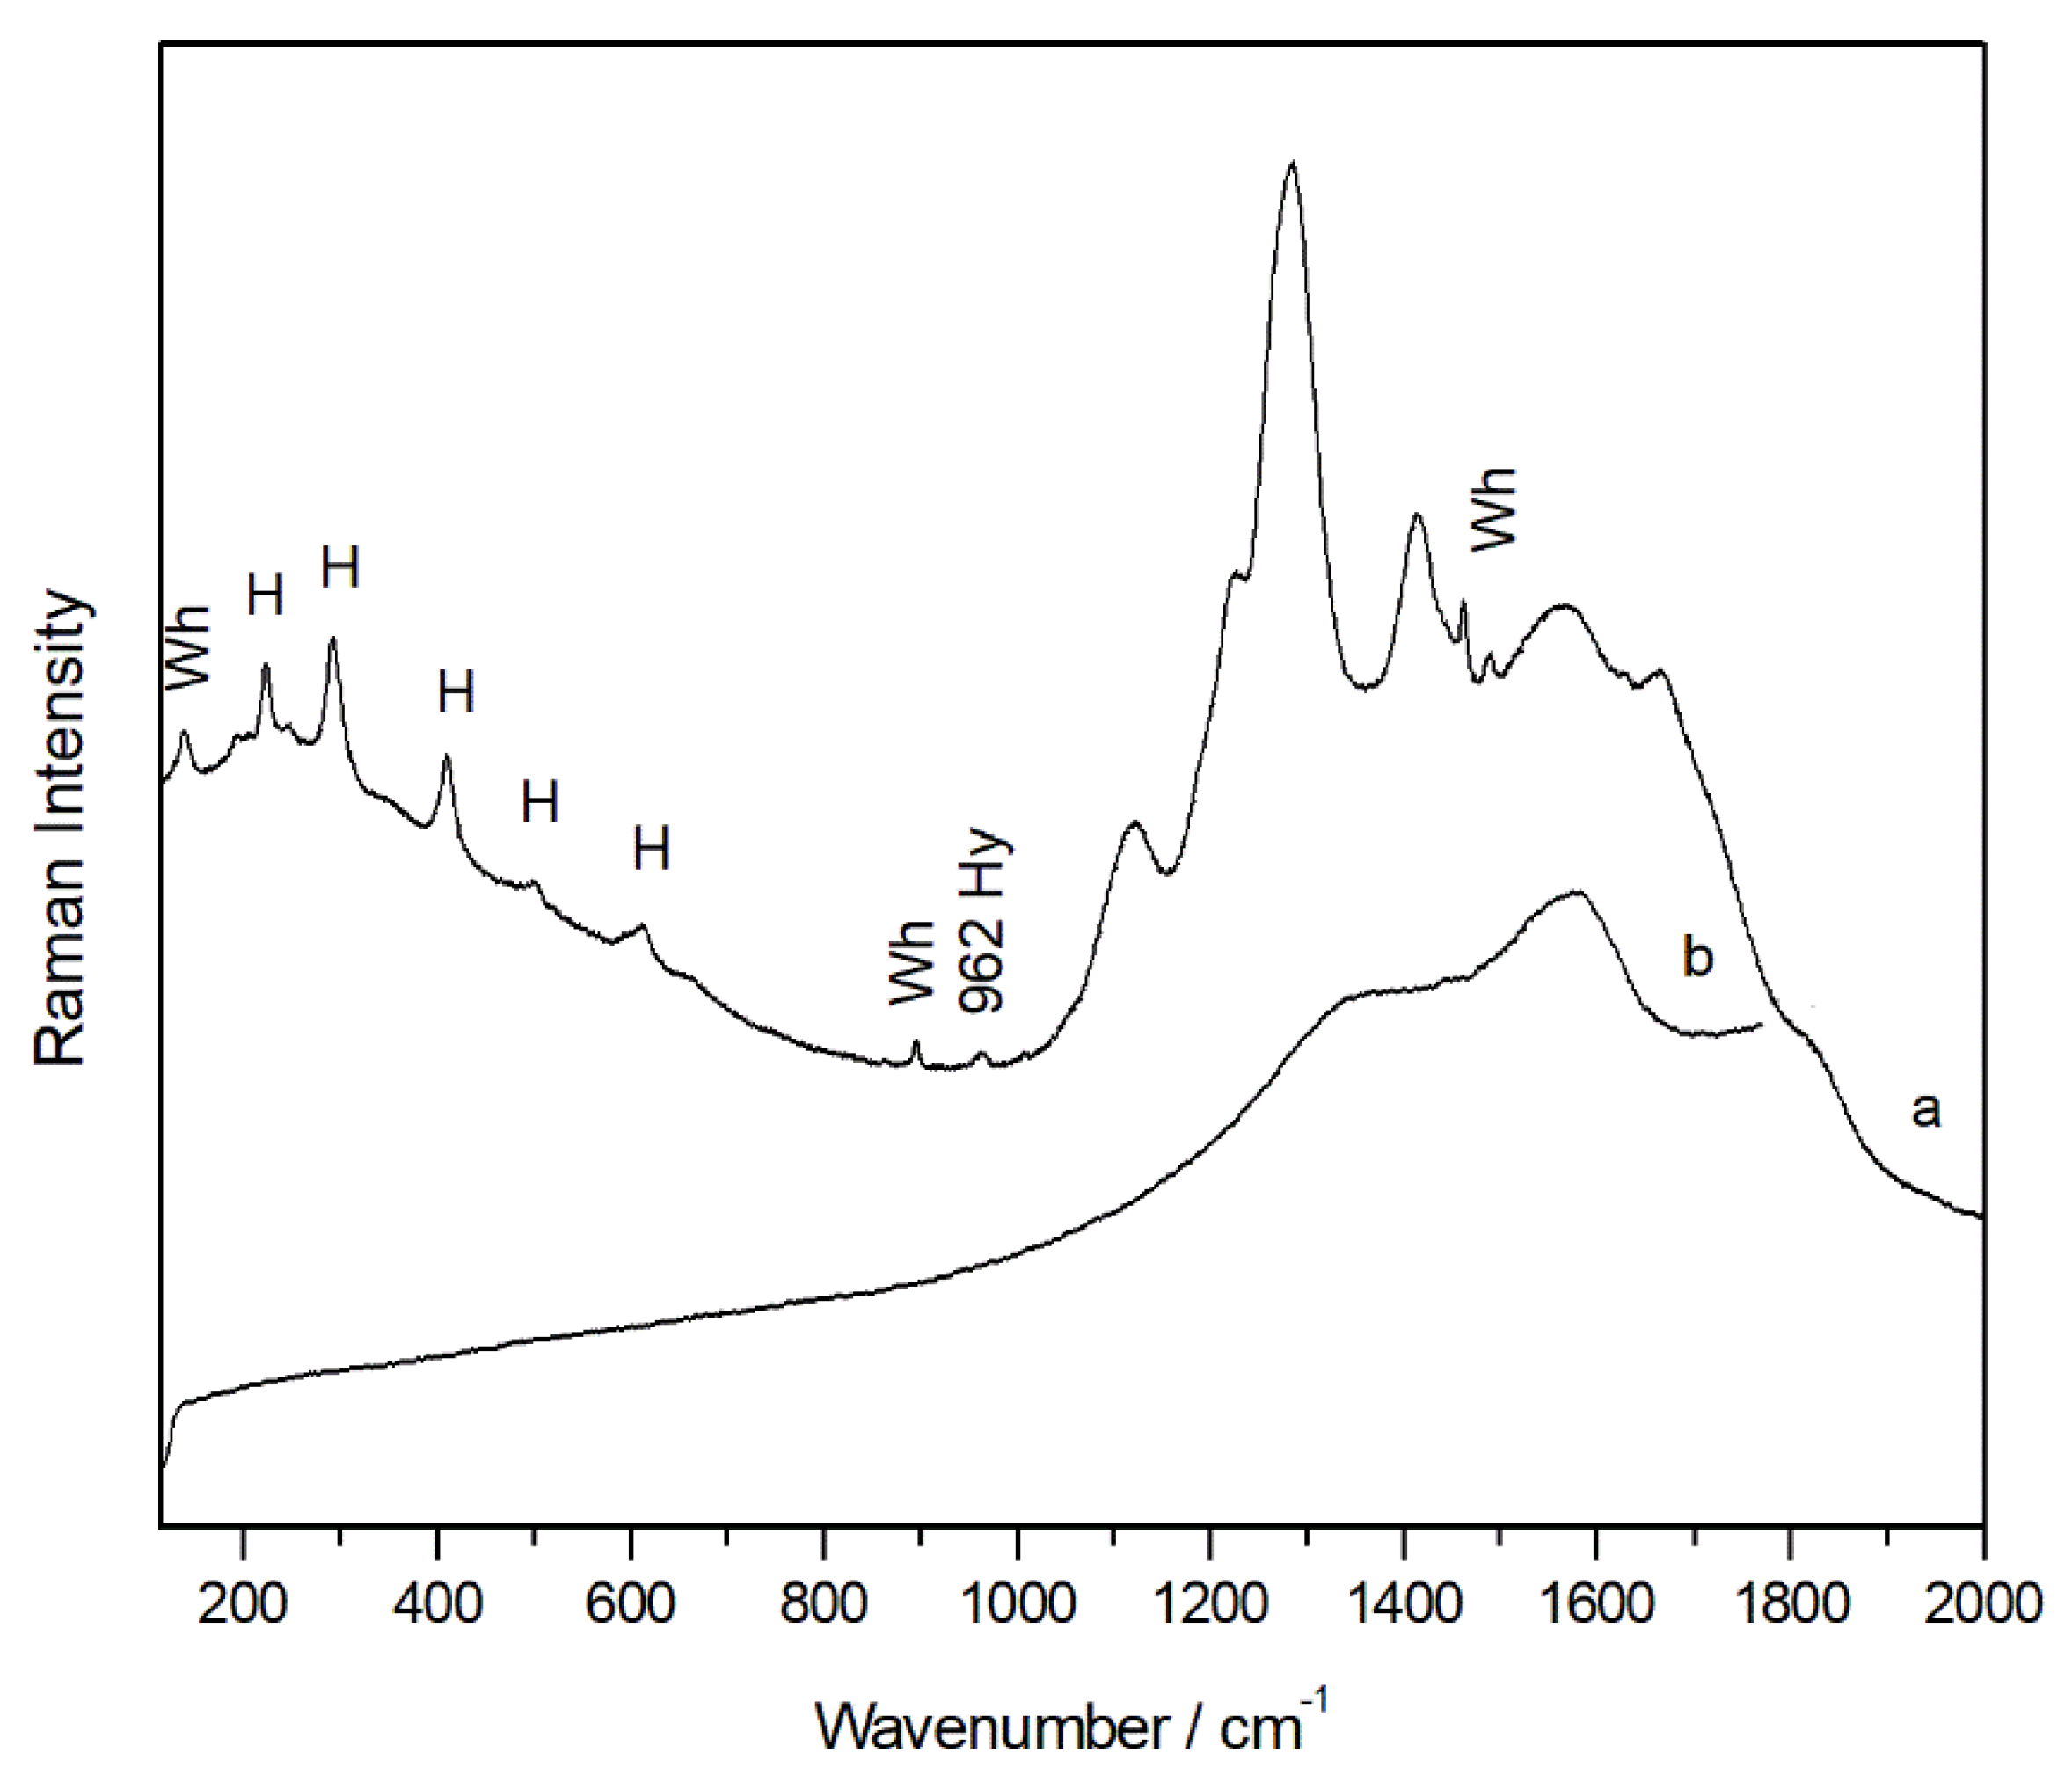
In addition, in mixture with the iron oxide even a single weak band located at 962 cm
-1, typical of the hydroxyapatite (Ca
10(PO
4)
6(OH)
2) (
Figure 5a), was visible in the spectra that suggested that the red pigment hematite was probably mixed with amounts of calcined bones. In the same spectra, also the broad bands belonging to amorphous carbon were evident (
Figure 5b). Thus, was plausible that a black pigment was voluntary added to hematite to obtain a darker colour.
Finally, molecular analysis of the crystalline part of the samples was performed with X-ray diffraction analysis. As with the other techniques, the analysis was performed on both the external and internal sides. In all samples sample quartz, dolomite and calcite high in magnesium were identified as original compounds, in agreement with the Raman spectroscopy analysis. Gypsum and compounds related to microbiological activity such as hydrated and dihydrated calcium oxalate (whewellite and weddelite) were identified as degradation compounds (
Figure S3). Significant differences were observed between the internal and external part. Indeed, gypsum and oxalates were detected only on the outside of the samples.
Finally, in the case of the sample containing with red pigment, this technique could only identify dolomite, hydrated calcium oxalate and gypsum as impurities. Without being able to identify the pigment. Although Raman spectroscopy identified hematite, as this technique is only sensitive to crystalline compounds, it could indicate a low crystallization of this compound in this sample. In addition, in this sample, a small amount of sulphates was also identified by all analytical techniques. It is therefore plausible that the whitish sulphate patina is affecting the integrity of the substrate more than the areas where the pictographs are present. Undoubtedly, the presence of oxalates has guaranteed the conservation of the paintings over the years and it is for this reason that they seem better preserved than the support itself. In any case, the sulfation of the panel had to be treated with the aim of bringing the pictographs back to light. In addition, the exfoliation of the support could cause the loss of the painted areas in the long term.
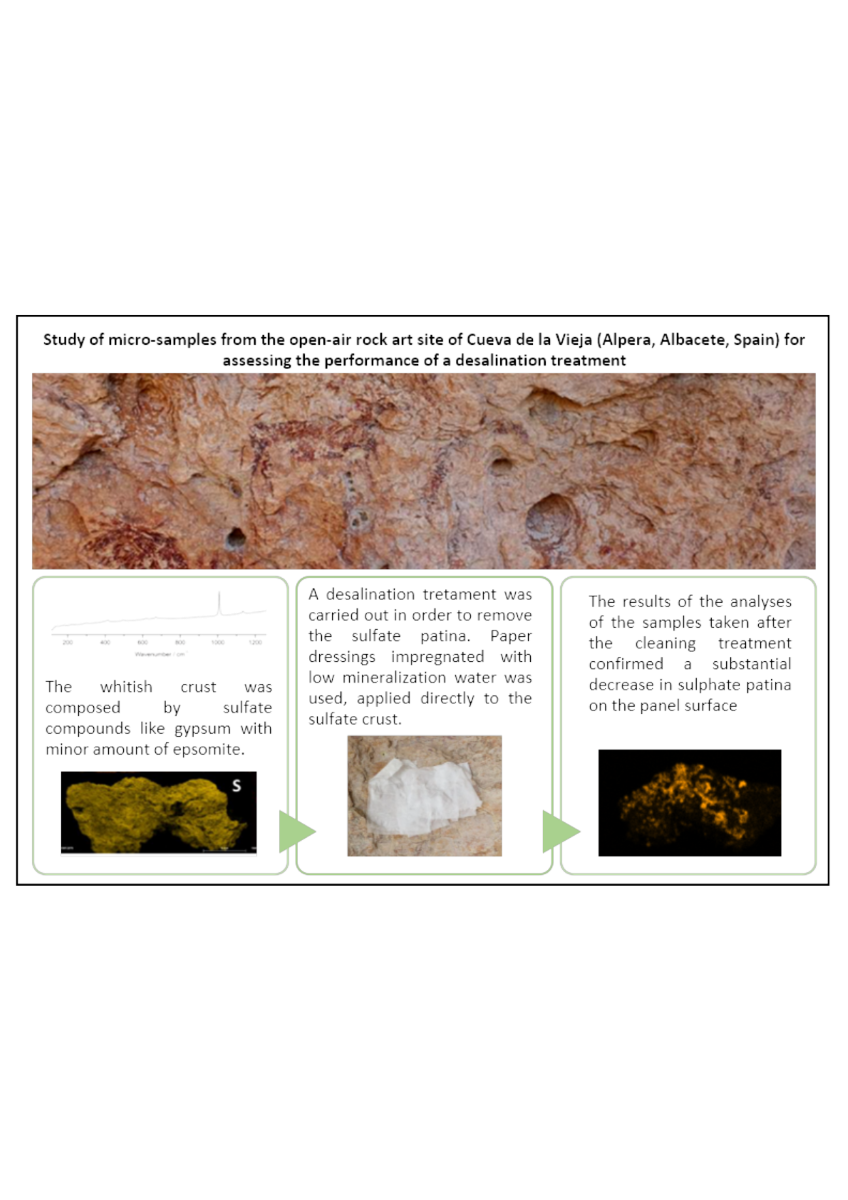
From this diagnostic study, it was decided to carry out a desalination treatment by restorers on the surface of the panel with the aim of removing the whitish patina that covered the pictographs. According to the restorers report, paper dressings impregnated with low mineralization water was used, applied directly to the sulfate crust. After a few minutes, they were removed and then, the surface was cleaned with brushes, removing the remains. The operation was repeated a couple of times and was completed using only distilled water. The stability of the paint was monitored continuously during the treatment.
2.2. Samples Analysis after the Cleaning Treatment
After completing the cleaning treatment, it was considered crucial to check its effectiveness and to verify the reduction of salts. Archaeologists attention was also drawn to a series of points on the panel where an insoluble greyish crust remained after cleaning. These were areas arranged around natural holes in the support, through which, perhaps, there was a certain periodic emanation of water in the passage. In collaboration with the restorer in charge of the cleaning of the panel, samples were collected so that the nature of these grey crusts could be identified.
At first view, there was a considerable reduction in the surface sulphates at naked eye. (Figure 9) Thus, the objective of the analysis of these samples was the characterization of the rock surface after cleaning, verifying the removalof the sulfates and identifying other substances remaining in the rock, in order to raise hypotheses about their link to the conservation processes in Cueva de la Vieja.
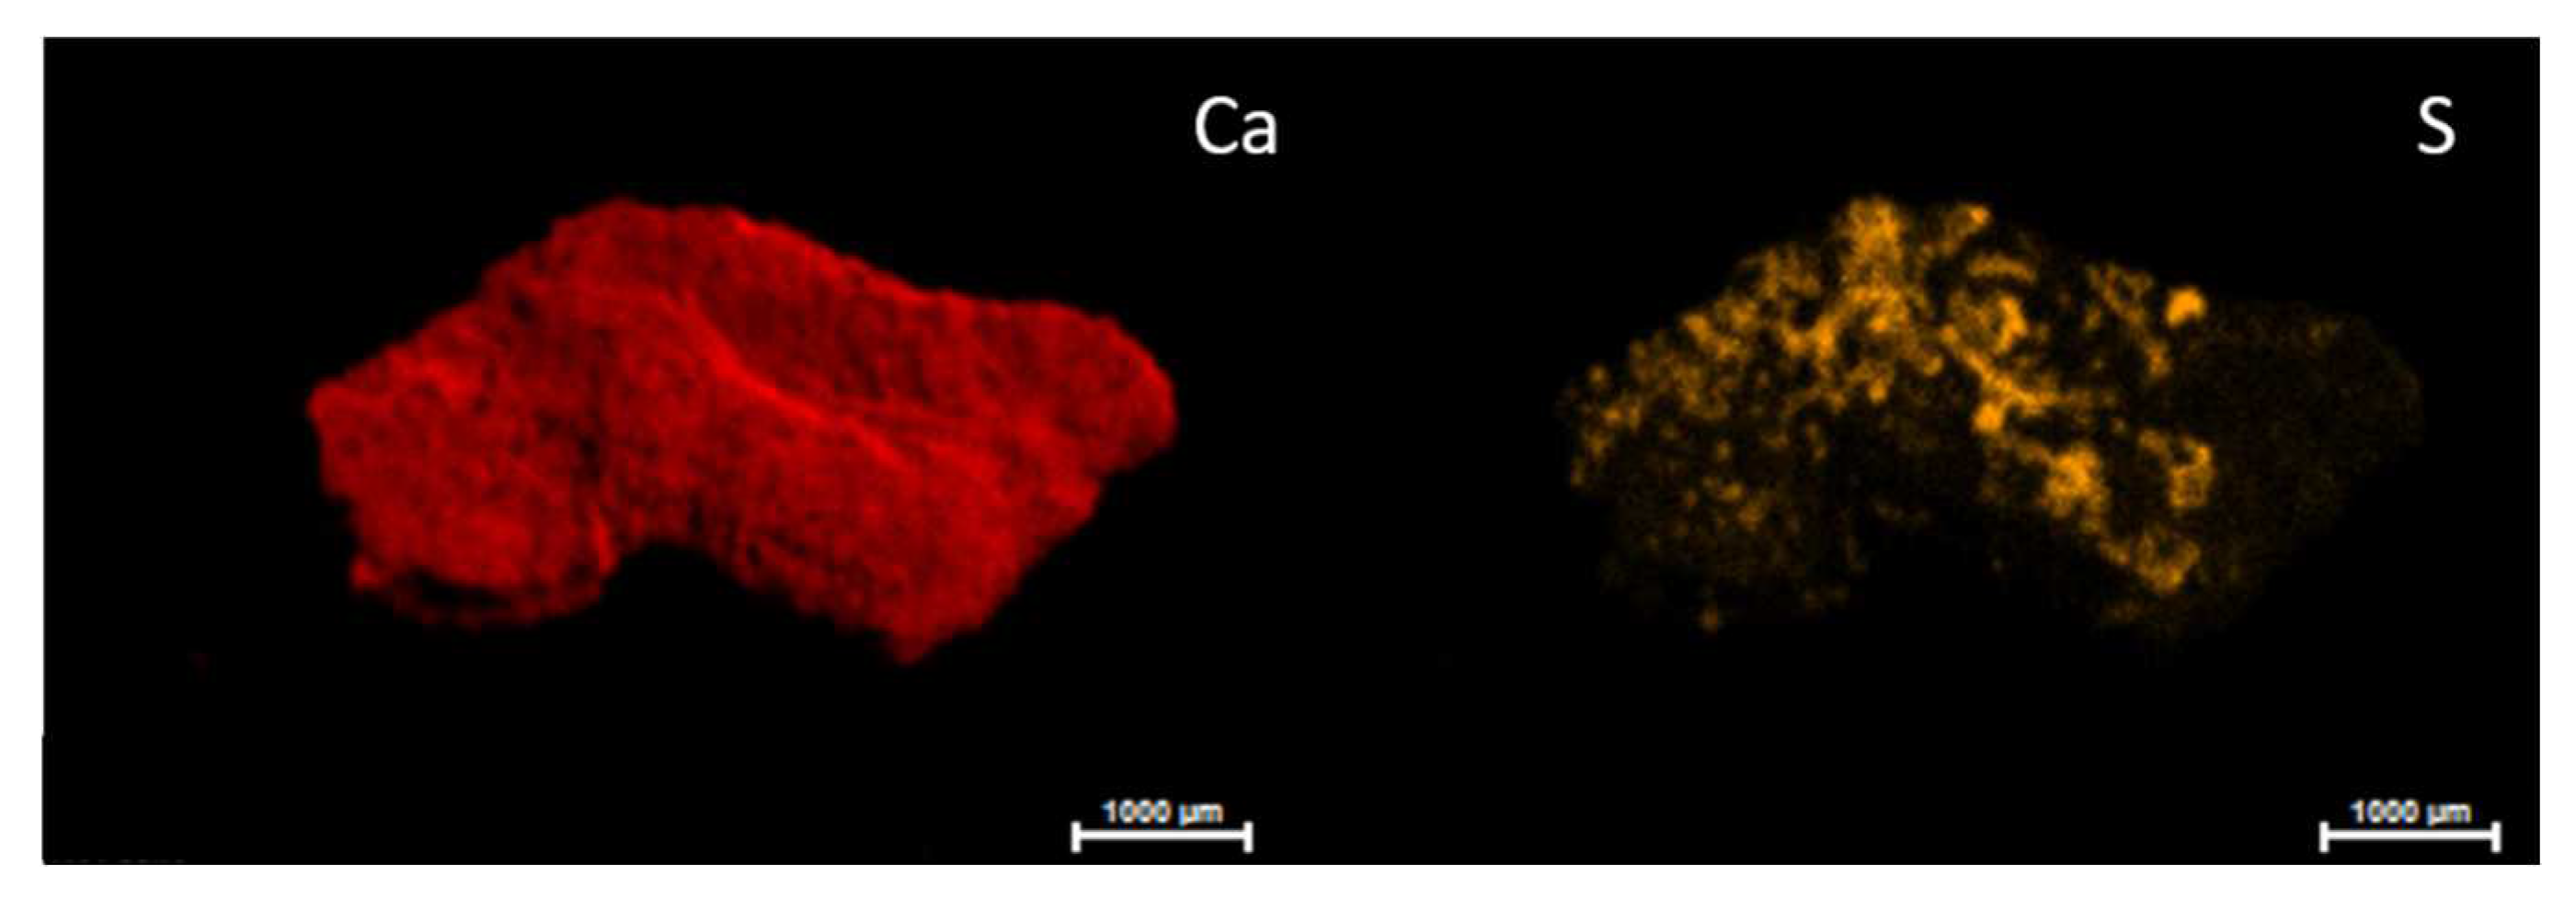
Although micro-EDXRF analyses still identified the presence of sulfur in the samples taken after treatment, it was heterogeneously present in the surface of the samples. As this is a microanalysis technique, we were not surprised to still detect the presence of sulphur remain after the cleaning treatment. However, the semi-quantitative data from this technique, based on the intensity of the emission lines, indicated a decrease in the percentage of sulphur in the samples collected after desalination. As can be seen from the micro XRF map (
Figure 6), the sulfur was still present on the surface of the micro-sample due to the irregular surface while the distribution of calcium was homogeneous. Therefore, the treatment did not act in hard-to-reach areas.
However, from an elemental point of view, the analyzes carried out on the samples after the cleaning treatment highlighted the presence of other elements whose emission bands were weak or absent in the samples previously analysed. The presence of strontium associated with calcium was noticed in the samples after cleaning as well as the bands of iron, zinc, copper, phosphorus and manganese appeared much more evident. The emission lines of these elements belonging to the rocky support were partially hidden by the high presence of sulfur in the white patina in some samples.
In the three samples that were collected in grey crusts, which had not been solubilised during the cleaning treatment, high percentages of calcium were identified together with silicon in less extent. Raman spectroscopy detected the presence of very sharp Raman bands of calcium carbonate always together with calcium oxalate peaks (
Figure S4c). The samples looked under the light of the microscope as flat, grey coloured flakes. No Raman spectra of gypsum were recorded in these samples. On the other hand, in one sample a strong band at 1067 cm
-1 was visible. (
Figure S4b) According to the literature this band together with the other of low intensity at 722 cm
-1 belonged to the sodium nitrate nitratine (NaNO
3). This compound was not identified by XRD analysis probably its presence was less than the detection limit of this technique. On the other hand, XRD analyses clearly identified the presence of calcium carbonate, silicon dioxide and hydrated calcium oxalate in all three samples. Despite being a soluble compound, some traces of nitrate remained even after cleaning. This compound was only identified in one sample. Considering that these samples were taken from an area where water runs off, the formation of nitrates must be related to traces of organic matter carried away by rainwater. In all samples the most abundant compounds identified were calcite and calcium oxalate hydrate demonstrating that the treatment significantly removed the presence of sulphates without affecting the oxalate patina that could contribute to the preservation of pictographs.
On the other hand, both Raman and XRD analyses demonstrated a very low presence of gypsum in the remaining samples taken from the rock substrate. In these samples in addition to calcium carbonate, the compounds belonging to the rocky support, dolomite, quartz and hematite were recognized.
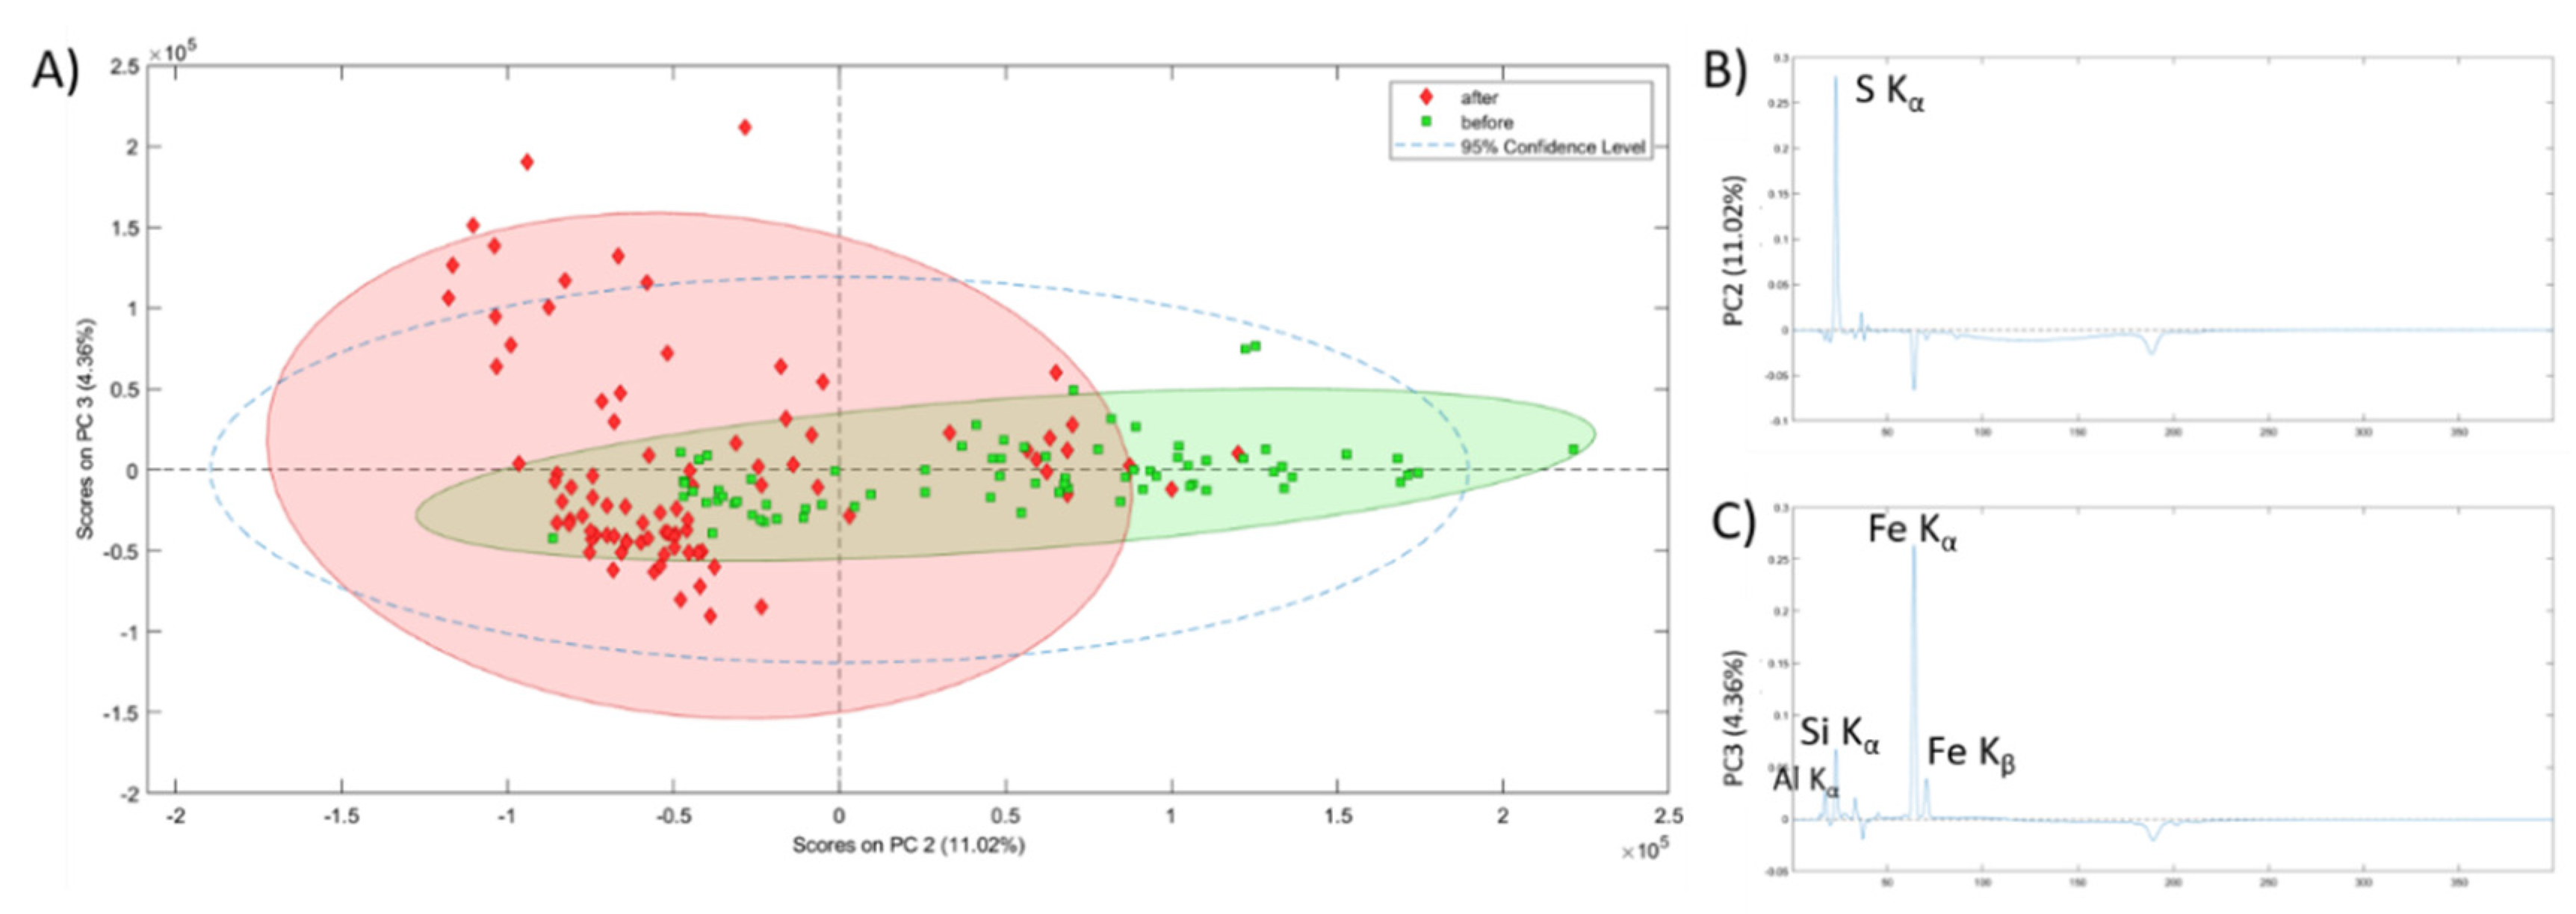
In order to obtain further confirmation of the effectiveness of the cleaning treatment a statistical analysis of the data obtained by micro EDXRF was carried out. By performing Principal Component Analysis (PCA) using EDXRF spectra, allowed separating considerably the samples considering the treatment they underwent (
Figure 7). Concretely, the PC2 vs PC3 plot resulted the more explicative to see which differences appeared after applying the treatment on the samples. In
Figure 7A, it can be observed how samples before treatment are grouped mostly on the positive part of PC2 whereas samples analysed after the treatment are mostly grouped on the negative part of the PC2. It is clear that PC2 (
Figure 7B) is the component that better explains the differences induced by the application of the conservation treatment in the samples. By analysing this PC, it can be concluded that sulfur is the main element removed during the treatment (from the elements detected by means of micro EDXRF). Actually, the samples located on the positive side of the PC2 are characterized by a high presence of sulfur and those located on the negative side are characterized by almost absence of sulfur and high presence of iron. This fact helps understanding the clustering of the samples in the PC2 vs PC3 plot as the samples collected before the treatment are located in the more sulfur rich area and the samples collected after applying the conservation treatment appear in the region of the plot dominated by high Fe presence and low sulfur. Positive Al, Si and Fe K bands instead, characterize PC3 (
Figure 7C). These elements are the main components of the rocky support and the dispersion of the samples along this PC, especially after the treatment, is explained by the heterogeneity of a natural rock. Samples before the treatment seemed to have a sulfur coating that masked rocky composition, preventing EDXRF to detect this natural heterogeneity.
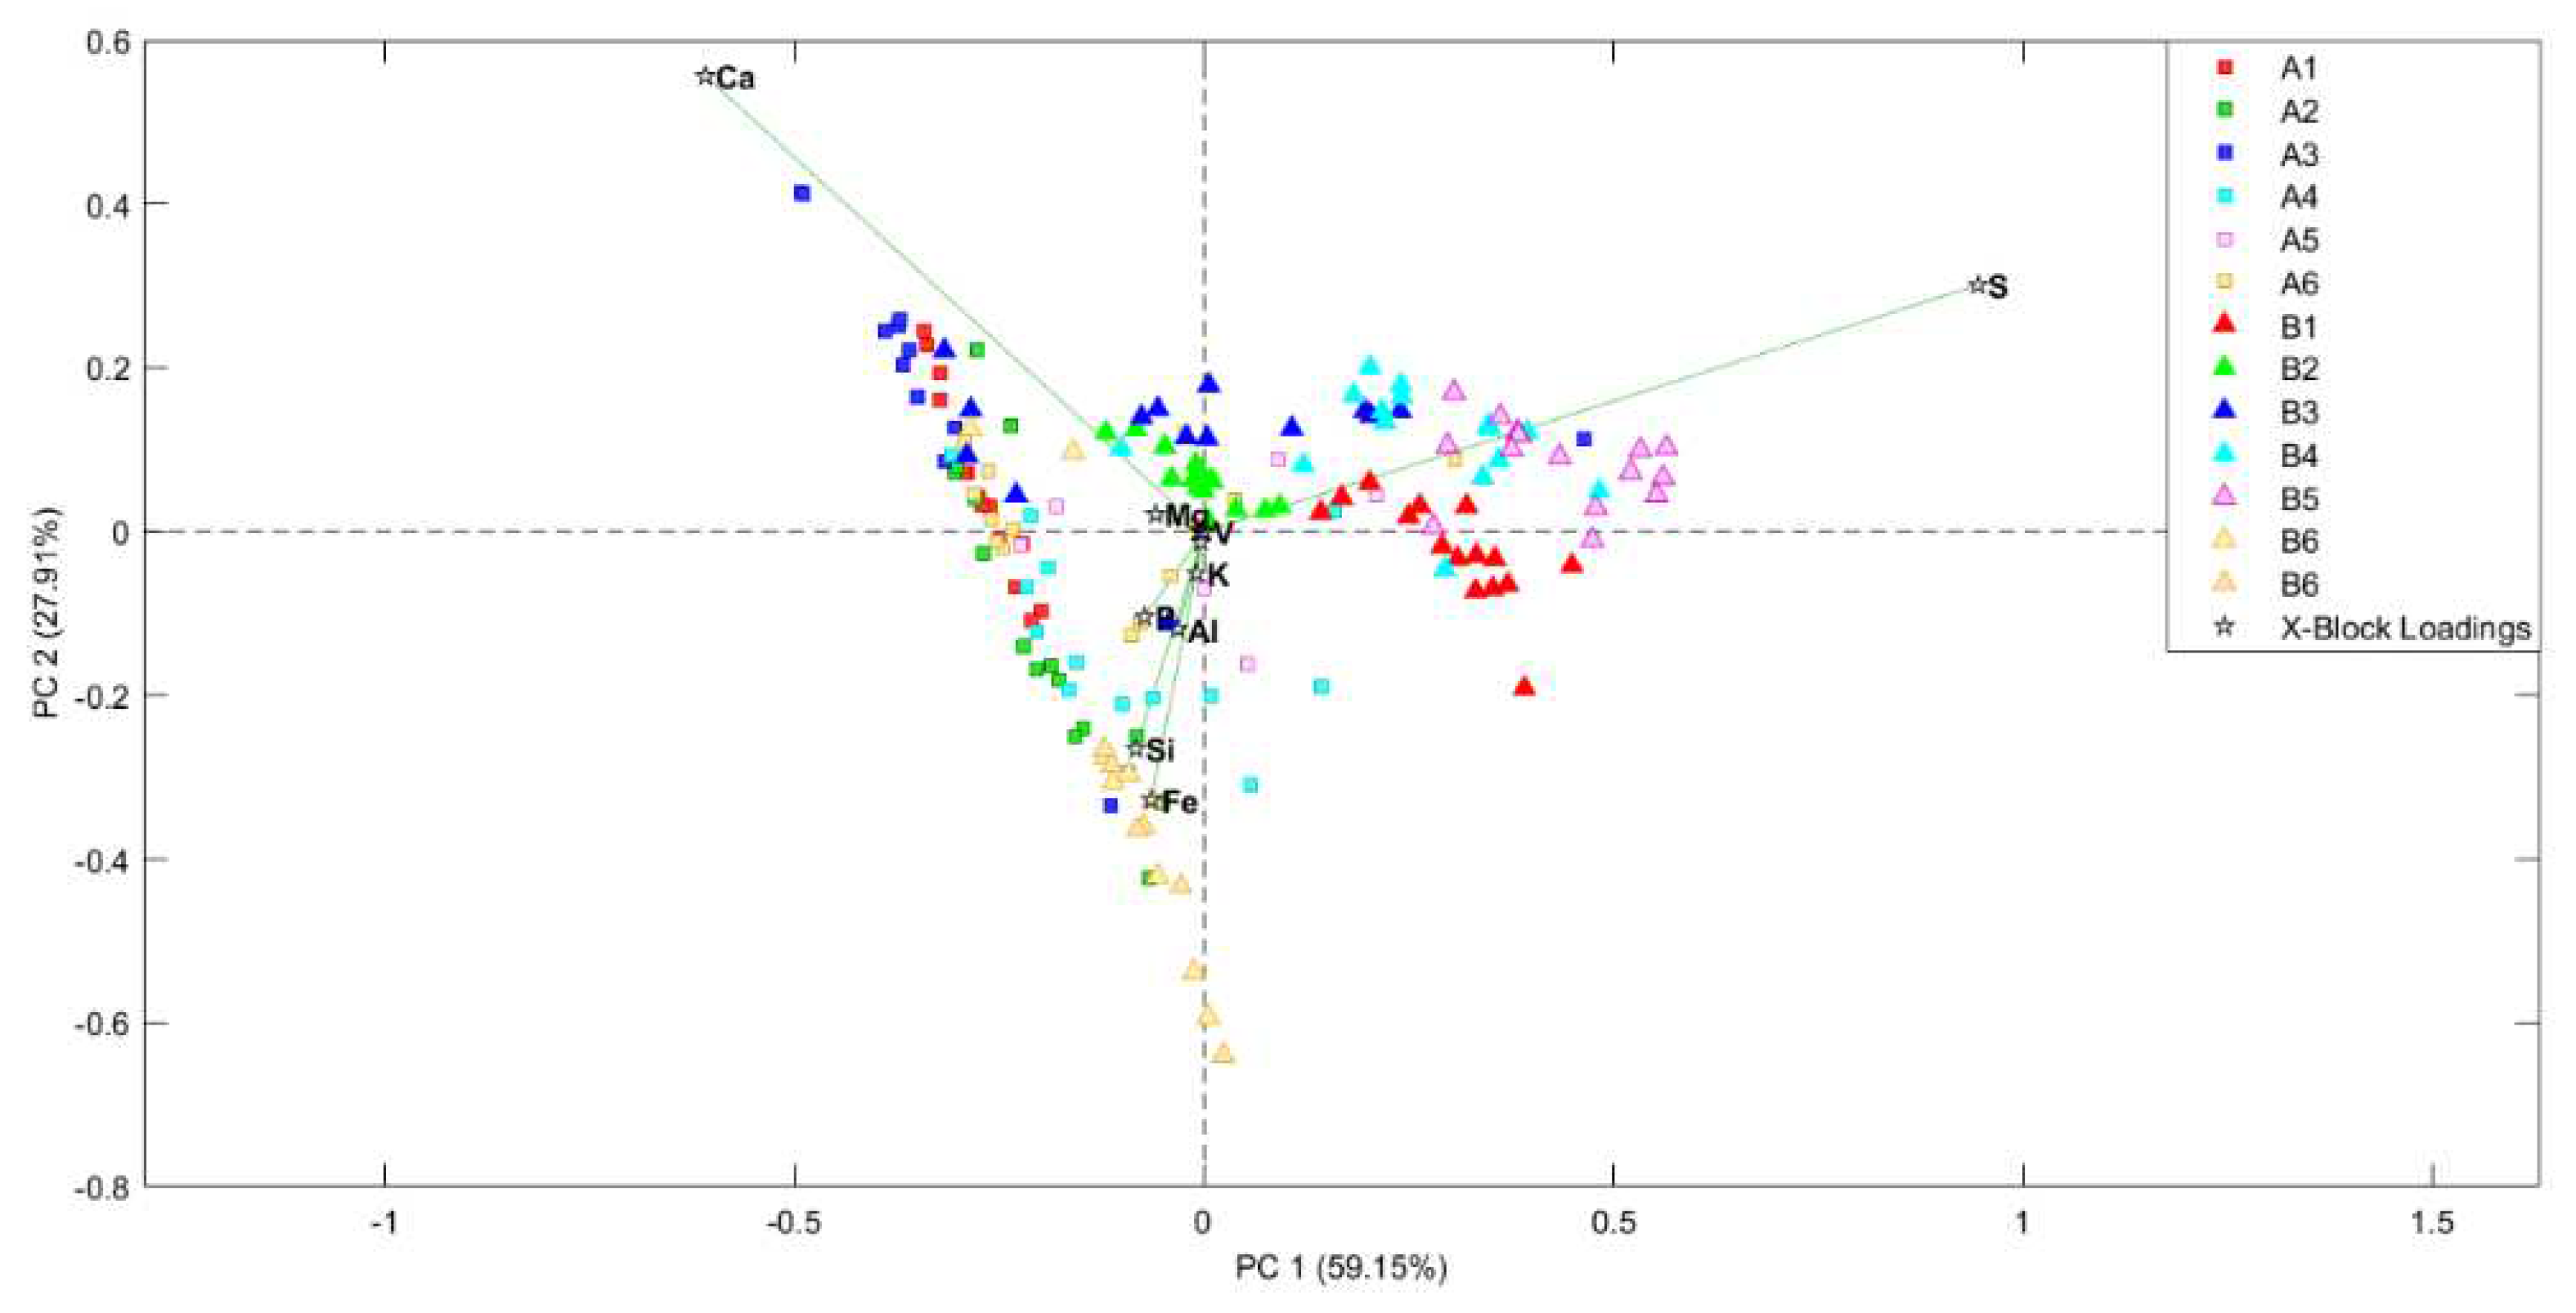
To understand better the element variations and their relationship with the studied samples, semi-quantitative XRF analyses were performed on the samples´ surface. Then, these data were studied by chemometric methods by performing scores and loading bi-plots. First of all an outlier study was performed through Hotelling T2 vs Q residuals study. After removing outliers, scores and loading PCA bi-plot (
Figure 8) showed, once again, the previously mentioned separation between non-treated and treated samples. Actually, it is worthy to mention that both PCA look very similar regarding the distribution of the samples.
On the other hand, bi-plot perfectly shows the relationship between the samples and their elemental composition. On the one hand, all the non-treated samples are highly correlated with sulfur as observed in the XRF spectra study. However, it must be highlighted that B6 sample is located near the treated samples even if it is a non-treated one. The reason for this is that this sample comes from a red pictographs and, therefore, has a red coat on its surface. This red coat is composed mainly by iron shifting this sample to the area where iron dominates.
In addition, in this bi-plot is appreciated that the treated samples are distributed depending its Ca and Fe content. This can help understanding the different hues observed in the rocky support going from whitish to reddish.
These plots also show some samples or some replicas of the same sample which are instead of being non-treated are located nearer the treated samples and vice versa. This fact is again explained by the heterogeneity of such a natural system that a rock-shelter is. Considering that EDXRF analysis were performed collimating the X-ray beam to 25 microns, analyses are subjected to microscopic variation. In this way, it is logical to think that the surface of the rock walls was not perfectly treated and minor points remained with a high concentration of sulfur. Likewise, in non-treated samples some microscopic points with low S presence were located. In anyway, these cases are just anecdotal comparing with the majority of the analysed points from all the samples (15 point for each sample were recorded).
