Preprint
Article

Phonon Dispersion Curves of Silver (Ag) and Gold (Au): Application of Density Functional Theory and Inter – Atomic Force Constant

Altmetrics

Downloads

344

Views

83

Comments

0

Submitted:

02 July 2023

Posted:

04 July 2023

You are already at the latest version

Alerts
Abstract
The Computational theoretical techniques using first principle which make use of the density functional theory as implemented by quantum expresso as well as inter – atomic force constant (IFC) techniques (Born-von Jarman) were used to investigate the phonon dispersion curves of Silver (Ag) and Gold (Au) The results obtained show that for Au, the extension to 1 – 6th neighbour gave slightly close agreement with the experimental phonon dispersions when compared to the 1 – 5th neighbor at WT and LL symmetry points. The percentage error for Au at WT are 2.5% and 2.9% ; at point LL we obtained 0.6% and 0.7% respectively. The Local density Approximation (LDA) results for Ag underestimates the lattice with about 1.6% while the Generalized Gradient Approximation (GGA) overestimates it by 1.9%.
Keywords: 
Subject: Physical Sciences  -   Condensed Matter Physics

1.0 Introduction

The measurement of phonon-dispersion curves in the symmetry directions and then fitting force-constant models to the measured frequencies has been a subject of interest for many years in the studies of the lattice dynamics of metals. The force constants are assumed to have a physical meaning sometimes they are used only as a means of obtaining interpolation formulas for the calculations of phonon frequencies distributions and polarization vectors (Nilsson and Rolandson, 1973). By assuming certain conditions for the relations between some of the constants, one may include good fit forces from remote neighbour and derive curves to give a very good fit in measured direction.
Theoretical calculations of the lattice dynamics of metals have been attempted from first principles by a number of authors (Toya 1964; Vosko et al, 1965; Harrison 1966). None of these has had marked success except for the alkaline metals. However, Harrison (1966) has shown how a Pseudopotential can be derived from a phenomenological model involving only two free parameters which can be evaluated from phonon measurements.
Force constant analysis of the data for Pb has generally proved a failure. Models of several kinds with forces going out as far as the tenth neighbour have been tried without success. Indeed there is reason to believe that forces could extend to twenty neighbours (Brockhouse et al 1962).
Hanke (1971) used the shell model to discuss the dynamics of Cu, Ni and some other metals, his idea was to use the shell-core concept to simulate polarization effects in the noble and transition metals. While the use of dipolar model for metals first seem inappropriate, Hanke has argued that the applicability of the model can be made plausible by microscopic consideration (Venkataraman et al, 1974).
The aim of this research is to obtain the phonon dispersions curves of two Face Centered Cubic (FCC) metals namely Silver (Ag) and Gold(Au) from accurately determined interatomic force constants (IFCs) using quantum expresso code as implemented by Gionnozzi et al (2009), IFC approach up to at least sixth neighbour and compare phonons results with experimental data.

2.0 Theoretical Calculation and Considerations

2.1. Normal Mode Frequencies in Three Dimensions

Every type of lattice has its own characteristic mode or frequencies of vibration called normal modes. In three dimension, for a mass m at the origin 0, the equation of motion corresponding to the displacement of atom u ( l ) can be generalized as
f = l φ ( l ) . u ¨ ( l )
If we use α and β as coefficient to represent the Cartesian components of the vectors, the force equation (2.3) can be written as:
F α β = l β = 1 φ α β ( l ) u β ( l ) α = 1 , 2 , 3
(The minus sign is introduced simply for convenience).
There are now three equation of motion for each atom, corresponding to the three degree of freedom.
F = m 2 t 2 U , α = l β = 1 φ α β ( l ) u β ( l )
And the three- dimensional form of a plane wave is
U l , α ( q ) = A α exp [ i ( wt q . r l ) ]
Therefore equation (2.5) becomes
mw 2 A α exp ( iwt ) = l β = 1 3 φ α , β ( l ) A β exp [ i ( wt q . r ) ]
To facilitate the generalization to a limit cell containing more than one atom, it is convenient to make two new definitions at this point.
B = m 1 2 A α , D α β = 1 m l φ α β ( l ) exp ( iq r l )
Substituting equation (2.8) into (2.7) becomes
M 1 2 A α w 2 = 1 m l β = l 3 φ α β ( l ) A β exp ( iq r l ) * m 1 2
w 2 B α = 3 D α β B β , α = 1 , 2 , 3
Or in the matrix form
w 2 B = D B
This is a typical eigenvalue problem and the solutions for w 2 are the roots of the determinant equation.
D in equation (2.10) is known as the dynamical matrix, and the determinant us called the secular determinant (Venkataraman, et al ,1974) .
D ( q ) w 2 i j 0
Equation (2.10) is obtained from the equation (2.9) and the roots w 2 ( q ) are the Eigen-values of D ( q ) . In general, the dynamical matrix for a lattice with basis of n atoms has 3n x3n dimensions which assumes the general form
D α β ( q ) mw 2 I α β 0
Where D α β ( q ) are elements of the dynamical matrix, q is the wave-vector confirmed to the first Brilliouin zone; I is a limit matrix of order α and β and m is the ionic mass (Born and Huang; 1954).
In more explicit terms, equation (2.12) may be written as:
( D xx mw 2 D xy D xz ) ( D yz D yy mw 2 D yz )
e x ( q ) , e y ( q ) and e z are unit polarization vectors which satisfy the orthogonality condition that
e α ( q ) e β ( q ) = α β
Where
α β = { 1 { if α = β } }
Equation (2.13) is the matrix representation of the expression that will be required to solve in order to determine the phonon dispersion relations [ w p ( q ) for p = 1 , 2 , 3 ] in the symmetry directions [ 100 ] , [ 110 ] and [ 111 ] in a cubic crystal. The dynamical matrix is given in equation (2.4). In a metal, there are three contributions to the dynamical matrix D α β associated with the effective potential between the ions. These contributions are the columbic D α c β , the Born-mayer , D α R β ,and the electronic band structure, D α E β ,contributions, respestively (Animalu, 1977). The columbic contribution arises from the long –range columbic interaction between bare ions. The repulsive Born-Mayer contribution is associated with ions and it arises from the overlap of the core electron wave function on neighboring. The electronic contribution is associated with the indirect ion – electron – ion interaction via the polarization field of the conduction or valence electrons.
The electronic contribution depends on the Pseudo-potential carried rigidly by the ions, i.e on the electron-phonon coupling matrix (Sham and Ziman, 1963).
We may then write D α β notionally as a sum of the three components i.e
D α β = D α c β + D α R β + D α E β
While the first two contributions can be handled in real space, the last component is more conveniently handled in the reciprocal lattice space.(Okoye 2002).
The phonon frequencies w2 are obtained when the elements of the dynamical matrix are substituted in equation (2.8). On solving equation (2.8) three homogeneous equations in three unknowns equations, w p ( q ) ( p = 1 , 2 , 3 ) are obtained . The solutions corresponding to w p ( q ) are determined by finding the roots of the determinant equation in equation (2.9); these roots determine the phonon frequencies. If the value of w 2 p is negative the value of w p becomes imaginary and the atomic motion increases exponentially with time, thus causing instability in the crystal structure. Also, if the phonon frequency is reduced and eventually comes to zero, then such a mode is called soft phonon mode (Srivastava, 1990). The presence of a soft mode crystal deforms the original crystal structure in favour of a more stable structure (Baroni et al, 2001).
In our recent work we studied Lattice Dynamics in some FCC Metals using the following metals Nickel (Ni) and Platinium (Pt) Enaroseha et al (2021a); Aluminium(Au) and Copper(Cu) Enaroseha et al (2021b); and Lead (Pb) and Palladium(Pd) Enaroseha et al (2021c) as well as AgGaS2 and AgGaSe2 (Omehe and Enaroseha)

2.2. Analytical Procedure

The application of the Born-von karman theory (Born and Huang,1954; Enaroseha et al, 2023) to fcc lattices have been described by many authors. Ag and Au belong to the space group of 0 h 5 (Fm 3m) with underlying point group O h (m3m). In calculating the phonon dispersions, we start by assigning inter atomic force constant matrix to the first atom of a particular neighbor. This is achieved using the coordinates of the neighbors of a particular atom. The interatomic force constant φ α β is defined to be the force on the origin atom in the “ α direction when the atom moves a unit distance in the “ β direction. The force constant matrix φ α β ( 0 , l ) is symmetric. l 1 , l 2 , l 3 are threenon- negative integers with l 1 l 2 l 3 . We consider the metals: Ag and Au as cubic crystals of identical atoms of mass ( m ) with cubic side of length ( a ) with coordinate axes along three tetrad axes x, y, z.

3.0 Presentation of Results

The results of the phonon dispersion for Ag are presented in section 3.1 while the results of the phonon dispersion relation for Au from inter – atomic force constants (IFCs) approach and quantum espresso code are presented in section 3.2.

3.1. Phonon Dispersions of Silver (Ag)
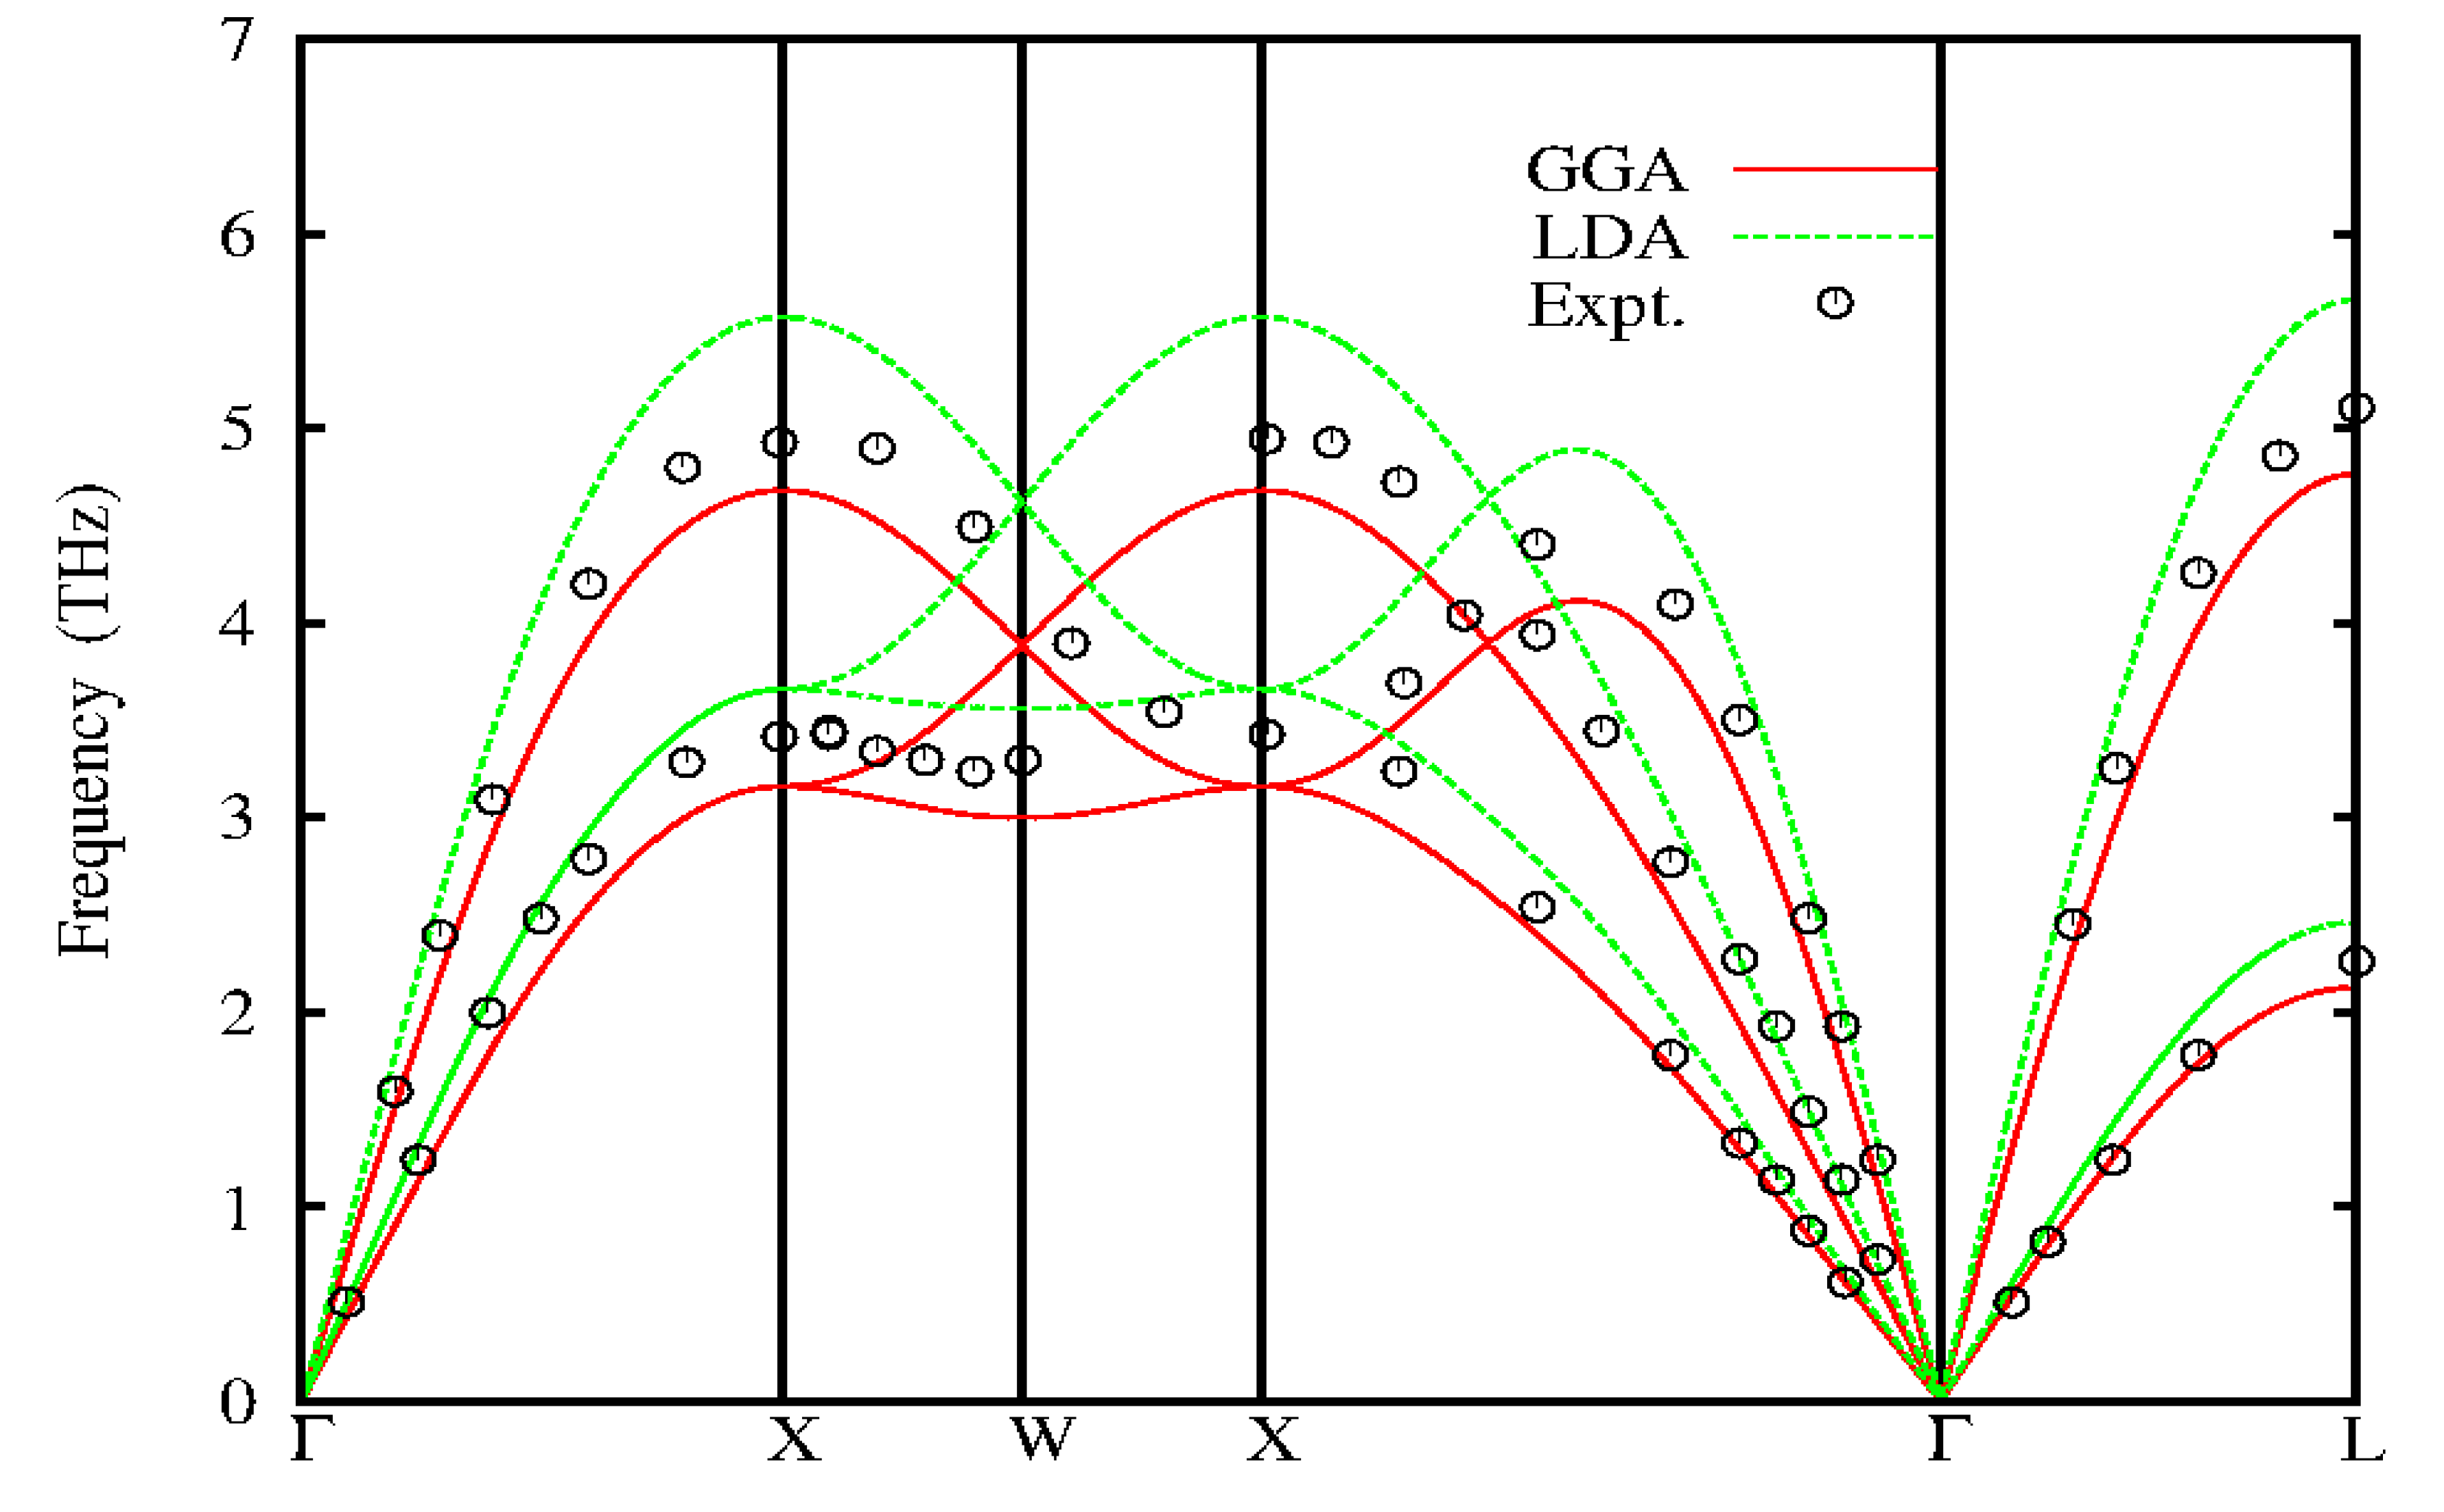
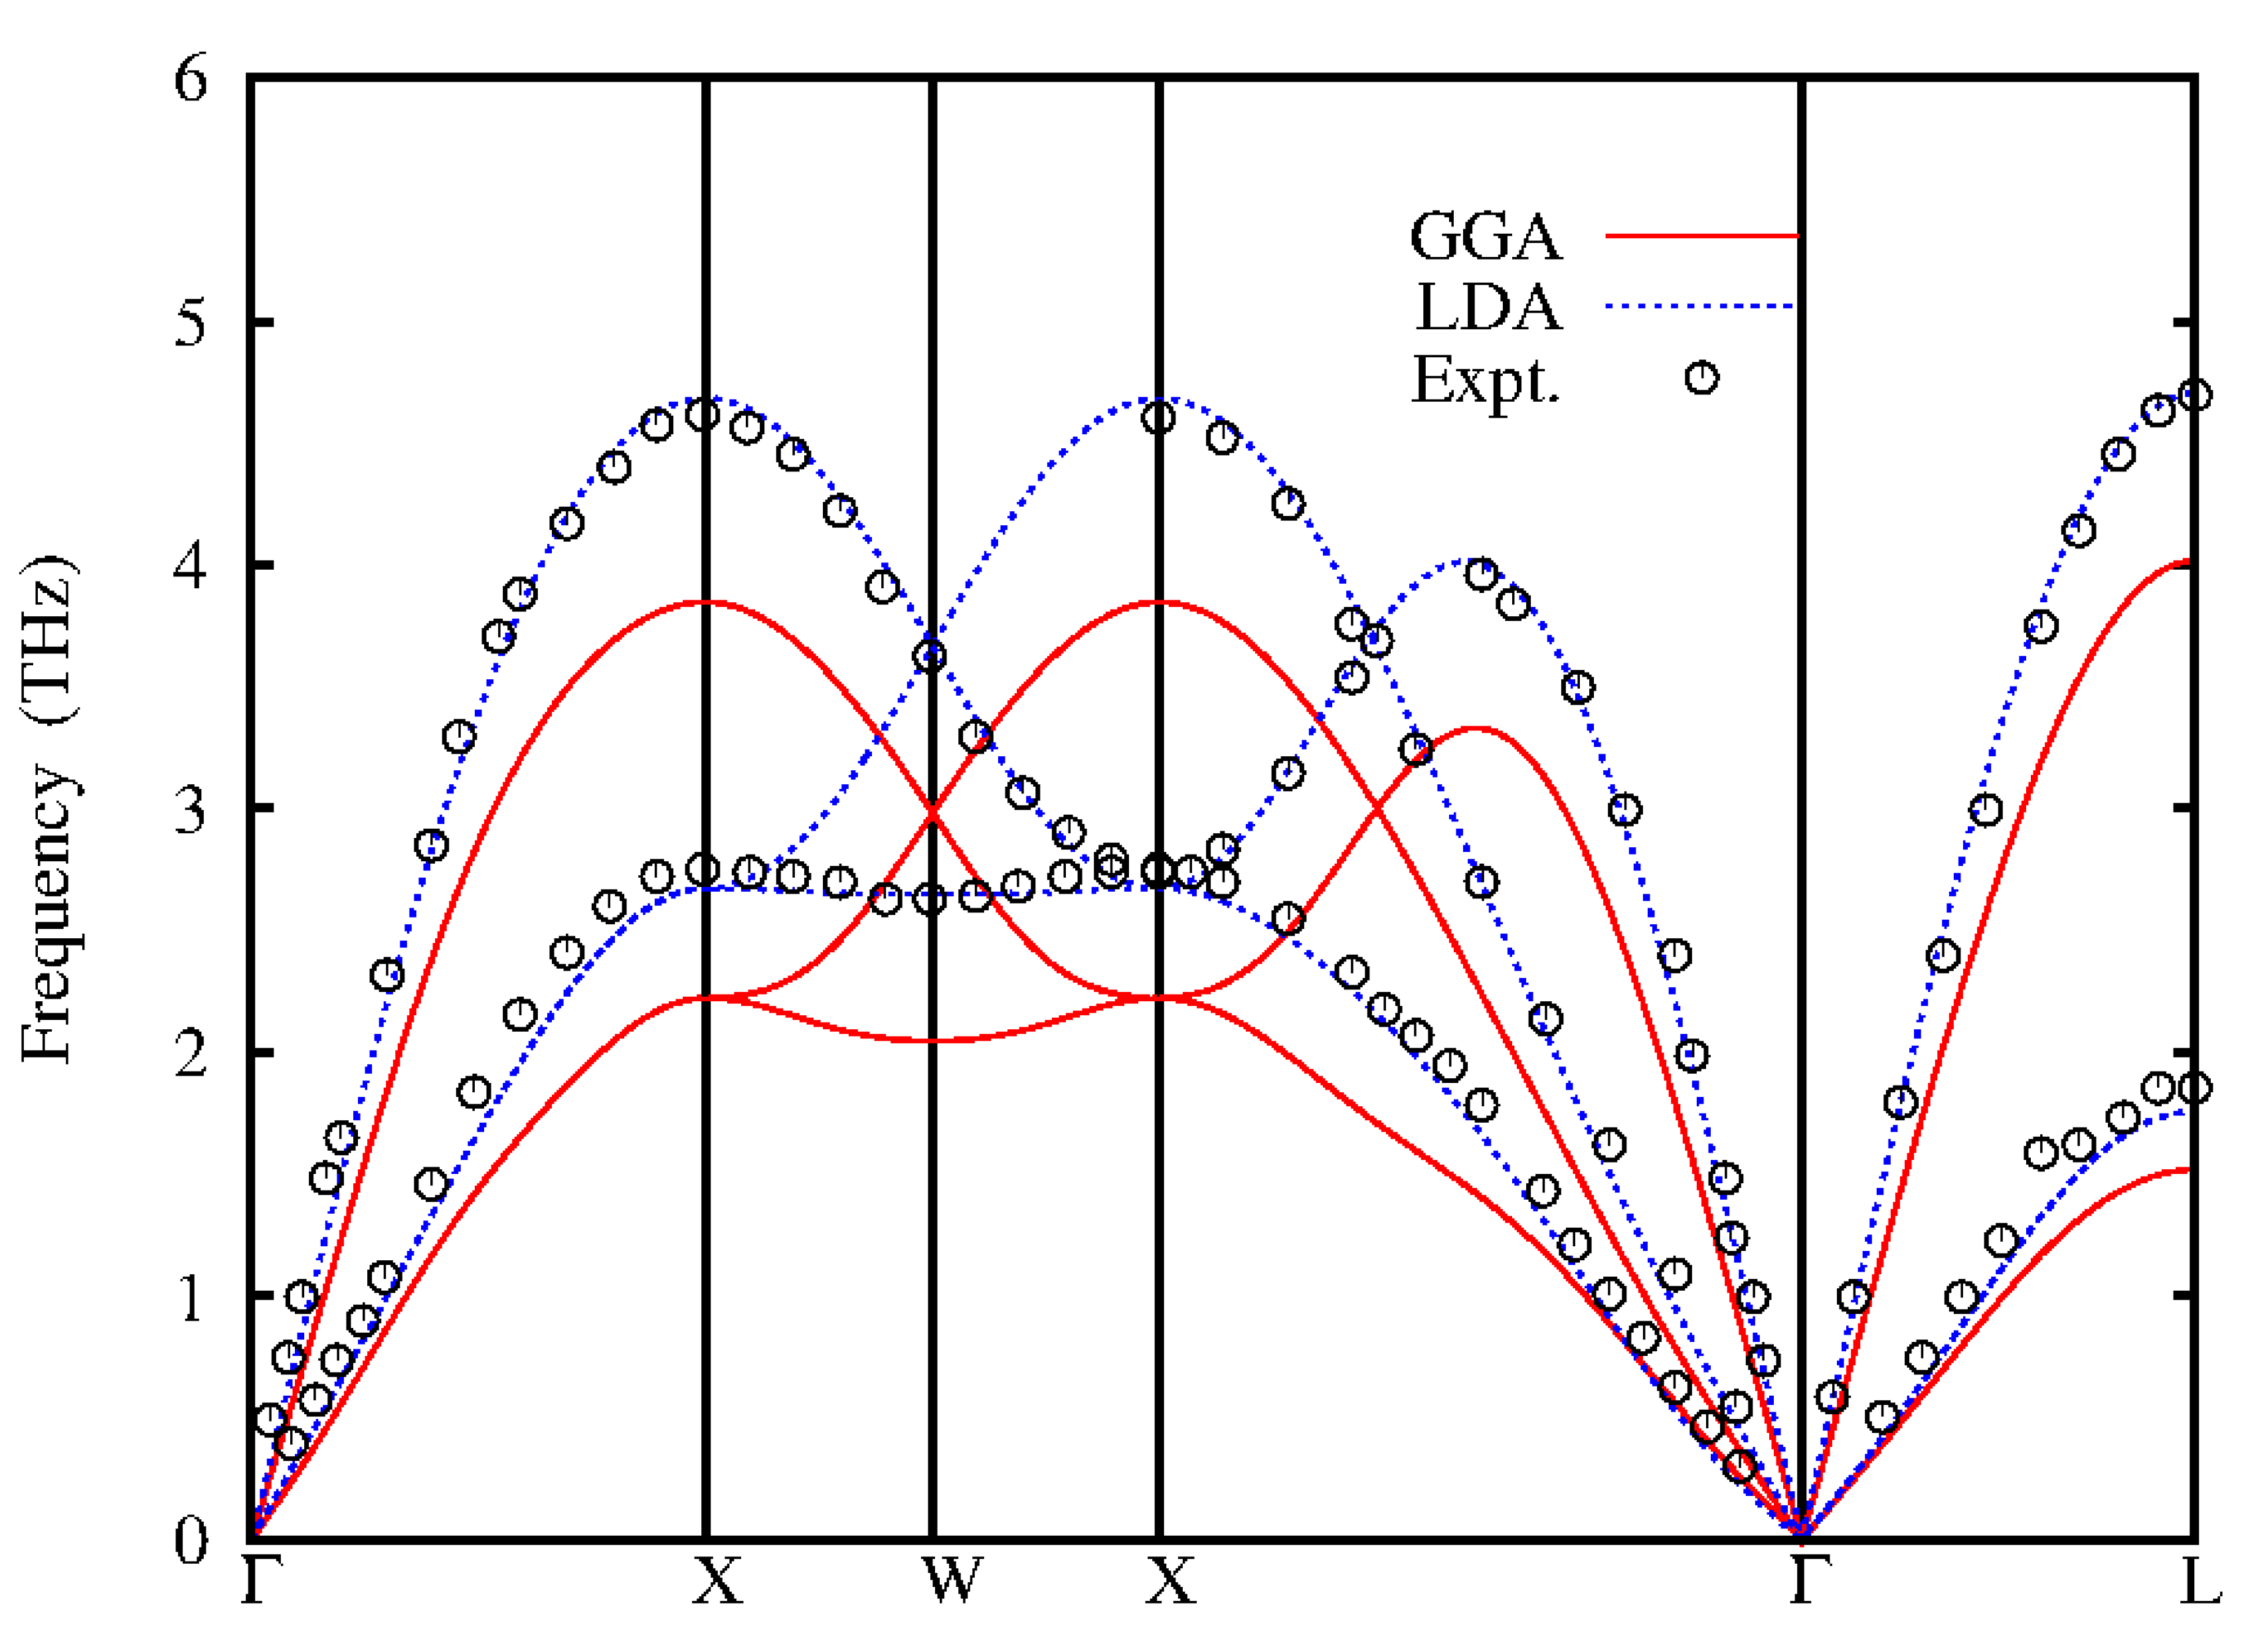
Figure 1. Calculated phonon dispersions for fcc-Ag compared to inelastic neutron scattering data (black circles) Kamitakahara and Brockhouse(1969).
Preprints 78307 g001
Table 1. Frequencies calculated from Quantum espresso at selected points of the BZ for Ag. All frequencies are in THz.
Ag a(a.u) XT XL WT WL LT LL
EXP (a) 7.72 3.41 4.94 3.29 - 2.31 5.09
LDA(b) 7.60 3.66 5.57 3.56 4.62 2.46 5.66
GGA(b) 7.89 3.16 4.68 3.00 3.89 2.13 4.77
a. Kamitakahara and Brockhouse(1969); b. This work.
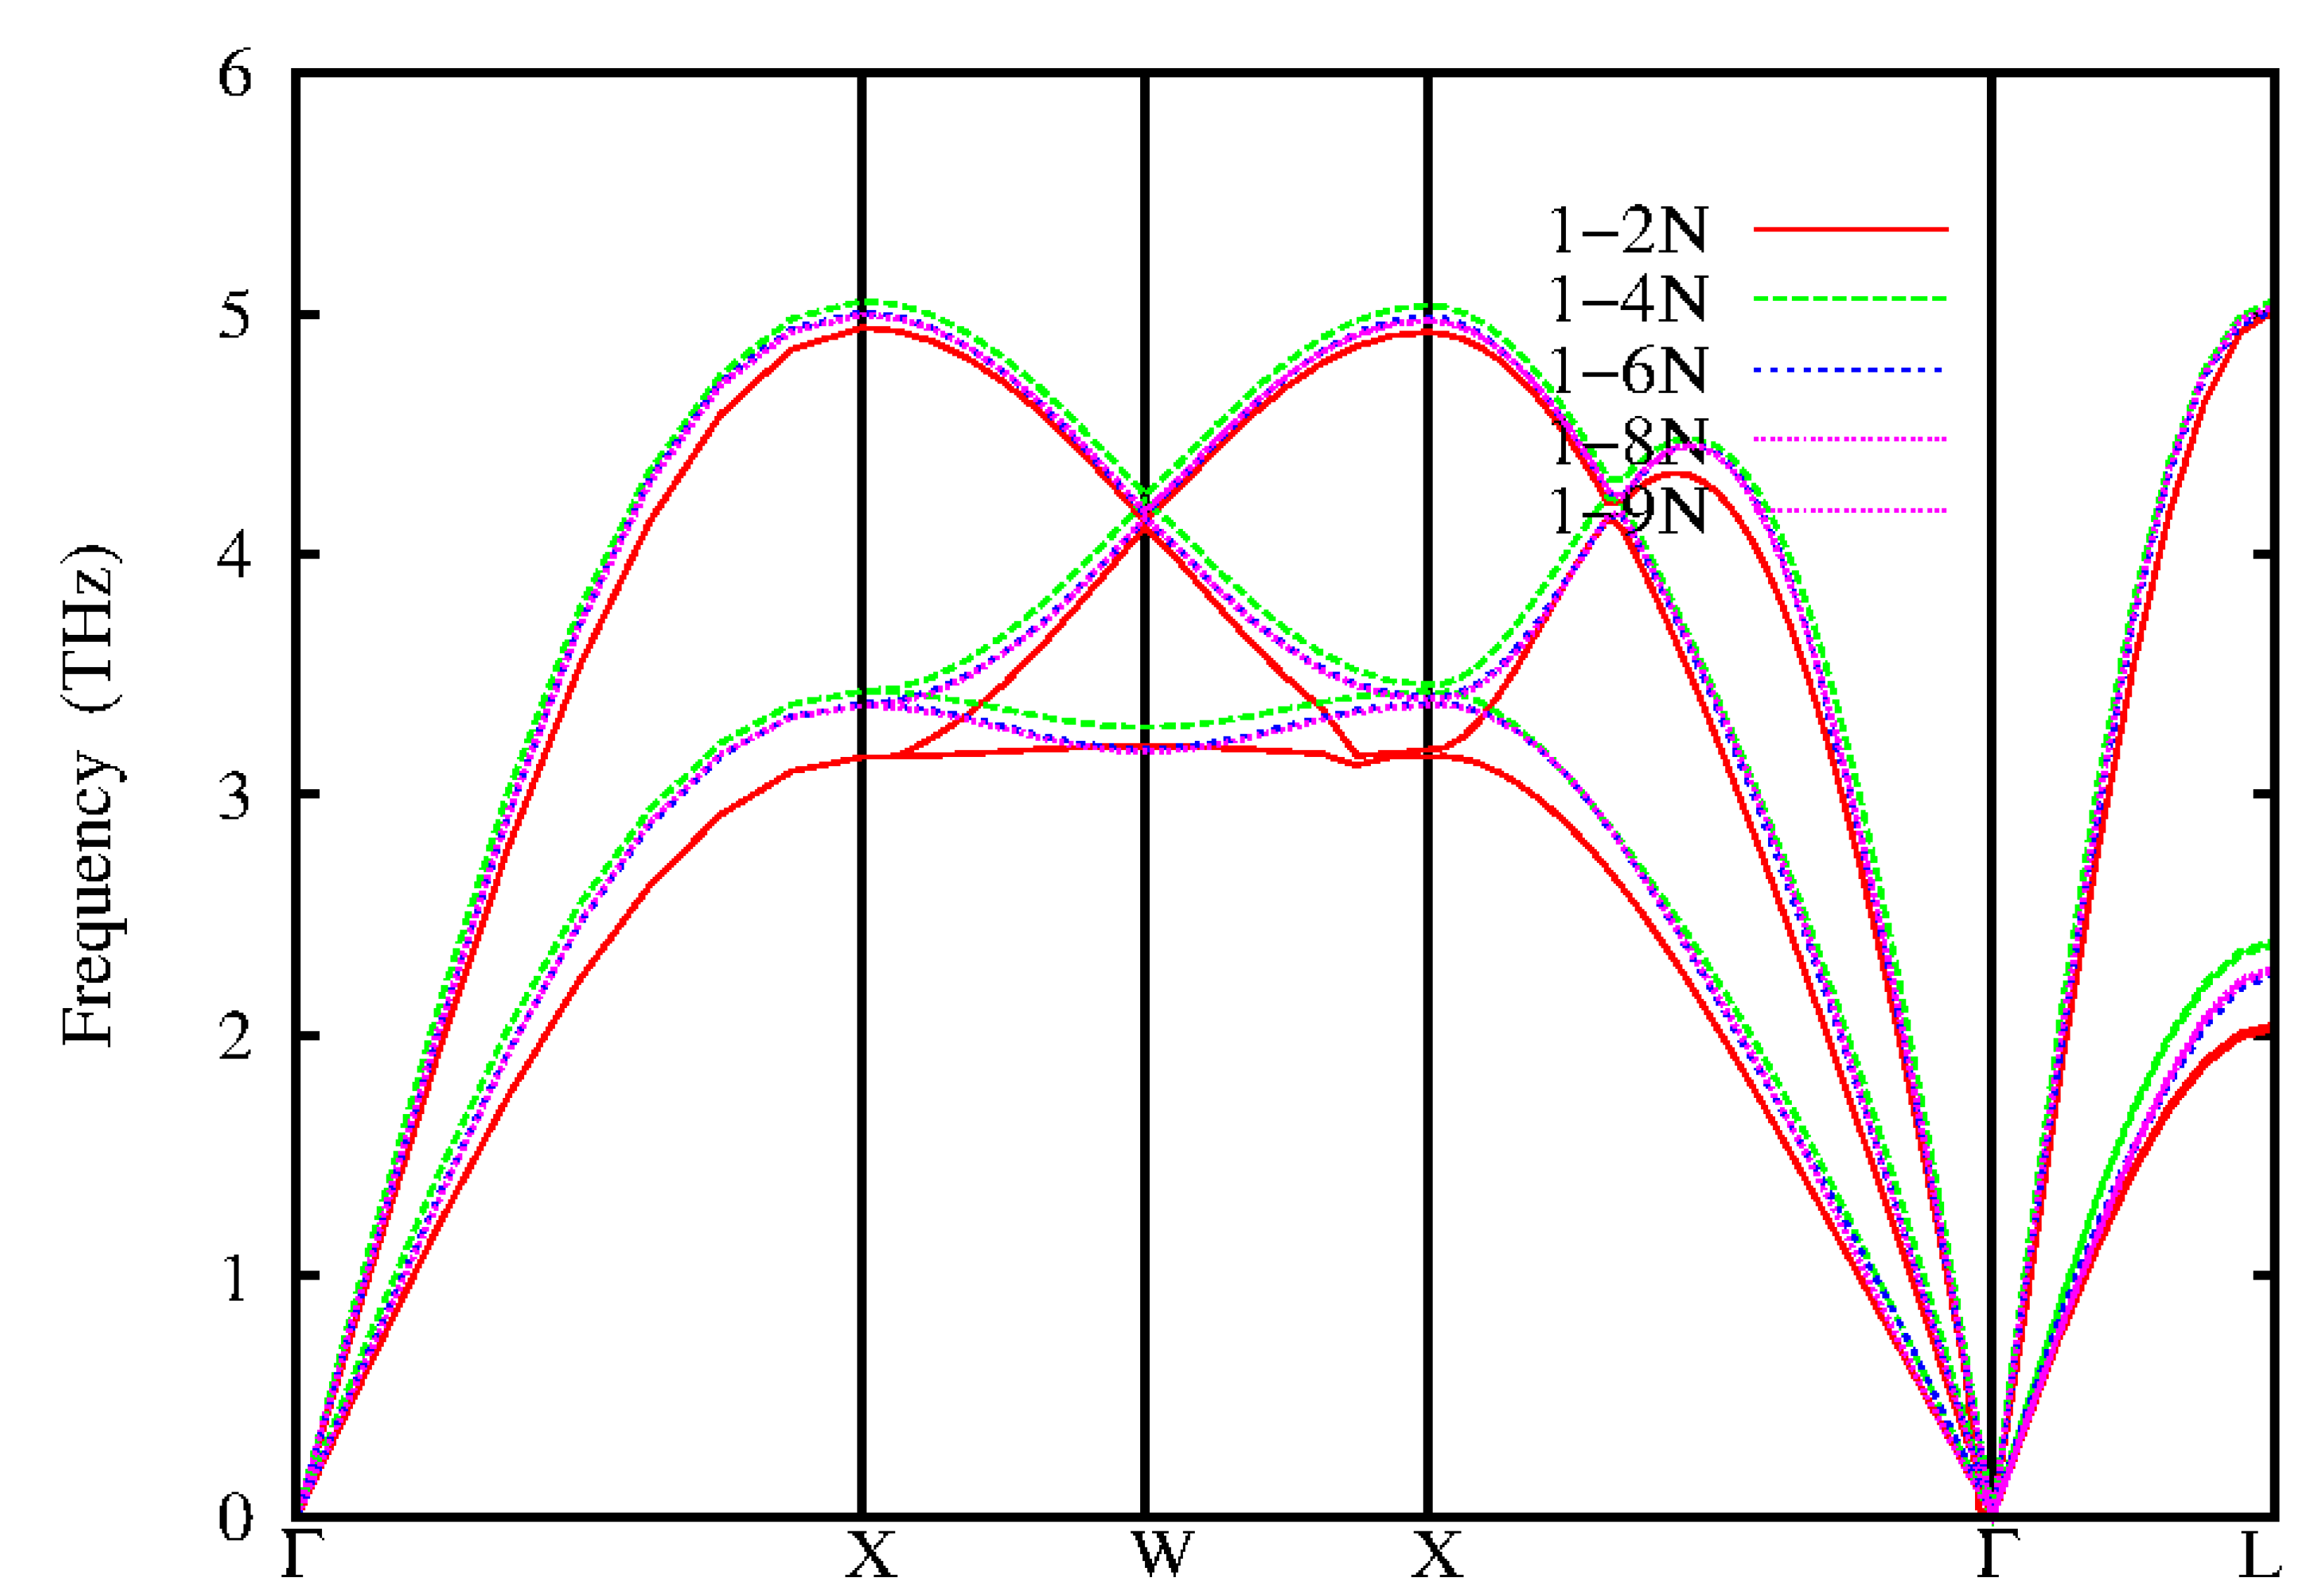
Figure 2. Calculated phonon dispersions for fcc-Ag from analytical approach using IFCs up to 9th neighbour.
Preprints 78307 g002
Table 2. Frequencies calculated analytically using IFCs up to 9thneighbour at selected points of the BZ for Ag. All frequencies are in THz.
Ag XT XL WT WL LT LL
EXP (a) 3.42 4.95 3.29 - 2.31 5.09
1-2N (c) 3.16 4.94 3.20 4.14 2.04 5.02
1-4N (c) 3.43 5.05 3.28 4.24 2.39 5.06
1-6N (c) 3.38 5.01 3.19 4.17 2.26 5.02
1-8N (b) 3.37 5.00 3.17 4.18 2.28 5.04
1-9N (c) 3.38 4.97 3.18 4.19 2.30 5.07
a. Kamitakahara and Brockhouse (1969); b. Dutton et al (1972); c. This work.

3.2. Phonon Dispersions of Gold (Au)

Figure 3. Calculated phonon dispersions for fcc-Au compared to inelastic neutron scattering data (black circles) Lynn et al (1973).
Preprints 78307 g003
Table 3. Frequencies calculated from Quantum espresso at selected points of the BZ for Au. All frequencies are in THz.
Au a(a.u) XT XL WT WL LT LL
EXP (a) 7.34 2.76 4.61 2.64 3.63 1.86 4.71
LDA(b) 7.65 2.67 4.68 2.65 3.67 1.76 4.71
GGA(b) 7.90 2.22 3.85 2.05 2.98 1.52 4.02
a. Lynn et al (1973); b. This work.
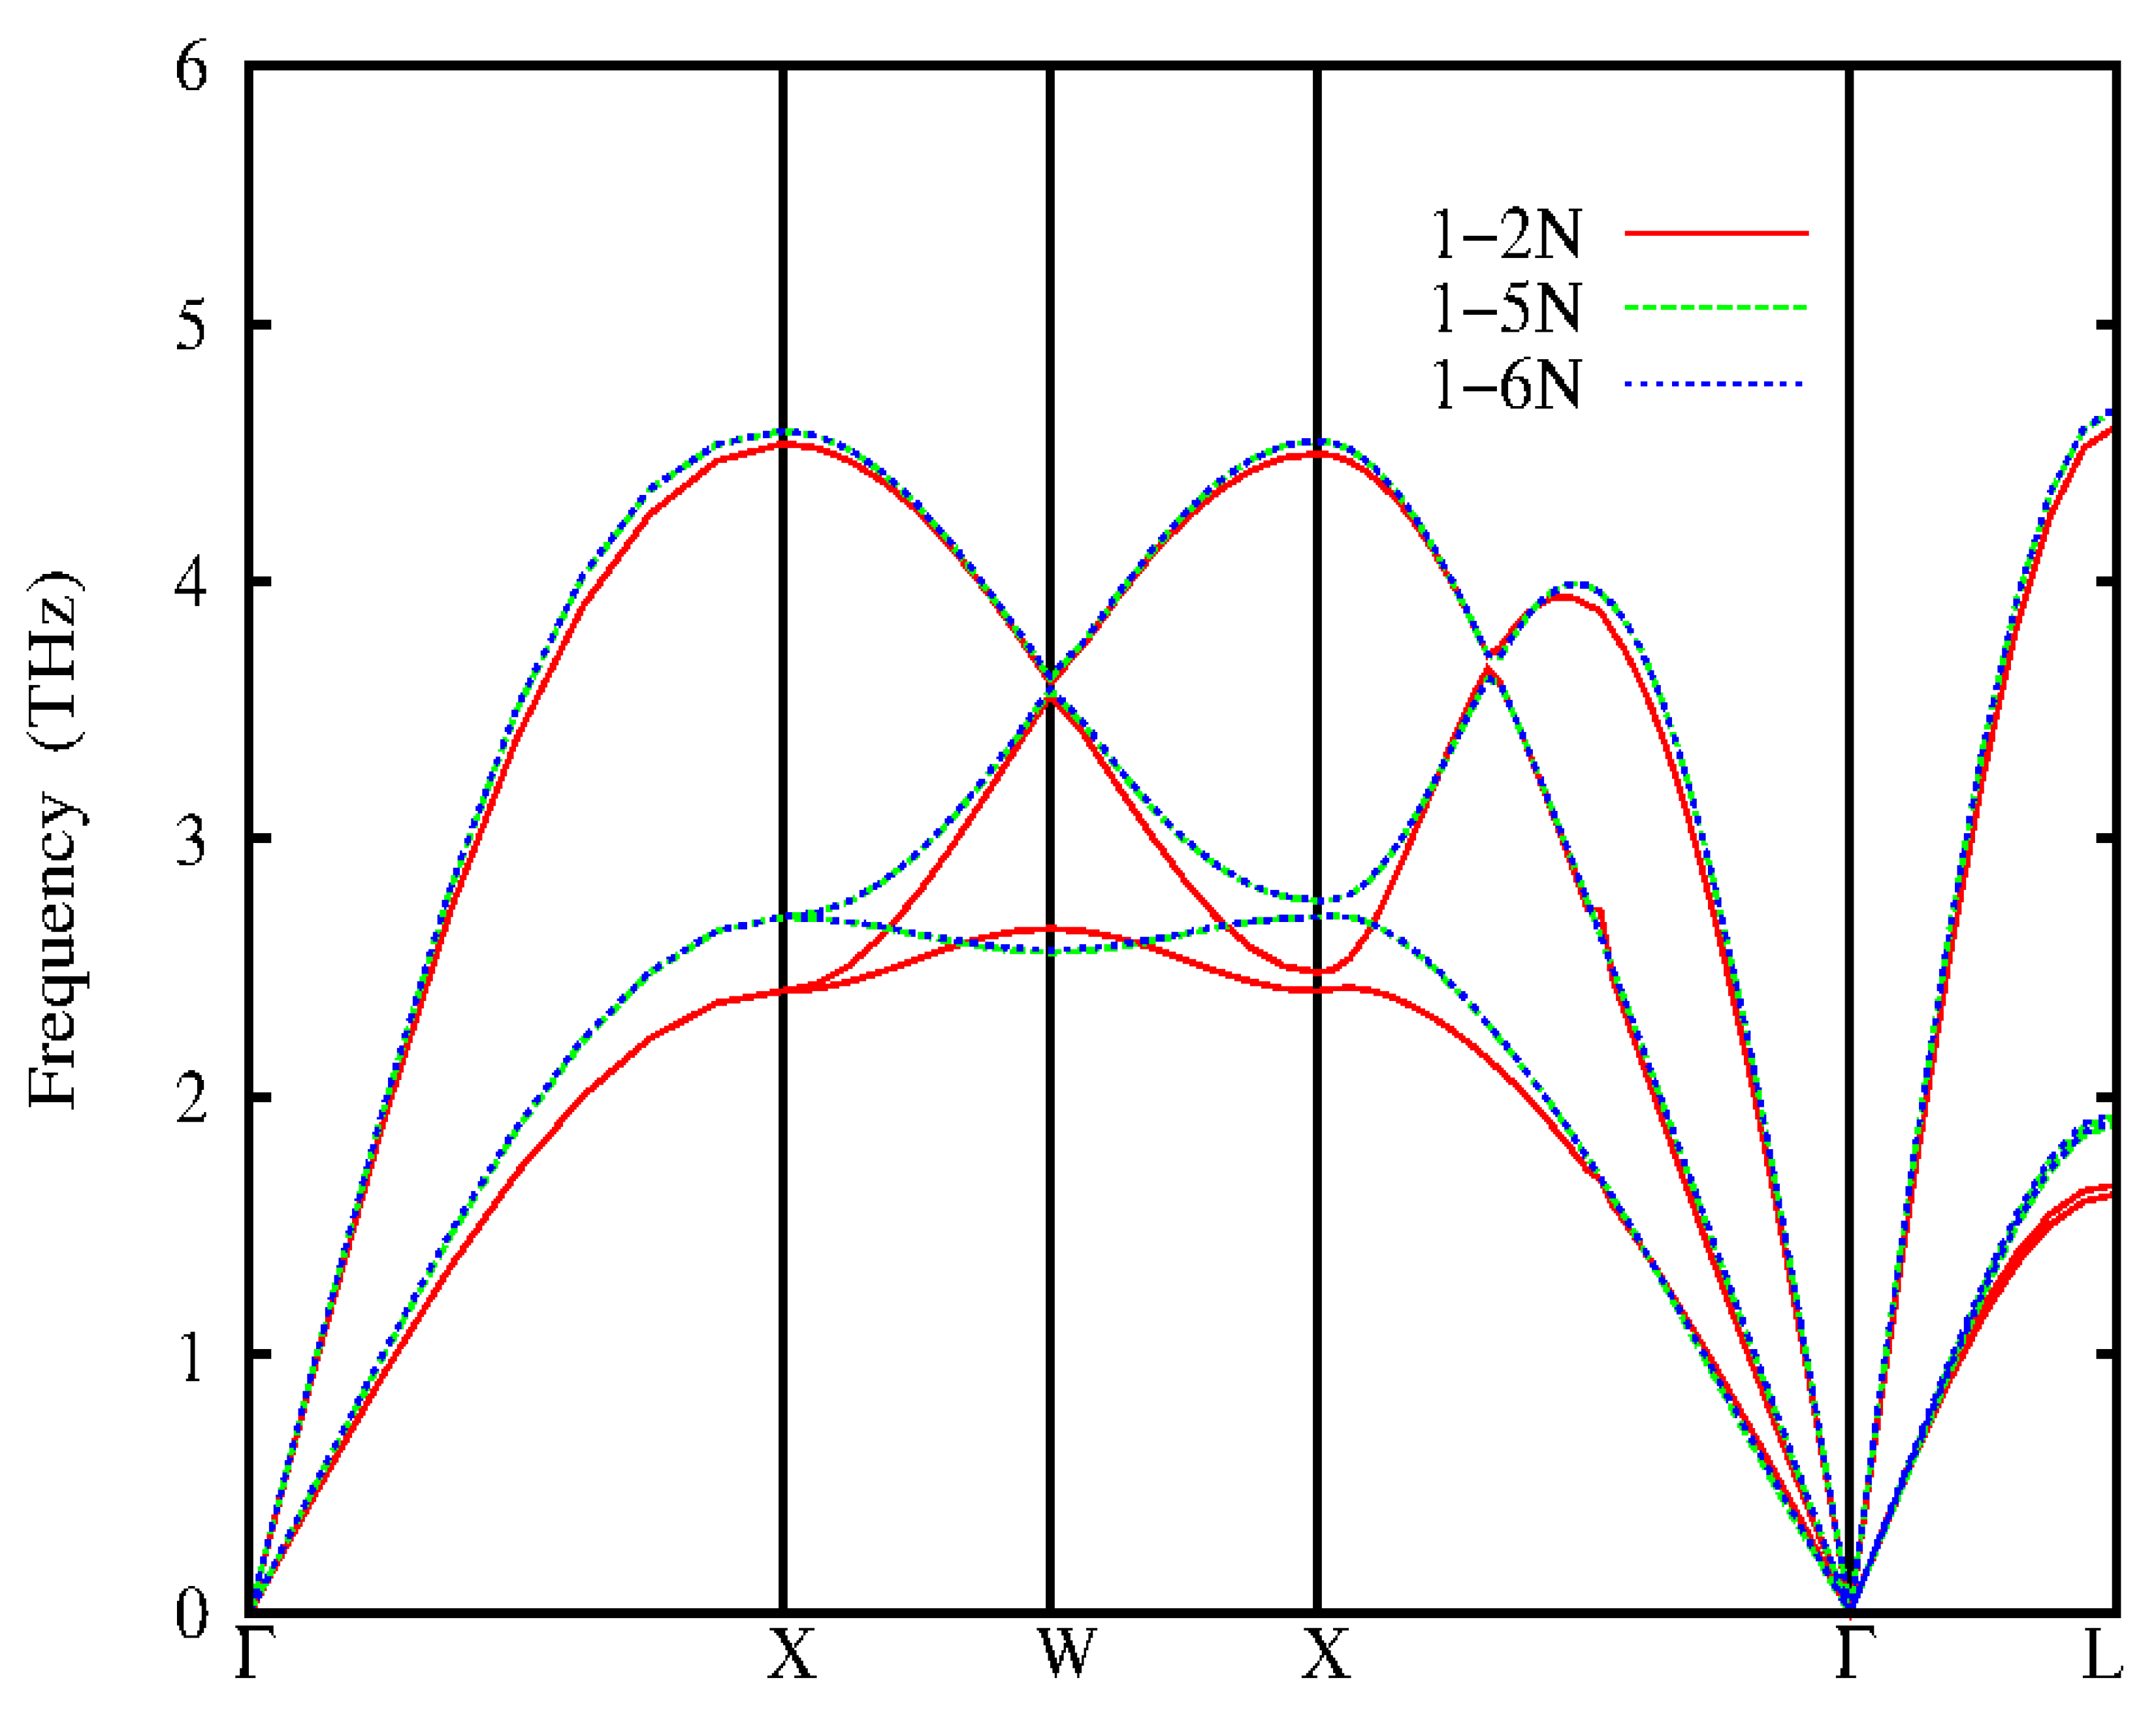
Figure 4. Calculated phonon dispersions for fcc-Au from analytical approach using IFCs up to 6th neighbour.
Preprints 78307 g004
Table 4. Frequencies calculated analytically using IFCs up to 6thneighbour at selected points of the BZ for Au. All frequencies are in THz.
Au XT XL WT WL LT LL
EXP(a) 2.76 4.62 2.64 3.63 1.86 4.71
1-2N(c) 2.41 4.53 2.65 3.60 1.64 4.62
1-5N(b)
1-6N(c)
2.70
2.71
4.59
4.60
2.59
2.57
3.62
3.63
1.90
1.91
4.67
4.68
a. Lynn et al (1973); b. Lynn et al (1973); c. This work.

4.0 Discussion of Results

The phonon dispersion curves of the Fcc metals; Ag, and Au, have been calculated using the Born-von Karman model with different numbers of interacting neighbours and exchange functional and the calculated values compared with experimental results. The different branches of the phonon band structure follow from the Eigen values after diagonalizing the dynamical matrix. The phonon frequencies in the first Brillouin zone were calculated along some high symmetry points and the current calculations show that from the gamma points, along the high symmetries R X and R L directions there are two branches of dispersion (Transverse and Longitudinal) which later split into three branches along the X W direction. By differentiating the phonon frequencies into two modes via acoustic longitudinal (LA) and Acoustic transverse (TA) at the Brillouin zone boundary, it is possible to characterize the high symmetry directions and identify which split corresponds to any of the modes.

4.1. Phonon Dispersion of Silver (Ag)

The phonon dispersion of Silver (Ag) calculated from Quantum Espresso code (Gionnozzi et al, 2009) and inter atomic force constants (IFCS) compared with experimental inelastic neutron scattering data (Dal corso, 2013) are shown in Figures 1 and 2. The experimental inelastic neutron scattering are shown as black circle, redlines are the dispersion calculated by Local Density Approximation (LDA) functional. In the Density Functional Theory (DFT) carried out for Ag, the electron-ion was treated using norm conserving ab – initio pseudopotential, within the applied self-consistent method. The calculations are carried out within the LDA (Perdew and Zunger, 1981) and Generalized Gradient Approximation (GGA) (Perdew et al, 1996) for the exchange and correlation energy using Quantum espresso code. The pseudo-wave functions are expanded in plane waves with kinetic energy cut of 45Ryd for both LDA and GGA. The integration over the Brillouin zone was performed in the reciprocal space with Uniform K-point meshes of 12 X 12 X 12 points for both LDA and GGA. The self-consistency calculation was assumed to have converged when the difference in energy between subsequent iteration was 1.0 X 10 3 Ryd. In silver, some researchers (Grabowski et al, 2007; Xie et al,1999) have reported in their work that the LDA functional gives higher phonon frequencies while GGA functional suffers over determination, giving too low frequencies. This is in agreement with the results obtained in this work as shown in Table 1. The LDA underestimates the lattice of about 1.6% while the GGA overestimates it by 1.9%. The analytical calculated phonon dispersions of Ag using IFCS approach of the 1-2NN, 1-4NN, 1-6NN, 1-8NN and 1-9NN (NN means Nearest Neighbour) are shown in Figure 2 with red lines, green lines, blue lines, purple lines and pink lines representing the nearest neighbours respectively. The analytic phonon dispersion curve of Ag shows that the second neighbour forces (1-2NN) underestimate the experimental except at the longitudinal acoustic branch L about the W point where the frequency is close to experimental results. The frequencies of the 1-4NN, 1-6NN, 1-8NN and 1-9NN gives a better prediction of the experimental phonon dispersion than those of the LDA and GGA functional form Quantum Espresso Code..

4.2. Phonon Dispersion of Gold (Au)

The phonon dispersion of Au calculated from quantum espresso code and inter atomic force constants (IFCs) compared with experimental inelastic neutron scattering data (Lynn et al, 1973) are shown in Figures 3 and 4. The experimental inelastic scattering data are shown as black circles, the red line are the dispersions calculated by GGA functional while the green lines are the LDA dispersion. The density functional theory (DFT) calculations carried out for Au, the electron-ion was treated by using ultra soft ab – initio pseudopontential, within the applied self-consistent method. The calculations are carried out within the local density approximation (LDA) (Perdew and Zunger, 1981) and generalized gradient approximation (GGA) (Perdew et al, 1996) for the exchange and correlation energy using quantum espresso code. The pseudo-wave functions are expanded in plane waves with a kinetic cut off of 55Ryd for both LDA and GGA. The integration over the Brillouin zone were performed in the reciprocal space with uniform K-point meshes of 11 x 11 x 11 and 12 x 12 x 12 for LDA and GGA respectively. The self-consistency calculation was assumed to have converged when the difference in energy between subsequent iteration was 1.0 x 10 3 Ryd. In gold (Ag) the phonon dispersion of LDA functional at equilibrium lattice constant are close to experimental results while the phonon dispersion of the GGA functional underestimates the experimental results. The theoretical GGA and lattice constant of gold overestimates the frequencies by 7.6% and 4.2%. The analytical calculated phonon dispersions of Ag using IFCs approach of the 1-2NN, 1-5NN and 1-6NN are shown in Figure 4. The red, green and blue line represents the nearest neighbours (NN) respectively. The phonon dispersions of the second neighbour forces (1-2NN) underestimates the experiment at the longitudinal (L) and transverse(T) acoustic branches of the X and L points while at the L and T branches about the W points it is close to experiment. The 1-5NN and 1-6NN phonon dispersion are in good agreement with experimental data. Therefore, in Au the phonons of the IFCs predict well the experimental phonons than those of Quantum Espresso.

5.0 Conclusion

For all the metals studied in this research the local density approximation (LDA) gives phonon dispersion slightly higher than experimental results while the generalized gradient approximation (GGA) gives slightly lower frequency.
For Au we observed that the extension to 1 – 6th neighbor gave slightly close agreement with the experimental phonon dispersions results when compared to the 1 – 5th neighbor at WT and LL symmetry points. The percentage errors for Au at point WT are 2.5% and 2.9%, at point LL we observed 0.6% and 0.7% for 1 – 6th and 1 – 5th neighbours respectively. For Ag, the LDA underestimates the lattice of about 1.6% while the GGA overestimates it by 1.9%. The analytic phonon dispersion curve for Ag also shows that the second neighbour forces (1-2NN) underestimate the experimental except at the longitudinal acoustic branch L about the W point where the frequency is close to experimental results.

References

  1. Animalu A.O.E. (1977). Intermediate Quantum Theory of Crystalline Solids. New Jersey: Prentice Hall.
  2. Baroni S., deGironcoli S., Dal CorsoA., and Giannozzi P (2001). Phonons and related crystal properties from density-functional perturbation theory. Rev Mod Phys 73: 515-562. [CrossRef]
  3. Born M., and Huang K. (1954). Dynamical Theory of Crystal lattice (Oxford University Press, London).
  4. Brockhouse B.N.,Arase T, Caglioti G., Rao R. K., and Woods A.D.B (1962). Crystal Dynamics of Lead I. Dispersion Curves at 100ok.Phys. Rev. Vol. 128pp. 1099. [CrossRef]
  5. Dal corso, A. (2013) Ab initio phono dispersions of Transition and Noble Metals: Effects of exchange and Correllation Function. J. Phys.: Cond. Matter 215, 145401. [CrossRef]
  6. Dutton, D. H., Brockhouse, B. N., and Miller, A. P. (1972). Crystal Dynamics of Platinum by Inelastic Neutron Scattering. Can. J. of Phys. 50, 2915. [CrossRef]
  7. Enaroseha O. E. Omamoke, Obed Oyibo and Princillia O. OSUHOR (2021a). Lattice Dynamics in some FCC Metals: Application of Phonon Disprsion in Nickel (Ni) and Platinium (Pt). Solid State Technology, Vol. 64, Number 2: 4640 – 4655.
  8. Enaroseha O. E. Omamoke, P. O. Osuhor, Obed Oyibo and Ernest O. Ojegu (2021b). Theoretical Study of Phonon Spectra in Aluminium(Au) and Copper(Cu): Application of Density Functional Theory and Inter – Atomic Force Constant. Solid States Technology. Vol. 64, Number 2: 1984 – 1999.
  9. Enaroseha O. E. Omamoke, Princillia O. OSUHOR and Obed Oyibo. (2021c). Phonon Dispersion Relation of Lead (Pb) and Palladium (Pd).The Journal of Applied Sciences Research, 8 (1): 1 – 14,.
  10. Enaroseha O. E. Omamoke, Obed Oyibo, and N. Okpara (2021d). Analysis of Ground State Properties of Interacting Electrons in the Anderson Model. The Journal of Applied Sciences Research, 8(1), 15-27.
  11. Enaroseha O. E. Omamoke, Obed Oyibo, Oghenevovwero E. Esi, Edward O. Tuggen and Jennifer A. Nomuoja (2023) The First Principle Calculation of the Properties of Aluminium and Gallium Using Density Functional Theory. European Chemical Bulletin, Vol. 12(5), 290 – 297. Retrieved from Research Square at . [CrossRef]
  12. Gionnozzi P., Baroni S., Bonini N., Calandra M., Car R., Cavazzoni C.,Ceresol D., Chiarotti G., Cococcioni M., Dabo I., Corso A., de Goroncoli S., Fabris S.,Gebauer R., Gerstmann U., Gougoussis C., Kokalj A., Lazzeri M., Martin- samos L., Marzari N., Mauri F., Mazzarello R., Paolini S., Pasquarello A., Paulatto L., Sbraccia C., Scandolo S., Sclauzero G., Seitsonen A P., Smogunov A., Umari P., Wentzcovitch R.M.,(2009) QUANTUM ESPRESSO: a modular and open-source software project for quantum simulations of materials. J Phys. Cond. Matter 21(39): 395502.
  13. Grabowski G., Hickel T., and Neugebauer J.,(2007). Ab initio study of the thermodynamic properties of non-magnetic elementary fcc metals. Exchange-correlation-related error bars and chemical trends. Phys. Rev. B. 76 024309. [CrossRef]
  14. Hanke, W. (1971). In Phonon. Ed. by M. A. Nusimovici, Flammarion Sciences, Paris, pp 294.
  15. Harrison, W. (1966). Pseudo Potentials in the Theory of Metals. Benjamin Press, New York. Pp 44.
  16. Kamitakahara, W. A., and Brockhouse, B. N.(1969). Crystal Dynamics of Silver. Phys. Lett. 29A, 639. [CrossRef]
  17. Lynn, J. W., Smith H. G., and Nicklov R. M. (1973). Lattice Dynamics of Gold. Phys. Rev. B. 8, 3493. [CrossRef]
  18. Nilsson G., and Rolandson S.(1973). Lattice Dynamics of Copperat 80k. Phys. Rev. B7 2393. [CrossRef]
  19. Okoye, C. M. I. (2002). Full Potential Study of the Electronic Structure of Silver Hallides. Physica Status Solidi(b) 234, 580 – 589. [CrossRef]
  20. Omehe N. N.and Enaroseha O. E. Omamoke(2019) Ab INITIO INVESTIGATION OF AgGaS2 and AgGaSe2. International Journal of Engineering Applied Sciences and Technology, Vol. 4,(5), 354-360.
  21. Perdew J. P and Zunger A., (1981). Self-Interaction Correction to density-functional approximation for many-electron systems. Phys. Rev. B 23, 5048. [CrossRef]
  22. Perdew J.P., Burke, K., and Ernzerhof M.,(1996). Generalized Gradient Approximation Made Simple. Phys. Rev. Lett. 77, 3865. [CrossRef]
  23. Sham, L. J., and Ziman, J. M (1963). The Electron – phonon Interaction. Solid State Physics 15, 221 – 298. [CrossRef]
  24. Srivastava G. P (1990). The Physics of Phonons, Hilger, Bristol. [CrossRef]
  25. Toya, T (1964). Lattice Dynamics. Ed. By R. Wallis, Oxford University Press, pp 91 – 95.
  26. Venkataraman, G., Feldkamp, L. A., and Sahni, V. C. (1974). Dynamics of Perfect Crystals. Pp 20 – 123.
  27. Vosko S.H., Taylor R., and Keech G.H. (1965). The influence of the Electron-ion interaction on the phonon frequencies of simple metals Na, Al, and Pb. Can. J. Phys. 431187.
  28. Xie, J., Gironcoli, S., Baroni, S., and Scheffler. M. (1999). First Principle Calculation of the Thermal Properties of Silver. Phys. Rev. B. 59, 965. [CrossRef]
Disclaimer/Publisher’s Note: The statements, opinions and data contained in all publications are solely those of the individual author(s) and contributor(s) and not of MDPI and/or the editor(s). MDPI and/or the editor(s) disclaim responsibility for any injury to people or property resulting from any ideas, methods, instructions or products referred to in the content.
Copyright: This open access article is published under a Creative Commons CC BY 4.0 license, which permit the free download, distribution, and reuse, provided that the author and preprint are cited in any reuse.
Prerpints.org logo

Preprints.org is a free preprint server supported by MDPI in Basel, Switzerland.

Subscribe

© 2024 MDPI (Basel, Switzerland) unless otherwise stated