Submitted:
04 July 2023
Posted:
04 July 2023
You are already at the latest version
Abstract
Keywords:
1. Introduction
2. Materials and Methods
2.1. Cell Lines
2.2. Recombinant mAb Production
2.3. Animal Experiments for ADCC Assay and Mice Xenograft Model
2.4. Flow Cytometry
2.5. Determination of Dissociation Constant (KD) via Flow Cytometry
2.6. Western Blot Analysis
2.7. IHC Analysis
2.8. ADCC
2.9. CDC
2.10. Antitumor Activity of H2Mab-139-mG2a-f in Xenografts of CHO-K1, CHO/HER2, BT-474, and MDA-MB-468 Cells
2.11. Statistical Analyses
3. Results
3.1. Detection of HER2 Using H2Mab-139-mG2a-f by Flow Cytometry
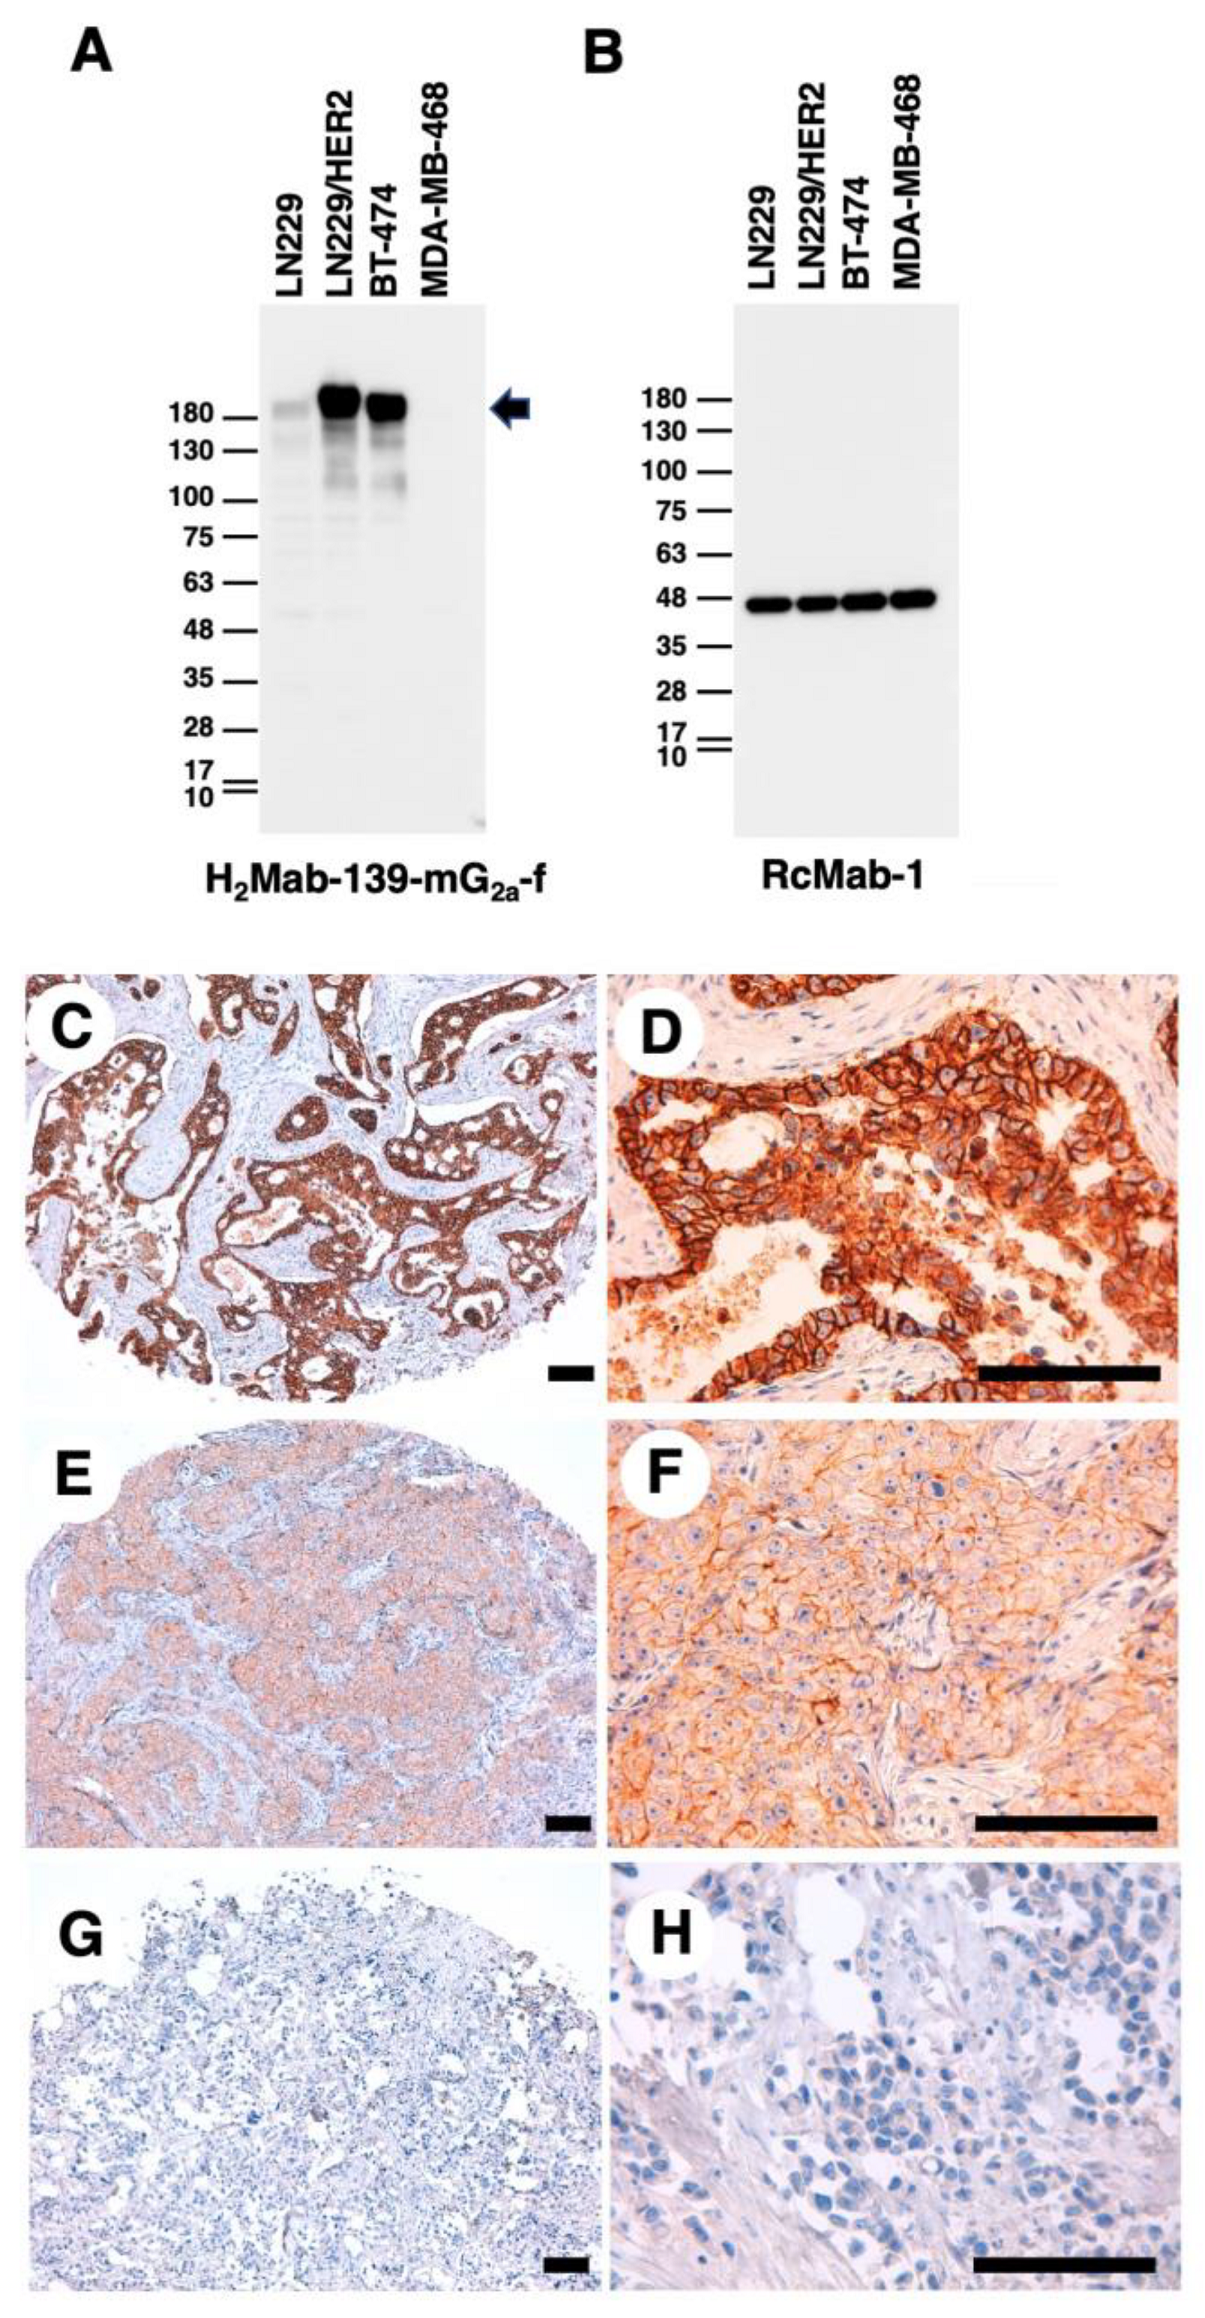
3.2. Detection of HER2 Using H2Mab-139-mG2a-f in Western Blot and IHC Analyses
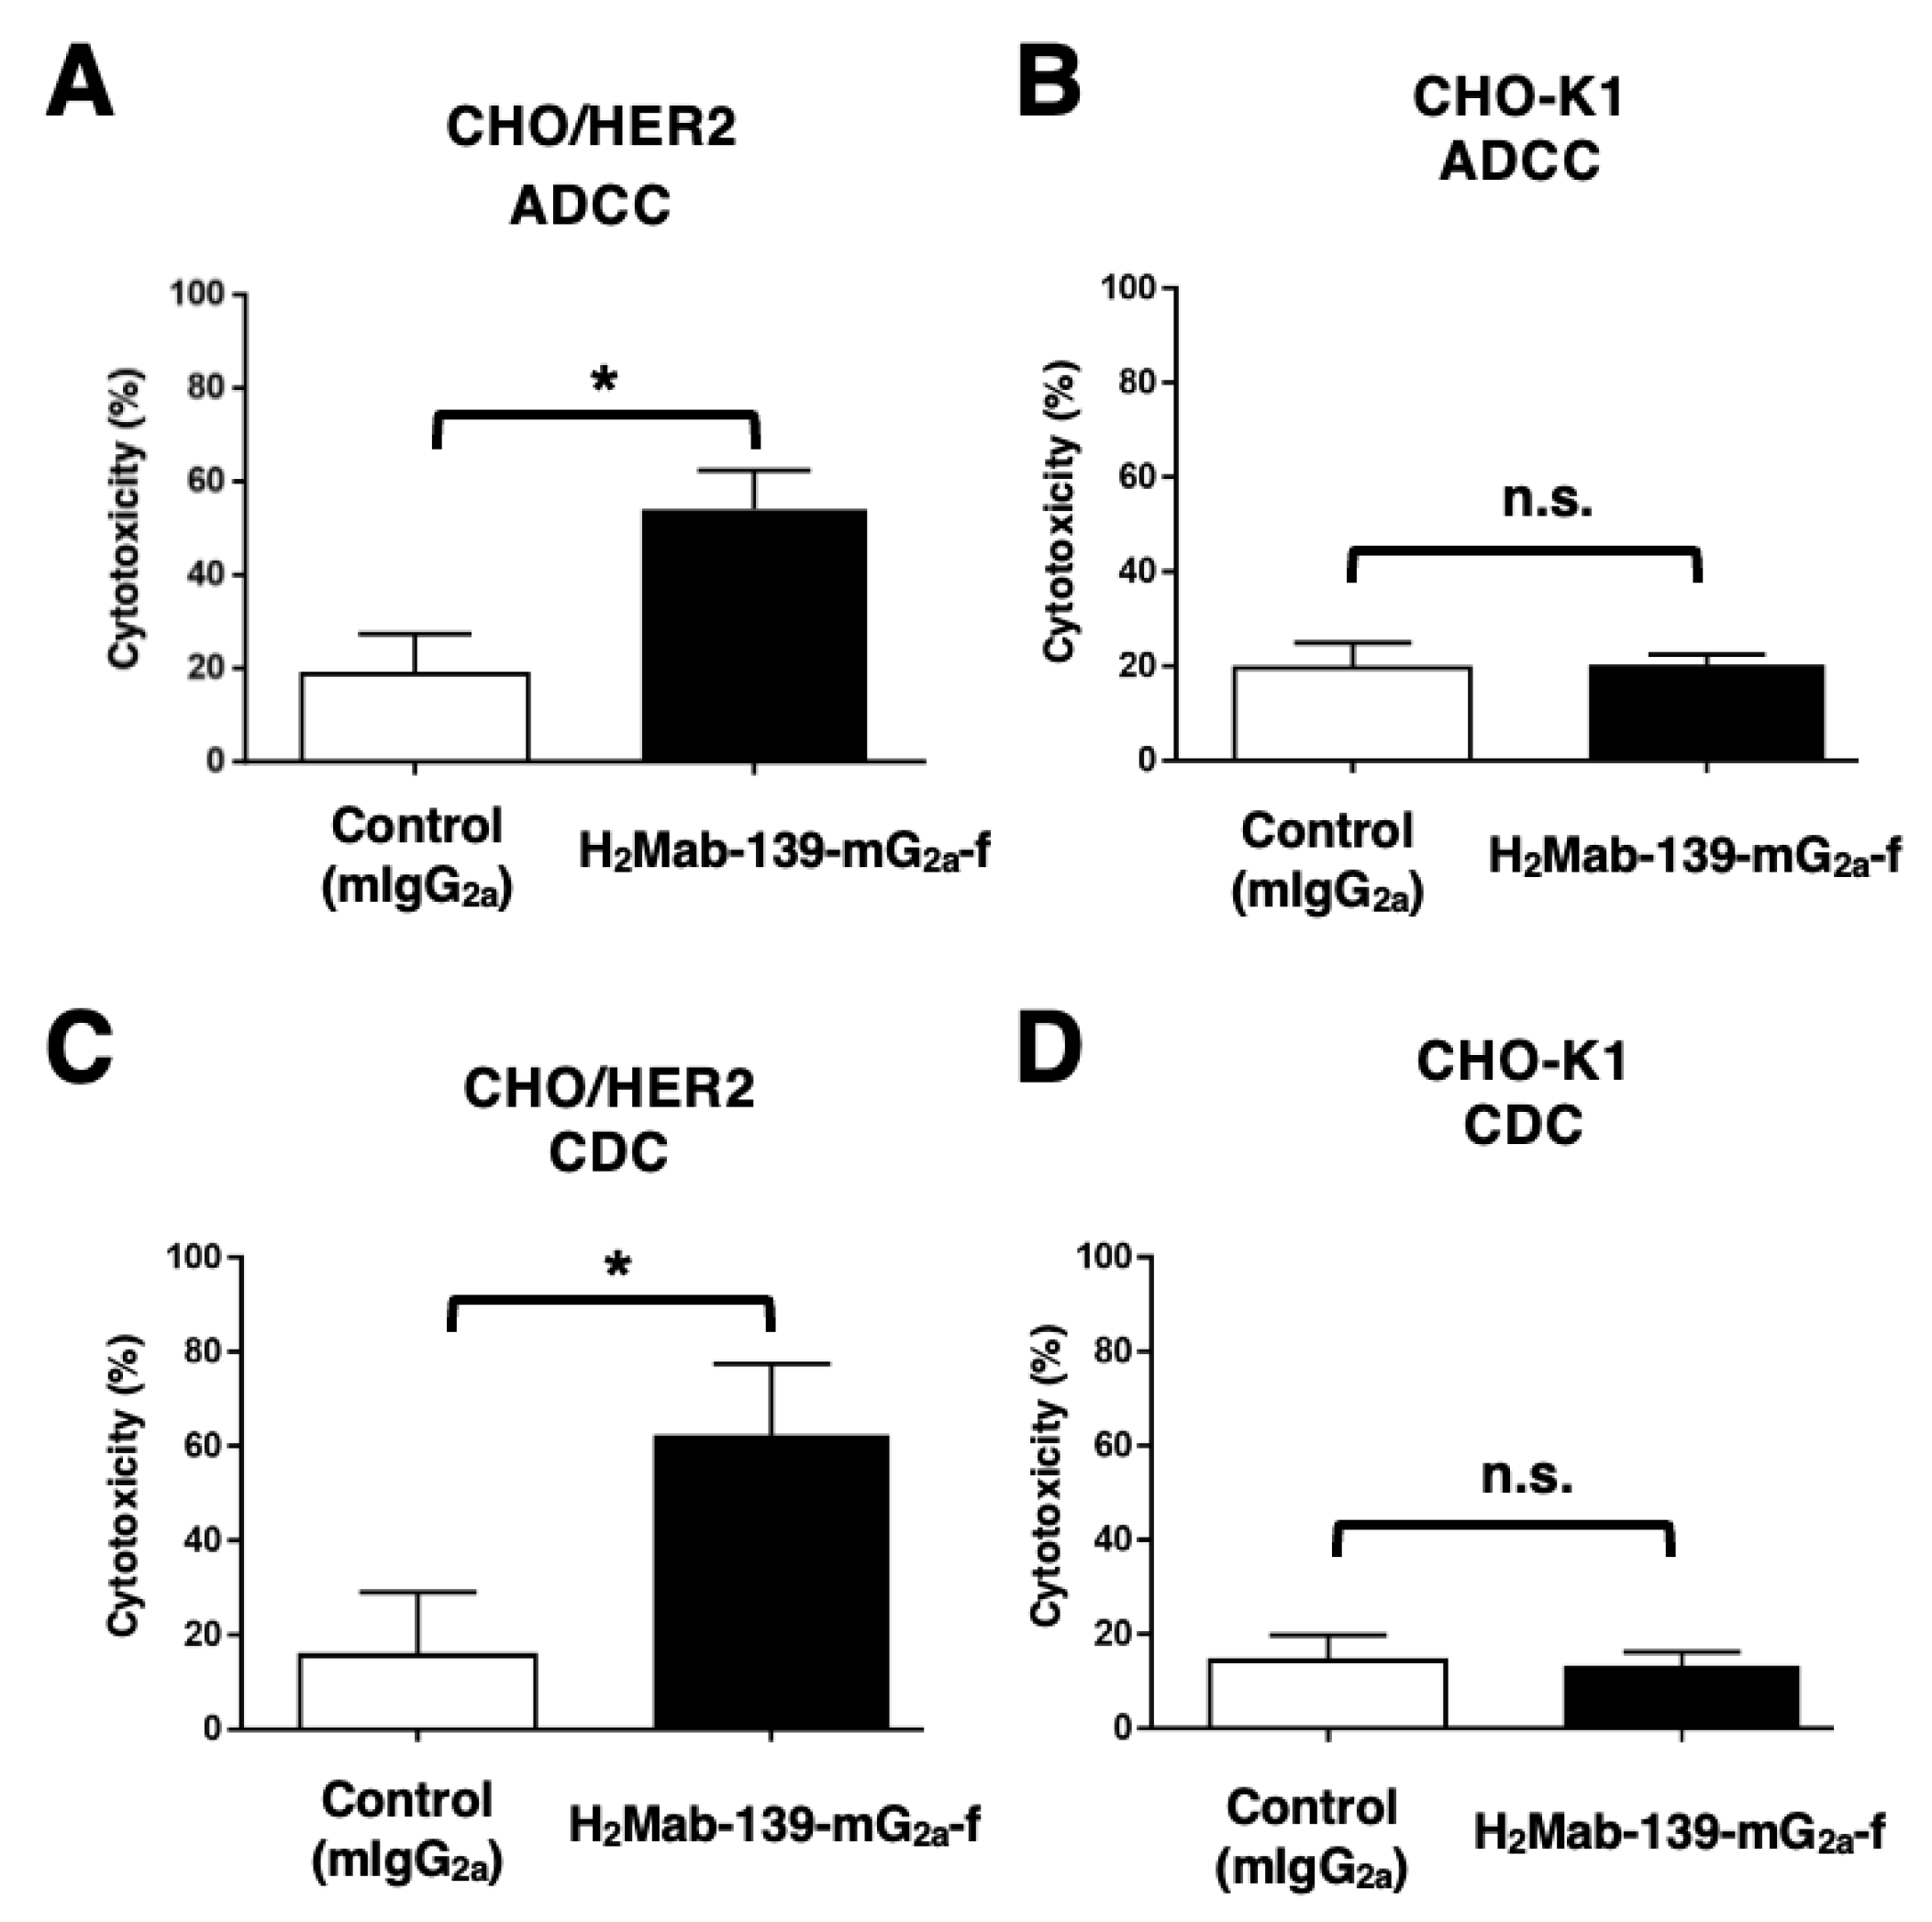
3.3. ADCC and CDC by H2Mab-139-mG2a-f against CHO/HER2 Cells
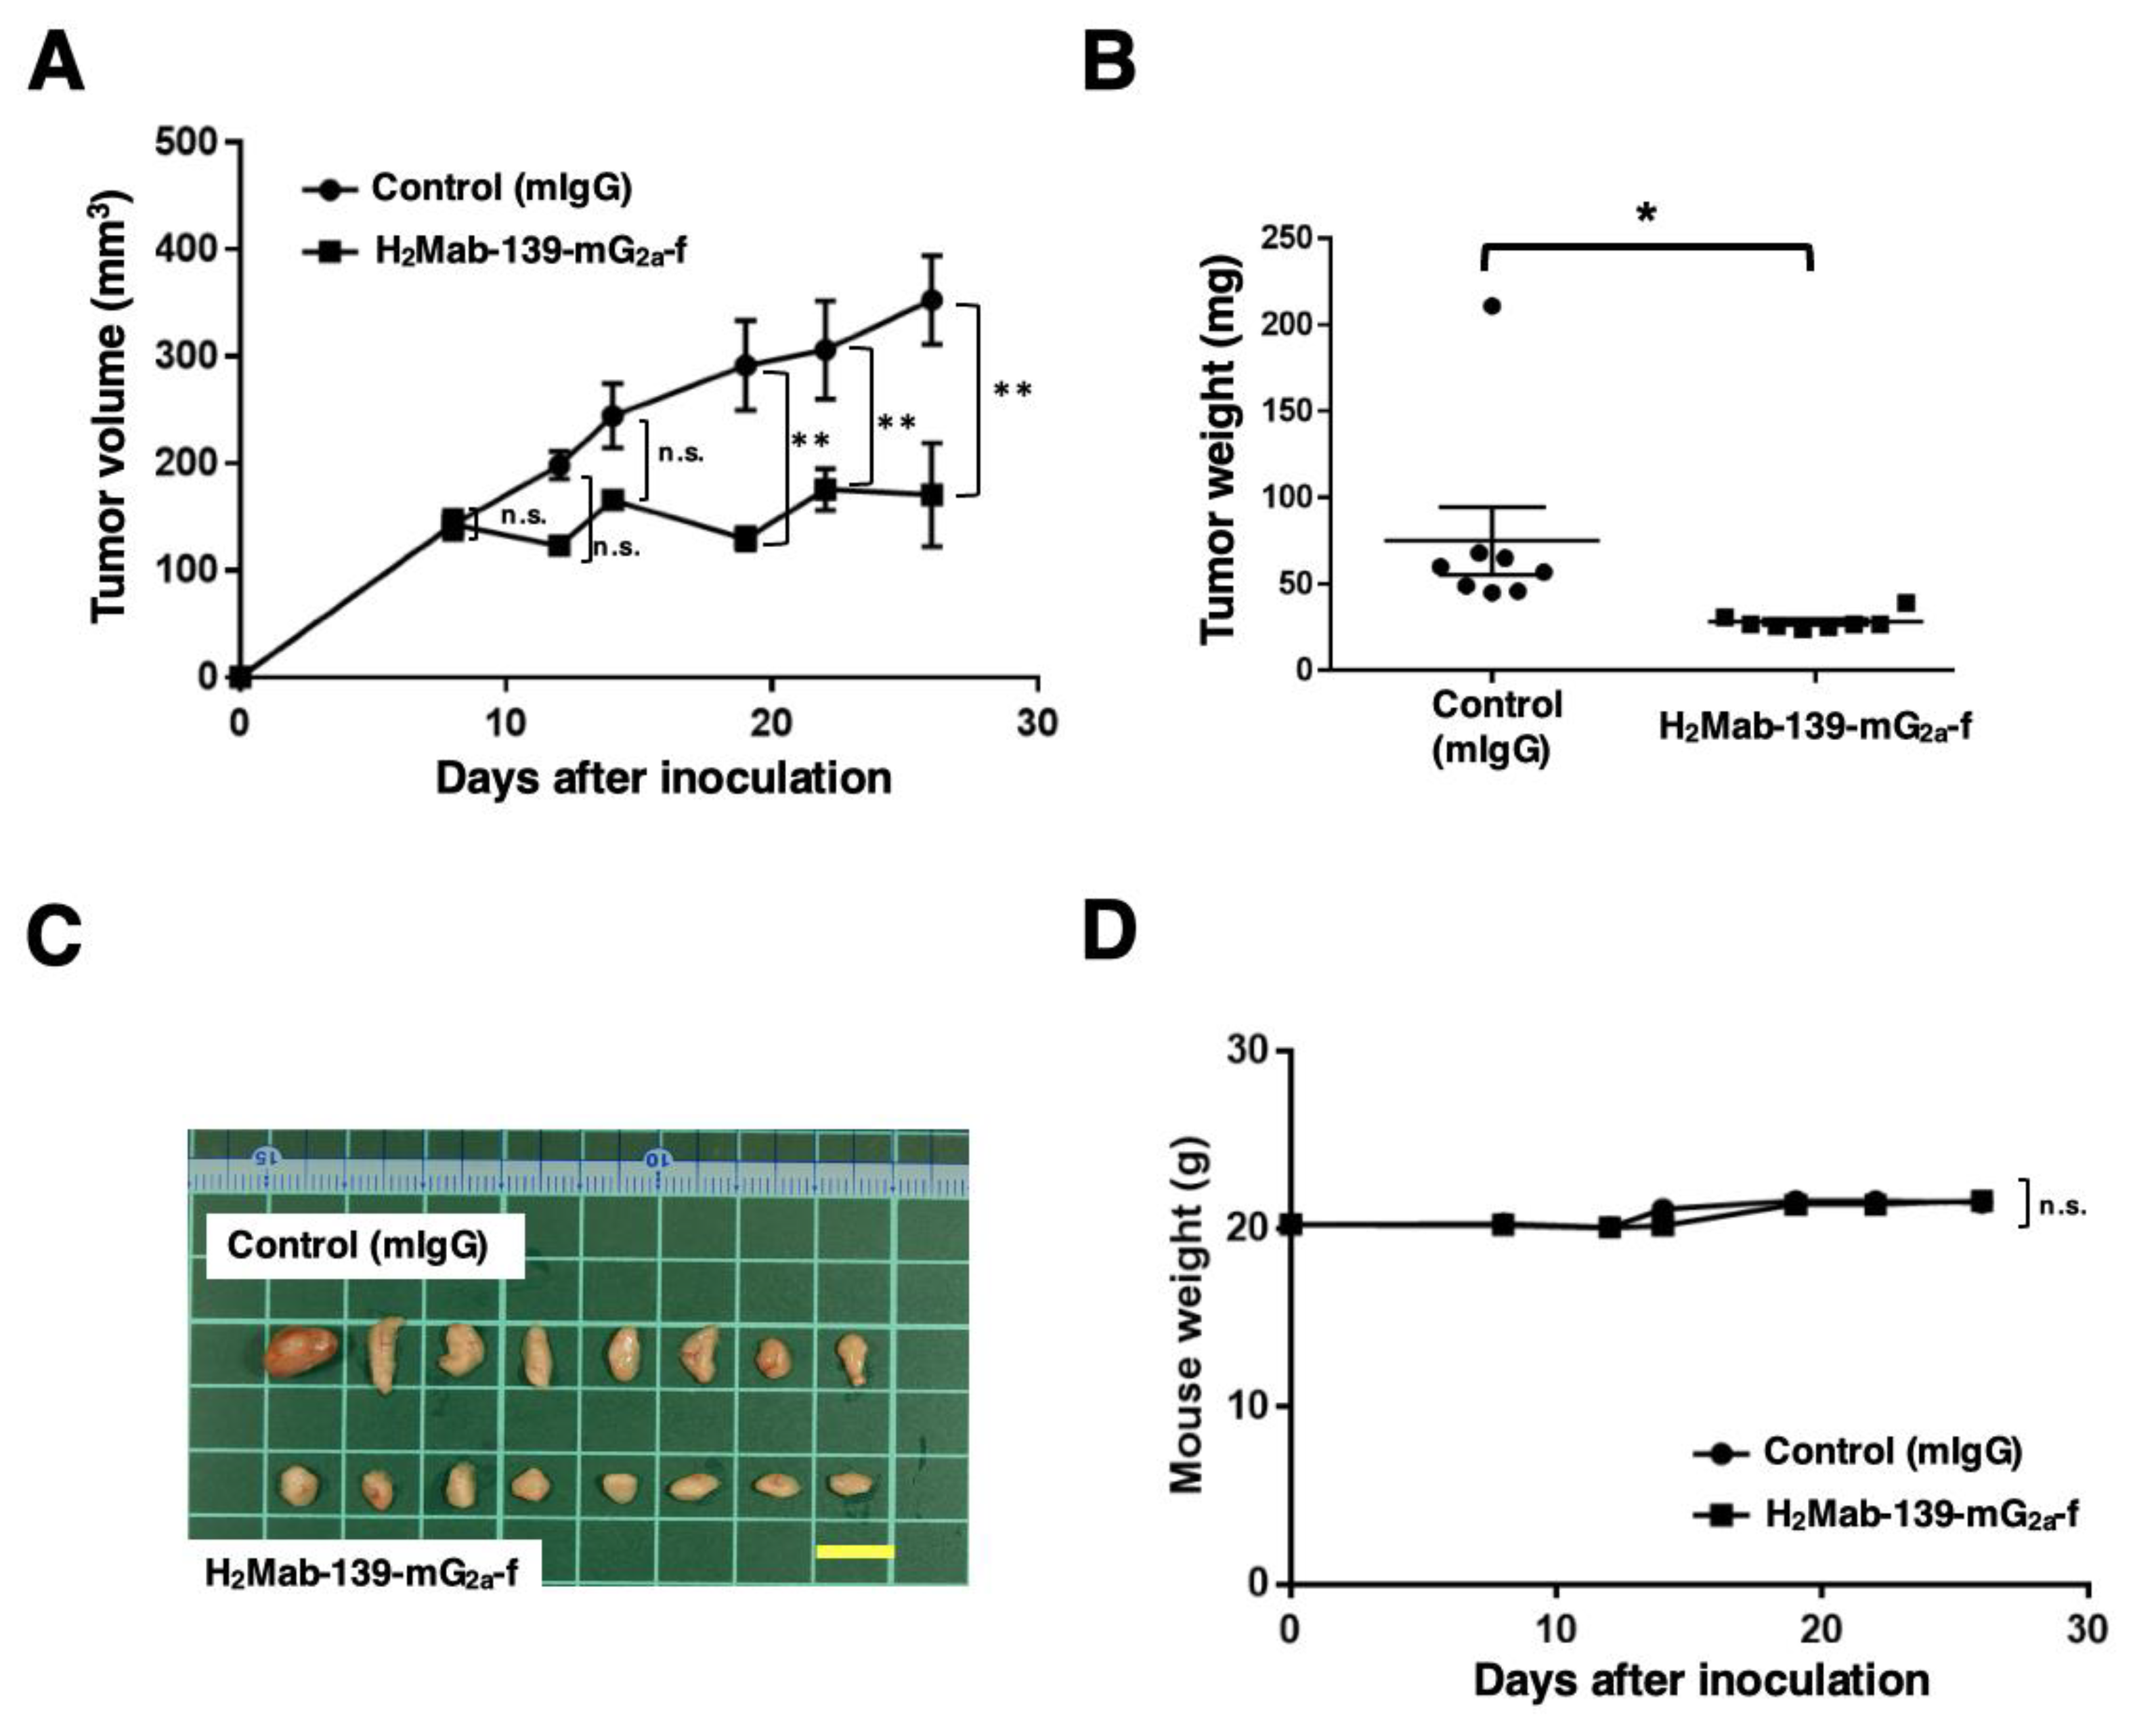
3.4. Antitumor Effects of H2Mab-139-mG2a-f in the Mouse Xenografts of CHO/HER2 Cells
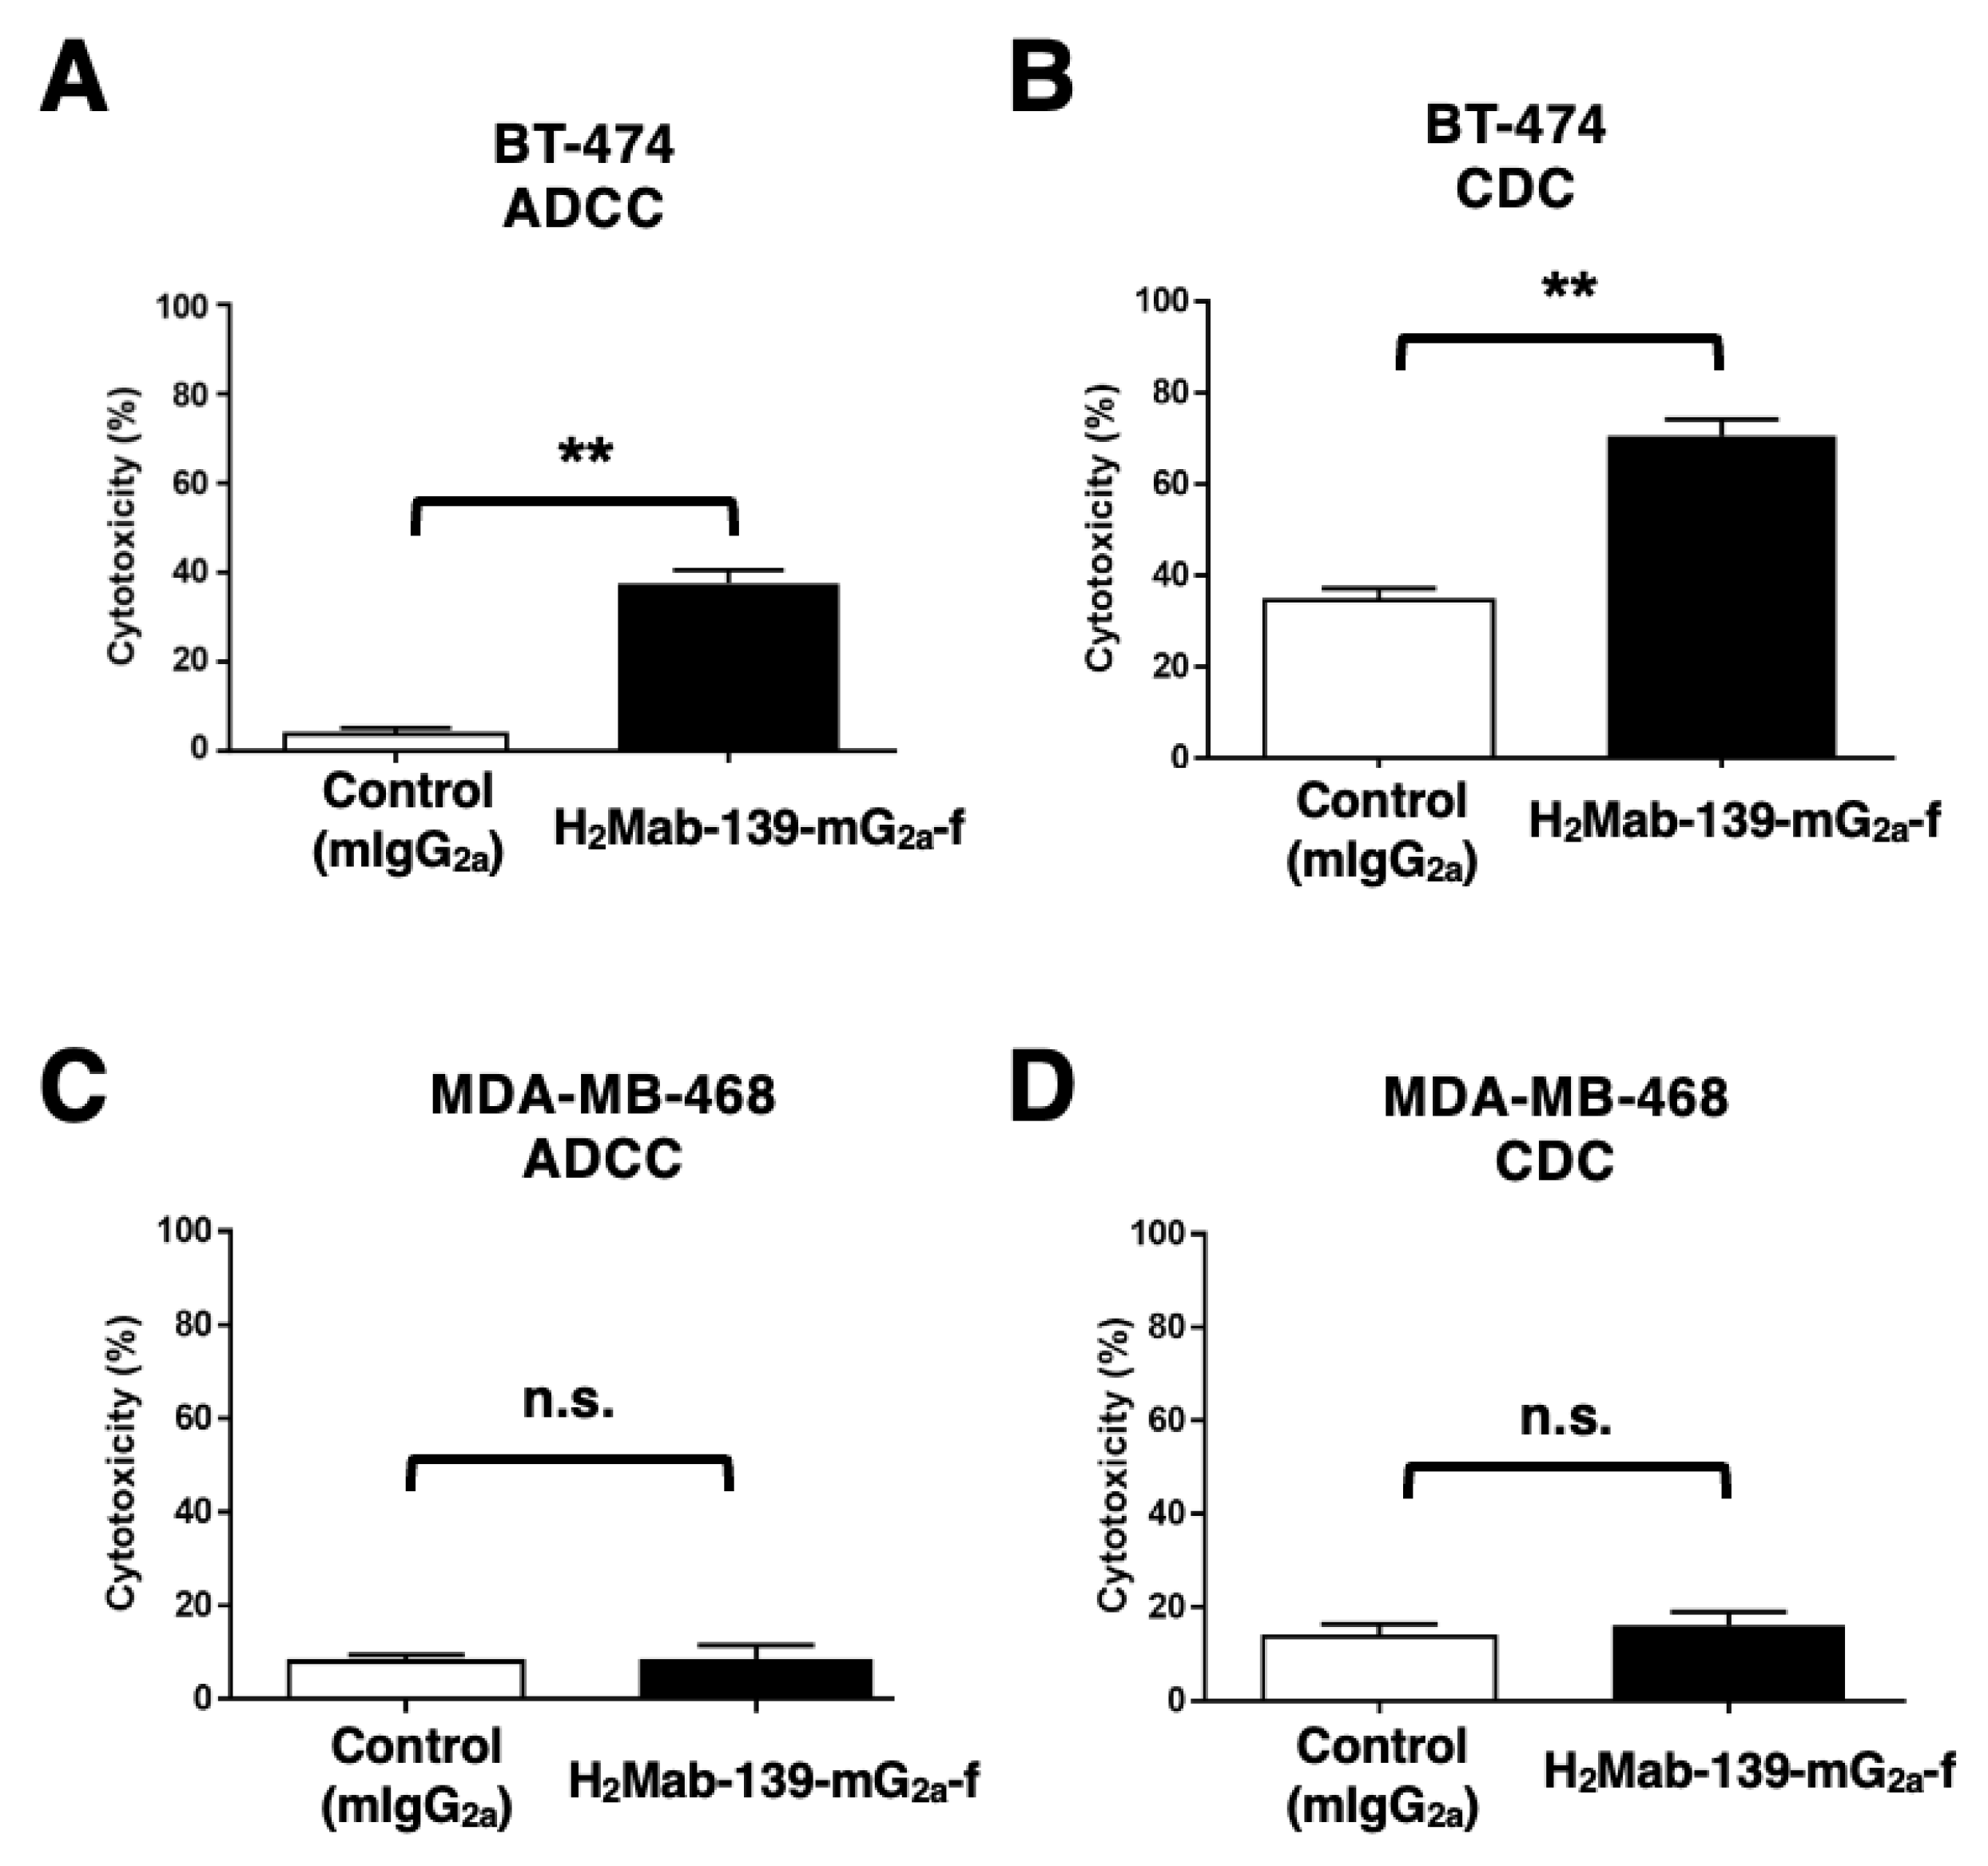
3.5. ADCC and CDC by H2Mab-139-mG2a-f against BT-474 and MDA-MB-468 Cells
3.6. Antitumor Effects of H2Mab-139-mG2a-f in BT-474 and MDA-MB-468 Xenografts
4. Discussion
Supplementary Materials
Author Contributions
Funding
Institutional Review Board Statement
Informed Consent Statement
Data Availability Statement
Acknowledgments
Conflicts of Interest
References
- Yarden, Y.; Sliwkowski, M.X. Untangling the ErbB signalling network. Nat Rev Mol Cell Biol 2001, 2, 127–137. [Google Scholar] [CrossRef]
- Yarden, Y.; Pines, G. The ERBB network: at last, cancer therapy meets systems biology. Nat Rev Cancer 2012, 12, 553–563. [Google Scholar] [CrossRef]
- Stern, D.F.; Kamps, M.P. EGF-stimulated tyrosine phosphorylation of p185neu: a potential model for receptor interactions. Embo j 1988, 7, 995–1001. [Google Scholar] [CrossRef]
- Wallasch, C.; Weiss, F.U.; Niederfellner, G.; Jallal, B.; Issing, W.; Ullrich, A. Heregulin-dependent regulation of HER2/neu oncogenic signaling by heterodimerization with HER3. Embo j 1995, 14, 4267–4275. [Google Scholar] [CrossRef]
- Slamon, D.J.; Clark, G.M.; Wong, S.G.; Levin, W.J.; Ullrich, A.; McGuire, W.L. Human breast cancer: correlation of relapse and survival with amplification of the HER-2/neu oncogene. Science 1987, 235, 177–182. [Google Scholar] [CrossRef]
- Van Cutsem, E.; Bang, Y.J.; Feng-Yi, F.; Xu, J.M.; Lee, K.W.; Jiao, S.C.; Chong, J.L.; López-Sanchez, R.I.; Price, T.; Gladkov, O.; et al. HER2 screening data from ToGA: targeting HER2 in gastric and gastroesophageal junction cancer. Gastric Cancer 2015, 18, 476–484. [Google Scholar] [CrossRef]
- Cho, H.S.; Mason, K.; Ramyar, K.X.; Stanley, A.M.; Gabelli, S.B.; Denney, D.W., Jr.; Leahy, D.J. Structure of the extracellular region of HER2 alone and in complex with the Herceptin Fab. Nature 2003, 421, 756–760. [Google Scholar] [CrossRef]
- Tsao, L.C.; Force, J.; Hartman, Z.C. Mechanisms of Therapeutic Antitumor Monoclonal Antibodies. Cancer Res 2021, 81, 4641–4651. [Google Scholar] [CrossRef]
- Essadi, I.; Benbrahim, Z.; Kaakoua, M.; Reverdy, T.; Corbaux, P.; Freyer, G. HER2-Positive Metastatic Breast Cancer: Available Treatments and Current Developments. Cancers (Basel) 2023, 15. [Google Scholar] [CrossRef]
- Slamon, D.J.; Leyland-Jones, B.; Shak, S.; Fuchs, H.; Paton, V.; Bajamonde, A.; Fleming, T.; Eiermann, W.; Wolter, J.; Pegram, M.; et al. Use of chemotherapy plus a monoclonal antibody against HER2 for metastatic breast cancer that overexpresses HER2. N Engl J Med 2001, 344, 783–792. [Google Scholar] [CrossRef]
- Bang, Y.J.; Van Cutsem, E.; Feyereislova, A.; Chung, H.C.; Shen, L.; Sawaki, A.; Lordick, F.; Ohtsu, A.; Omuro, Y.; Satoh, T.; et al. Trastuzumab in combination with chemotherapy versus chemotherapy alone for treatment of HER2-positive advanced gastric or gastro-oesophageal junction cancer (ToGA): a phase 3, open-label, randomised controlled trial. Lancet 2010, 376, 687–697. [Google Scholar] [CrossRef]
- Maadi, H.; Soheilifar, M.H.; Choi, W.S.; Moshtaghian, A.; Wang, Z. Trastuzumab Mechanism of Action; 20 Years of Research to Unravel a Dilemma. Cancers (Basel) 2021, 13. [Google Scholar] [CrossRef]
- Musolino, A.; Gradishar, W.J.; Rugo, H.S.; Nordstrom, J.L.; Rock, E.P.; Arnaldez, F.; Pegram, M.D. Role of Fcγ receptors in HER2-targeted breast cancer therapy. J Immunother Cancer 2022, 10. [Google Scholar] [CrossRef]
- Nordstrom, J.L.; Gorlatov, S.; Zhang, W.; Yang, Y.; Huang, L.; Burke, S.; Li, H.; Ciccarone, V.; Zhang, T.; Stavenhagen, J.; et al. Anti-tumor activity and toxicokinetics analysis of MGAH22, an anti-HER2 monoclonal antibody with enhanced Fcγ receptor binding properties. Breast Cancer Res 2011, 13, R123. [Google Scholar] [CrossRef]
- McAndrew, N.P. Updates on targeting human epidermal growth factor receptor 2-positive breast cancer: what’s to know in 2021. Curr Opin Obstet Gynecol 2022, 34, 41–45. [Google Scholar] [CrossRef]
- Rugo, H.S.; Im, S.A.; Cardoso, F.; Cortés, J.; Curigliano, G.; Musolino, A.; Pegram, M.D.; Wright, G.S.; Saura, C.; Escrivá-de-Romaní, S.; et al. Efficacy of Margetuximab vs Trastuzumab in Patients With Pretreated ERBB2-Positive Advanced Breast Cancer: A Phase 3 Randomized Clinical Trial. JAMA Oncol 2021, 7, 573–584. [Google Scholar] [CrossRef]
- Golay, J.; Taylor, R.P. The Role of Complement in the Mechanism of Action of Therapeutic Anti-Cancer mAbs. Antibodies (Basel) 2020, 9. [Google Scholar] [CrossRef]
- Reis, E.S.; Mastellos, D.C.; Ricklin, D.; Mantovani, A.; Lambris, J.D. Complement in cancer: untangling an intricate relationship. Nat Rev Immunol 2018, 18, 5–18. [Google Scholar] [CrossRef]
- Franklin, M.C.; Carey, K.D.; Vajdos, F.F.; Leahy, D.J.; de Vos, A.M.; Sliwkowski, M.X. Insights into ErbB signaling from the structure of the ErbB2-pertuzumab complex. Cancer Cell 2004, 5, 317–328. [Google Scholar] [CrossRef]
- Badache, A.; Hynes, N.E. A new therapeutic antibody masks ErbB2 to its partners. Cancer Cell 2004, 5, 299–301. [Google Scholar] [CrossRef]
- Swain, S.M.; Baselga, J.; Kim, S.B.; Ro, J.; Semiglazov, V.; Campone, M.; Ciruelos, E.; Ferrero, J.M.; Schneeweiss, A.; Heeson, S.; et al. Pertuzumab, trastuzumab, and docetaxel in HER2-positive metastatic breast cancer. N Engl J Med 2015, 372, 724–734. [Google Scholar] [CrossRef] [PubMed]
- Diwanji, D.; Trenker, R.; Thaker, T.M.; Wang, F.; Agard, D.A.; Verba, K.A.; Jura, N. Structures of the HER2-HER3-NRG1β complex reveal a dynamic dimer interface. Nature 2021, 600, 339–343. [Google Scholar] [CrossRef] [PubMed]
- Itai, S.; Fujii, Y.; Kaneko, M.K.; Yamada, S.; Nakamura, T.; Yanaka, M.; Saidoh, N.; Chang, Y.W.; Handa, S.; Takahashi, M.; et al. H2Mab-77 is a Sensitive and Specific Anti-HER2 Monoclonal Antibody Against Breast Cancer. Monoclon Antib Immunodiagn Immunother 2017, 36, 143–148. [Google Scholar] [CrossRef] [PubMed]
- Yamada, S.; Itai, S.; Nakamura, T.; Chang, Y.W.; Harada, H.; Suzuki, H.; Kaneko, M.K.; Kato, Y. Establishment of H(2)Mab-119, an Anti-Human Epidermal Growth Factor Receptor 2 Monoclonal Antibody, Against Pancreatic Cancer. Monoclon Antib Immunodiagn Immunother 2017, 36, 287–290. [Google Scholar] [CrossRef]
- Kaneko, M.K.; Yamada, S.; Itai, S.; Kato, Y. Development of an Anti-HER2 Monoclonal Antibody H2Mab-139 Against Colon Cancer. Monoclon Antib Immunodiagn Immunother 2018, 37, 59–62. [Google Scholar] [CrossRef]
- Li, G.; Suzuki, H.; Ohishi, T.; Asano, T.; Tanaka, T.; Yanaka, M.; Nakamura, T.; Yoshikawa, T.; Kawada, M.; Kaneko, M.K.; et al. Antitumor activities of a defucosylated anti-EpCAM monoclonal antibody in colorectal carcinoma xenograft models. Int J Mol Med 2023, 51. [Google Scholar] [CrossRef]
- Nanamiya, R.; Takei, J.; Ohishi, T.; Asano, T.; Tanaka, T.; Sano, M.; Nakamura, T.; Yanaka, M.; Handa, S.; Tateyama, N.; et al. Defucosylated Anti-Epidermal Growth Factor Receptor Monoclonal Antibody (134-mG(2a)-f) Exerts Antitumor Activities in Mouse Xenograft Models of Canine Osteosarcoma. Monoclon Antib Immunodiagn Immunother 2022, 41, 1–7. [Google Scholar] [CrossRef]
- Kawabata, H.; Suzuki, H.; Ohishi, T.; Kawada, M.; Kaneko, M.K.; Kato, Y. A Defucosylated Mouse Anti-CD10 Monoclonal Antibody (31-mG(2a)-f) Exerts Antitumor Activity in a Mouse Xenograft Model of CD10-Overexpressed Tumors. Monoclon Antib Immunodiagn Immunother 2022, 41, 59–66. [Google Scholar] [CrossRef]
- Kawabata, H.; Ohishi, T.; Suzuki, H.; Asano, T.; Kawada, M.; Suzuki, H.; Kaneko, M.K.; Kato, Y. A Defucosylated Mouse Anti-CD10 Monoclonal Antibody (31-mG(2a)-f) Exerts Antitumor Activity in a Mouse Xenograft Model of Renal Cell Cancers. Monoclon Antib Immunodiagn Immunother 2022. [Google Scholar] [CrossRef]
- Asano, T.; Tanaka, T.; Suzuki, H.; Li, G.; Ohishi, T.; Kawada, M.; Yoshikawa, T.; Kaneko, M.K.; Kato, Y. A Defucosylated Anti-EpCAM Monoclonal Antibody (EpMab-37-mG(2a)-f) Exerts Antitumor Activity in Xenograft Model. Antibodies (Basel) 2022, 11. [Google Scholar] [CrossRef]
- Tateyama, N.; Nanamiya, R.; Ohishi, T.; Takei, J.; Nakamura, T.; Yanaka, M.; Hosono, H.; Saito, M.; Asano, T.; Tanaka, T.; et al. Defucosylated Anti-Epidermal Growth Factor Receptor Monoclonal Antibody 134-mG(2a)-f Exerts Antitumor Activities in Mouse Xenograft Models of Dog Epidermal Growth Factor Receptor-Overexpressed Cells. Monoclon Antib Immunodiagn Immunother 2021, 40, 177–183. [Google Scholar] [CrossRef]
- Takei, J.; Ohishi, T.; Kaneko, M.K.; Harada, H.; Kawada, M.; Kato, Y. A defucosylated anti-PD-L1 monoclonal antibody 13-mG(2a)-f exerts antitumor effects in mouse xenograft models of oral squamous cell carcinoma. Biochem Biophys Rep 2020, 24, 100801. [Google Scholar] [CrossRef]
- Takei, J.; Kaneko, M.K.; Ohishi, T.; Hosono, H.; Nakamura, T.; Yanaka, M.; Sano, M.; Asano, T.; Sayama, Y.; Kawada, M.; et al. A defucosylated antiCD44 monoclonal antibody 5mG2af exerts antitumor effects in mouse xenograft models of oral squamous cell carcinoma. Oncol Rep 2020, 44, 1949–1960. [Google Scholar] [CrossRef]
- Yamane-Ohnuki, N.; Kinoshita, S.; Inoue-Urakubo, M.; Kusunoki, M.; Iida, S.; Nakano, R.; Wakitani, M.; Niwa, R.; Sakurada, M.; Uchida, K.; et al. Establishment of FUT8 knockout Chinese hamster ovary cells: an ideal host cell line for producing completely defucosylated antibodies with enhanced antibody-dependent cellular cytotoxicity. Biotechnol Bioeng 2004, 87, 614–622. [Google Scholar] [CrossRef]
- Kato, Y.; Kaneko, M.K.; Kuno, A.; Uchiyama, N.; Amano, K.; Chiba, Y.; Hasegawa, Y.; Hirabayashi, J.; Narimatsu, H.; Mishima, K.; et al. Inhibition of tumor cell-induced platelet aggregation using a novel anti-podoplanin antibody reacting with its platelet-aggregation-stimulating domain. Biochem Biophys Res Commun 2006, 349, 1301–1307. [Google Scholar] [CrossRef]
- Ishikawa, A.; Waseda, M.; Ishii, T.; Kaneko, M.K.; Kato, Y.; Kaneko, S. Improved anti-solid tumor response by humanized anti-podoplanin chimeric antigen receptor transduced human cytotoxic T cells in an animal model. Genes Cells 2022, 27, 549–558. [Google Scholar] [CrossRef]
- Tamura-Sakaguchi, R.; Aruga, R.; Hirose, M.; Ekimoto, T.; Miyake, T.; Hizukuri, Y.; Oi, R.; Kaneko, M.K.; Kato, Y.; Akiyama, Y.; et al. Moving toward generalizable NZ-1 labeling for 3D structure determination with optimized epitope-tag insertion. Acta Crystallogr D Struct Biol 2021, 77, 645–662. [Google Scholar] [CrossRef]
- Kaneko, M.K.; Ohishi, T.; Nakamura, T.; Inoue, H.; Takei, J.; Sano, M.; Asano, T.; Sayama, Y.; Hosono, H.; Suzuki, H.; et al. Development of Core-Fucose-Deficient Humanized and Chimeric Anti-Human Podoplanin Antibodies. Monoclon Antib Immunodiagn Immunother 2020, 39, 167–174. [Google Scholar] [CrossRef] [PubMed]
- Fujii, Y.; Matsunaga, Y.; Arimori, T.; Kitago, Y.; Ogasawara, S.; Kaneko, M.K.; Kato, Y.; Takagi, J. Tailored placement of a turn-forming PA tag into the structured domain of a protein to probe its conformational state. J Cell Sci 2016, 129, 1512–1522. [Google Scholar] [CrossRef] [PubMed]
- Abe, S.; Kaneko, M.K.; Tsuchihashi, Y.; Izumi, T.; Ogasawara, S.; Okada, N.; Sato, C.; Tobiume, M.; Otsuka, K.; Miyamoto, L.; et al. Antitumor effect of novel anti-podoplanin antibody NZ-12 against malignant pleural mesothelioma in an orthotopic xenograft model. Cancer Sci 2016, 107, 1198–1205. [Google Scholar] [CrossRef] [PubMed]
- Kaneko, M.K.; Abe, S.; Ogasawara, S.; Fujii, Y.; Yamada, S.; Murata, T.; Uchida, H.; Tahara, H.; Nishioka, Y.; Kato, Y. Chimeric Anti-Human Podoplanin Antibody NZ-12 of Lambda Light Chain Exerts Higher Antibody-Dependent Cellular Cytotoxicity and Complement-Dependent Cytotoxicity Compared with NZ-8 of Kappa Light Chain. Monoclon Antib Immunodiagn Immunother 2017, 36, 25–29. [Google Scholar] [CrossRef]
- Ito, A.; Ohta, M.; Kato, Y.; Inada, S.; Kato, T.; Nakata, S.; Yatabe, Y.; Goto, M.; Kaneda, N.; Kurita, K.; et al. A Real-Time Near-Infrared Fluorescence Imaging Method for the Detection of Oral Cancers in Mice Using an Indocyanine Green-Labeled Podoplanin Antibody. Technol Cancer Res Treat 2018, 17, 1533033818767936. [Google Scholar] [CrossRef] [PubMed]
- Tamura, R.; Oi, R.; Akashi, S.; Kaneko, M.K.; Kato, Y.; Nogi, T. Application of the NZ-1 Fab as a crystallization chaperone for PA tag-inserted target proteins. Protein Sci 2019, 28, 823–836. [Google Scholar] [CrossRef]
- Shiina, S.; Ohno, M.; Ohka, F.; Kuramitsu, S.; Yamamichi, A.; Kato, A.; Motomura, K.; Tanahashi, K.; Yamamoto, T.; Watanabe, R.; et al. CAR T Cells Targeting Podoplanin Reduce Orthotopic Glioblastomas in Mouse Brains. Cancer Immunol Res 2016, 4, 259–268. [Google Scholar] [CrossRef]
- Kuwata, T.; Yoneda, K.; Mori, M.; Kanayama, M.; Kuroda, K.; Kaneko, M.K.; Kato, Y.; Tanaka, F. Detection of Circulating Tumor Cells (CTCs) in Malignant Pleural Mesothelioma (MPM) with the "Universal" CTC-Chip and An Anti-Podoplanin Antibody NZ-1.2. Cells 2020, 9. [Google Scholar] [CrossRef] [PubMed]
- Nishinaga, Y.; Sato, K.; Yasui, H.; Taki, S.; Takahashi, K.; Shimizu, M.; Endo, R.; Koike, C.; Kuramoto, N.; Nakamura, S.; et al. Targeted Phototherapy for Malignant Pleural Mesothelioma: Near-Infrared Photoimmunotherapy Targeting Podoplanin. Cells 2020, 9. [Google Scholar] [CrossRef] [PubMed]
- Fujii, Y.; Kaneko, M.; Neyazaki, M.; Nogi, T.; Kato, Y.; Takagi, J. PA tag: a versatile protein tagging system using a super high affinity antibody against a dodecapeptide derived from human podoplanin. Protein Expr Purif 2014, 95, 240–247. [Google Scholar] [CrossRef]
- Kato, Y.; Kaneko, M.K.; Kunita, A.; Ito, H.; Kameyama, A.; Ogasawara, S.; Matsuura, N.; Hasegawa, Y.; Suzuki-Inoue, K.; Inoue, O.; et al. Molecular analysis of the pathophysiological binding of the platelet aggregation-inducing factor podoplanin to the C-type lectin-like receptor CLEC-2. Cancer Sci 2008, 99, 54–61. [Google Scholar] [CrossRef]
- Kato, Y.; Vaidyanathan, G.; Kaneko, M.K.; Mishima, K.; Srivastava, N.; Chandramohan, V.; Pegram, C.; Keir, S.T.; Kuan, C.T.; Bigner, D.D.; et al. Evaluation of anti-podoplanin rat monoclonal antibody NZ-1 for targeting malignant gliomas. Nucl Med Biol 2010, 37, 785–794. [Google Scholar] [CrossRef] [PubMed]
- Suzuki, H.; Ohishi, T.; Asano, T.; Tanaka, T.; Saito, M.; Mizuno, T.; Yoshikawa, T.; Kawada, M.; Kaneko, M.K.; Kato, Y. Defucosylated mouse-dog chimeric anti-HER2 monoclonal antibody exerts antitumor activities in mouse xenograft models of canine tumors. Oncol Rep 2022, 48. [Google Scholar] [CrossRef]
- Kato, Y. Specific monoclonal antibodies against IDH1/2 mutations as diagnostic tools for gliomas. Brain Tumor Pathol 2015, 32, 3–11. [Google Scholar] [CrossRef] [PubMed]
- Ikota, H.; Nobusawa, S.; Arai, H.; Kato, Y.; Ishizawa, K.; Hirose, T.; Yokoo, H. Evaluation of IDH1 status in diffusely infiltrating gliomas by immunohistochemistry using anti-mutant and wild type IDH1 antibodies. Brain Tumor Pathol 2015, 32, 237–244. [Google Scholar] [CrossRef] [PubMed]
- Kato, Y.; Ohishi, T.; Yamada, S.; Itai, S.; Takei, J.; Sano, M.; Nakamura, T.; Harada, H.; Kawada, M.; Kaneko, M.K. Anti-Human Epidermal Growth Factor Receptor 2 Monoclonal Antibody H2Mab-41 Exerts Antitumor Activity in a Mouse Xenograft Model of Colon Cancer. Monoclon Antib Immunodiagn Immunother 2019, 38, 157–161. [Google Scholar] [CrossRef] [PubMed]
- Li, G.; Ohishi, T.; Kaneko, M.K.; Takei, J.; Mizuno, T.; Kawada, M.; Saito, M.; Suzuki, H.; Kato, Y. Defucosylated Mouse-Dog Chimeric Anti-EGFR Antibody Exerts Antitumor Activities in Mouse Xenograft Models of Canine Tumors. Cells 2021, 10. [Google Scholar] [CrossRef]
- Takei, J.; Kaneko, M.K.; Ohishi, T.; Kawada, M.; Harada, H.; Kato, Y. H2Mab-19, an anti-human epidermal growth factor receptor 2 monoclonal antibody exerts antitumor activity in mouse oral cancer xenografts. Exp Ther Med 2020, 20, 846–853. [Google Scholar] [CrossRef]
- Takei, J.; Ohishi, T.; Kaneko, M.K.; Harada, H.; Kawada, M.; Kato, Y. A defucosylated anti-PD-L1 monoclonal antibody 13-mG2a-f exerts antitumor effects in mouse xenograft models of oral squamous cell carcinoma. Biochem Biophys Rep 2020, 24, 100801. [Google Scholar] [CrossRef] [PubMed]
- Tateyama, N.; Asano, T.; Ohishi, T.; Takei, J.; Hosono, H.; Nanamiya, R.; Tanaka, T.; Sano, M.; Saito, M.; Kawada, M.; et al. An Anti-HER2 Monoclonal Antibody H2Mab-41 Exerts Antitumor Activities in Mouse Xenograft Model Using Dog HER2-Overexpressed Cells. Monoclon Antib Immunodiagn Immunother 2021, 40, 184–190. [Google Scholar] [CrossRef] [PubMed]
- Tateyama, N.; Nanamiya, R.; Ohishi, T.; Takei, J.; Nakamura, T.; Yanaka, M.; Hosono, H.; Saito, M.; Asano, T.; Tanaka, T.; et al. Defucosylated Anti-Epidermal Growth Factor Receptor Monoclonal Antibody 134-mG2a-f Exerts Antitumor Activities in Mouse Xenograft Models of Dog Epidermal Growth Factor Receptor-Overexpressed Cells. Monoclon Antib Immunodiagn Immunother 2021, 40, 177–183. [Google Scholar] [CrossRef]
- Cardoso, F.; Paluch-Shimon, S.; Senkus, E.; Curigliano, G.; Aapro, M.S.; André, F.; Barrios, C.H.; Bergh, J.; Bhattacharyya, G.S.; Biganzoli, L.; et al. 5th ESO-ESMO international consensus guidelines for advanced breast cancer (ABC 5). Ann Oncol 2020, 31, 1623–1649. [Google Scholar] [CrossRef]
- Hao, Y.; Yu, X.; Bai, Y.; McBride, H.J.; Huang, X. Cryo-EM Structure of HER2-trastuzumab-pertuzumab complex. PLoS One 2019, 14, e0216095. [Google Scholar] [CrossRef]
- Tateyama, N.; Suzuki, H.; Ohishi, T.; Asano, T.; Tanaka, T.; Mizuno, T.; Yoshikawa, T.; Kawada, M.; Kaneko, M.K.; Kato, Y. Antitumor Activity of an Anti-EGFR/HER2 Bispecific Antibody in a Mouse Xenograft Model of Canine Osteosarcoma. Pharmaceutics 2022, 14. [Google Scholar] [CrossRef]
- Greulich, H.; Kaplan, B.; Mertins, P.; Chen, T.H.; Tanaka, K.E.; Yun, C.H.; Zhang, X.; Lee, S.H.; Cho, J.; Ambrogio, L.; et al. Functional analysis of receptor tyrosine kinase mutations in lung cancer identifies oncogenic extracellular domain mutations of ERBB2. Proc Natl Acad Sci U S A 2012, 109, 14476–14481. [Google Scholar] [CrossRef]
- Takegawa, N.; Nonagase, Y.; Yonesaka, K.; Sakai, K.; Maenishi, O.; Ogitani, Y.; Tamura, T.; Nishio, K.; Nakagawa, K.; Tsurutani, J. DS-8201a, a new HER2-targeting antibody-drug conjugate incorporating a novel DNA topoisomerase I inhibitor, overcomes HER2-positive gastric cancer T-DM1 resistance. Int J Cancer 2017, 141, 1682–1689. [Google Scholar] [CrossRef]
- Modi, S.; Saura, C.; Yamashita, T.; Park, Y.H.; Kim, S.B.; Tamura, K.; Andre, F.; Iwata, H.; Ito, Y.; Tsurutani, J.; et al. Trastuzumab Deruxtecan in Previously Treated HER2-Positive Breast Cancer. N Engl J Med 2020, 382, 610–621. [Google Scholar] [CrossRef]
- Li, B.T.; Smit, E.F.; Goto, Y.; Nakagawa, K.; Udagawa, H.; Mazières, J.; Nagasaka, M.; Bazhenova, L.; Saltos, A.N.; Felip, E.; et al. Trastuzumab Deruxtecan in HER2-Mutant Non-Small-Cell Lung Cancer. N Engl J Med 2021. [Google Scholar] [CrossRef]
- Modi, S.; Saura, C.; Yamashita, T.; Park, Y.H.; Kim, S.B.; Tamura, K.; Andre, F.; Iwata, H.; Ito, Y.; Tsurutani, J.; et al. Trastuzumab Deruxtecan in Previously Treated HER2-Positive Breast Cancer. N Engl J Med 2020, 382, 610–621. [Google Scholar] [CrossRef] [PubMed]
- Shitara, K.; Bang, Y.J.; Iwasa, S.; Sugimoto, N.; Ryu, M.H.; Sakai, D.; Chung, H.C.; Kawakami, H.; Yabusaki, H.; Lee, J.; et al. Trastuzumab Deruxtecan in Previously Treated HER2-Positive Gastric Cancer. N Engl J Med 2020, 382, 2419–2430. [Google Scholar] [CrossRef] [PubMed]
- Li, B.T.; Smit, E.F.; Goto, Y.; Nakagawa, K.; Udagawa, H.; Mazières, J.; Nagasaka, M.; Bazhenova, L.; Saltos, A.N.; Felip, E.; et al. Trastuzumab Deruxtecan in HER2-Mutant Non-Small-Cell Lung Cancer. N Engl J Med 2022, 386, 241–251. [Google Scholar] [CrossRef] [PubMed]
- Modi, S.; Jacot, W.; Yamashita, T.; Sohn, J.; Vidal, M.; Tokunaga, E.; Tsurutani, J.; Ueno, N.T.; Prat, A.; Chae, Y.S.; et al. Trastuzumab Deruxtecan in Previously Treated HER2-Low Advanced Breast Cancer. N Engl J Med 2022, 387, 9–20. [Google Scholar] [CrossRef] [PubMed]
- Mercogliano, M.F.; Bruni, S.; Mauro, F.L.; Schillaci, R. Emerging Targeted Therapies for HER2-Positive Breast Cancer. Cancers (Basel) 2023, 15. [Google Scholar] [CrossRef]
- Popović, M.; Silovski, T.; Križić, M.; Dedić Plavetić, N. HER2 Low Breast Cancer: A New Subtype or a Trojan for Cytotoxic Drug Delivery? Int J Mol Sci 2023, 24. [Google Scholar] [CrossRef]
- Corti, C.; Giugliano, F.; Nicolò, E.; Tarantino, P.; Criscitiello, C.; Curigliano, G. HER2-Low Breast Cancer: a New Subtype? Curr Treat Options Oncol 2023, 24, 468–478. [Google Scholar] [CrossRef] [PubMed]
- Shinkawa, T.; Nakamura, K.; Yamane, N.; Shoji-Hosaka, E.; Kanda, Y.; Sakurada, M.; Uchida, K.; Anazawa, H.; Satoh, M.; Yamasaki, M.; et al. The absence of fucose but not the presence of galactose or bisecting N-acetylglucosamine of human IgG1 complex-type oligosaccharides shows the critical role of enhancing antibody-dependent cellular cytotoxicity. J Biol Chem 2003, 278, 3466–3473. [Google Scholar] [CrossRef] [PubMed]
- Antoniu, S.A. Mogamulizumab, a humanized mAb against C-C chemokine receptor 4 for the potential treatment of T-cell lymphomas and asthma. Curr Opin Mol Ther 2010, 12, 770–779. [Google Scholar]
- Kato, Y.; Kaneko, M.K. A cancer-specific monoclonal antibody recognizes the aberrantly glycosylated podoplanin. Sci Rep 2014, 4, 5924. [Google Scholar] [CrossRef]
- Kaneko, M.K.; Nakamura, T.; Kunita, A.; Fukayama, M.; Abe, S.; Nishioka, Y.; Yamada, S.; Yanaka, M.; Saidoh, N.; Yoshida, K.; et al. ChLpMab-23: Cancer-Specific Human-Mouse Chimeric Anti-Podoplanin Antibody Exhibits Antitumor Activity via Antibody-Dependent Cellular Cytotoxicity. Monoclon Antib Immunodiagn Immunother 2017, 36, 104–112. [Google Scholar] [CrossRef]
- Kaneko, M.K.; Yamada, S.; Nakamura, T.; Abe, S.; Nishioka, Y.; Kunita, A.; Fukayama, M.; Fujii, Y.; Ogasawara, S.; Kato, Y. Antitumor activity of chLpMab-2, a human-mouse chimeric cancer-specific antihuman podoplanin antibody, via antibody-dependent cellular cytotoxicity. Cancer Med 2017, 6, 768–777. [Google Scholar] [CrossRef] [PubMed]
- Kaneko, M.K.; Ohishi, T.; Kawada, M.; Kato, Y. A cancer-specific anti-podocalyxin monoclonal antibody (60-mG(2a)-f) exerts antitumor effects in mouse xenograft models of pancreatic carcinoma. Biochem Biophys Rep 2020, 24, 100826. [Google Scholar] [CrossRef]
- Suzuki, H.; Kaneko, M.K.; Kato, Y. Roles of Podoplanin in Malignant Progression of Tumor. Cells 2022, 11. [Google Scholar] [CrossRef]
- Ishikawa, A.; Waseda, M.; Ishii, T.; Kaneko, M.K.; Kato, Y.; Kaneko, S. Improved anti-solid tumor response by humanized anti-podoplanin chimeric antigen receptor transduced human cytotoxic T cells in an animal model. Genes Cells 2022, in press. [Google Scholar] [CrossRef]
- Chalise, L.; Kato, A.; Ohno, M.; Maeda, S.; Yamamichi, A.; Kuramitsu, S.; Shiina, S.; Takahashi, H.; Ozone, S.; Yamaguchi, J.; et al. Efficacy of cancer-specific anti-podoplanin CAR-T cells and oncolytic herpes virus G47Δ combination therapy against glioblastoma. Molecular Therapy - Oncolytics 2022, 26, 265–274. [Google Scholar] [CrossRef] [PubMed]


Disclaimer/Publisher’s Note: The statements, opinions and data contained in all publications are solely those of the individual author(s) and contributor(s) and not of MDPI and/or the editor(s). MDPI and/or the editor(s) disclaim responsibility for any injury to people or property resulting from any ideas, methods, instructions or products referred to in the content. |
© 2023 by the authors. Licensee MDPI, Basel, Switzerland. This article is an open access article distributed under the terms and conditions of the Creative Commons Attribution (CC BY) license (https://creativecommons.org/licenses/by/4.0/).


