1. Introduction
Electric railway systems (ERS) are one of the most efficient transportation modes and play a pivotal role in facilitating the growth of the global economy, as well as achieving environmental, social, and governance (ESG) goals [1–3]. ERS also mitigate traffic congestion, thereby avoiding greenhouse gas emissions from road vehicles [4,5].
Unlike conventional diesel locomotives, ERS offers regenerative braking energy (RBE) recovery, which improves the efficiency of the system [6]. RBE is attained through the conversion of kinetic energy to electric energy during train braking, known as dynamic braking [7]. Urban rail systems typically recover more significant amount of RBE compared to long-distance AC rail systems, as urban trains have a higher frequency of start-stop cycles [8]. In the past, regenerated electrical energy from braking trains was dissipated as heat through dumping resistors, resulting in energy waste and substation temperature rise issues [9,10]. However, advancements in inverters and energy storage technologies have addressed these challenges, making RBE utilization more viable and cost-effective [9,11–14]. In a study by authors [15], methods for RBE utilization in ERS were overviewed considering economic and technical aspects based on the line conditions, environment, power supply, vehicle types, operating methods, and other economic factors.
By employing the reversible substations, RBE can be recuperated and fed back to the AC power grid using inverters [16–18]. Researchers in [19] illustrated different scenarios for one or two trains traveling between two stations. The results showed that the reversible substation can achieve up to 81.4% of energy recovery through the operation of two trains. Another study [20] evaluated the amount of RBE recovered in the Madrid metro railway system, revealing that 20% of traction energy can be recovered through the reversible substation during train braking. In [21], a proposed DC railway system demonstrated a reduction in train energy consumption of 10% to 40% using a reversible substation compared to a non-reversible substation.
Without a reversible substation, an ERS may experience overvoltage issues, as the voltage level of the AC grid exceeds the statutory limits during regenerative braking energy recovery. To mitigate this, automatic receptivity units (ARU) are used to dissipate the RBE and prevent overvoltage. Recently, optimization of train schedules using artificial intelligence (AI) techniques such as genetic algorithm [22–24], particle swarm optimization [25], heuristic algorithm [26,27], and brute force algorithm [28] have partially resolved this issue. By synchronizing the acceleration and deceleration of neighboring trains using these techniques, the RBE of the decelerating train can be picked up by the accelerating train, thus preventing overvoltage issues [29–31].
Additionally, energy storage systems (ESS) are widely employed to mitigate overvoltage issues by storing RBE from decelerating trains for later use. ESS can be installed onboard or at the wayside. Onboard ESS allows trains to temporarily store RBE and utilize it for the next acceleration stage or onboard facilities such as air conditioning systems, lighting systems, etc. Wayside ESS stores RBE from decelerating trains and delivers it during the acceleration of other trains [32–34].
There are 3 key aspects that can influence the amount of RBE recuperation [7]. The first aspect is the design of the rolling stocks. Different rolling stocks have different traction efforts, braking efforts, lengths, and masses. The second aspect is the operating environment, including ground inclination, track elevation, track curvature, operating speed, weather conditions, and atmospheric pressure. The third aspect is the train operations, encompassing aspects such as headway time, driving processes, and the start-stop cycles. The RBE is influenced by catenary resistances and train motor efficiency. It is found that the catenary resistances have more impact on energy consumption as compared to engine efficiency, based on real data from the Madrid-Barcelona line and Madrid-Sevilla line [35]. The study developed a method for optimizing Automatic Train Operation (ATO) speed profiles to minimize the energy consumption of the trains. The investigation modelled the underground metro line in Madrid assess the amount of RBE recovery under various speed profiles [36]. Factors such as inclination angle, train frontal area, mass, and electric drives efficiency were investigated in [37] to understand their influence on RBE recovery. In [38], the study presented the application of RBE for train operation and identified parameters that affect RBE recovery in ERS. The investigation used RAILSIM software to model the Aksarau-Airport LRT line, covering a distance of 19 km with 17 stations, to examine the impacts of operation frequency rate, train weight, and train acceleration rate on RBE recuperation. Asegid et al. investigated influential factors and the potential amount of RBE in Addis Ababa LRT using Matlab/Simulink software [39]. The study analyzed train dynamics, power electronic efficiency, ground inclination, and train timeline. The results indicated that certain scenarios could achieve up to 32% energy savings through regenerative braking energy recovery.
The previous studies in the literature [35–39] only considered the factors individually on the recuperation rate of braking energy. In this study, a holistic perspective by examining the combined influence of variables such as speed limits, track elevations, track curvature, and headway time. By integrating these factors together can provide valuable insights into RBE recuperation and energy consumption in DC electric railway system. This integrated approach contributes to a more comprehensive and nuanced understanding of the recuperation rate and energy consumption under different environments, thus advancing the current body of knowledge in the field. A third rail system based on the Mass Rapid Transit Line 2 (MRT Line 2) system is modeled using ETAP-eTraX software. The organization of this paper is as follows:
Section 2 describes the modelling of the railway system based on the practical parameters of MRT Line 2. In section 3, the train dynamic load flow is explained.
Section 4 discusses the simulation results obtained from various scenarios. Finally, section 5 presents the conclusion and future works.
2. Railway System Modeling
The MRT Line 2 also known as the Sungai Buloh-Serdang-Putrajaya (SSP) line, is developed in Malaysia to provide transportation services for around two million people stretching from Sungai Buloh to Putrajaya. The total length of the MRT Line 2 is 52.2 km of which 13.5 km is underground. There are a total of 37 stations along the MRT Line 2 where 24 stations are elevated, and 13 stations are in the underground.
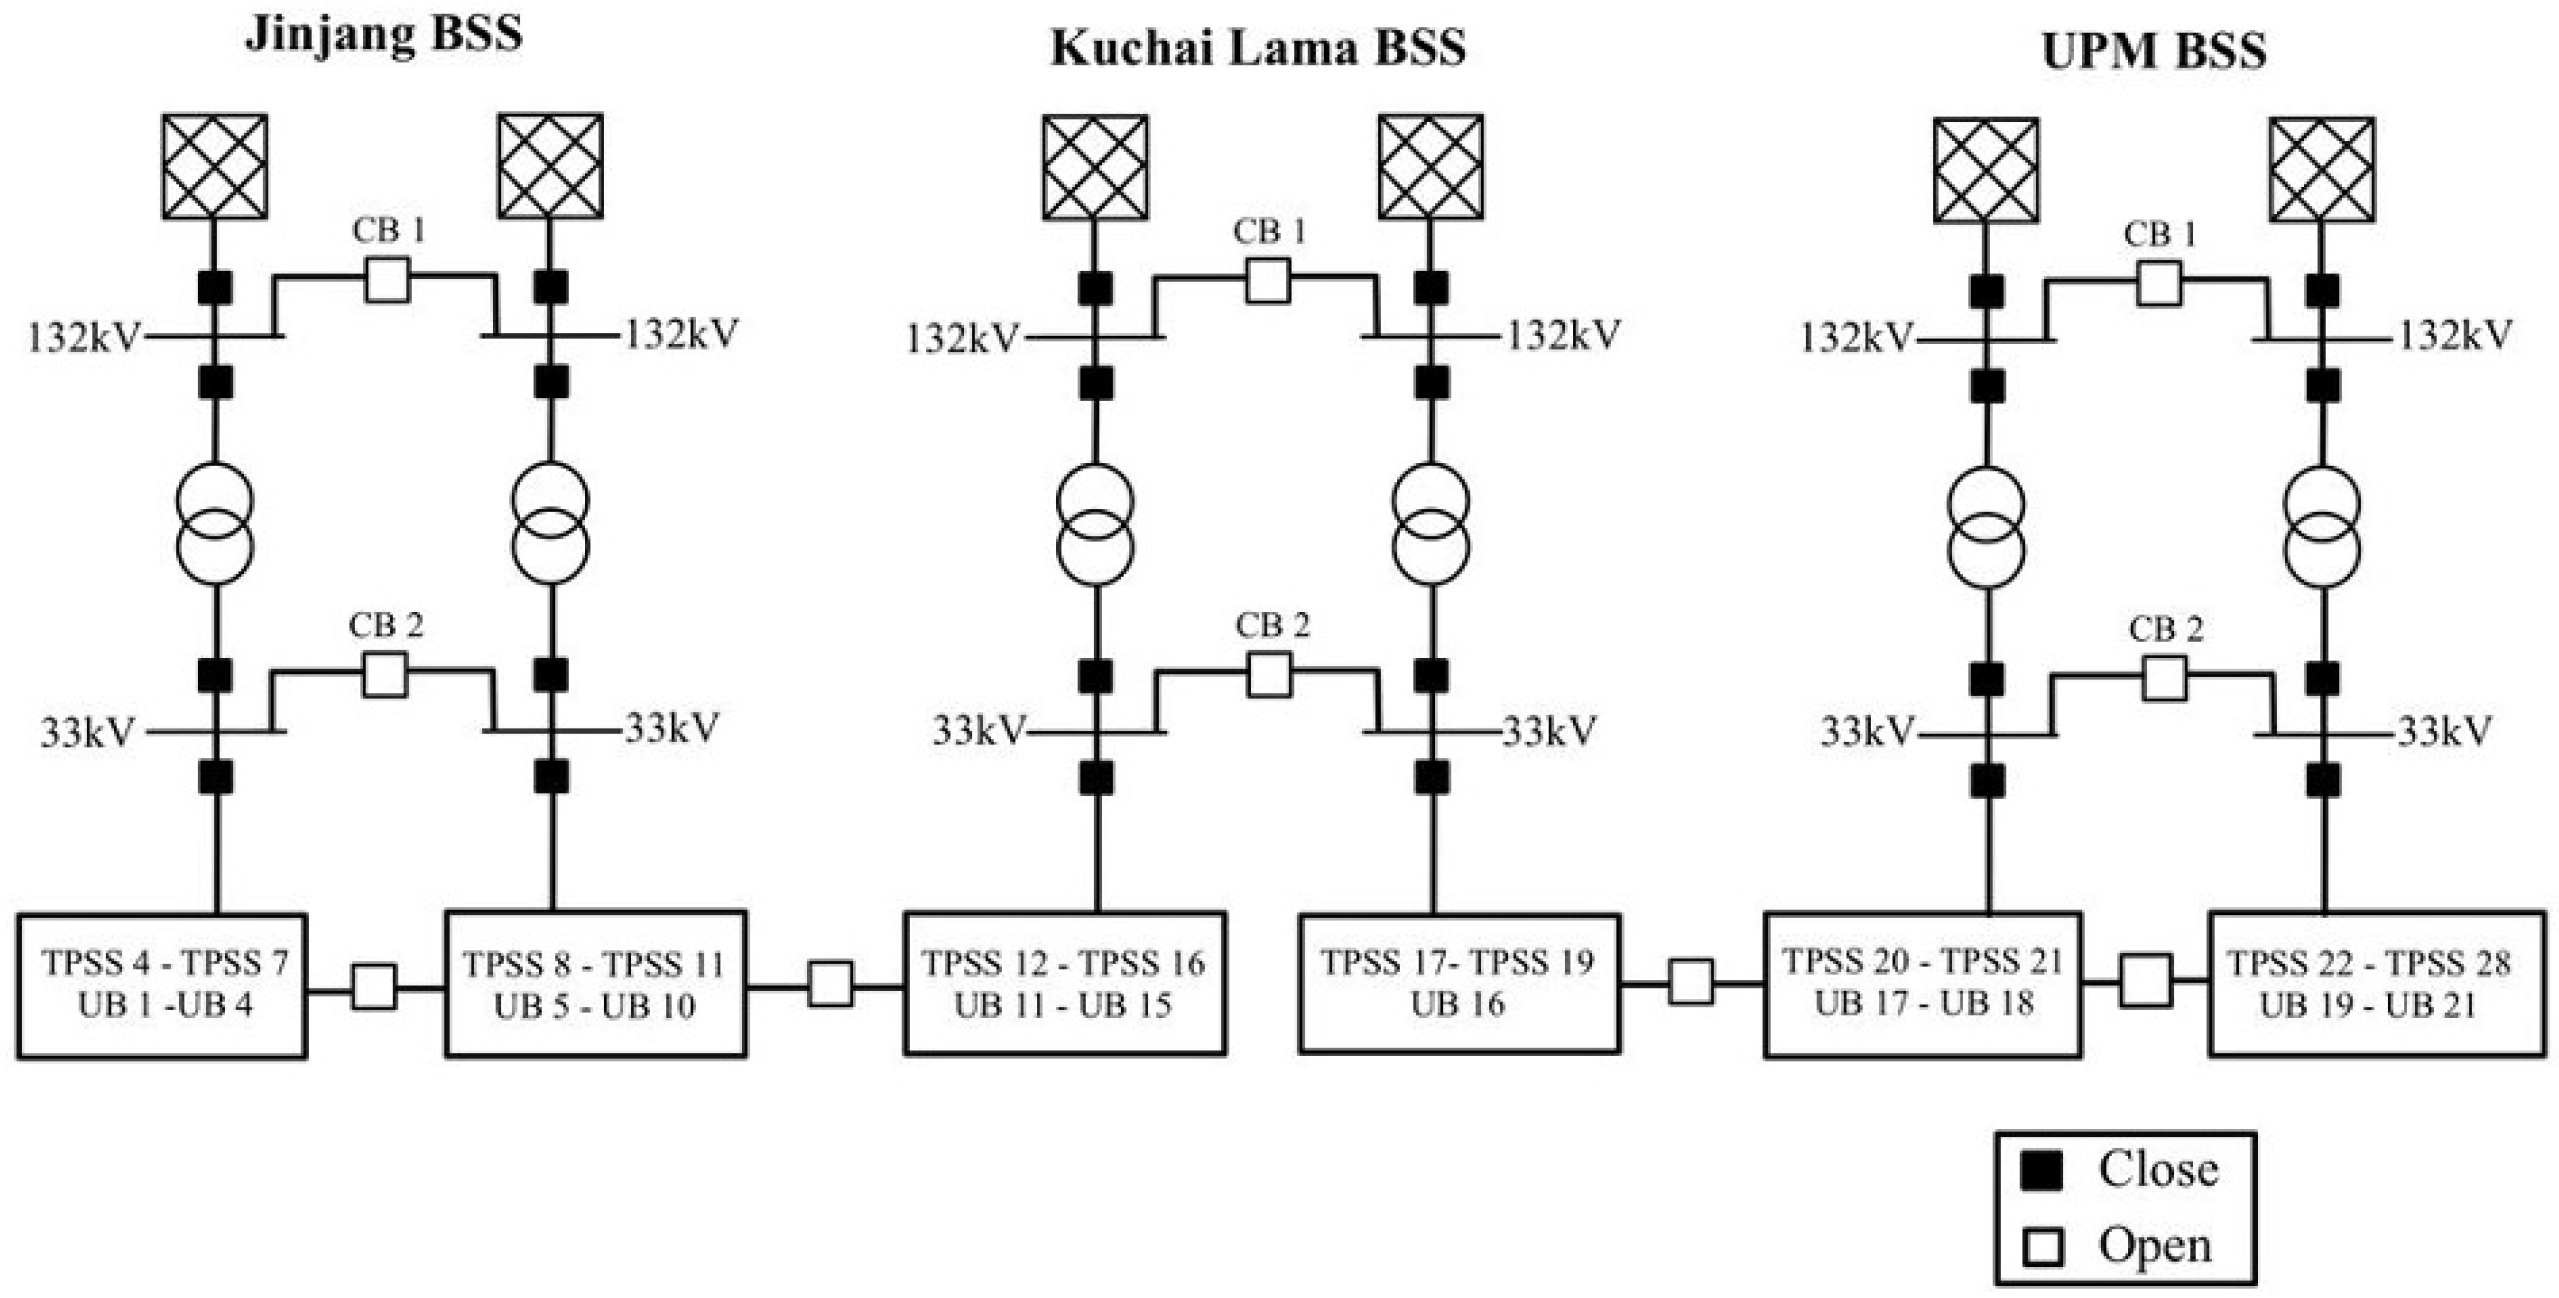
Figure 1 provides an overview of the railway electrification for MRT Line 2.
Figure 1.
Schematic diagram of BSSs, TPSSs, and utility buildings.
Figure 1.
Schematic diagram of BSSs, TPSSs, and utility buildings.
2.1. Bulk Supply Substation (BSS)
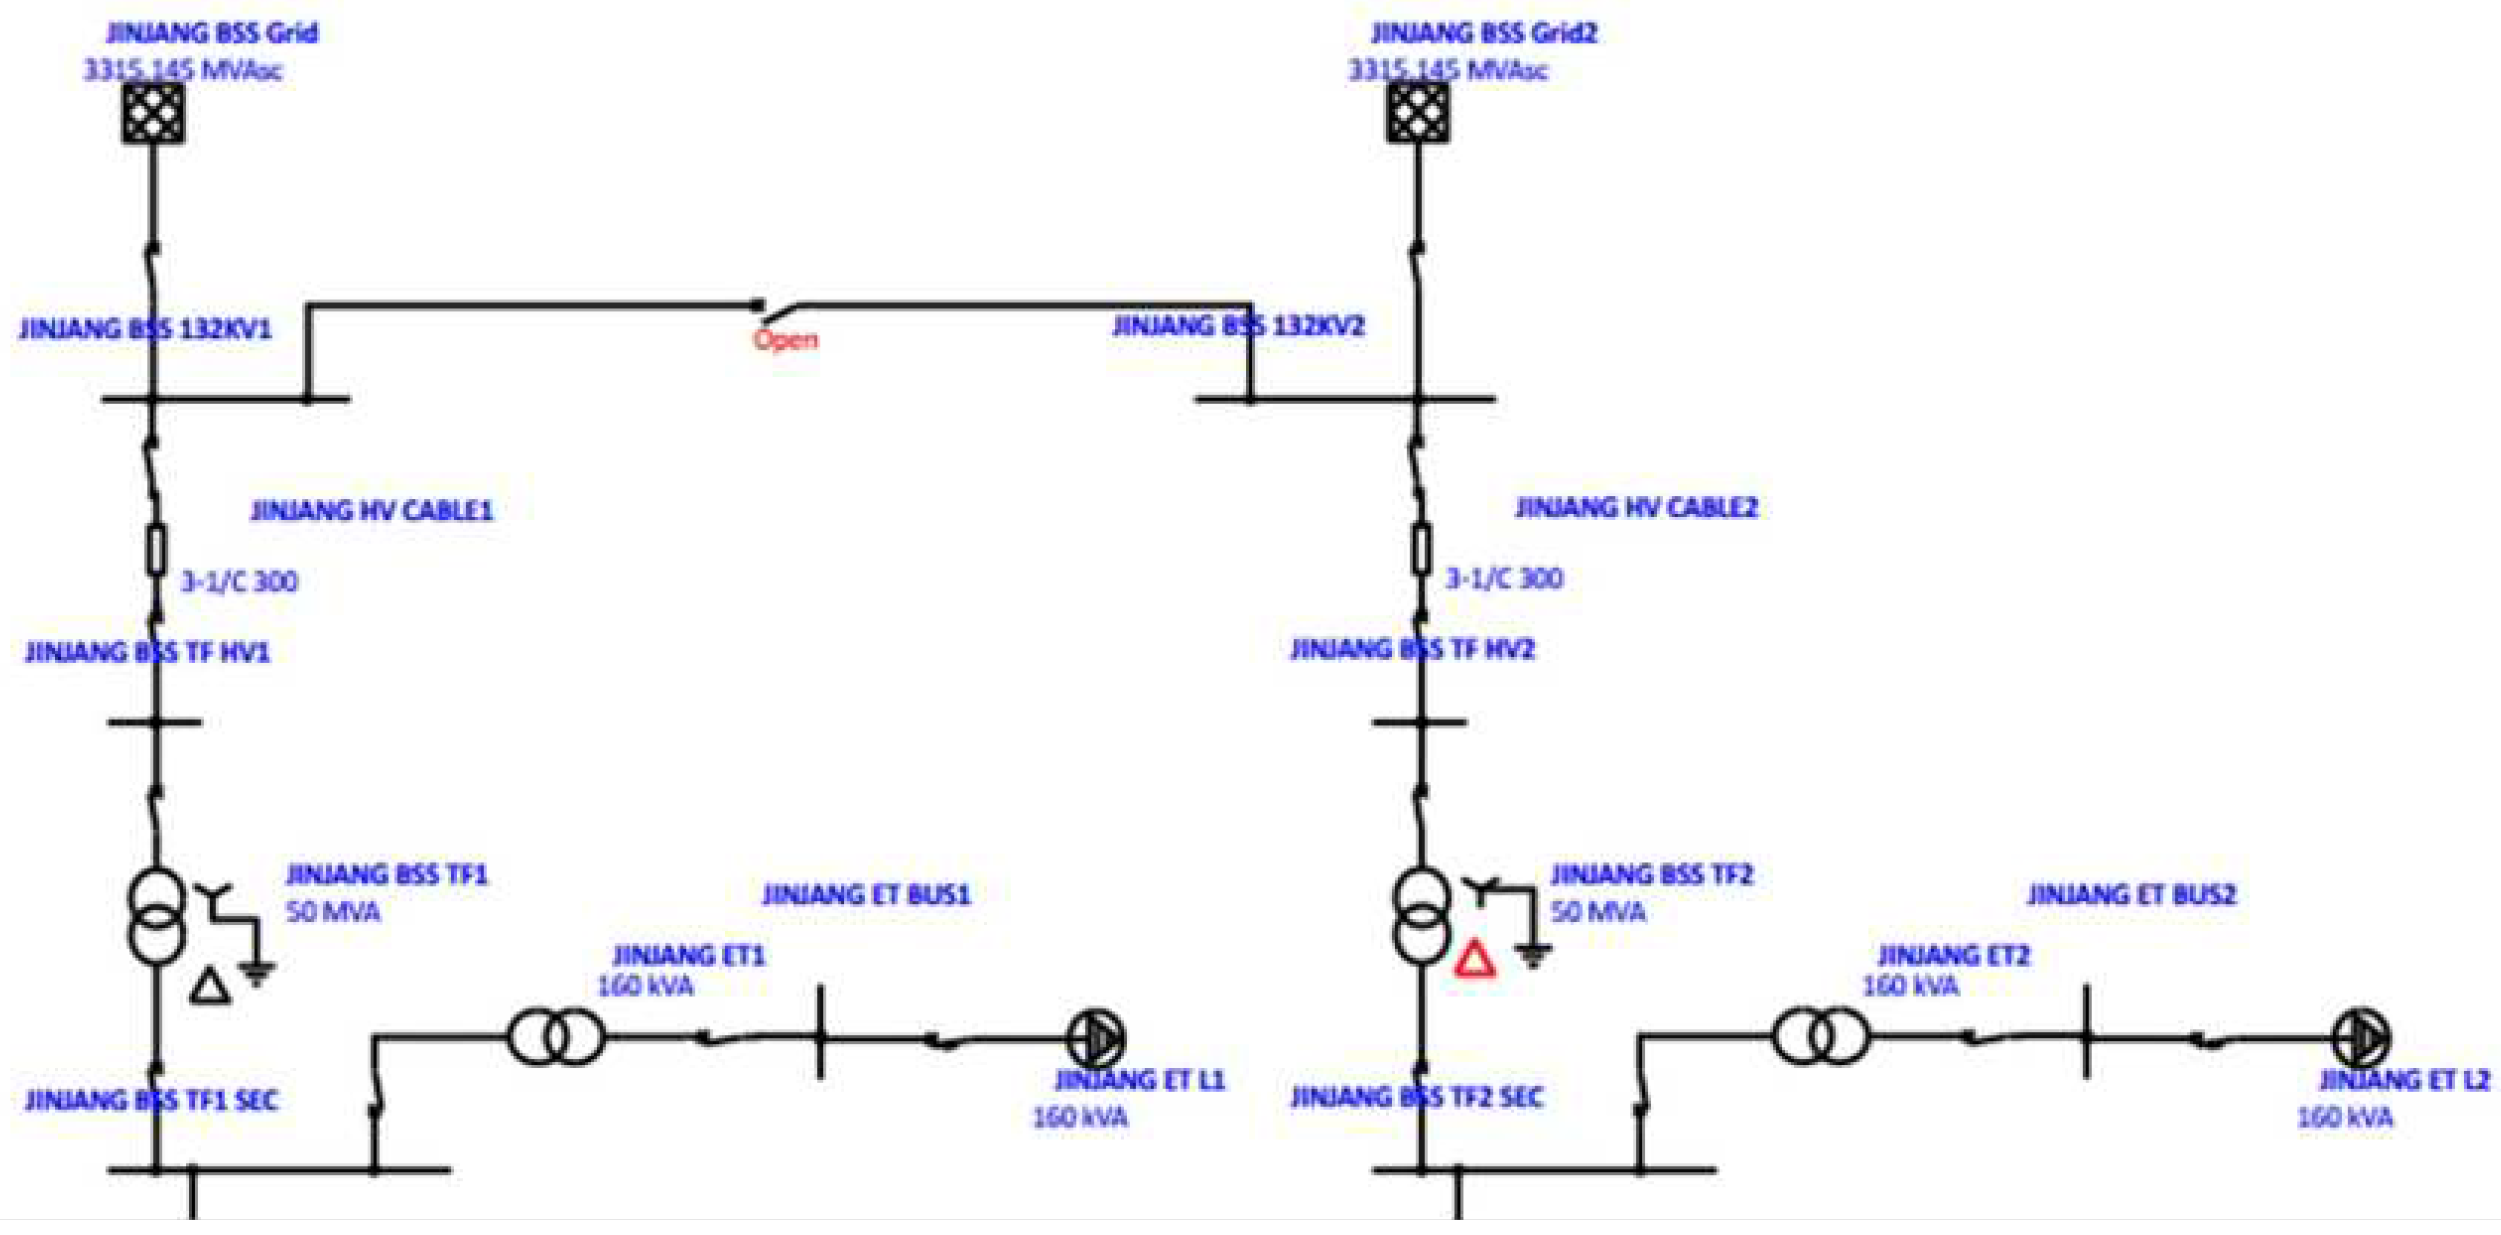
The electricity supply for the MRT Line 2 is provided by the utility through three bulk supply substations (BSS) located at Jinjang, Kuchai Lama, and Universiti Putra Malaysia (UPM). These BSSs are connected to the 132 kV power grid, and the supply voltage is stepped down to 33 kV through two 50 MVA transformers before being delivered to the traction power supply substation (TPSS).
Figure 2 presents one of the BSS feeders for the MRT Line 2. Tables 1 and 2 show the key parameters of the BSS transformers and earthing transformers. These parameters are included in the ETAP simulation model.
Figure 2.
Single line diagram of a BSS with transformers.
Figure 2.
Single line diagram of a BSS with transformers.
Table 1.
Parameters of BSS transformers.
Table 1.
Parameters of BSS transformers.
| Parameters |
BSS transformers |
| Jinjang and Kuchai Lama BSS |
UPM BSS |
| Power Rating (MVA) |
50 |
40 |
| Voltage level (kV) |
132/33 |
132/33 |
| Positive sequence impedance (%) |
12.5 |
12.5 |
| Zero sequence impedance (%) |
10 |
10 |
| X/R ratio |
45 |
45 |
| Impedance tolerance (%) |
±7.5 |
±7.5 |
| Tap range |
±10 |
±10 |
| Vector group |
YNd1 |
YNd1 |
Table 2.
Parameters of earthing transformers.
Table 2.
Parameters of earthing transformers.
| Parameters |
Earthing transformers (ET) |
| Jinjang and Kuchai Lama BSS |
UPM BSS |
| Power Rating (MVA) |
160 |
160 |
| Voltage level (kV) |
33/0.433 |
33/0.433 |
| Positive sequence impedance (%) |
4 |
4 |
| X/R ratio |
1.5 |
1.5 |
| Impedance tolerance (%) |
±10 |
±10 |
| Neutral grounding resistor (NER) (A) |
900 |
900 |
| Vector group |
ZNyn11 |
ZNyn11 |
2.2. Traction Power Supply Substation (TPSS)
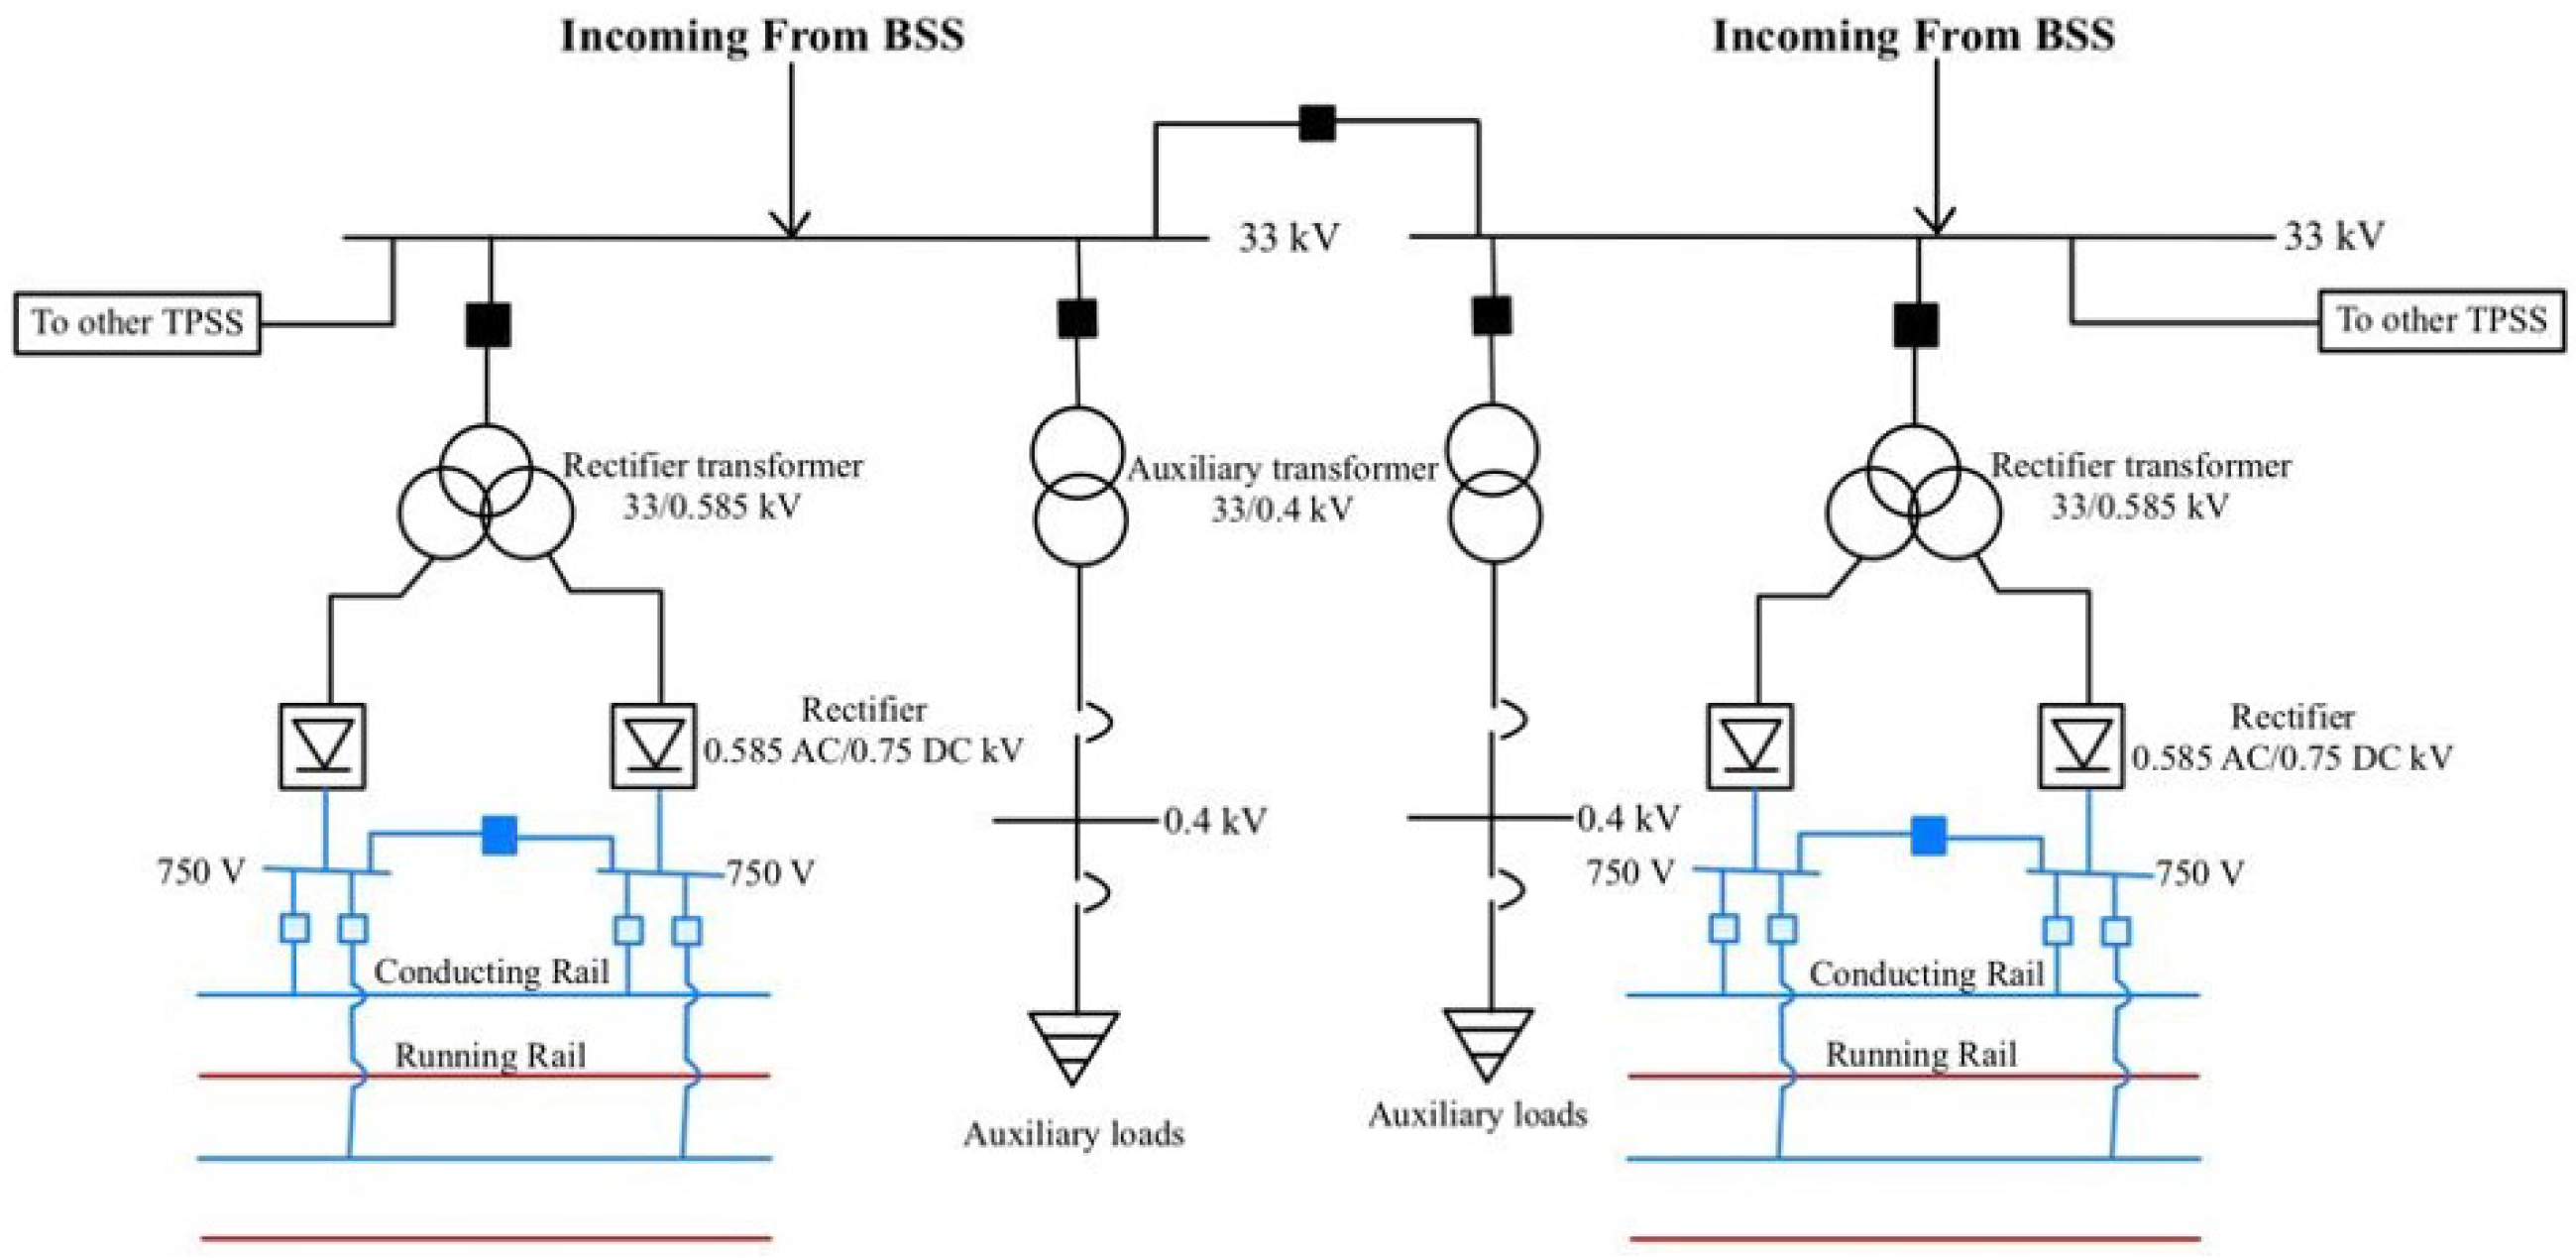
There are total of 25 TPSSs along the MRT Line 2, with six of them located in underground stations. Each TPSS consists of two rectifier transformers and two auxiliary transformers, as shown in
Figure 3. Tables 3 and 4 shows the setting of the auxiliary and rectifier transformers used in this study. The rectifier transformers step down the voltage from 33 kV to 0.585 kV and a 12-pulse model rectifier converts the 0.585 kV AC supply to a 750 V DC supply for the traction loads. On the other hand, the auxiliary transformers step down the power from 33 kV to 0.4 kV for the auxiliary loads such as air conditioning systems, lifts, escalators, and other systems that consume electricity within the railway stations. The TPSSs provide a 750 V DC supply to the rolling stocks via the third rail and the return current will flow back to the source via the rail tracks. The rolling stock parameters for the train are listed in Table 5.
Figure 3.
Schematic diagram of TPSS for MRT Line 2.
Figure 3.
Schematic diagram of TPSS for MRT Line 2.
Table 3.
Parameters of auxiliary transformers.
Table 3.
Parameters of auxiliary transformers.
| Parameters |
Auxiliary Transformer |
|
|
| Rating (MVA) |
0.16, 0.63 |
0.75, 0.8, 1, 1.25 |
1.5, 2 |
| Voltage level (kV) |
33/0.433 |
33/0.433 |
33/0.433 |
| Zero sequence impedance (%) |
80 |
80 |
80 |
| X/R ratio |
1.5 |
3.5 |
6 |
| Impedance tolerance (%) |
± 10 |
±10 |
±10 |
| Tap range (%) |
±7.5 |
±7.5 |
±7.5 |
| Vector group |
Dyn11 |
Dyn11 |
Dyn11 |
Table 4.
Parameters of rectifier transformers.
Table 4.
Parameters of rectifier transformers.
| Parameters |
2.3 MVA Rectifier Transformer |
3.5 MVA Rectifier Transformer |
| Rating (MVA) |
2.3/1.15/1.15 |
3.5/1.75/1.75 |
| Voltage level (kV) |
33/0.585/0.585 |
33/0.585/0.585 |
| Positive sequence impedance (+Z) (%) |
6 |
6 |
| Positive sequence impedance (+Z) (%) |
6 |
6 |
| Positive sequence impedance (+Z) (%) |
12 |
12 |
| Zero sequence impedance (+Z) (%) |
80 |
80 |
| Zero sequence impedance (+Z) (%) |
80 |
80 |
| Zero sequence impedance (+Z) (%) |
80 |
80 |
| X/R ratio |
10 |
10 |
| Impedance tolerance (%) |
±10 |
±10 |
| Tap range (%) |
±7.5 |
±7.5 |
| Vector group |
Dd0y11 |
Dd0y11 |
Table 5.
Rolling stock setting of MRT Line 2 train.
Table 5.
Rolling stock setting of MRT Line 2 train.
| Parameters |
Configurations |
| Train weight (ton) |
218 |
| Number of axles, n |
4 (M-T-T-M) |
| |
M: Motor car T: Trailer car |
| The total length of train (m) |
90 |
| Area of train (m) |
11.0408 |
| Rolling resistance |
0.019292685 + 0.000370932110091743v+ 6.8421x10
|
| Acceleration limit (m/s) |
1 |
| Deceleration limit (m/s) |
1.1 |
| Minimum voltage (V) |
500 |
| Maximum voltage (V) |
900 |
| Minimum speed for regeneration (km/h) |
3 |
2.3. Case studies
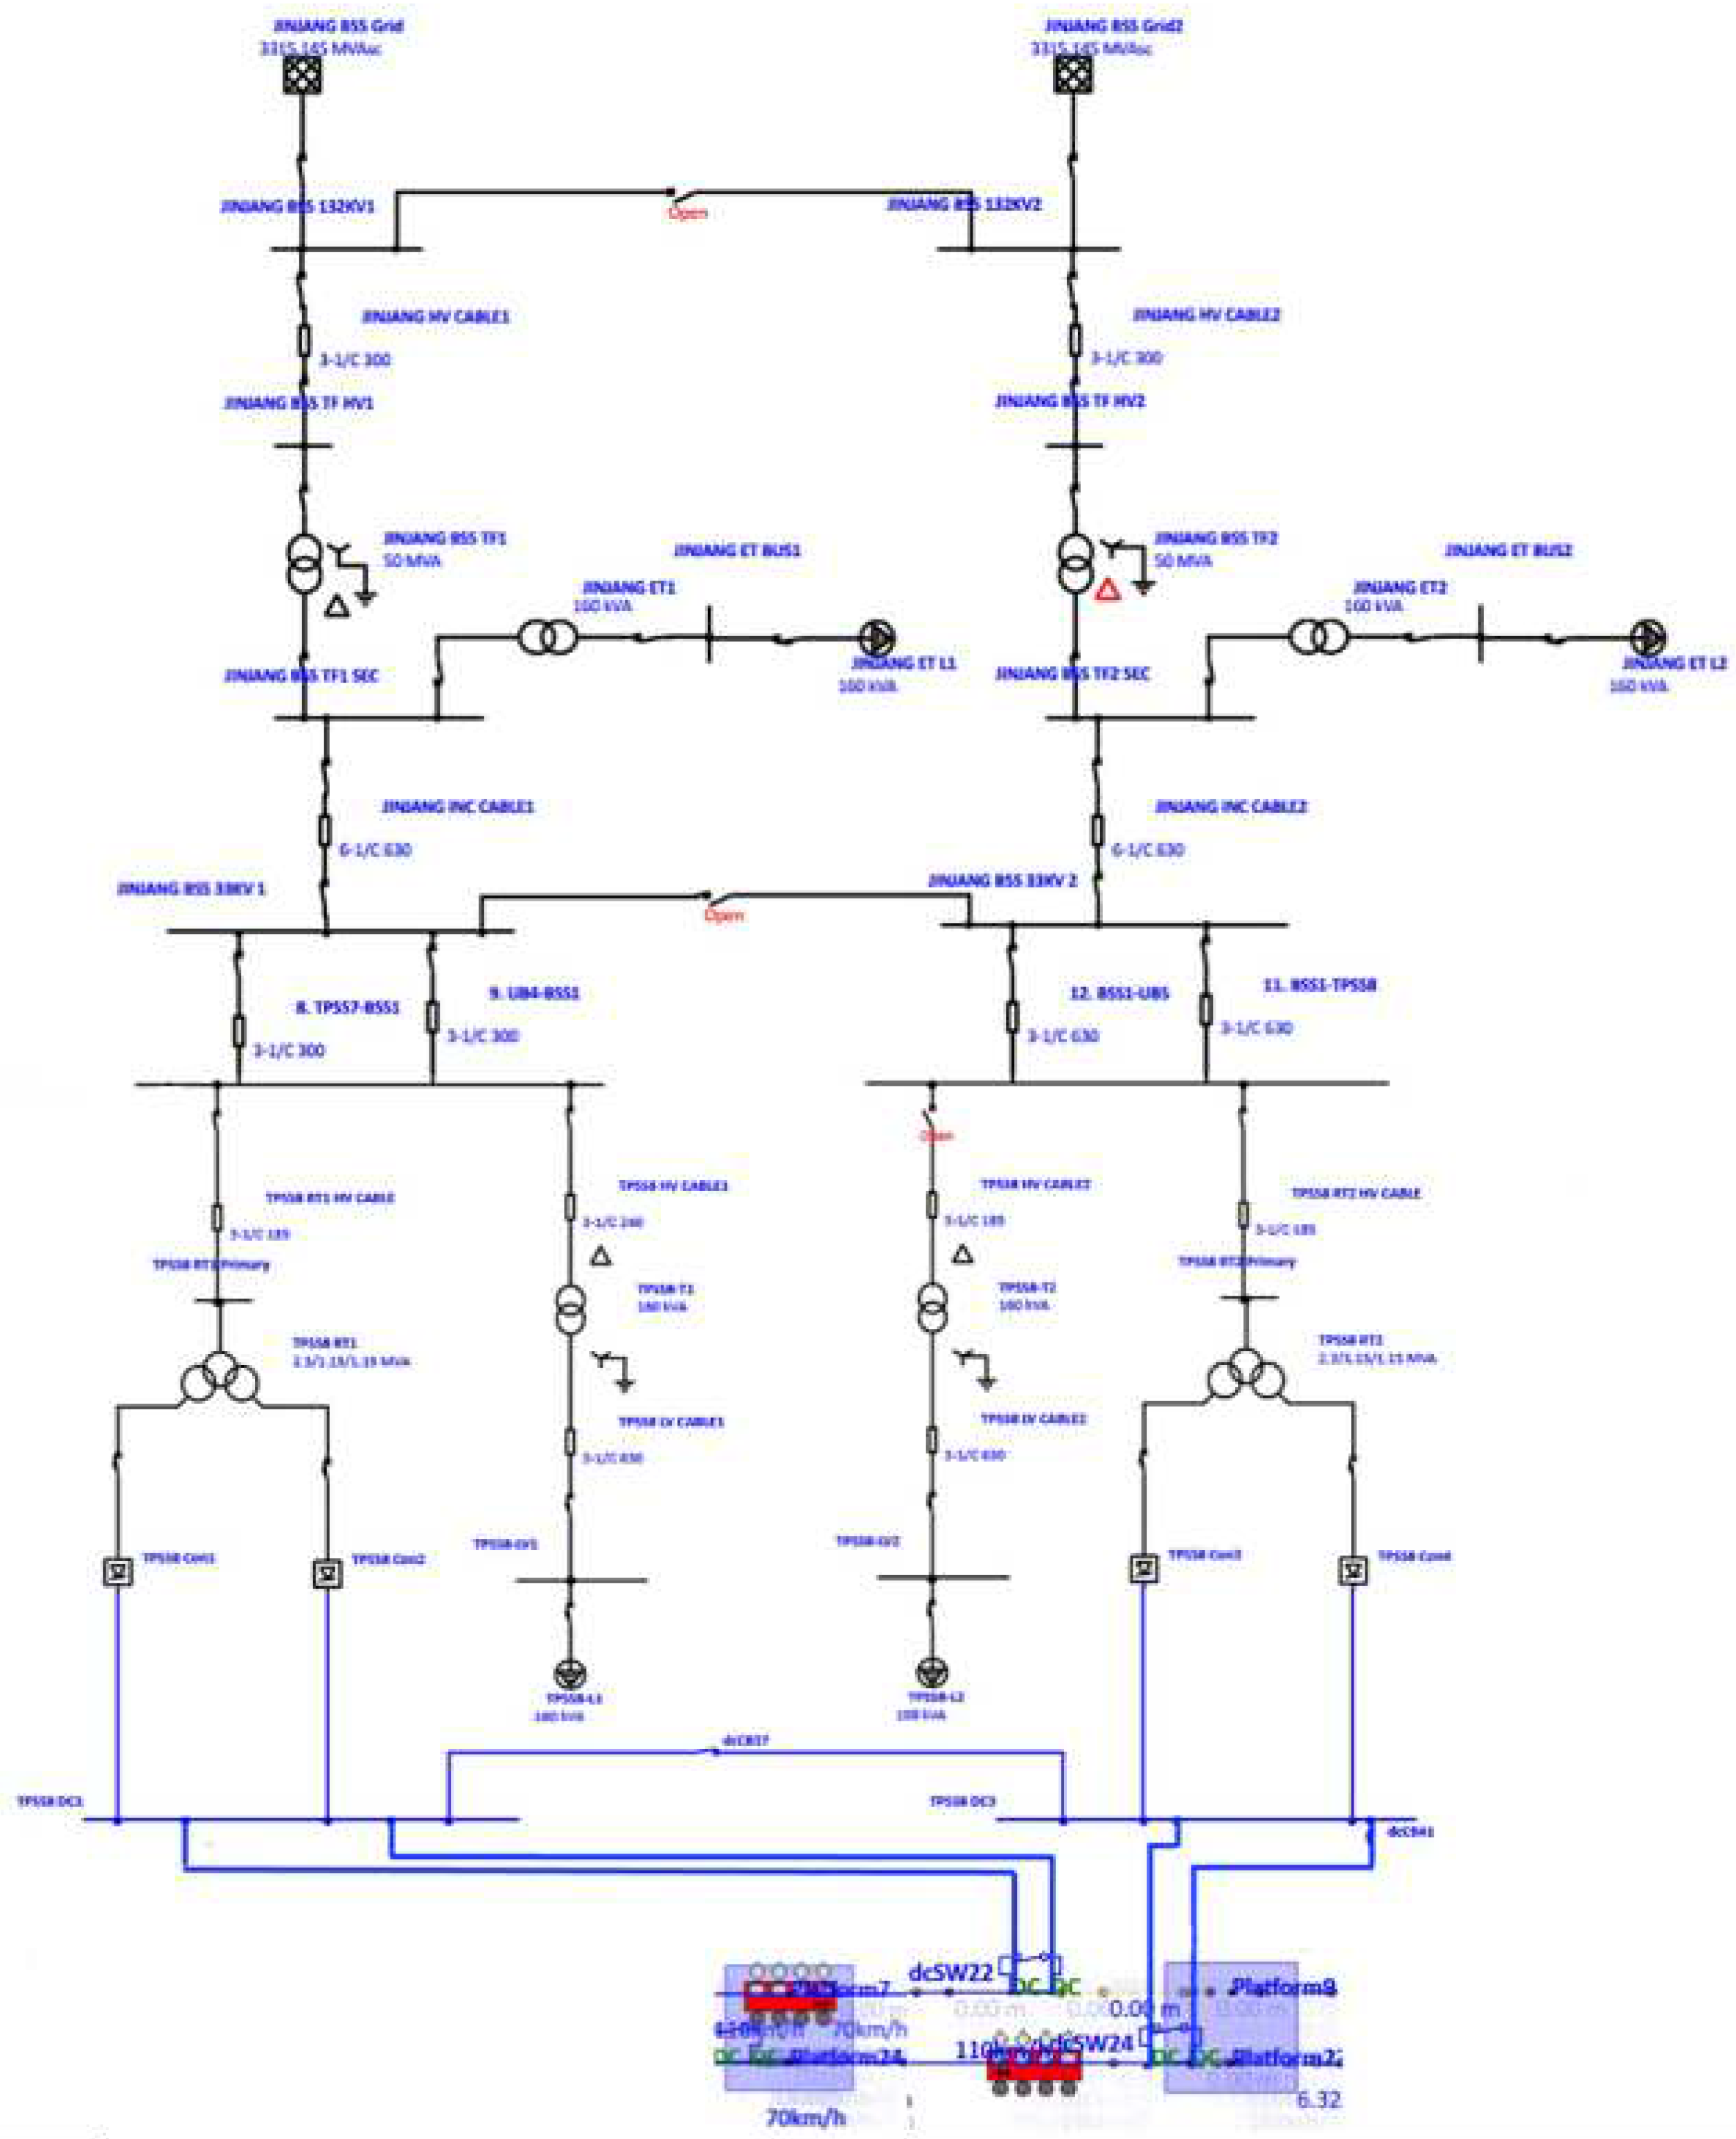
This study investigates the impact of rolling resistance, track elevation, and track curvature on the energy consumption and braking energy recovery of trains traveling between two stations, labeled as Station NB1 and Station NB2 as shown in
Figure 4. The rolling stock parameters, tractive effort, and braking effort data are obtained from the manufacturer’s specifications for the MRT Line 2.
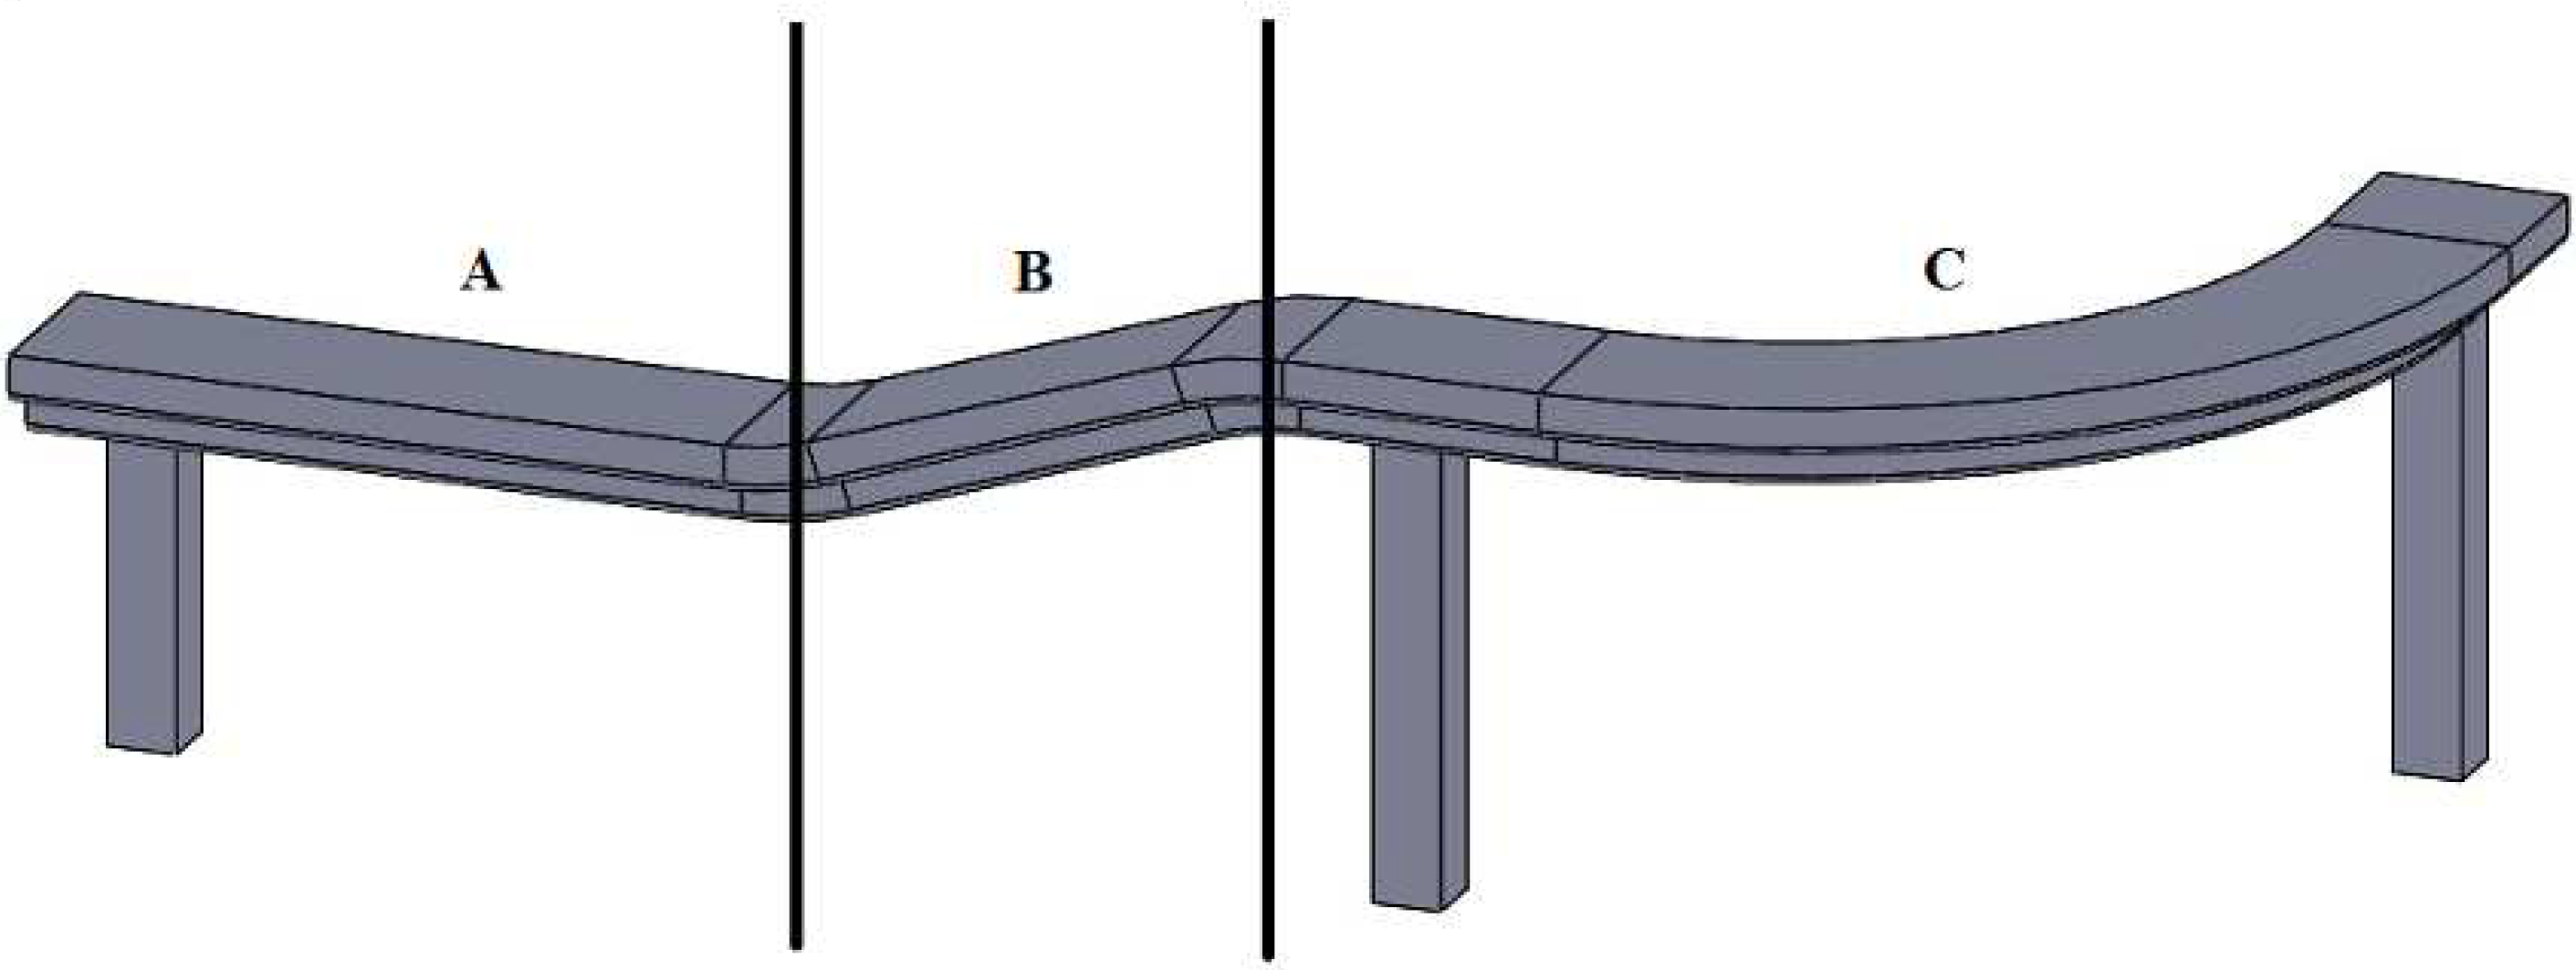
Figure 5 depicts the train traveling under different track scenarios. Segment A represents a straight track where the train needs power to overcome rolling resistance and acceleration forces. In Segment B, the train requires additional power to overcome rolling resistance, acceleration forces, and gravitational forces. Segment C represents a curved track where the train needs extra power to overcome curve resistance. Table 6 summarizes the forces that the train needs to overcome under different track scenarios.
Figure 4.
Station NB1 and NB2 modeled in ETAP-eTraX.
Figure 4.
Station NB1 and NB2 modeled in ETAP-eTraX.
Figure 5.
Track scenarios involve different civil alignment parameters.
Figure 5.
Track scenarios involve different civil alignment parameters.
Table 6.
Tractive forces need to be overcome by train in different track scenarios.
Table 6.
Tractive forces need to be overcome by train in different track scenarios.
| Track segments |
Forces need to be overcome by train |
| A |
Acceleration force, F,
|
| B |
Acceleration force, F,
|
| C |
Acceleration force, F,
|
There are a few assumptions made in this simulation study as follows: Numbered lists can be added as follows:
The weight of the trains chosen is based on the full weight with passengers and standees of six passengers/.
The train is traveling in an open-air environment.
A typical train scheduled is used, whereby the headway time and dwell time are 109 seconds and 40 seconds respectively.
Headway time is the time interval between two successive trains arriving at a station. Typically, the railway operates with 3 minutes intervals during peak hours (from 7 a.m. to 9 a.m. and from 5 p.m. to 7 p.m.) and 6 minutes intervals during off-peak hours. Therefore, this study simulated headway time interval from 2 minutes to 6 minutes to observe the impact on the energy consumptions and the recuperation of braking energy.
In dynamic analyses, the electrical distribution network of Jinjang BSS is modeled to investigate the variation in headway time. This network stretches from Damansara Damai to Kampung Baru North which consists of 8 TPSSs and 15 stations.
Figure 6 and
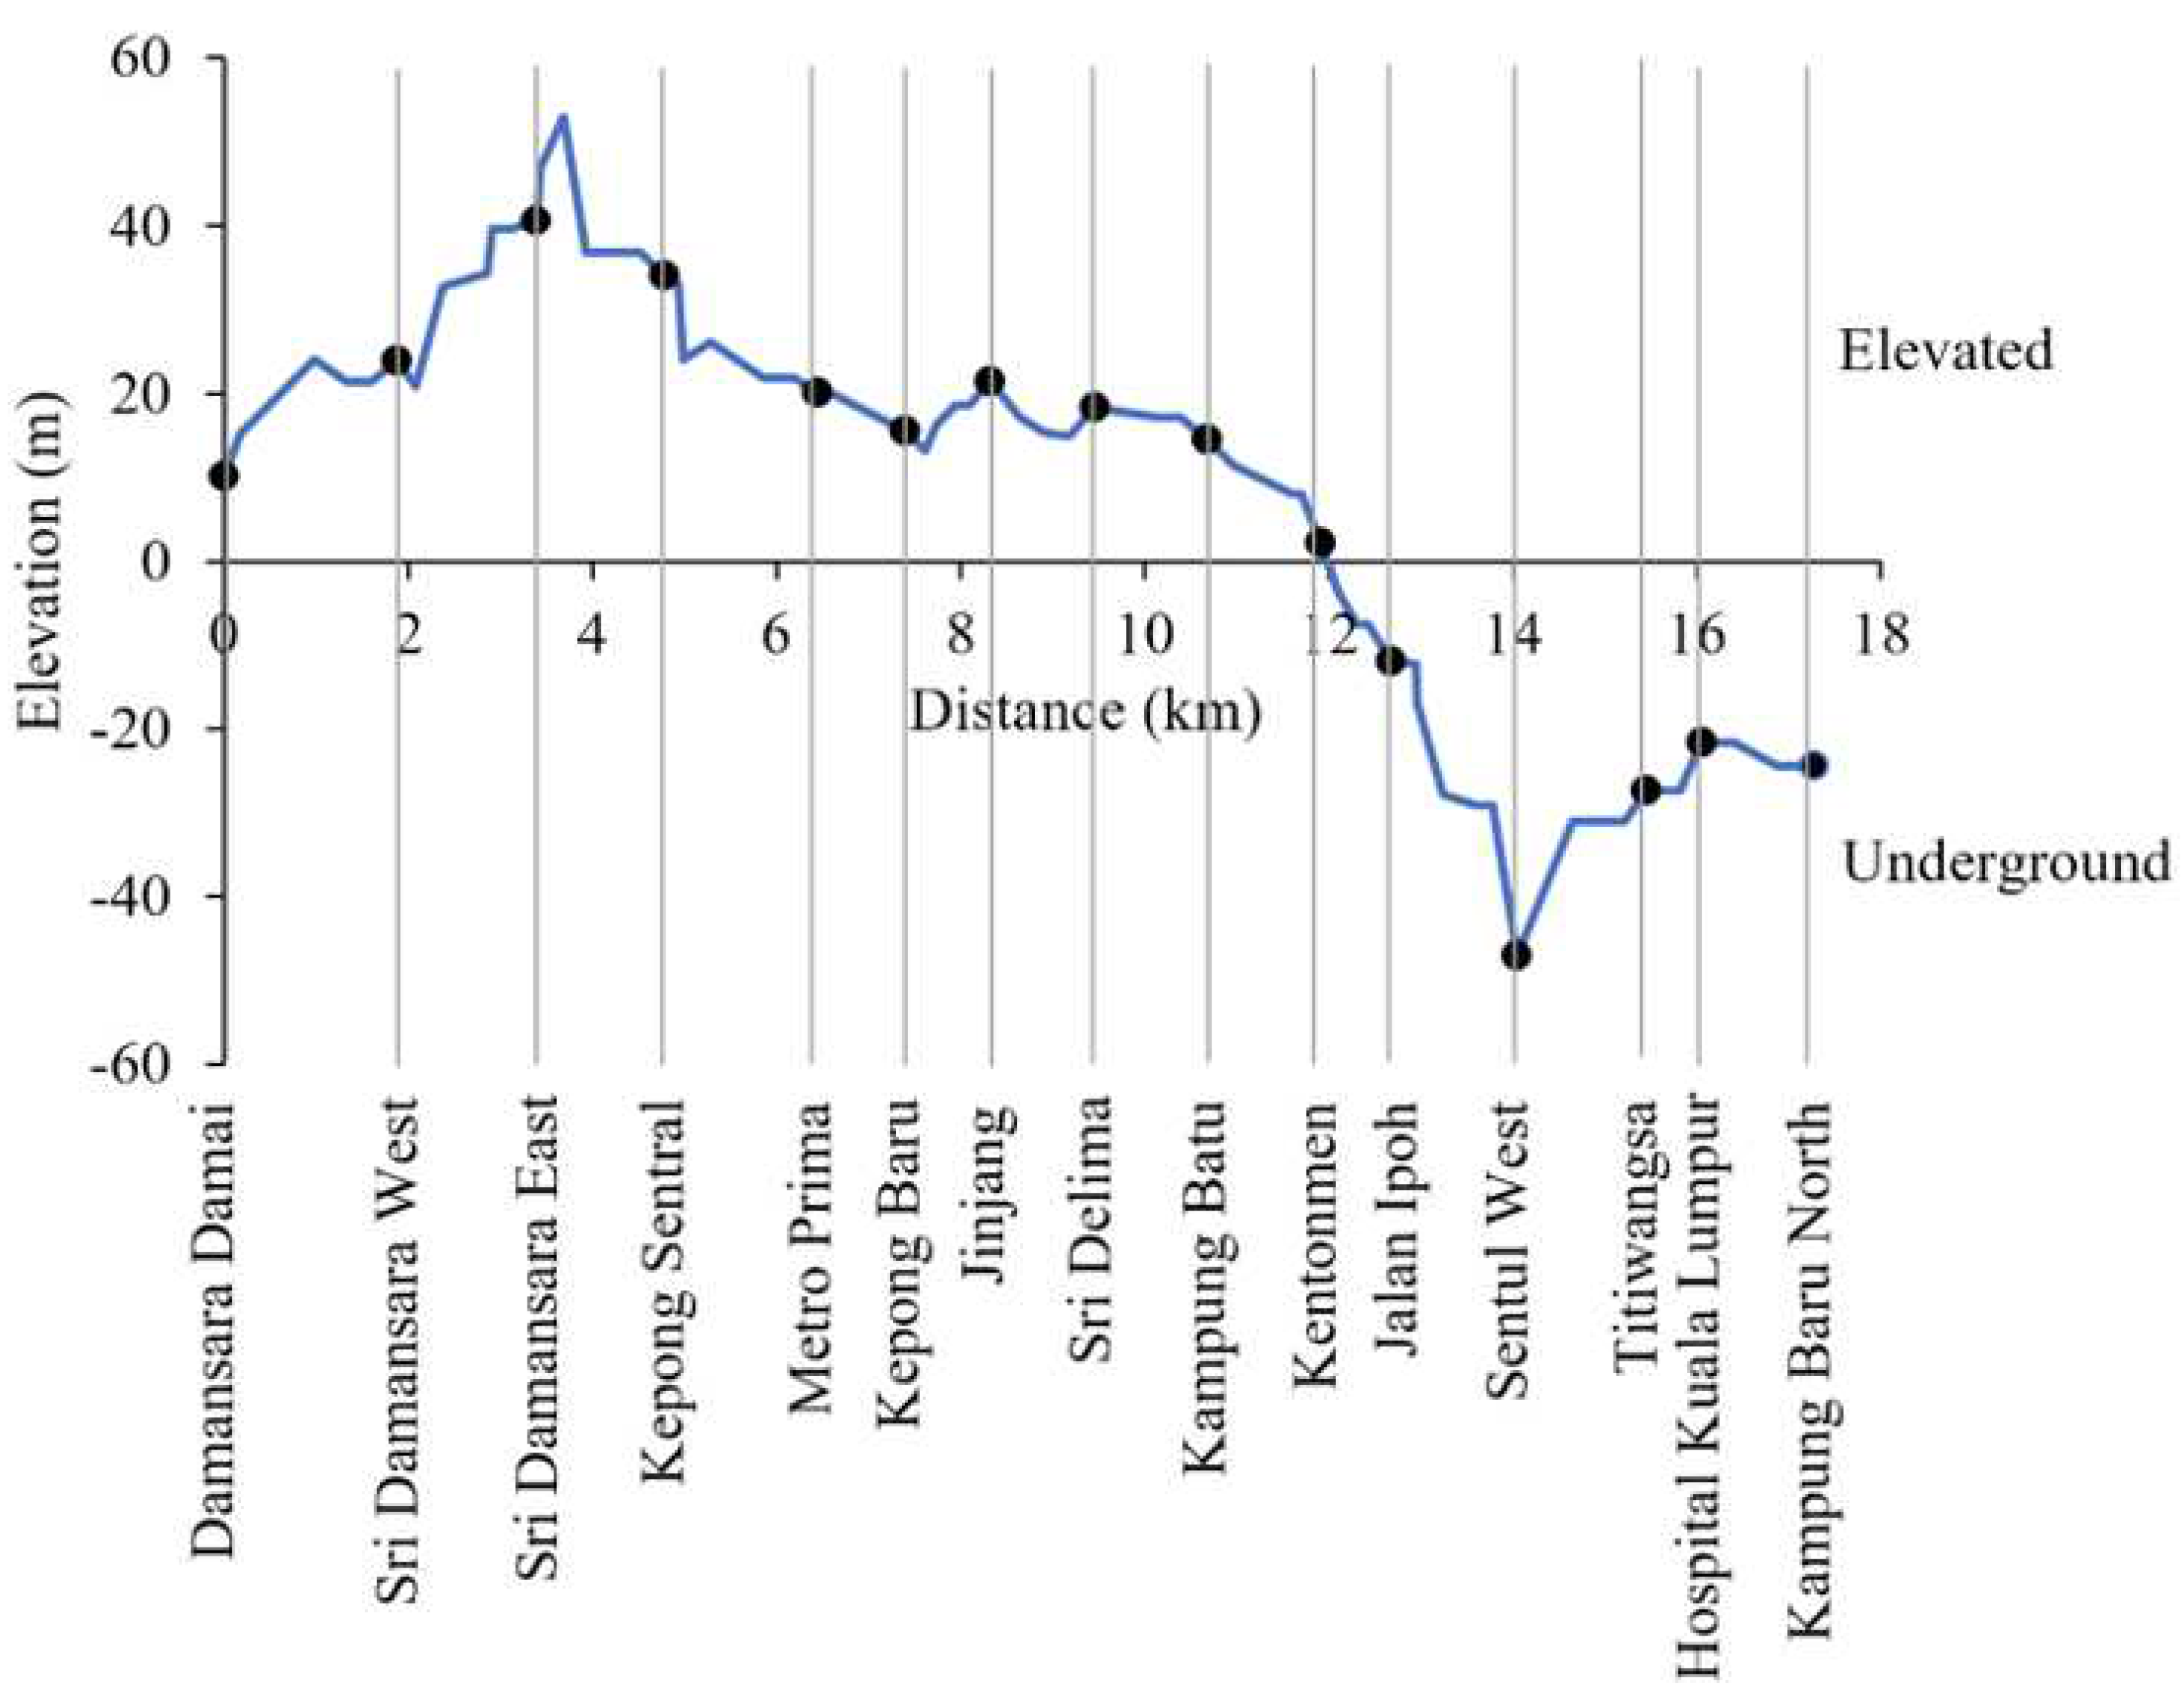
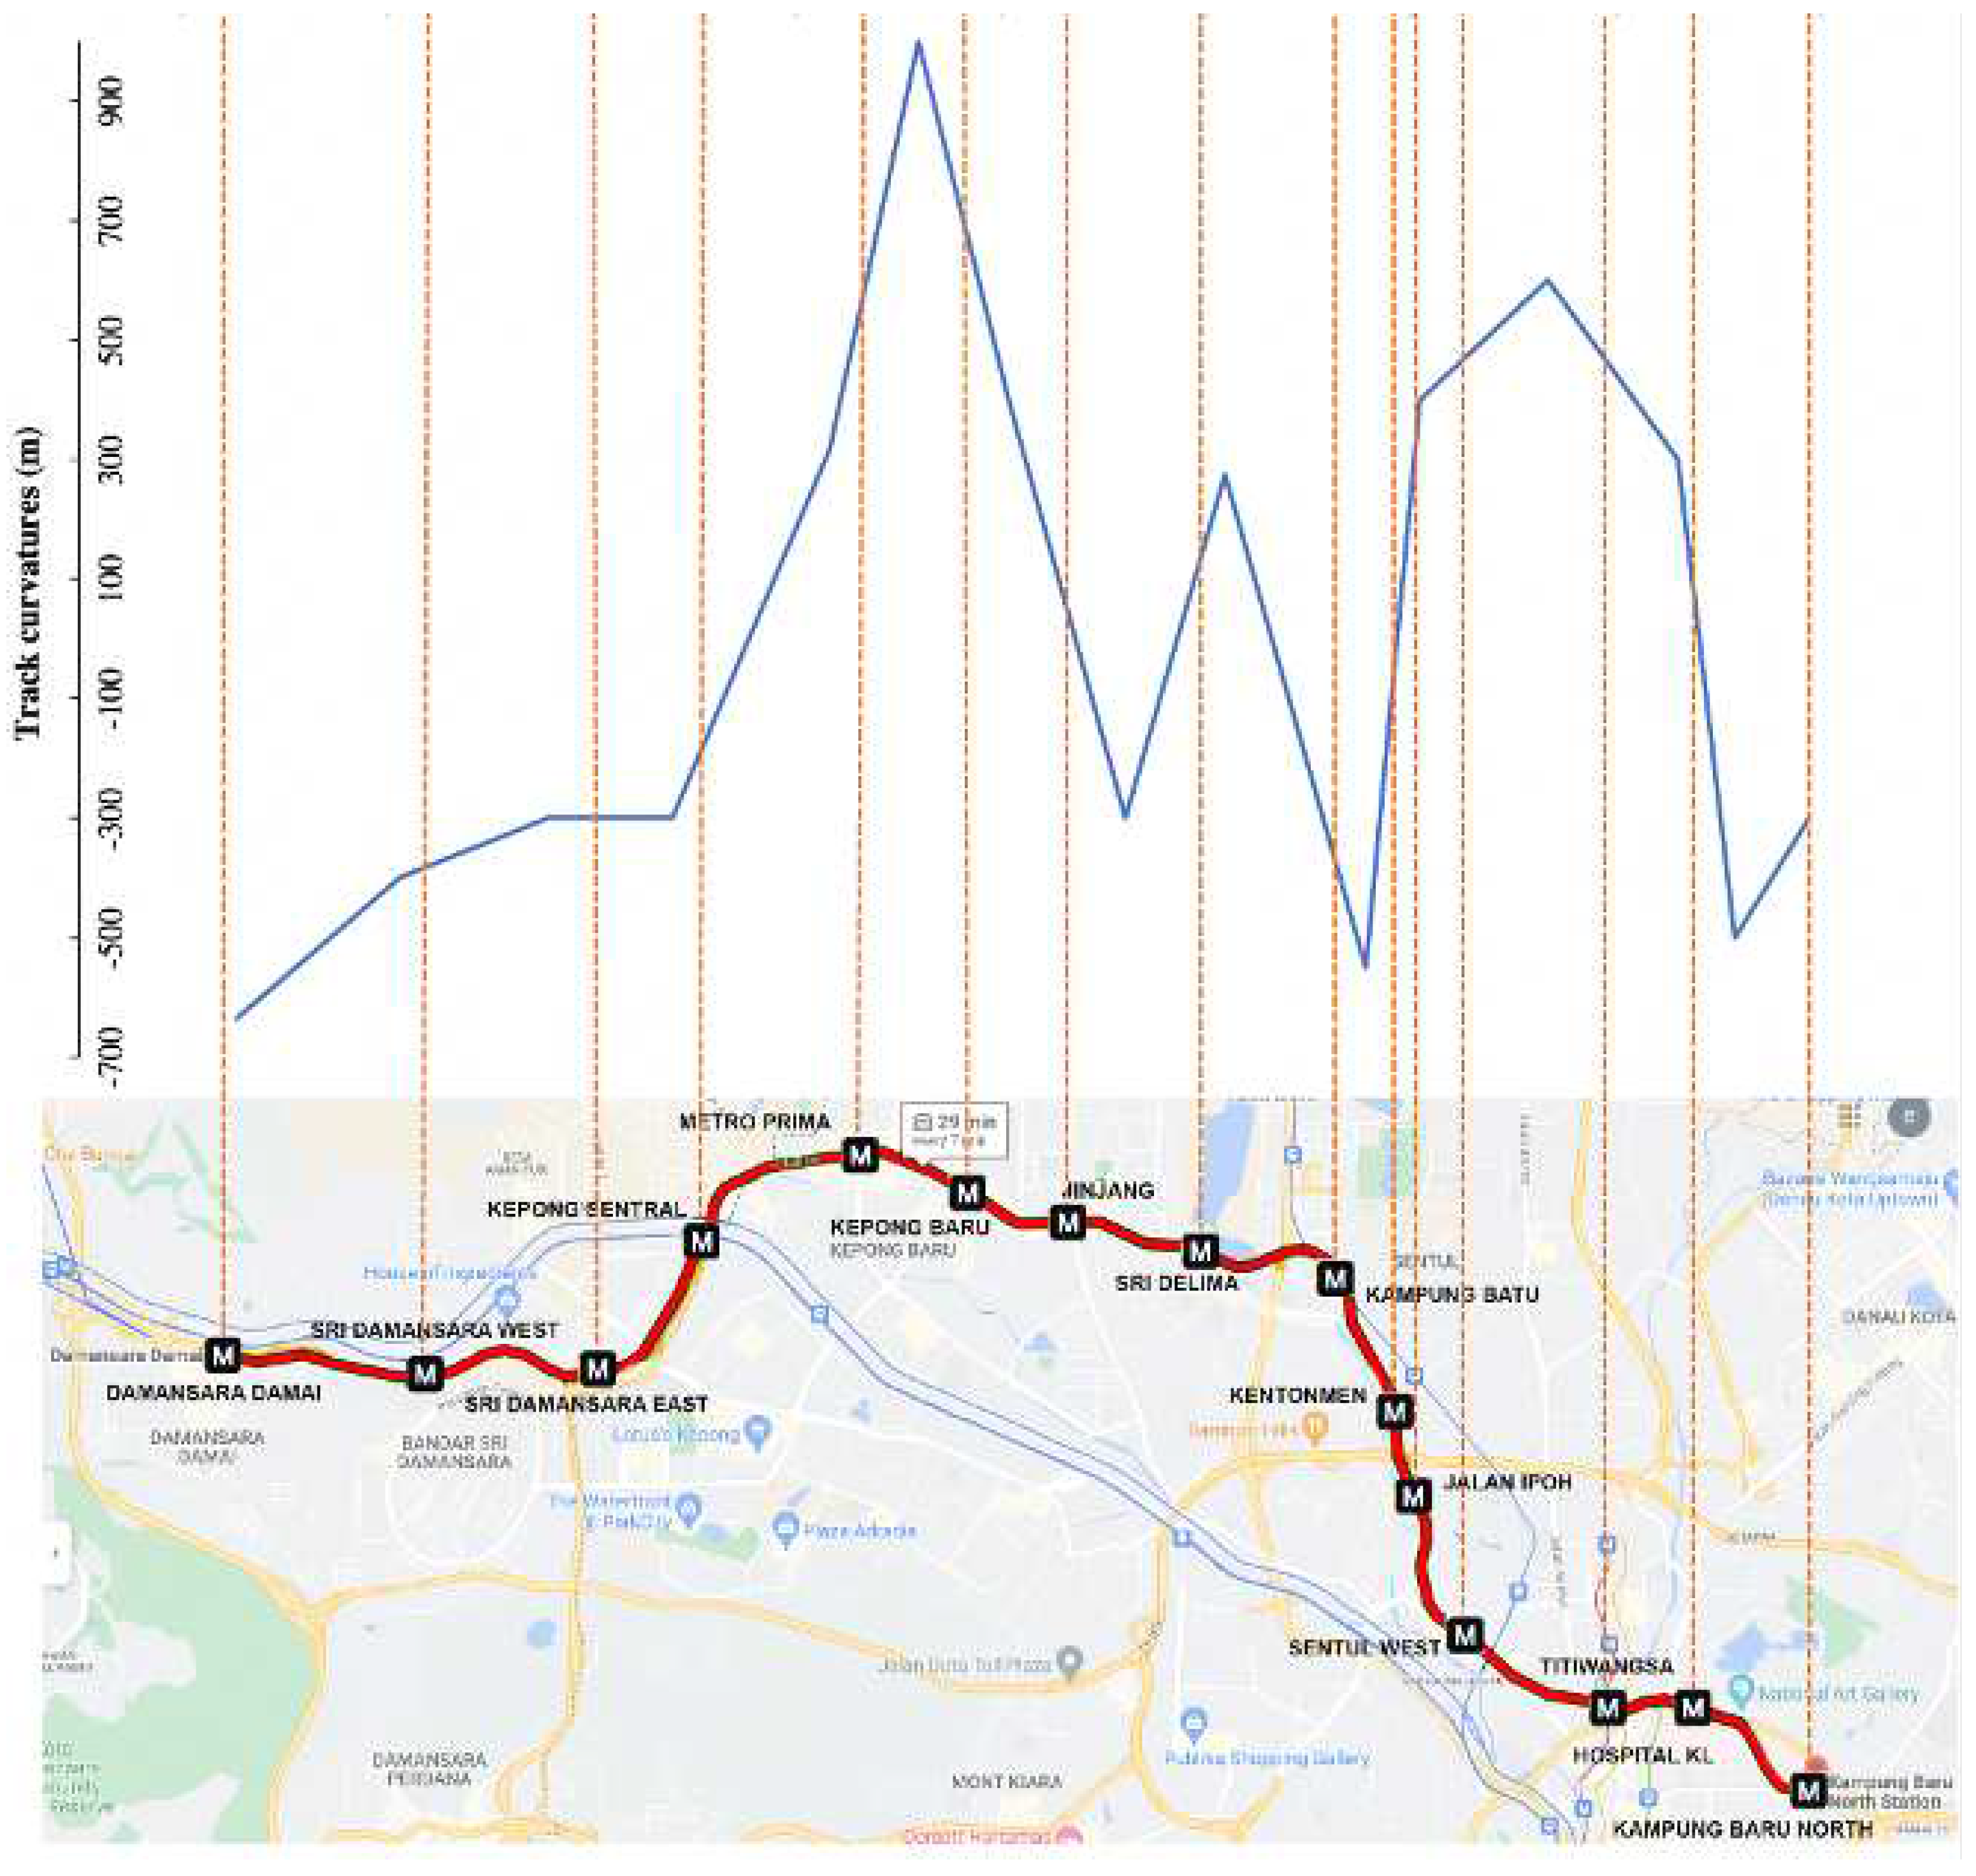
Figure 7 illustrate the track data, including elevation and track curvature from Damansara Damai to Kampung Baru North, respectively.
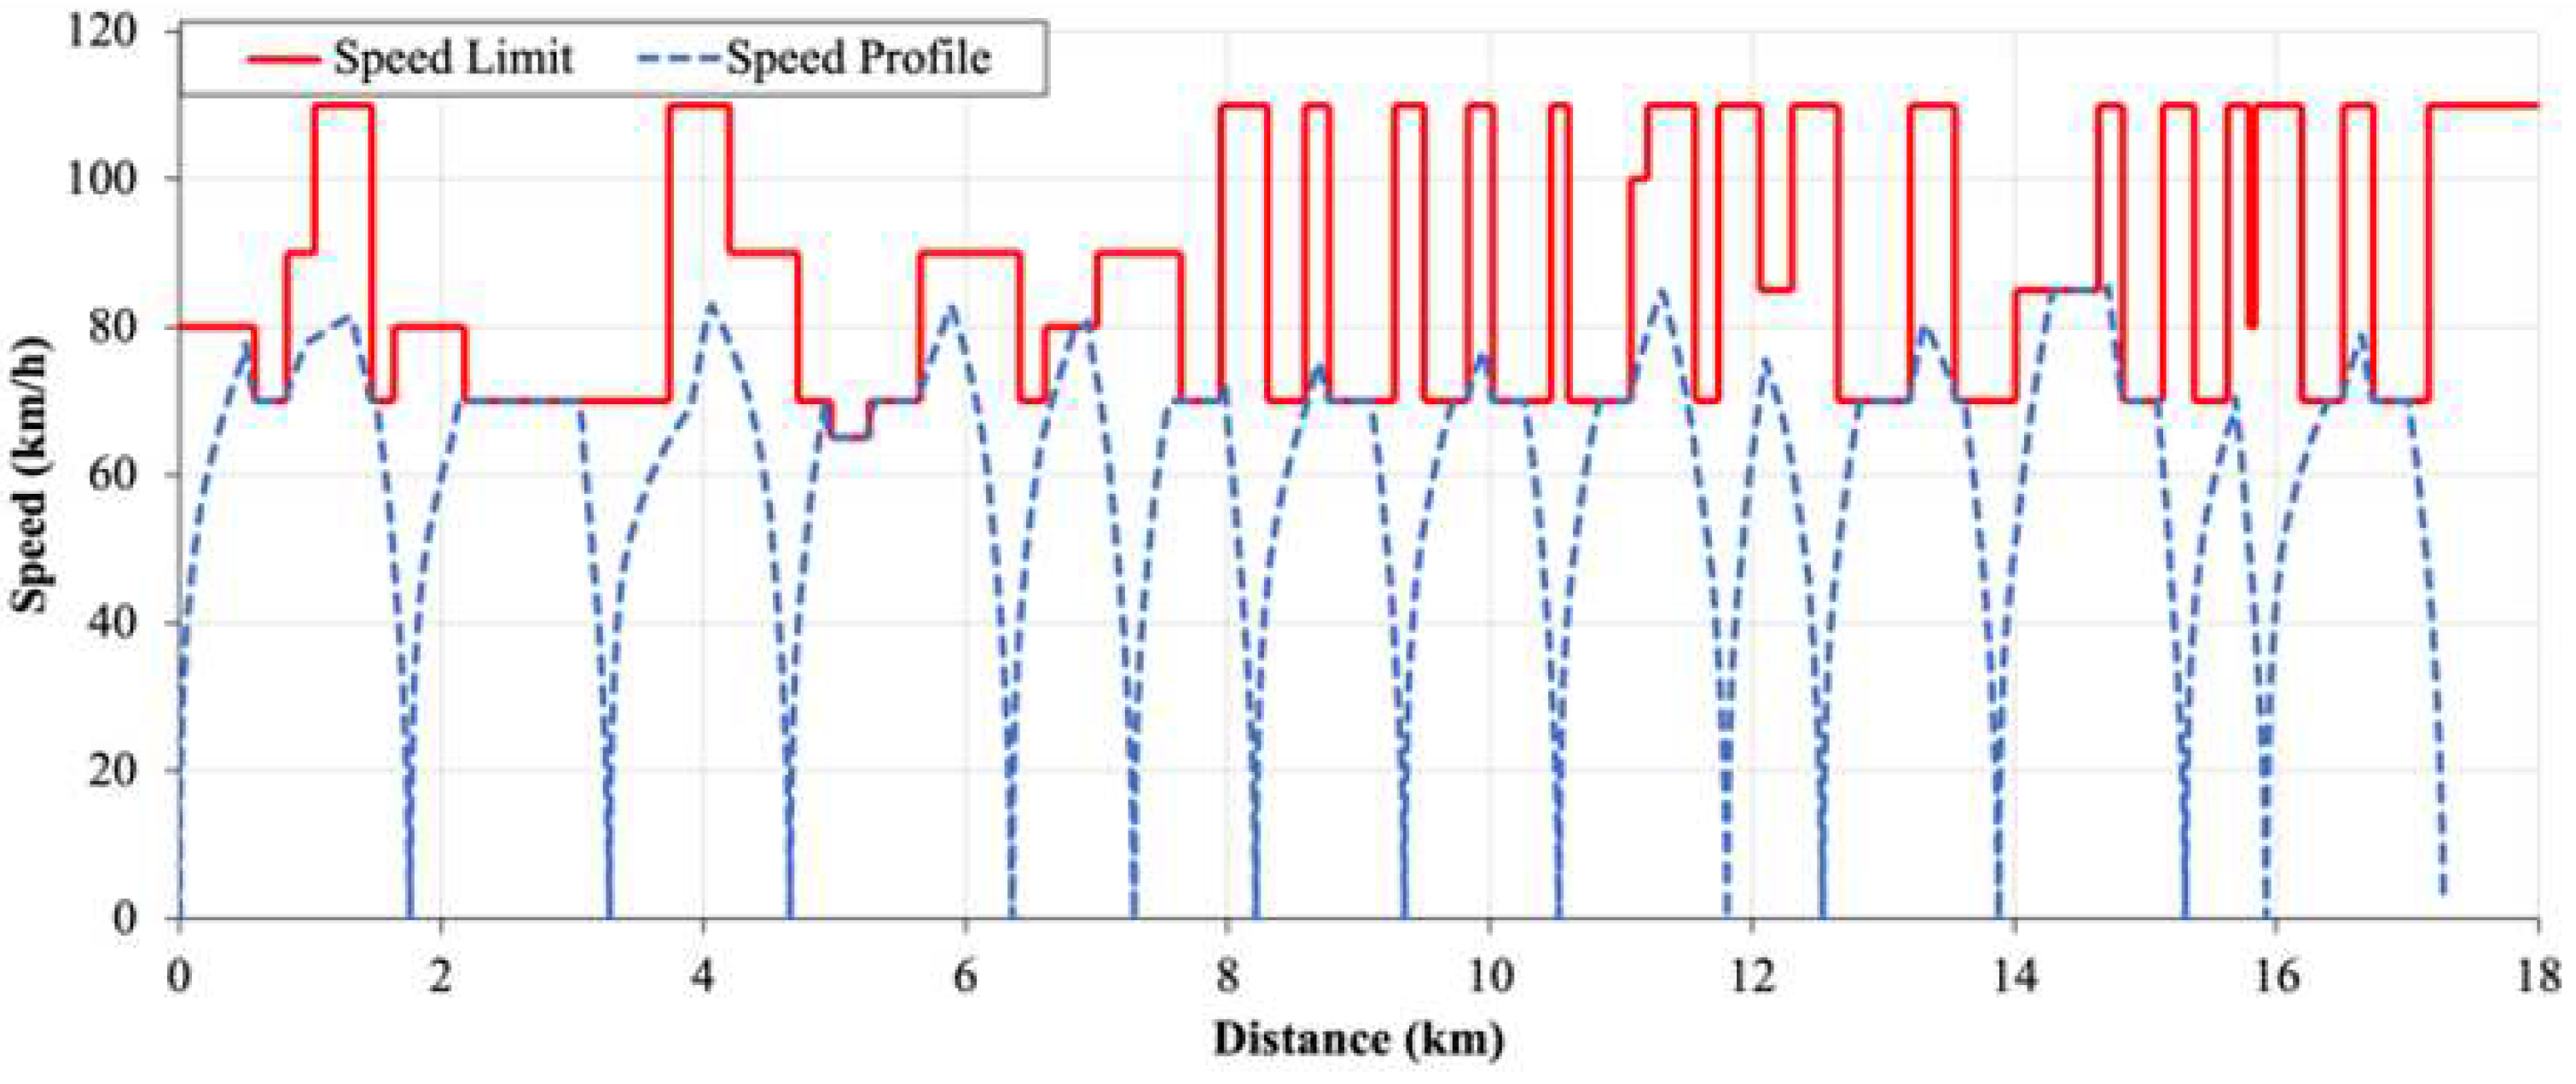
The speed profiles and the speed limits of the train travels from Damansara Damai station to Kampung Baru North station are as shown in
Figure 8. The speed limits are set in the range of 70 km/h to 110 km/h according to the curvatures and elevation of the tracks. As depicted in the figure, the train’s speed is constrained by the designated speed limit throughout the simulation.
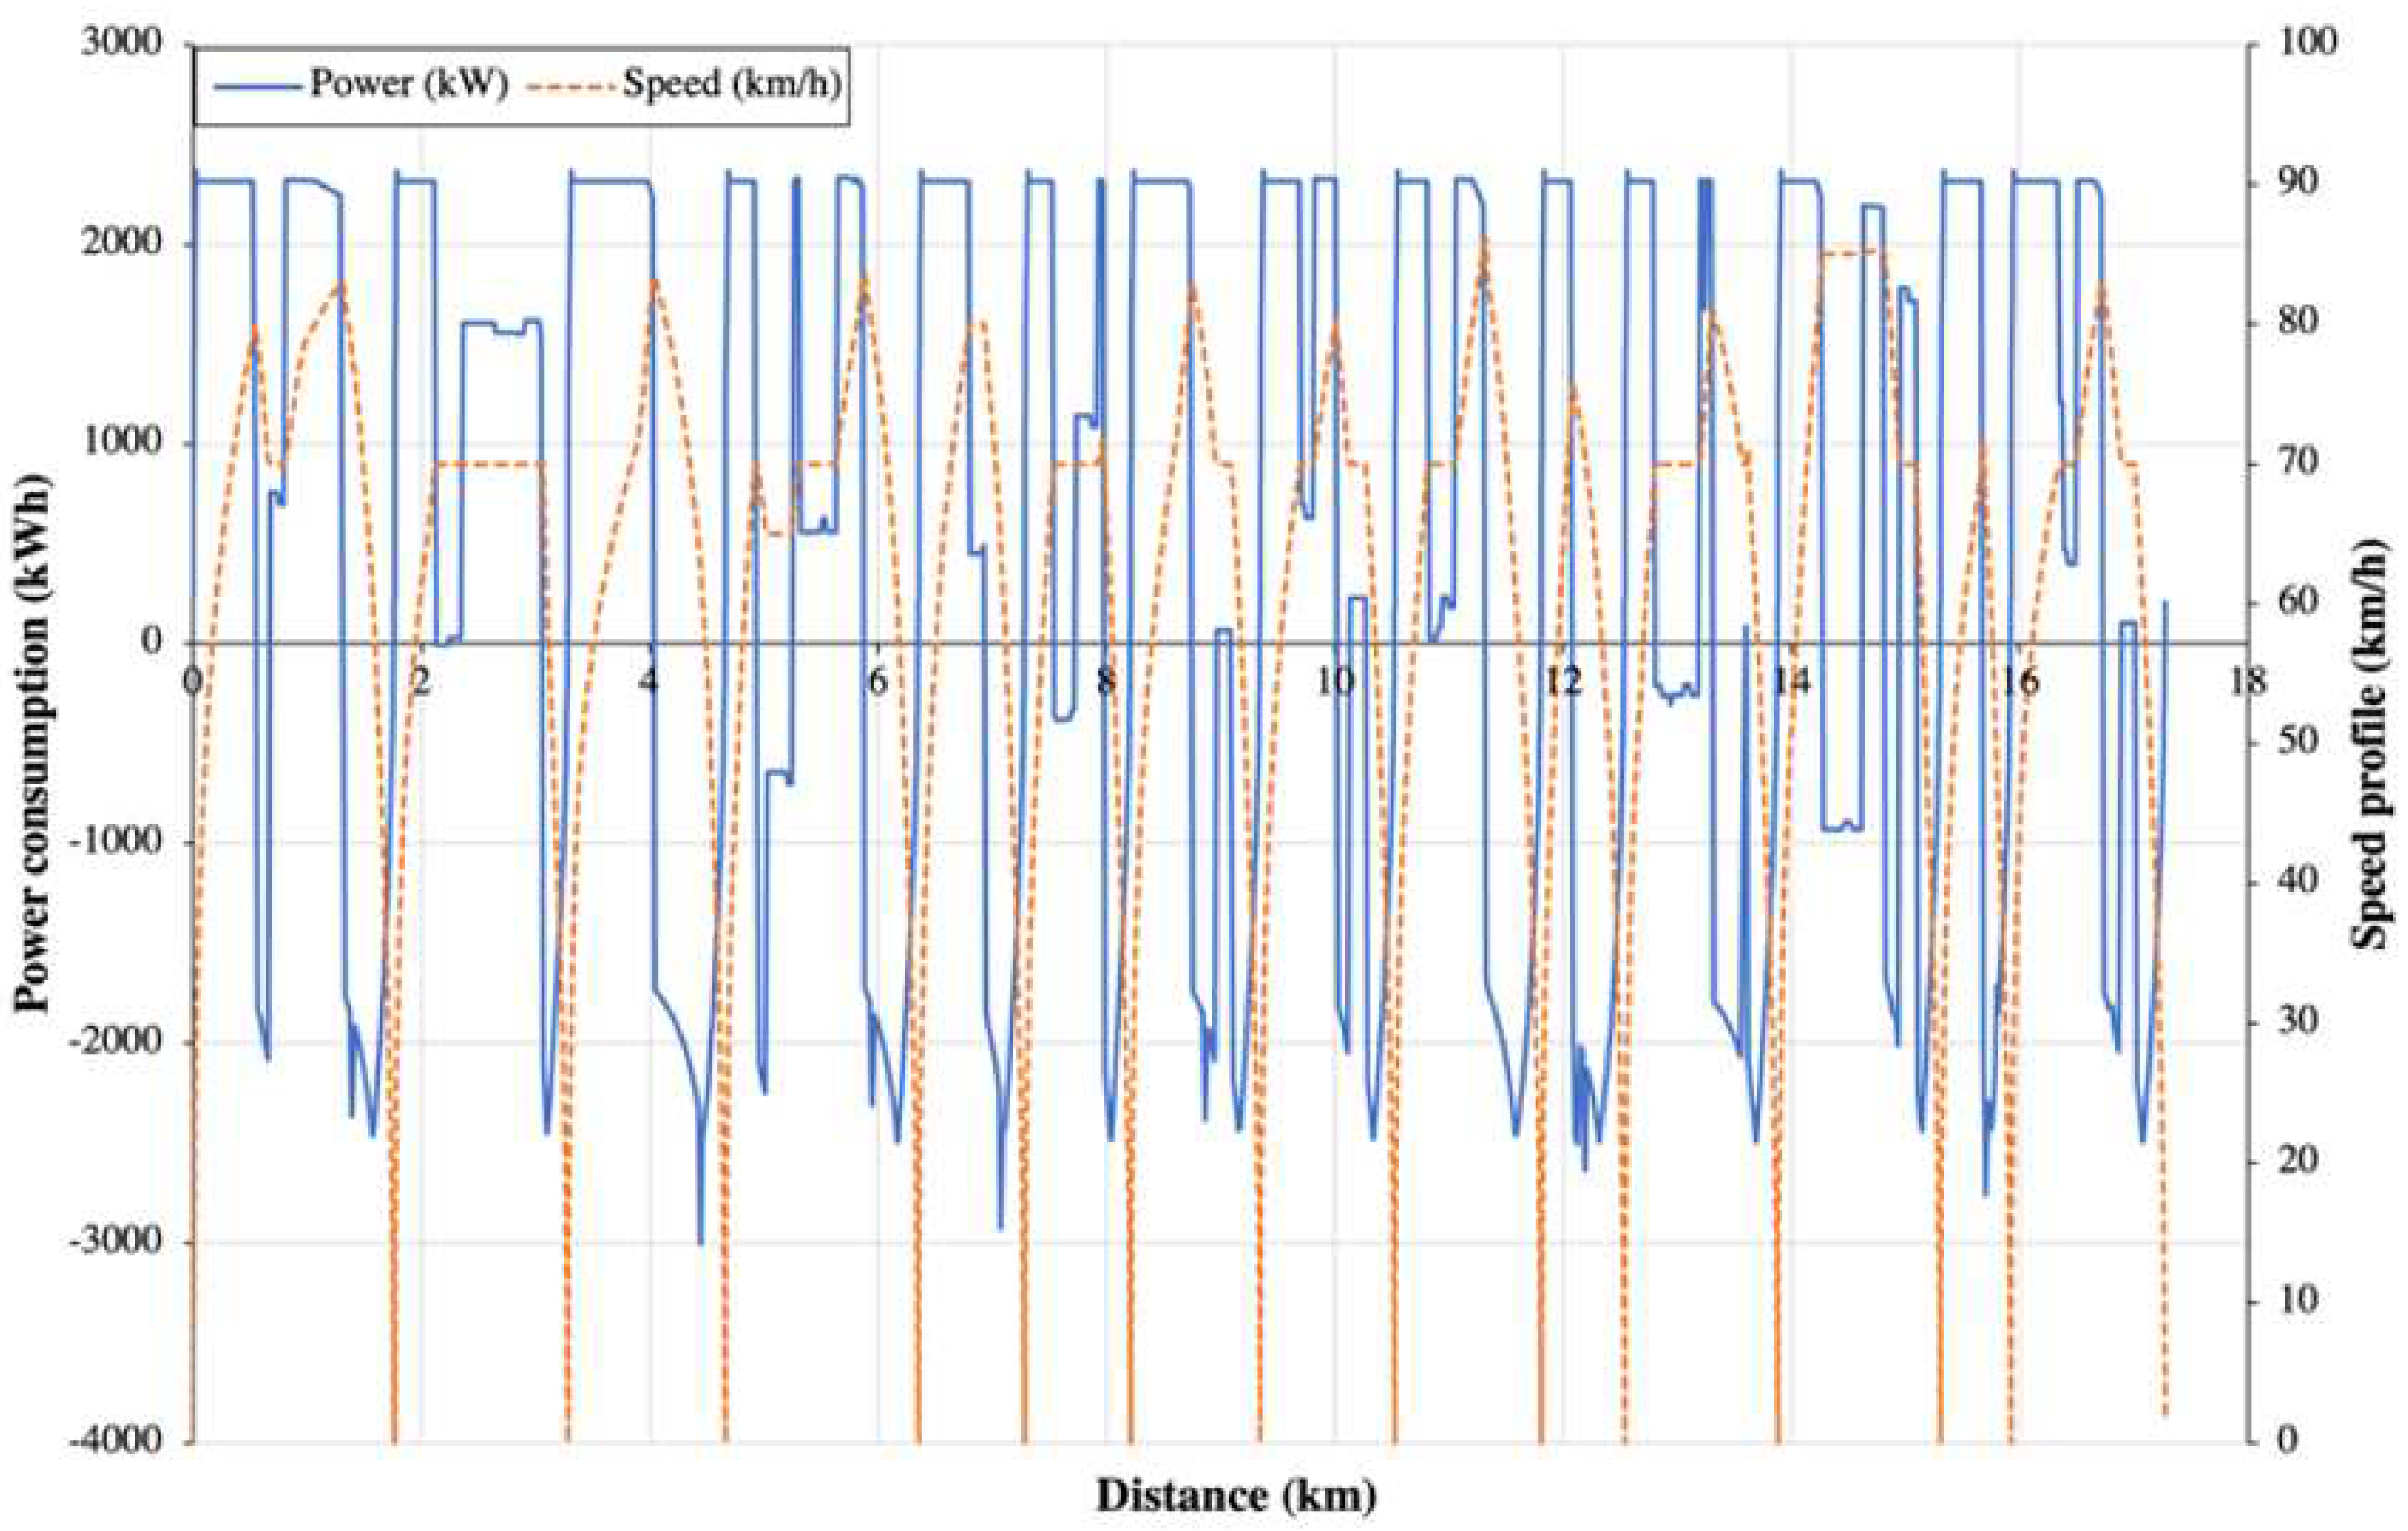
Figure 9 illustrates the power consumption and the speed profile of MRT Line 2. It can be noticed that the power is a negative value when the speed decreases. The negative power indicates that the energy is being transmitted back to the power grid.
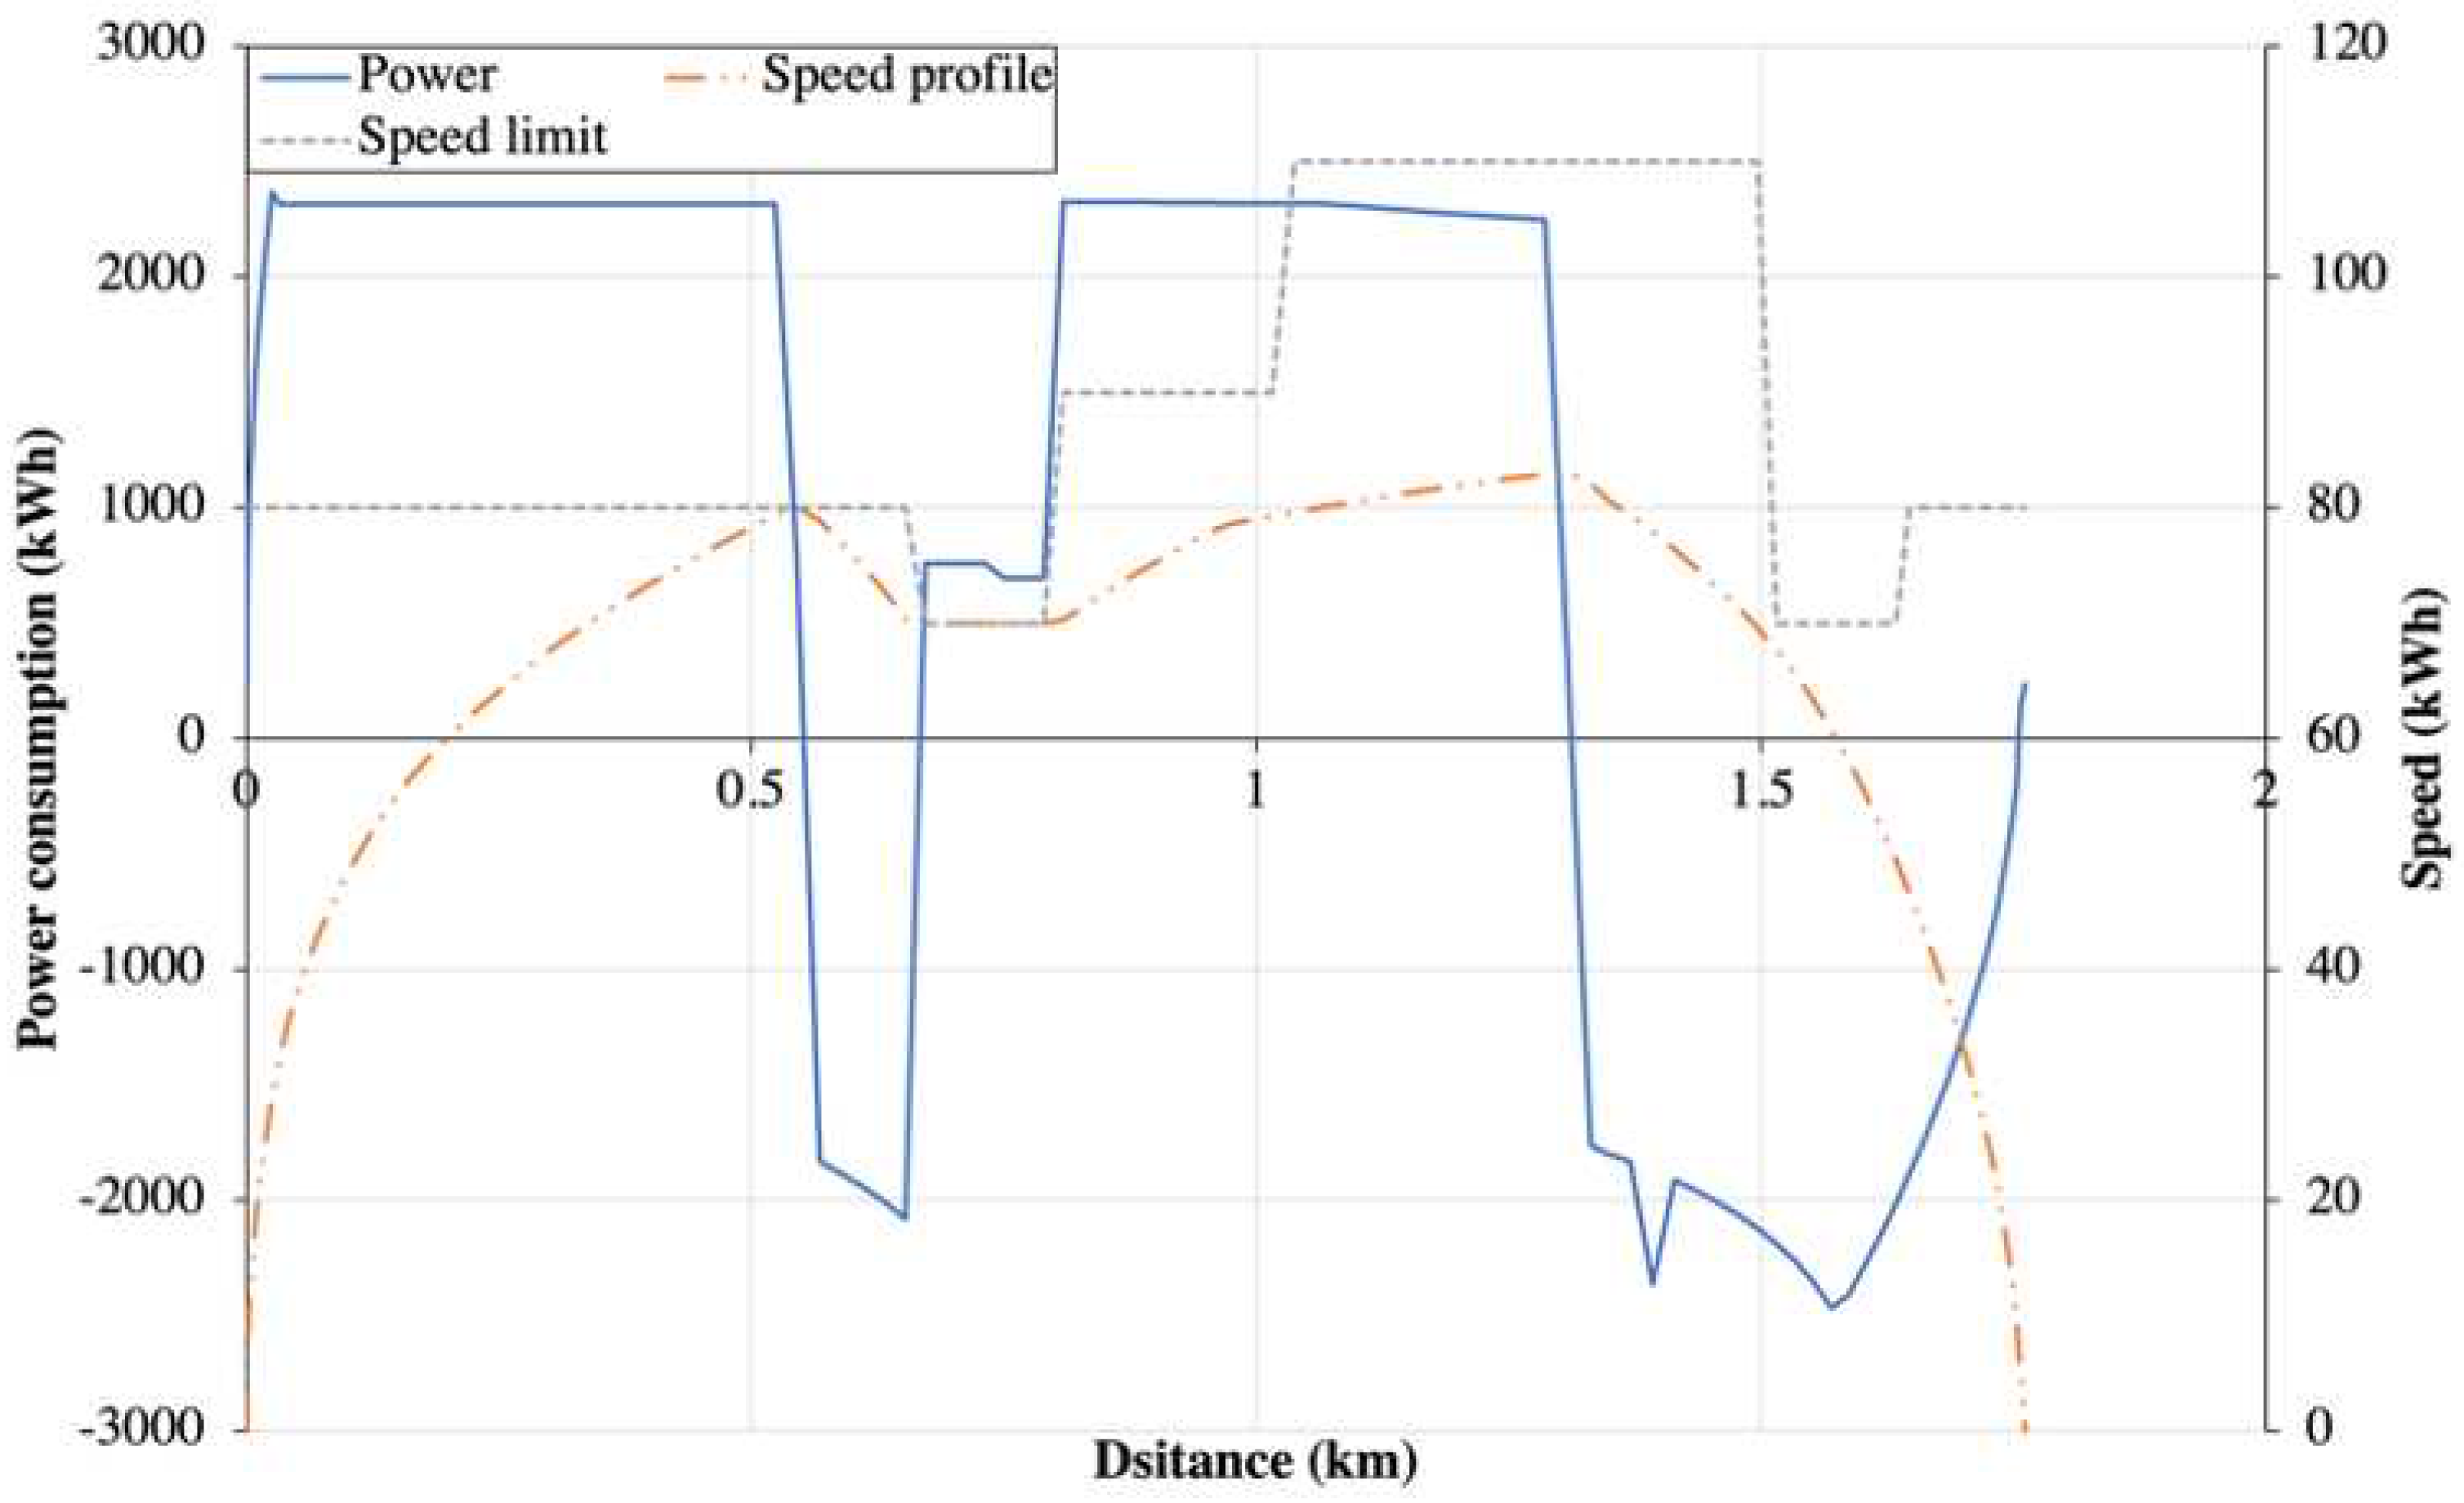
Figure 10 shows the relationship between power consumption, speed limit, and the speed profile of a single train for different driving modes such as acceleration, cruising, coasting, and deceleration.
Figure 6.
Track elevations of MRT Line 2.
Figure 6.
Track elevations of MRT Line 2.
Figure 7.
Track curvatures of MRT Line 2.
Figure 7.
Track curvatures of MRT Line 2.
Figure 8.
The speed profile of a single train of MRT Line 2.
Figure 8.
The speed profile of a single train of MRT Line 2.
Figure 9.
The power consumption and speed profile of a single train of MRT Line 2.
Figure 9.
The power consumption and speed profile of a single train of MRT Line 2.
Figure 10.
Power consumption, speed profile, and speed limit of a single train travel between 2 stations.
Figure 10.
Power consumption, speed profile, and speed limit of a single train travel between 2 stations.
3. Formulation of Train Dynamic Load Flow
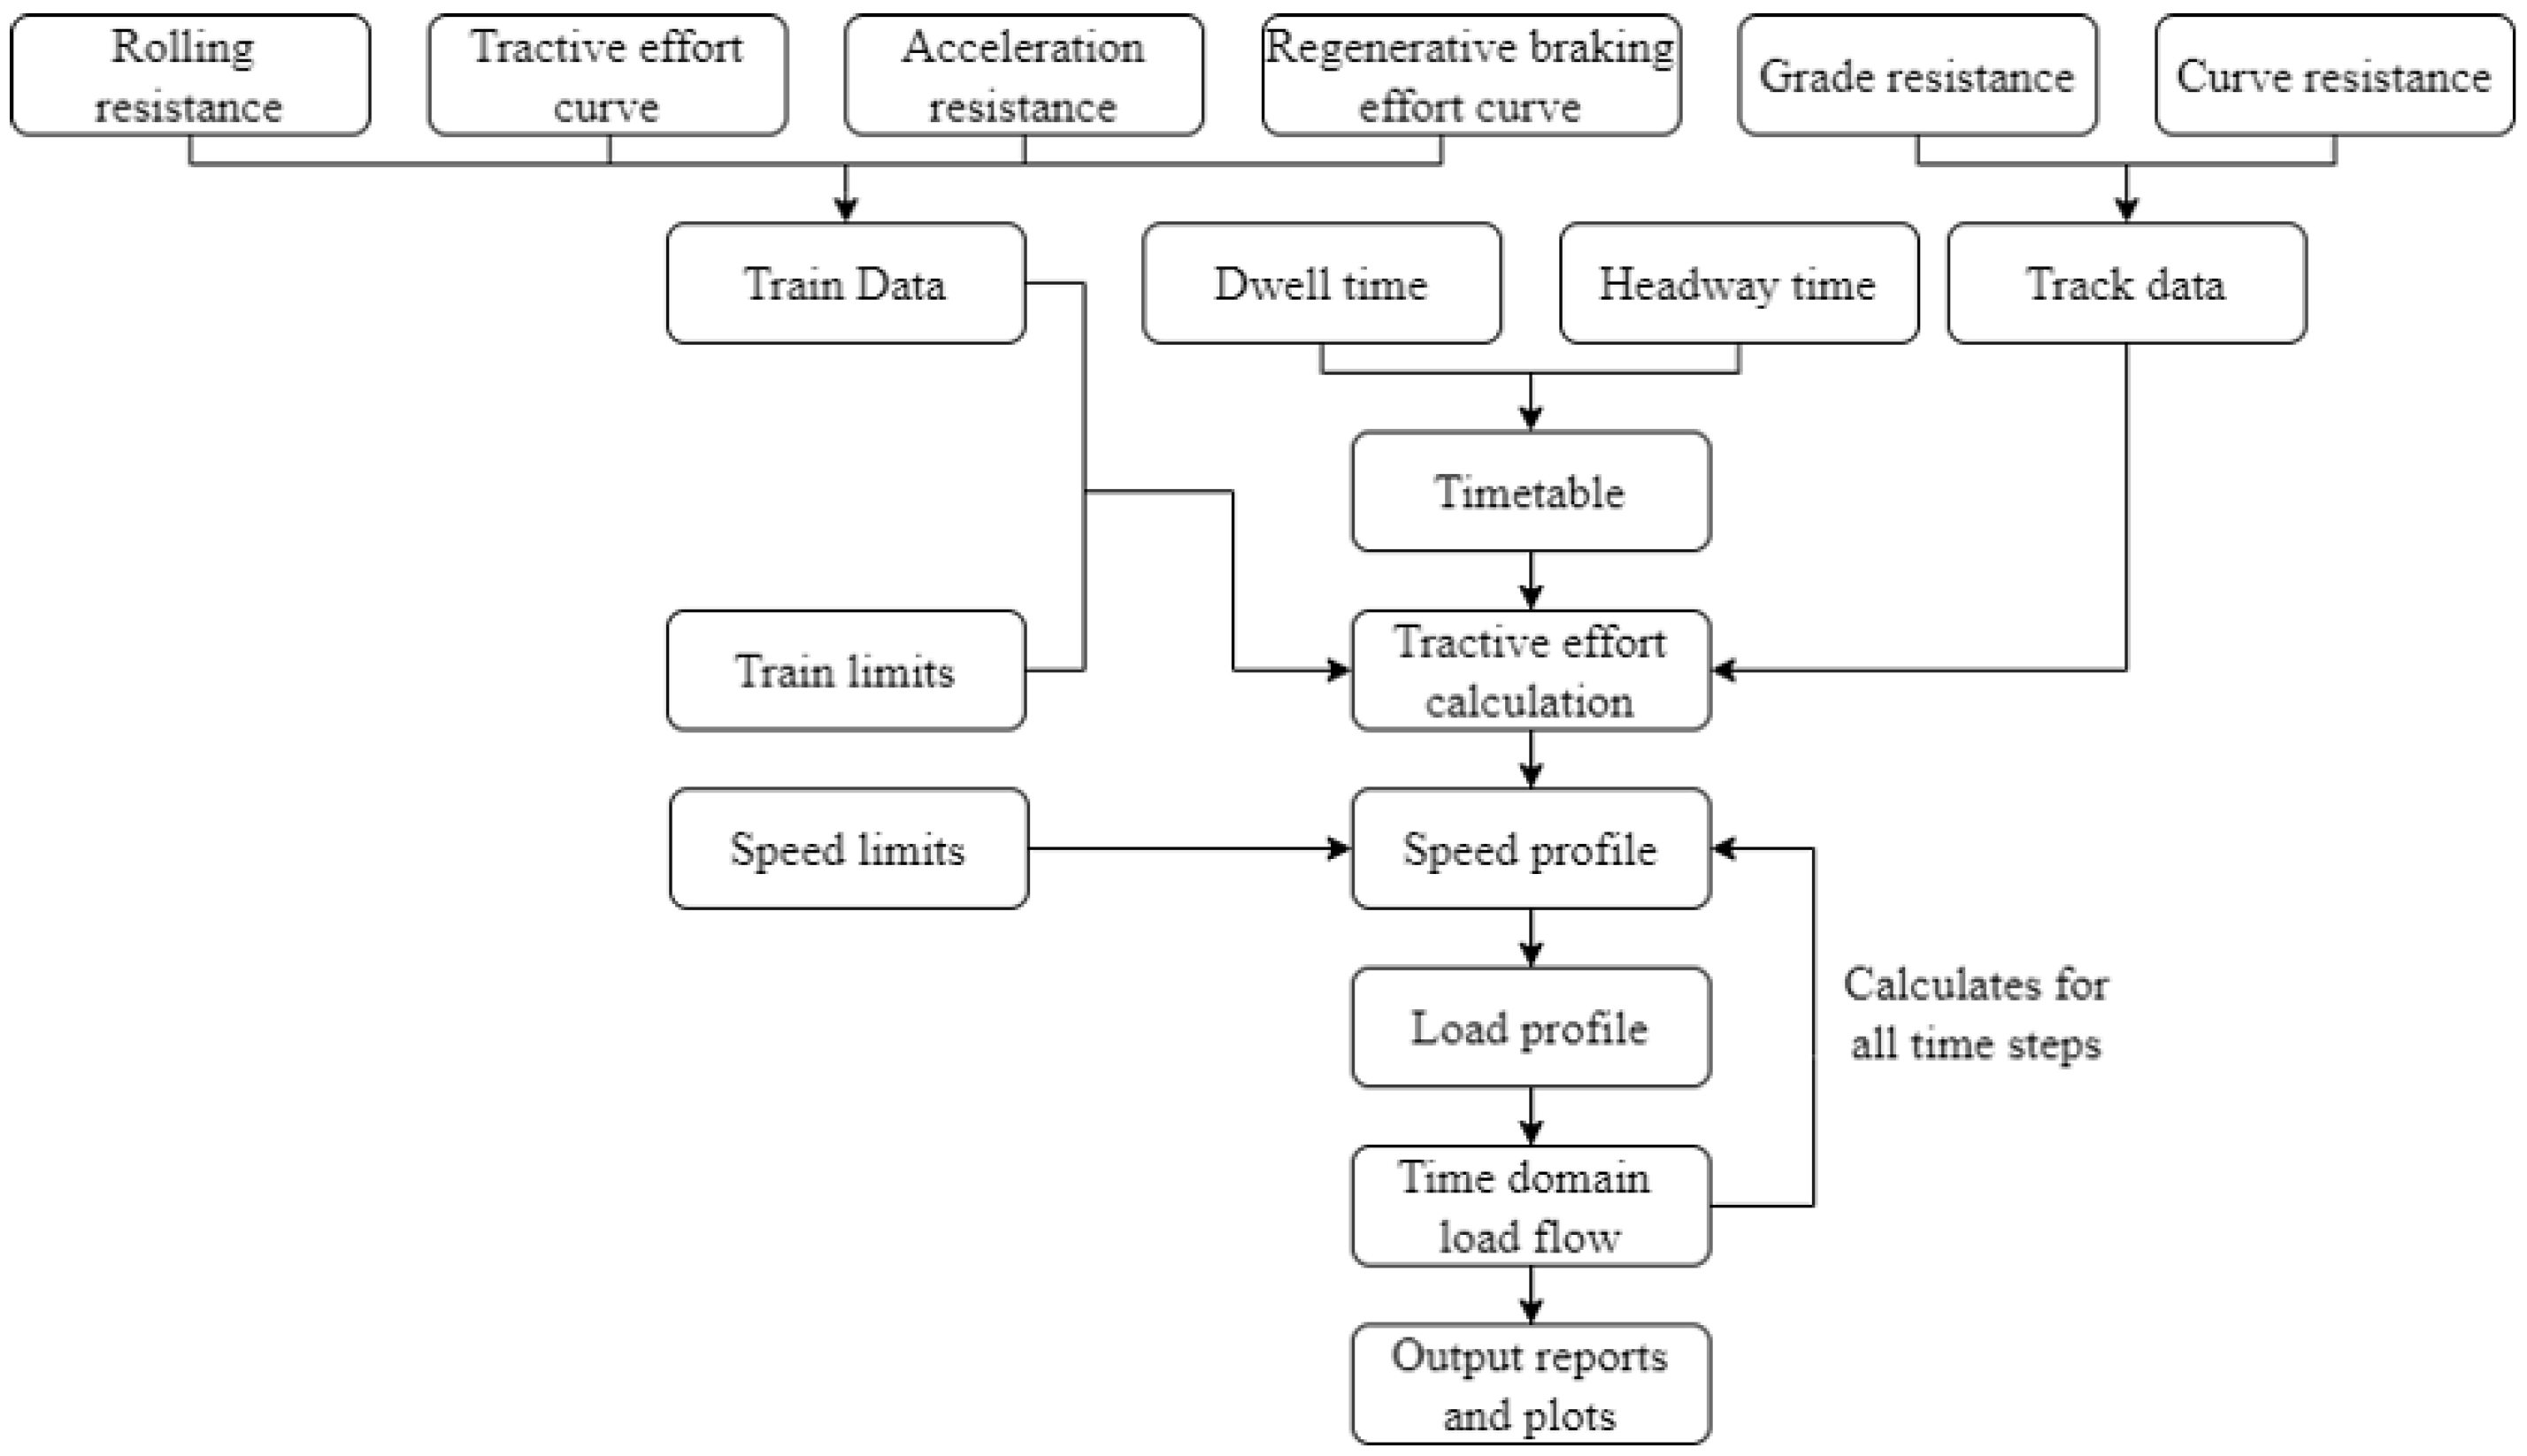
Figure 13 shows a flow chart of the dynamic train’s load flow analysis calculation process in ETAP software. The adaptive Newton-Raphson method in the ETAP software is selected for the MRT Line 2 dynamic load flow calculation. The parameters such as the track data, train data, and speed limits are obtained from the actual system parameters. Other inputs such as the headway time and dwell time are varied according to the demand of the passengers during peak and off-peak hours.
Figure 11.
Overview of dynamic load flow calculation.
Figure 11.
Overview of dynamic load flow calculation.
The resistive force can be bifurcated into internal and external resistance. The internal resistance is related to the track resistance and prevailing track geometry over the entire train travel. On the other hand, the external resistance refers to the parameters that are not fixed and depend on the terrain such as grade resistance, and curve resistance. As the resistive force increase, the tractive effort of ERS needed to overcome also increases. Hence, the energy consumption will also increase. The mathematical relationship which expresses the connection between these resistances is written as follows:
where,
is the total of tractive force,
is the acceleration force,
is the rolling resistance that is required by a train to overcome the frictional force,
is the grade resistance force that a train required to overcome the gravitational force, and
is the curve resistance force that a train required to overcome the curvature force.
RBE recovery occurs when the train decelerates. Thus, the amount of RBE increases when the braking effort increases. The braking force (
) can be expressed as follows:
where,
is the deceleration force,
is the fundamental tractive force of a train when the train travels on a straight and level track,
is gravitational force, and
is curvature force.
The train needs to overcome the rolling resistance of the train and the mass inside the train to accelerate. The magnitude of rolling resistance force (
) depends on the rolling stock parameters of the train and the velocity of the moving train as defined by the Davis equation while the magnitude of acceleration force is affected by the passengers and the inertia of bearing parts as shown in Equation (
3) and (4) as follows:
where, A is the resistance related to the rolling resistance of the train measured in kN, B is the mechanical and air drag effect resistance of the train measured in
, C is the resistance related to the aerodynamic drag measured in
, and v is the train’s speed in
.
where, m is the total train’s weight including rotating inertia in kg, and a is the train’s acceleration in
.
The train also needs to overcome the gravitational force (
).
is measured by the elevation between two points on the track multiplied with the train’s weight, as shown in Equation (
5).
where, the constant 9.81 is the acceleration of gravity on the surface of the earth at sea level
while W is the weight of the train in tons, and
is the inverse of the tangent of the elevation between two points on the track in percentage. A positive
implies the train is moving uphill, while a negative
shows the train is moving downhill.
The curvature force, (
), when a train travels along a curve track is affected by the track’s curve radius, the train’s speed, and the axle spacing between the front and rear wheelbase of the rolling stock as shown in Equation (
6)
where, W is the weight of the train, a and S are the axle spacing measured in meter (m) and R is the curve radius in meter (m).
4. Results and Discussion
4.1. Case studies for train’s energy consumption under different speed limits
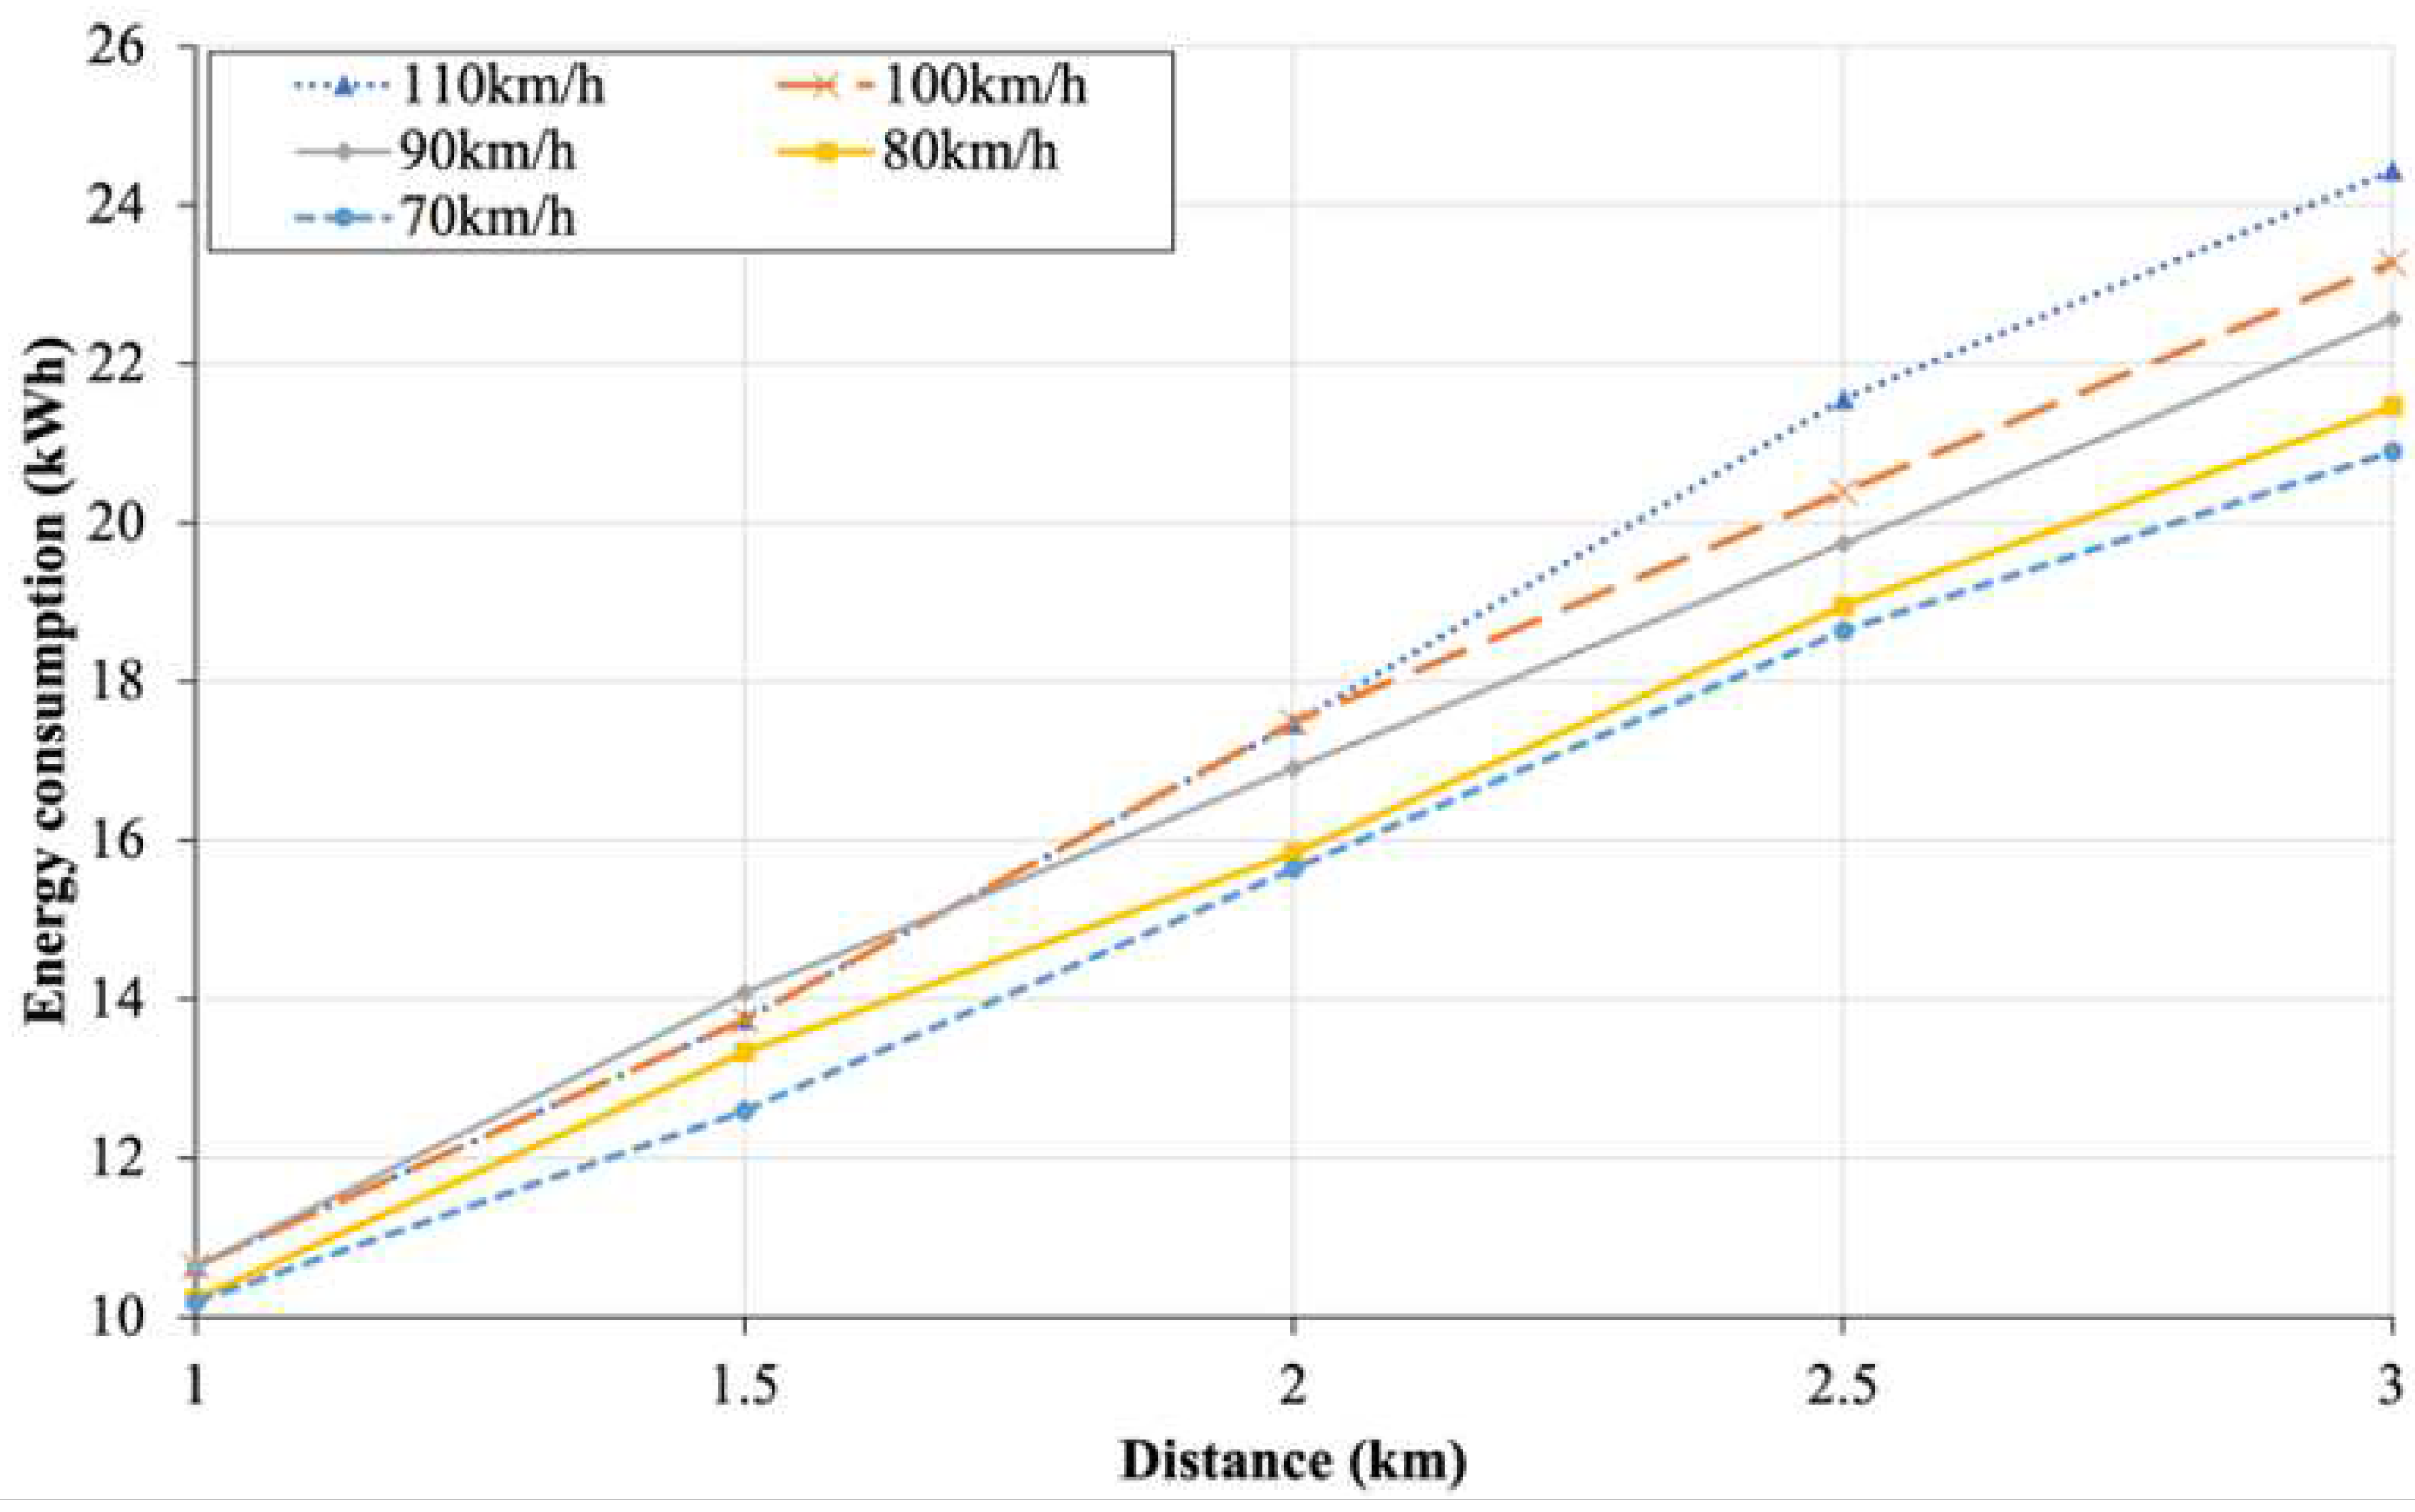
Figure 12 shows the train’s energy consumptions when the train’s speed limit varies from 70 km/h to 100 km/h, for the distance between Station NB1 and NB2 spanning from 1 km to 3 km. The train’s energy consumption increases as the train’s speed limit increases.
Figure 12.
Energy consumptions of train between Station NB1 and NB2 for different speed limits under different distances.
Figure 12.
Energy consumptions of train between Station NB1 and NB2 for different speed limits under different distances.
For the distance of 3 km, the energy consumption of the train at the speed of 110 km/h is 16.95% higher than that of 70 km/h. On the other hand, the train’s energy consumption between the different speed limits for a short train travel distance such as 1 km, is not significant because the maximum speed that the train can attain is confined by the distance between the two stations. Table 7 shows the maximum speed that the train can attain for different distances and speed limits. It can be observed that the minimum distance between two stations for the train to reach 110 km/h is 3 km.
Table 7.
Maximum speed of a train under different distances and speed limits.
Table 7.
Maximum speed of a train under different distances and speed limits.
| |
Attainable speed before a deceleration
in needed (km/h) |
| |
Speed limits |
70km/h |
80km/h |
90km/h |
100km/h |
110km/h |
| Distance between 2 stations |
|
| 1km |
70 |
80 |
85.6 |
85.6 |
85.6 |
| 1.5km |
70 |
80 |
90 |
95.9 |
95.9 |
| 2km |
70 |
80 |
90 |
100 |
103.8 |
| 2.5km |
70 |
80 |
90 |
100 |
109.2 |
| 3km |
70 |
80 |
90 |
100 |
110 |
4.2. Case studies for train’s energy consumption under different levels of elevation
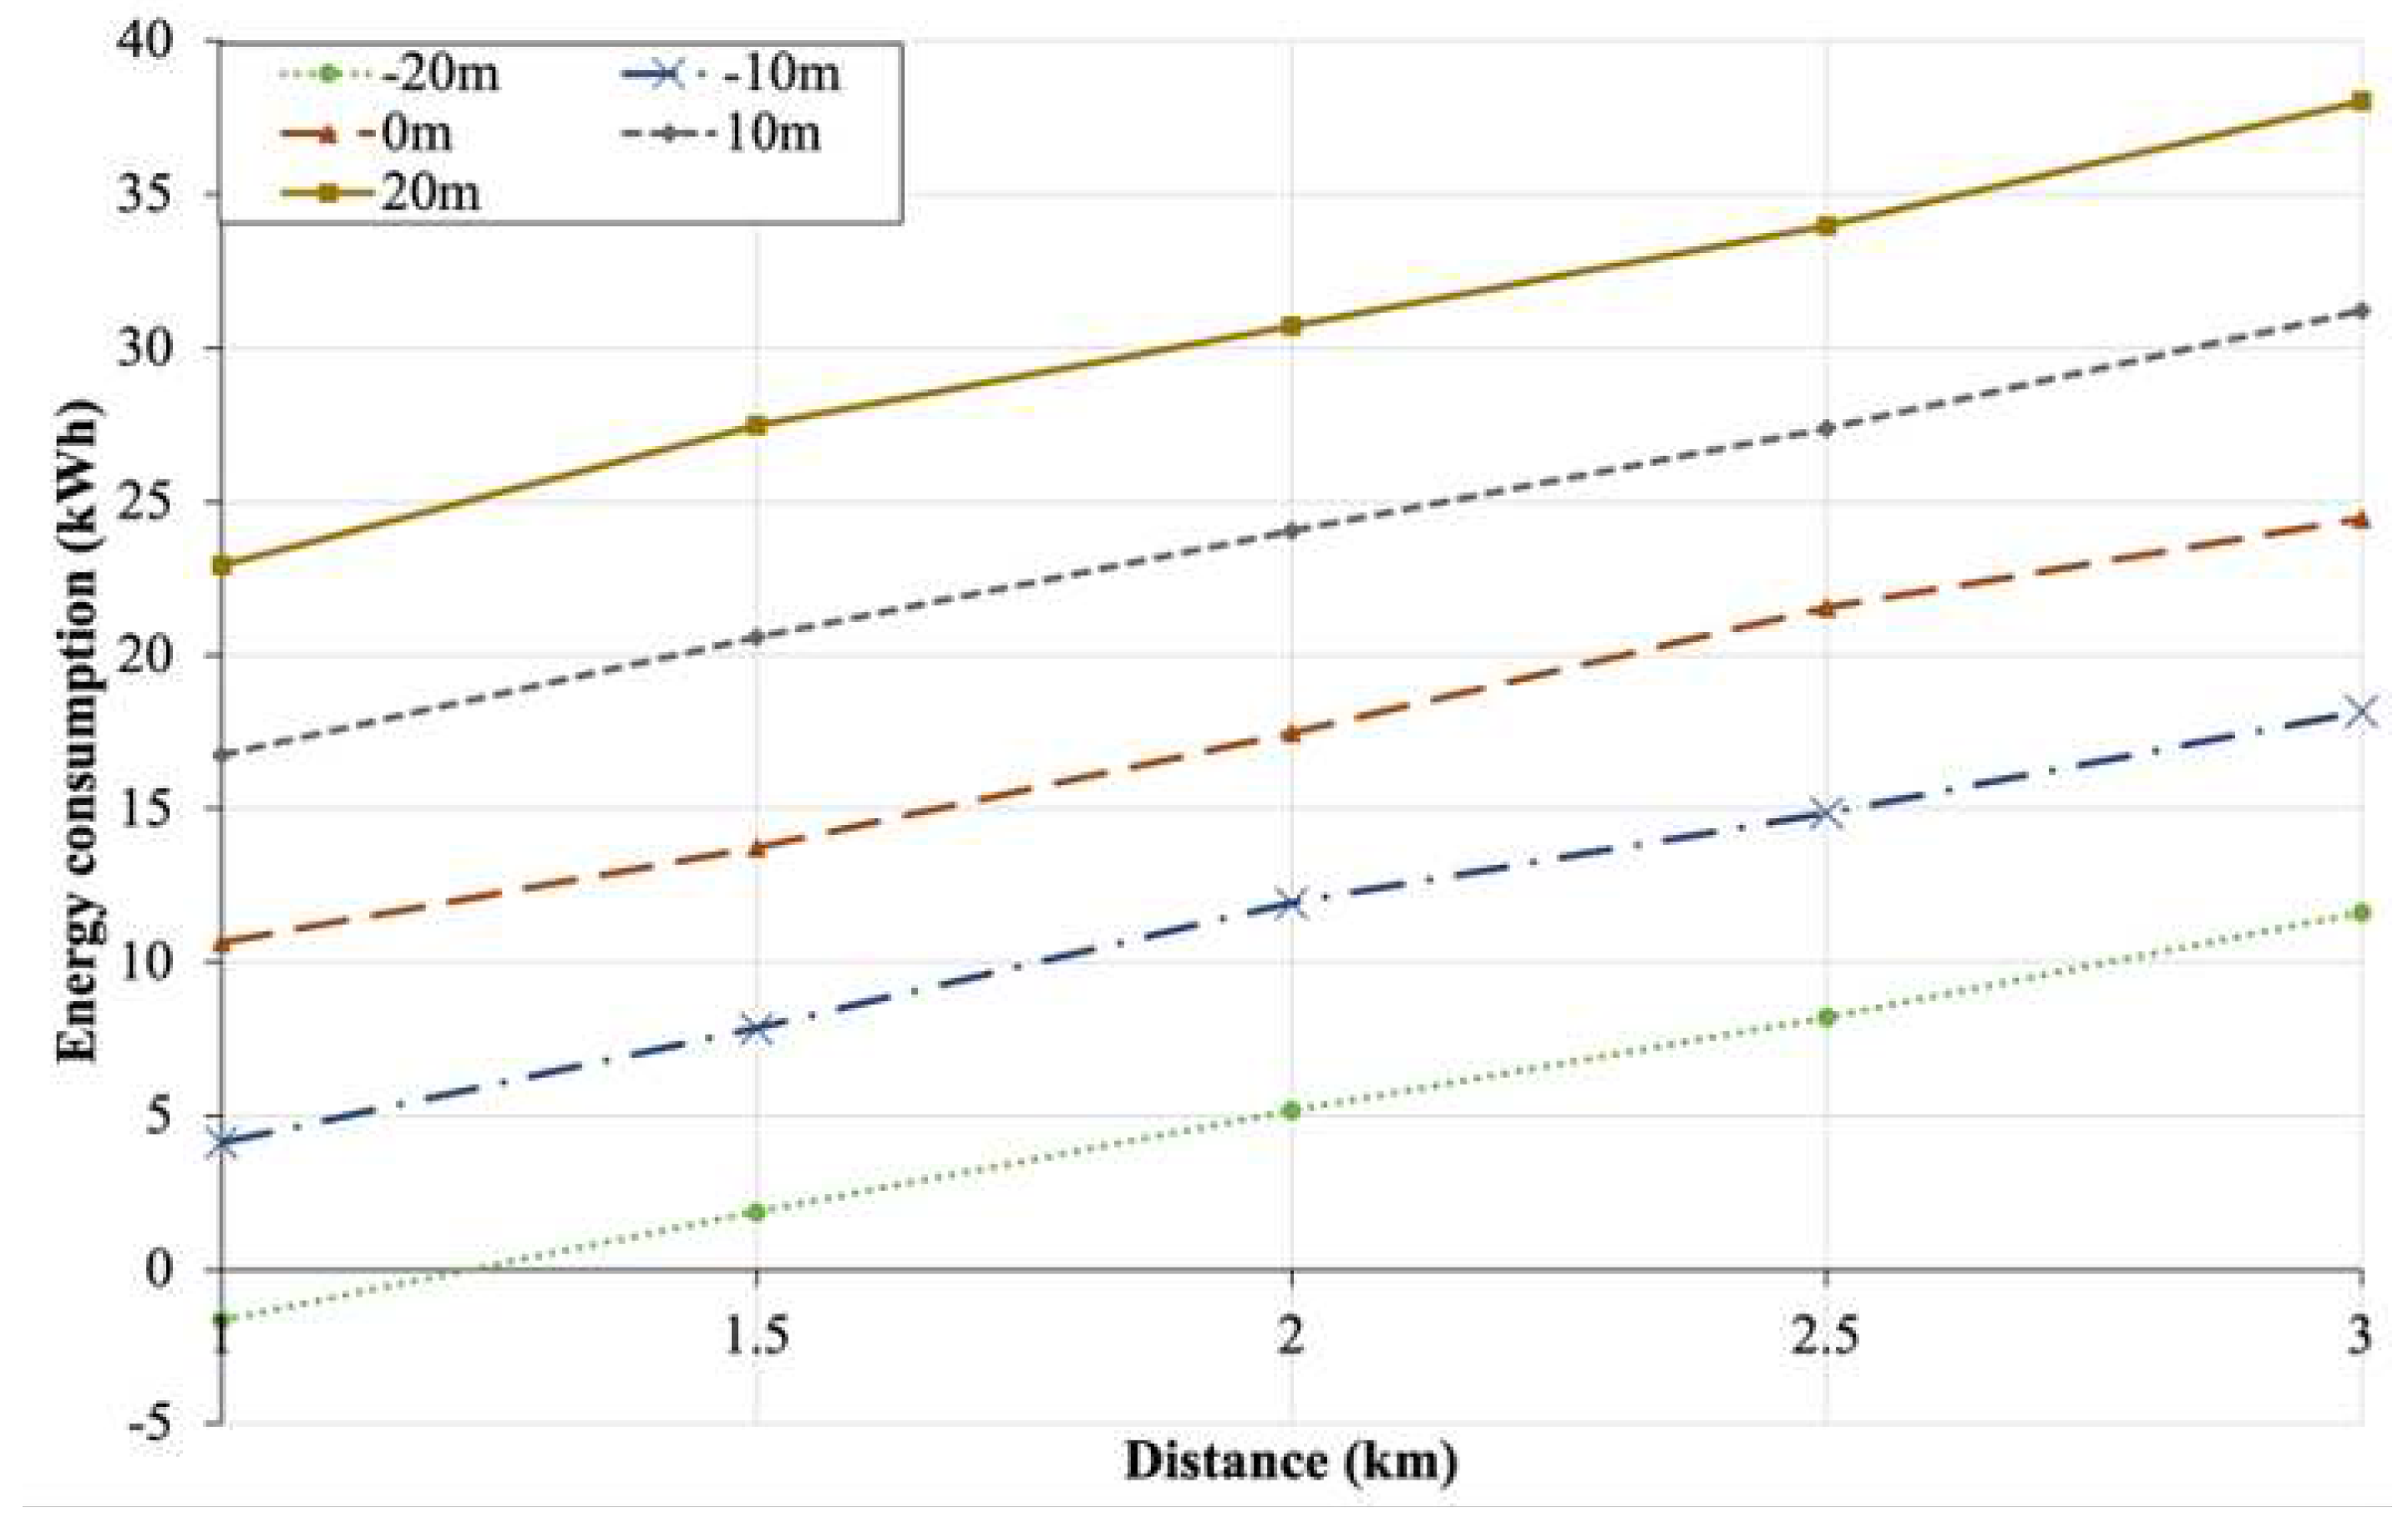
Figure 13 shows the results of the train’s energy consumption under different elevation levels between Station A and B from -20 m to + 20 m with the distance between the stations from 1 km to 3 km. The range of elevation is set according to the maximum and minimum track elevation of MRT Line 2. It can be observed that the greater the elevation between Station NB1 and NB2, the greater the train’s energy consumptions. This can be explained by the fact that the greater traction force must be applied to overcome the gravitational force for the steeper inclination to keep the train at a constant speed. This is consistent with Equation (
5), where the higher the elevation, the larger the gradient resistance force,
.
Conversely, when
is negative or when the train is moving in a downward direction, it will cause energy consumptions to decrease because the downhill helps the train to reach its targeted speed in a shorter time and the train must apply a brake to slow down the speed of the train. When the train applies the brake, the train regenerates the braking energy and deliver to the grid. Besides, it is also noted that the train’s energy consumptions in
Figure 13 increases as the distance between the two stations increases because the train journey time from Station NB1 to NB2 increases. The energy consumptions of the train with the track elevation of +20 m at the distance of 3 km between the two stations is 227% higher than that of -20 m. The energy consumption becomes negative for the elevation of -20 m and the distance between two stations of 1 km because the traction power is recuperated from the regenerative braking to the grid.
Figure 13.
Energy consumptions of train between Station NB1 and NB2 for different track elevations under different distances.
Figure 13.
Energy consumptions of train between Station NB1 and NB2 for different track elevations under different distances.
4.3. Case studies for train’s energy consumption under different track curvature
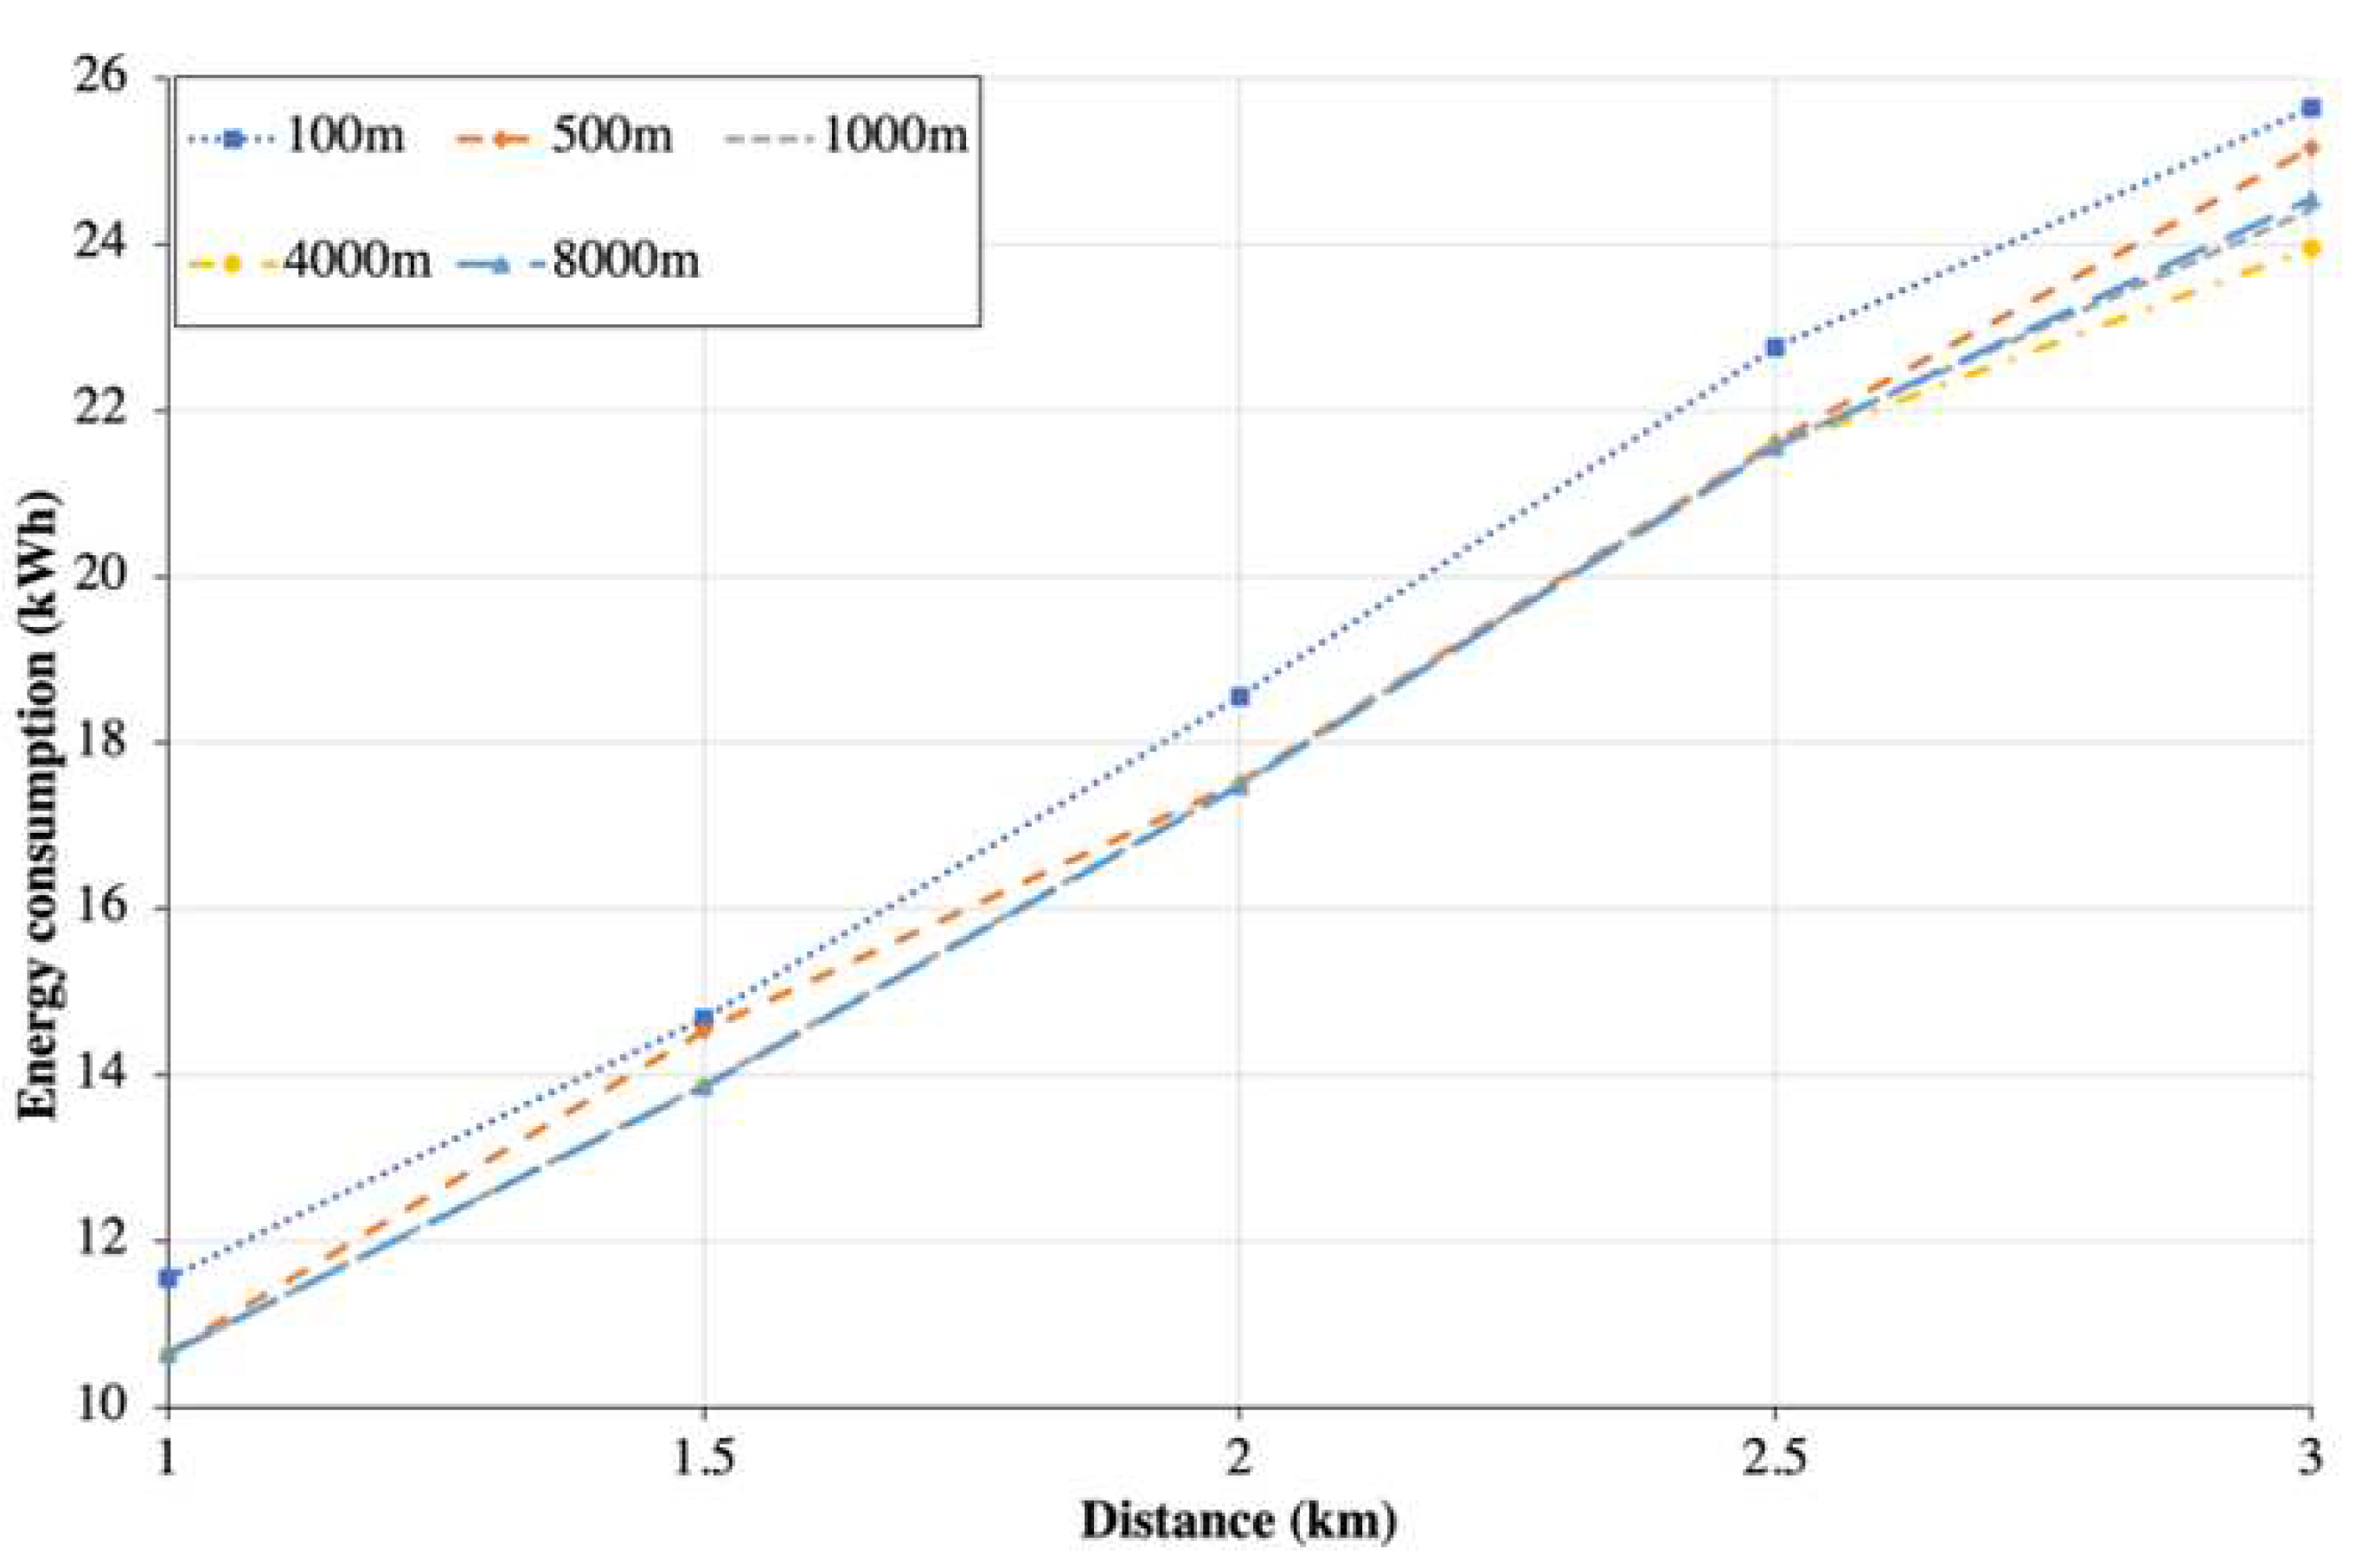
Figure 14 shows the train’s energy consumption when the bend radius of the track increases from 100 m to 8000 m, with the total distance between Station NB1 and NB2 changing from 1 km to 3 km. These bend radii are obtained from the design parameters of MRT Line 2. The result shows that the effect of bend radius on the energy consumptions is not significant because the curvature force is much smaller as compared to the acceleration force and rolling stock resistance. The difference of energy consumptions of the train for the bend radius of 100 m and 8000 m at the distance of 3 km between the two stations is 4.4%.
Figure 14.
Energy consumption results of train transit between Station NB1 and NB2 for different track curvatures under different distances.
Figure 14.
Energy consumption results of train transit between Station NB1 and NB2 for different track curvatures under different distances.
4.4. Case studies for recuperation of braking energy under different civil alignment parameters
The recuperation of the train’s braking energy under different civil alignment configurations is as shown in
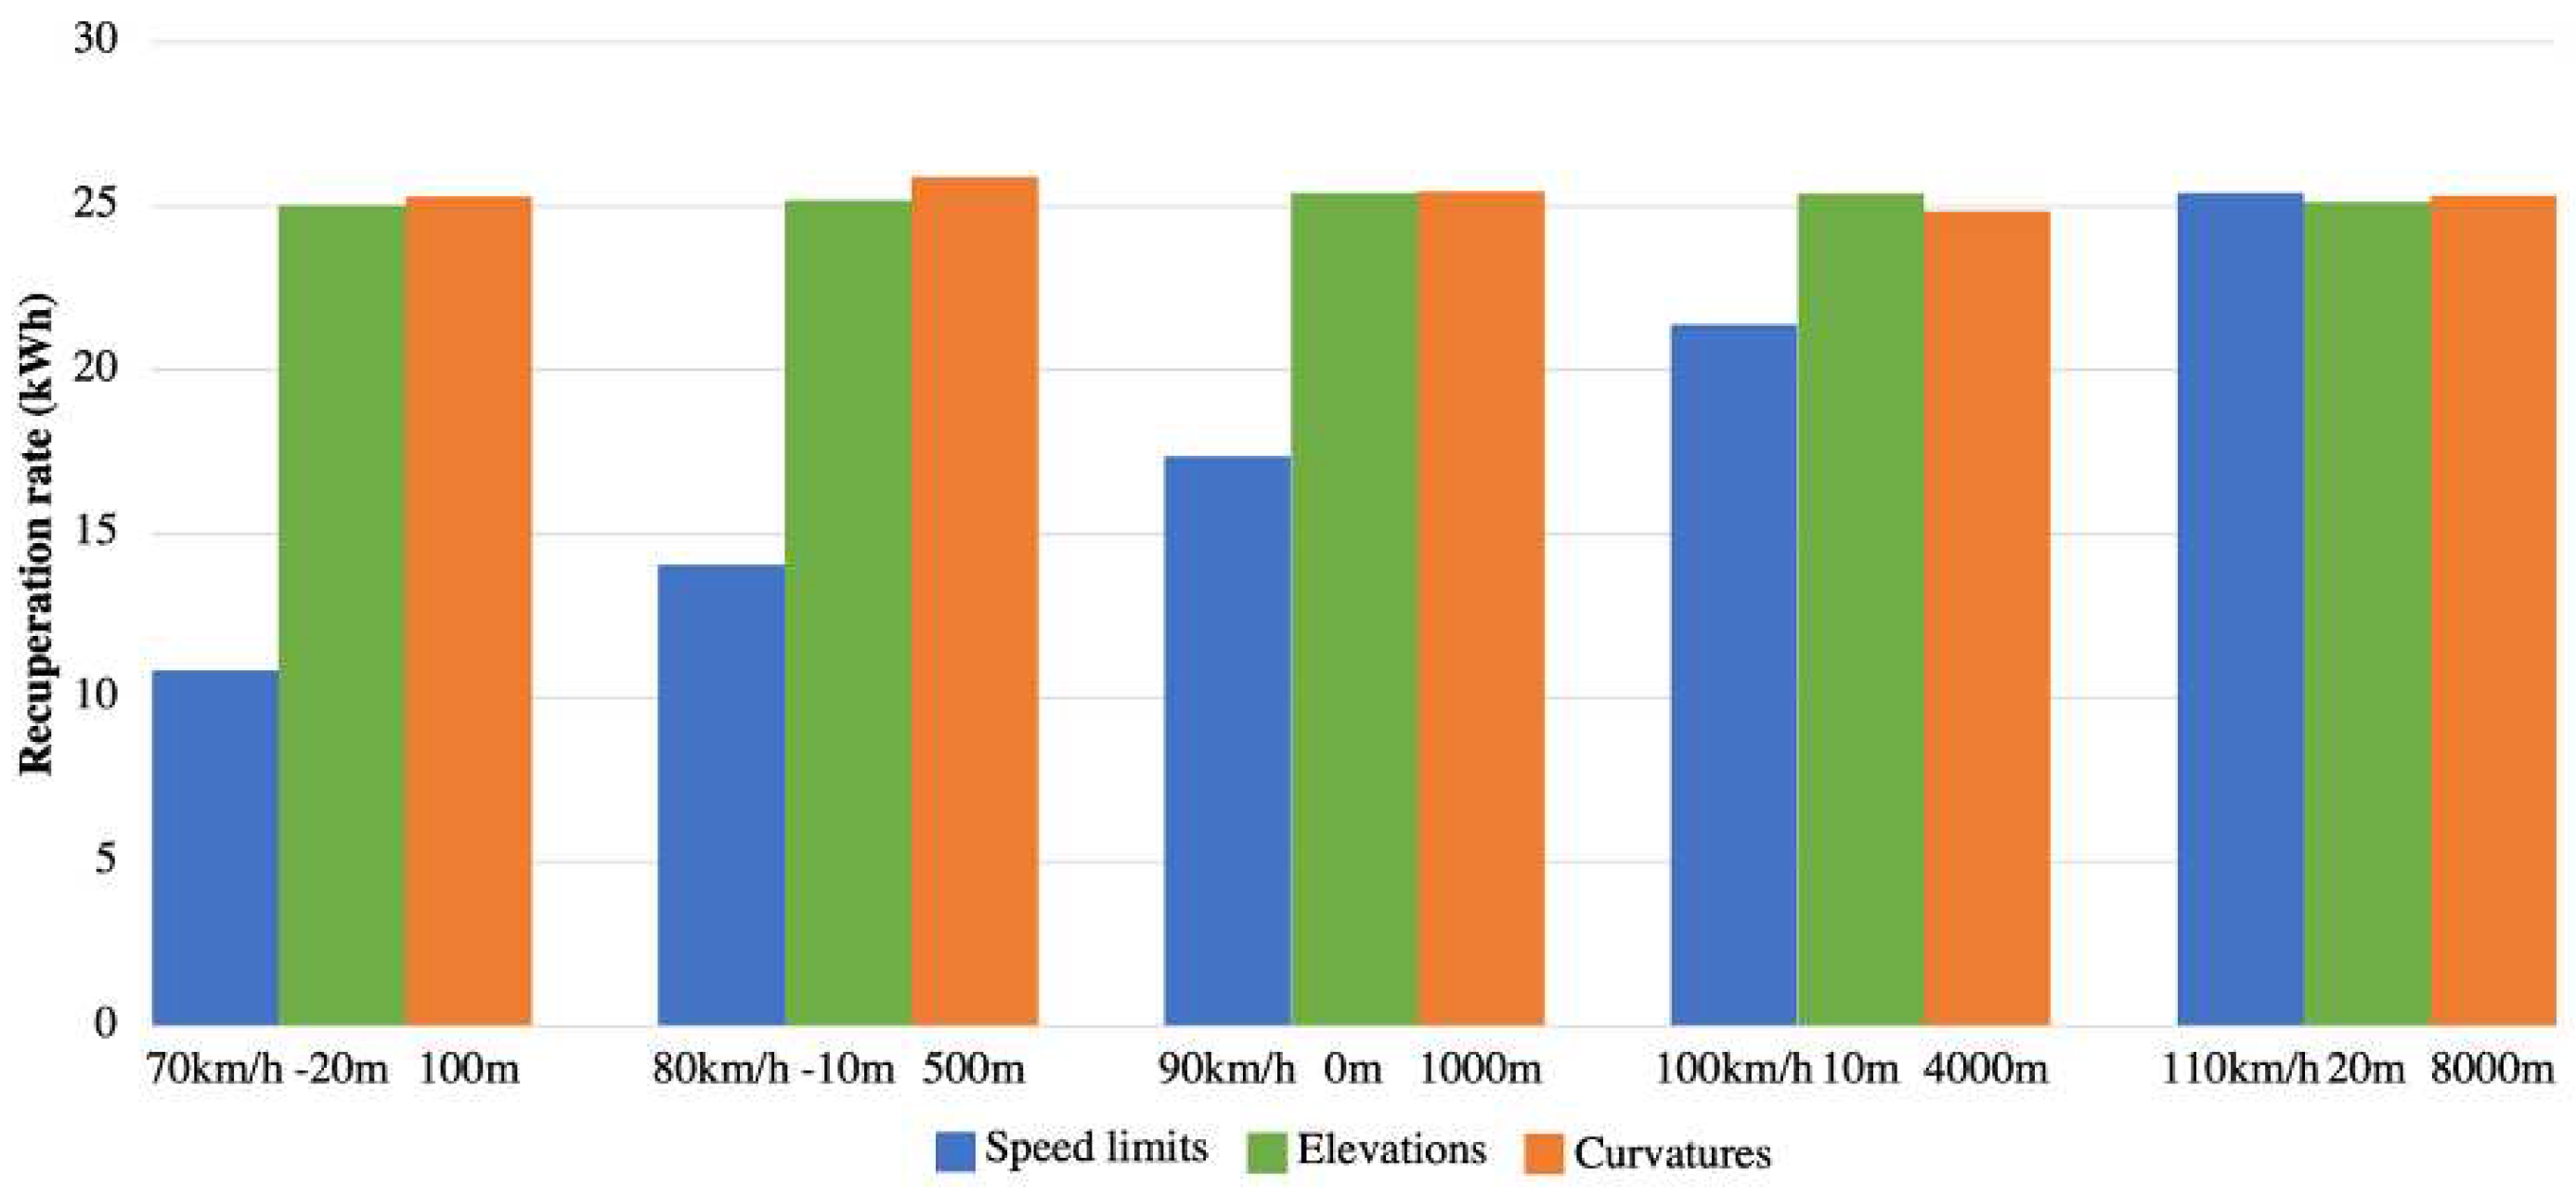
Figure 15. The recuperation of the train’s braking energy is obtained by comparing the energy consumptions of the train with- and without the RBE recovery. The 3 km distance between two stations is selected because it has the highest energy consumptions.
Figure 15.
Regenerative braking energy recovery results of train transit between Station NB1 and NB2 under different speed limits, elevations, and track curvatures.
Figure 15.
Regenerative braking energy recovery results of train transit between Station NB1 and NB2 under different speed limits, elevations, and track curvatures.
It can be seen in
Figure 15 that the changes in elevation and track curvature have a little effect on the recuperation rate of the braking energy. The recuperation rate of the trains when traveling downwards is almost the same compared to that of the train traveling upwards. However, a substantial difference in the recuperation rate of RBE is observed when the speed limits varied from 70 km/h to 110 km/h. This is because when the speed of the train is high, the momentum of the train is high, hence resulting into a high recuperation of RBE.
4.5. Case studies for variation of headway time
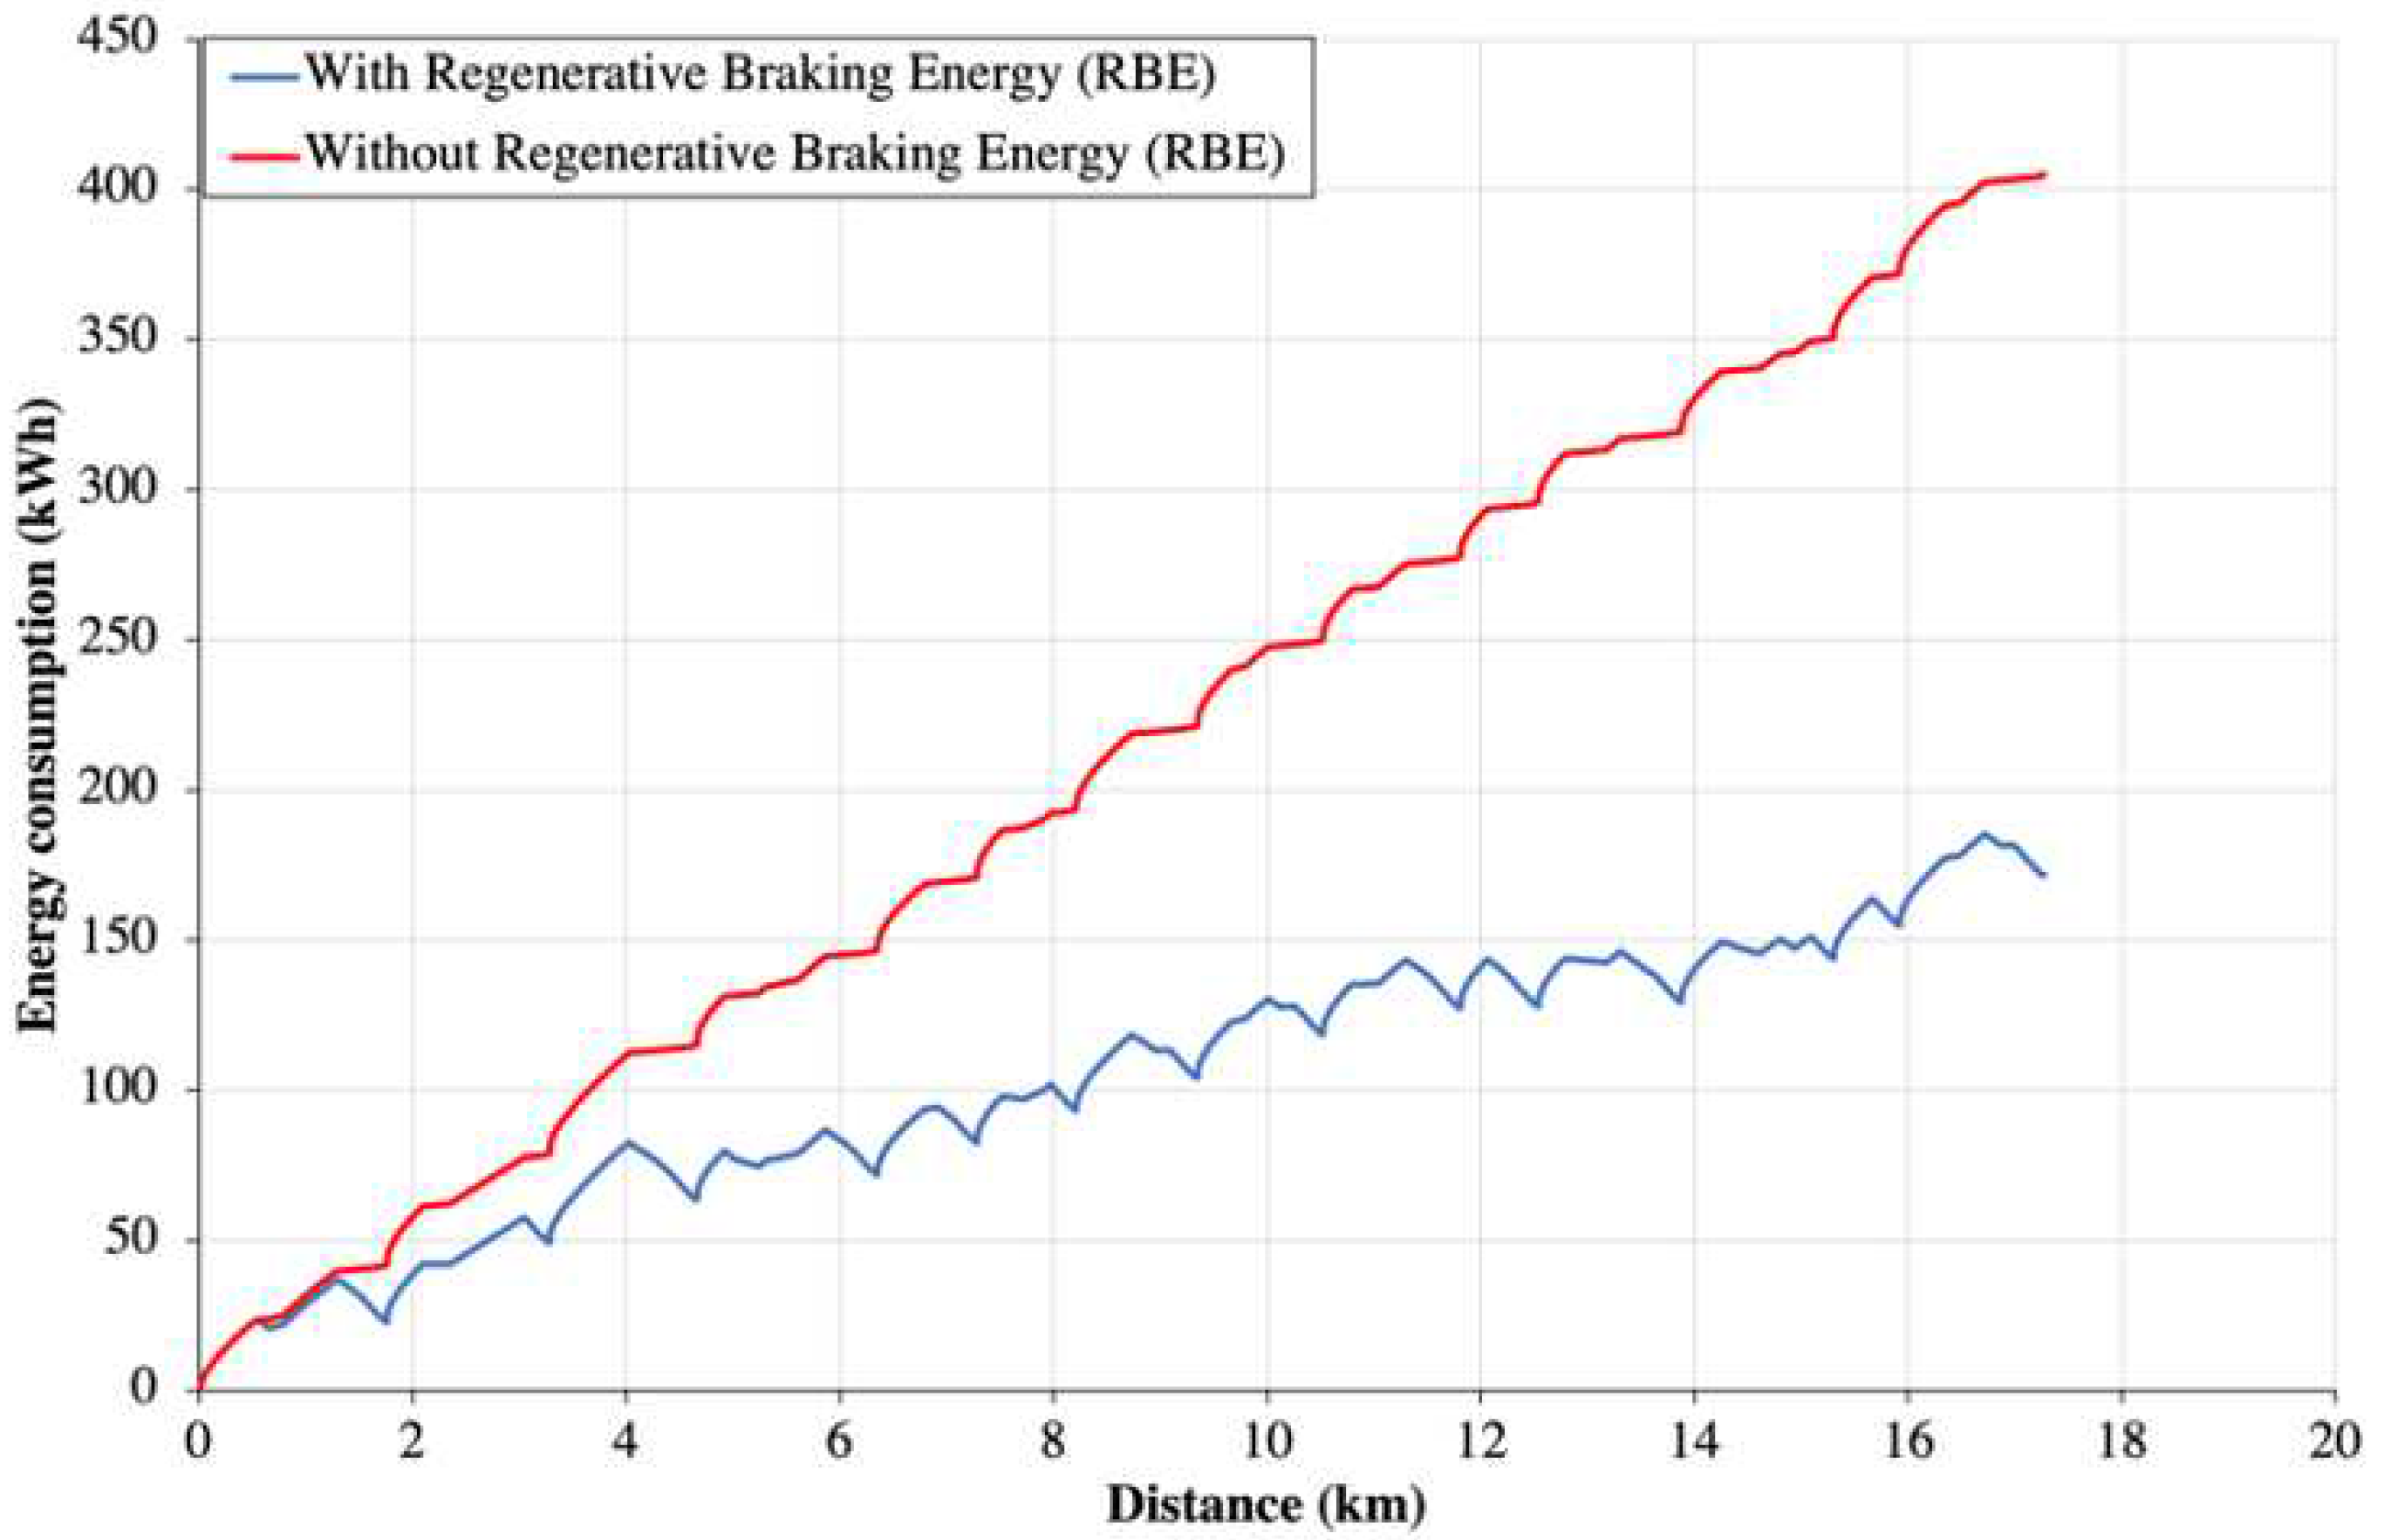
Figure 16 shows the total energy consumptions of the MRT Line 2 system for the trip of a single train travels from Damansara Damai to Kampung Baru North for the case with- and without RBE recovery. It can be seen that the train traveled without the RBE is 2.3 times higher than that of the train traveled with RBE. In other word, the energy consumption of the train without RBE consume 132% higher than that of the train with RBE.
Figure 16.
Energy consumption of train travel from Damansara Damai Station to Kampung Baru North Station.
Figure 16.
Energy consumption of train travel from Damansara Damai Station to Kampung Baru North Station.
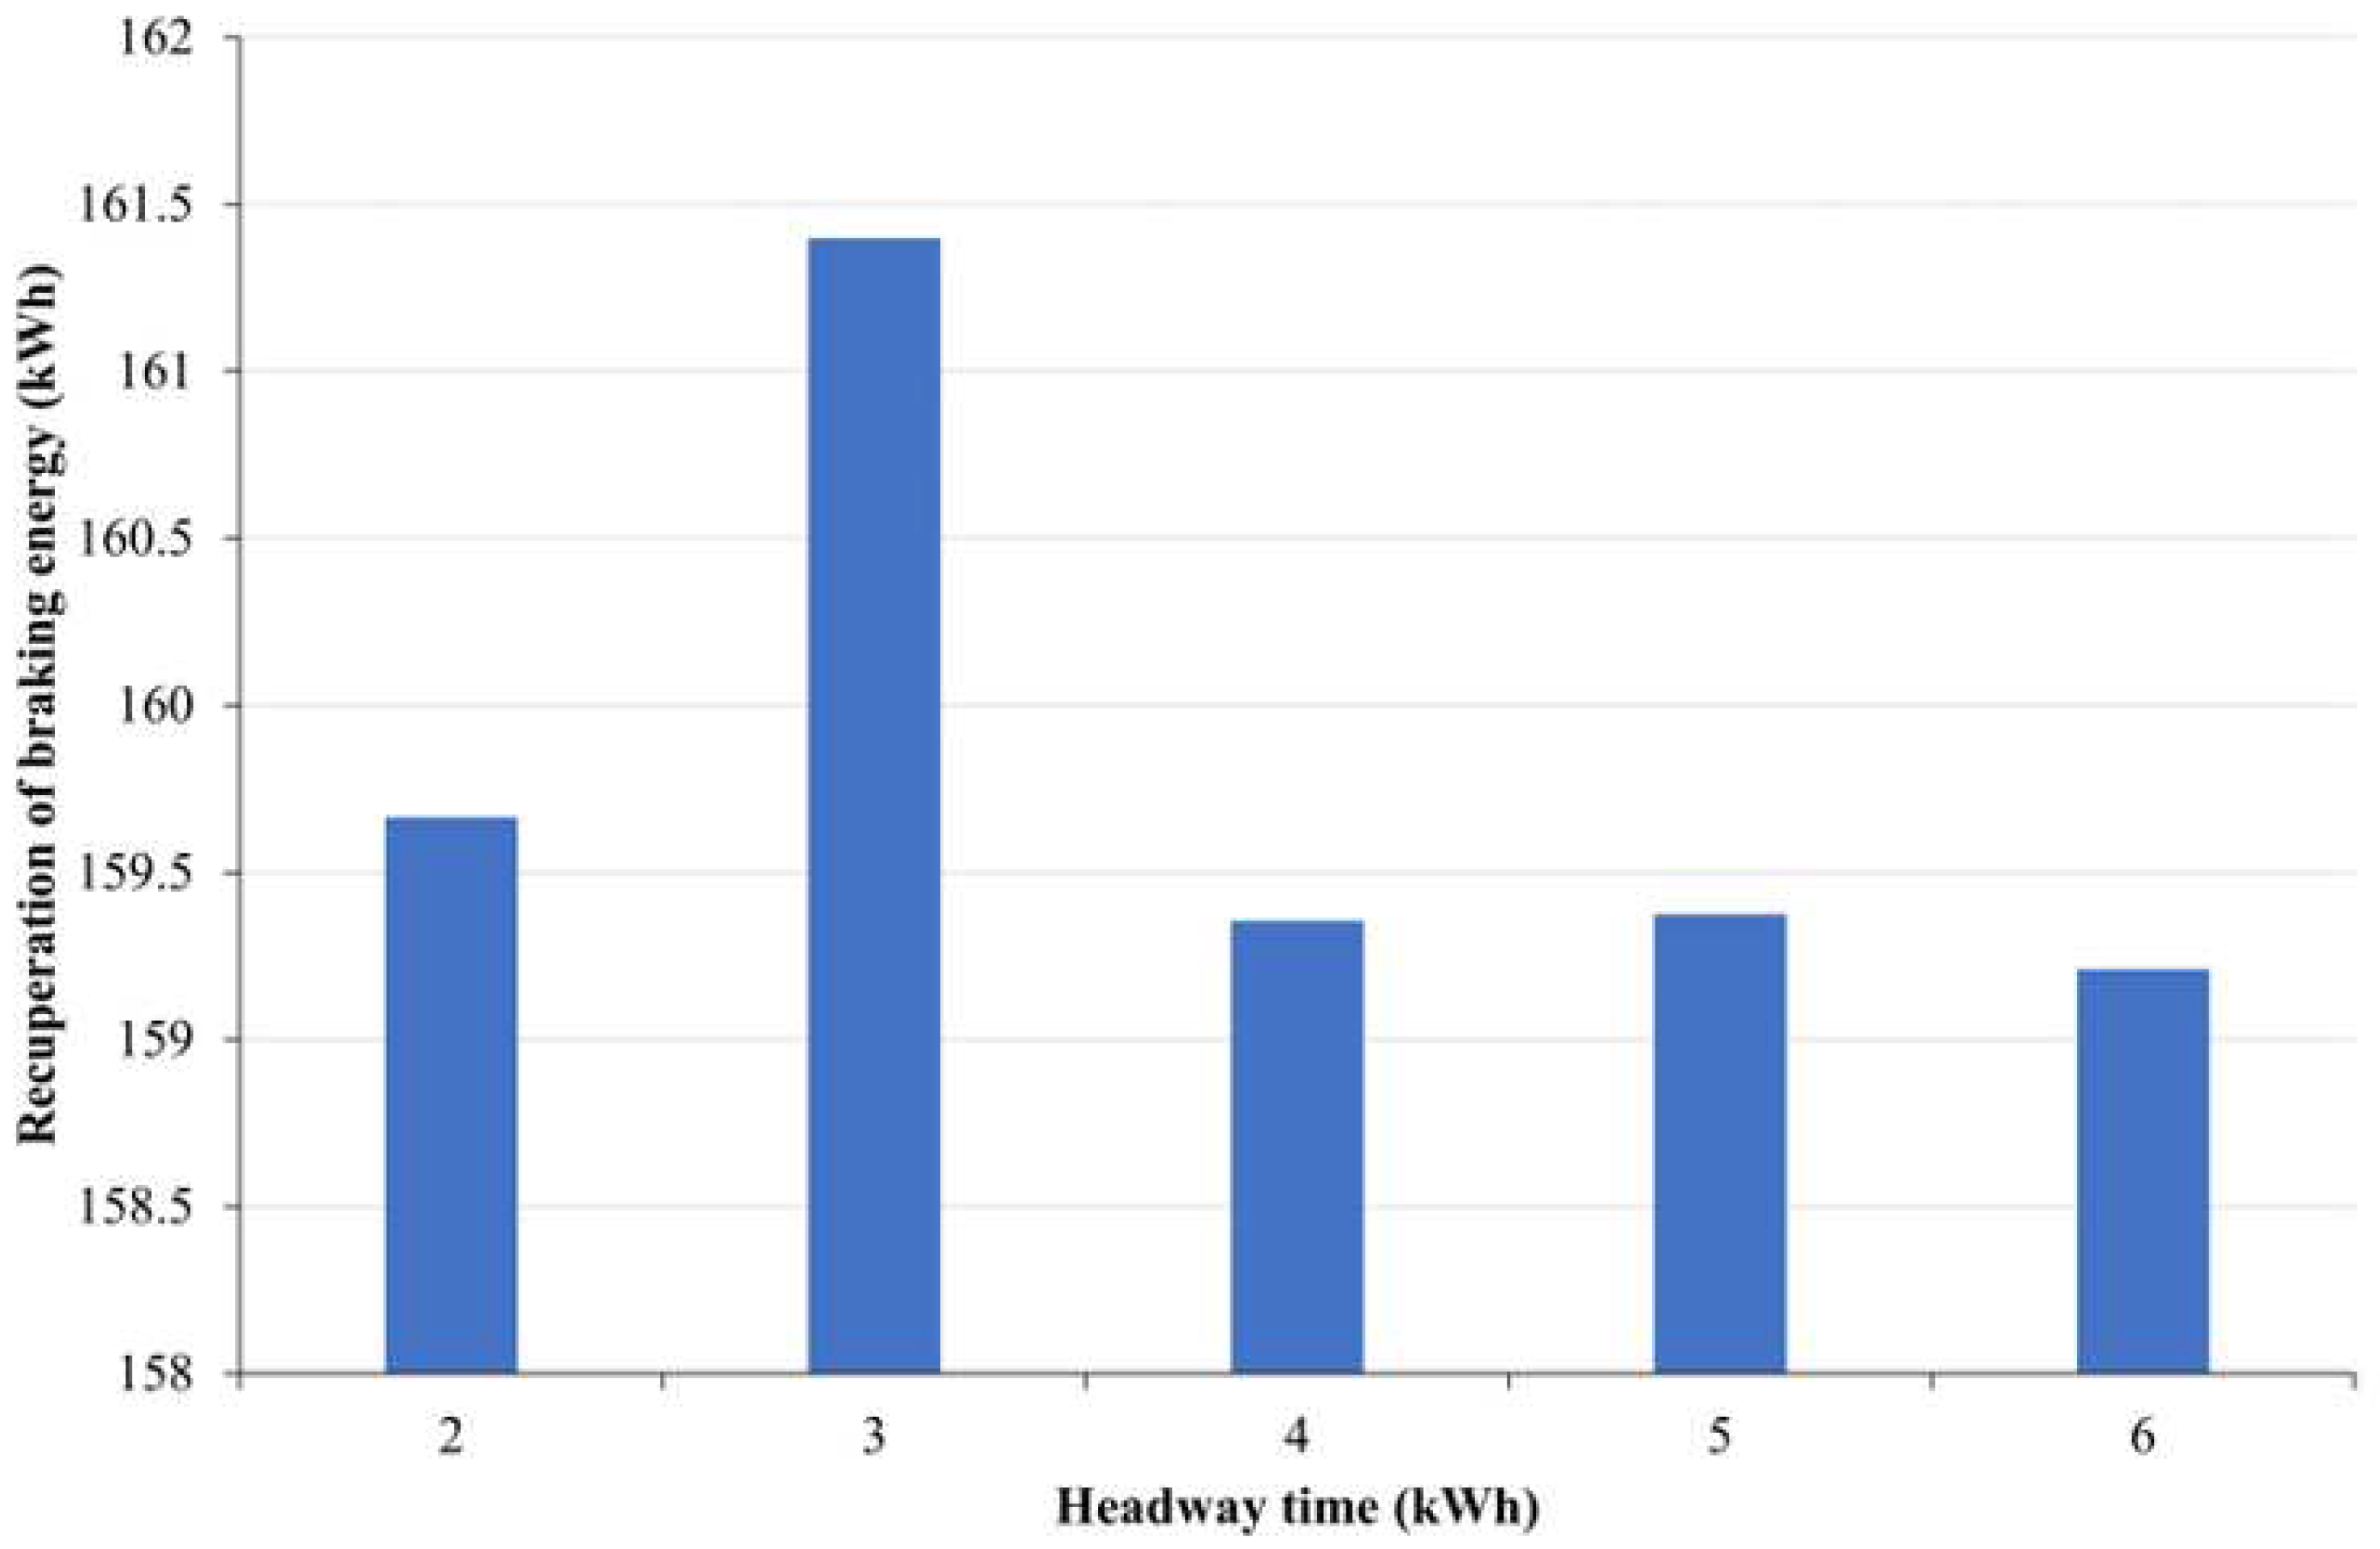
The results from the previous case studies were obtained using a 1.82-minute headway time, as provided by the railway operators. To cater to the varying passenger demands during peak and off-peak periods, train schedules with different headways are implemented. Consequently, it becomes necessary to examine the RBE amount under various headway conditions. As can be seen from
Figure 17, it is evident that the 3-minute headway time exhibits the highest RBE amount, with a difference of 2.2 kWh compared to the 6-minute headway time. This can be attributed to the high synchronizing rate between the arrival and departure trains, which enhances the natural exchange of RBE between the trains within a station.
Figure 17.
Recuperation of braking energy of MRT Line 2 at different headway time.
Figure 17.
Recuperation of braking energy of MRT Line 2 at different headway time.
5. Conclusion
In this paper, the impacts of the speed limit, track elevation, track curvature, and different headway times on the energy consumptions and recuperation rate of regenerative braking energy for a DC third rail system have been evaluated. The amount of energy consumption was found to be significantly changed when the track elevations are increased or decreased. By comparison, the influence of the speed limits and track curvatures is negligible. This is due to its association with the aerodynamic drag force being weaker compared to other forces that impact the train. However, the train’s speed limit has the greatest influence on the recuperation of RBE compared to track elevations and track curvatures. Additionally, the train with RBE can save up to 232 kWh of the overall energy consumptions for a single trip. The most optimum headway time is 3 minutes, during which the highest amount of RBE can be recuperated.
Acknowledgments
The authors would like to express their cordial thanks to Pestech Technology Sdn. Bhd. and CRSE Sdn. Bhd. for providing the research grant (8049/000) for this research. The authors would also like to express their gratitude to Universiti Tunku Abdul Rahman (UTAR) and Centre for Railway Infrastructure and Engineering (CRIE) for their support in this research.
Conflicts of Interest
The authors declare no conflict of interest.
References
- A. Pomykala; and A. Szelag,; “Reduction of Power Consumption and CO2 Emissions as a Result of Putting into Service High-Speed Trains: Polish Case,” Energies (Basel), vol. 15, no. 12, Jun 2022. [CrossRef]
- C. E. S. De Andrade and M. de A. D’Agosto, “The role of rail transit systems in reducing energy and carbon dioxide emissions: The case of the city of Rio de Janeiro,” Sustainability (Switzerland), vol. 8, no. 2, 2016. [CrossRef]
- I. - International Energy Agency, “The Future of Rail Opportunities for energy and the environment IN COLLABORATION WITH.”.
- K. H. Chua, D. S. Hoo, Y. S. Lim, M. BabrdelBonab, L. Wang, and P. Y. Wong, “Harmonic Analysis of a Third Rail Systems: A Case Study in Malaysia,” Journal of Electronics and Advanced Electrical Engineering, vol. 1, no. 2, pp. 26–33, May 2021. [CrossRef]
- S. Chen Kwan, M. Tainio, J. Woodcock, R. Sutan, and J. Hisham Hashim, “The Carbon Savings and Health Co-Benefits from the Introduction of Mass Rapid Transit System in Greater Kuala Lumpur, Malaysia,” J Transp Health, pp. 1–0, 2017. [CrossRef]
- M. Ogasa, “Energy saving and environmental measures in railway technologies: Example with hybrid electric railway vehicles,” IEEJ Transactions on Electrical and Electronic Engineering, vol. 3, no. 1, pp. 15–20, 2008. [CrossRef]
- M. Günay, M. E. Korkmaz, and R. Özmen, “An investigation on braking systems used in railway vehicles,” Engineering Science and Technology, an International Journal, vol. 23, no. 2, pp. 421–431, 2020. [CrossRef]
- D. Liu, S. Q. Zhu, Y. R. Bi, K. Liu, and Y. X. Xu, “Research on the Utilization of Metro Regenerative Braking Energy Based on an Improved Differential Evolution Algorithm,” J Adv Transp, vol. 2020. [CrossRef]
- M. Khodaparastan, Mohamed, Ahmed A., and Brandauer, Werner, “Recuperation of Regenerative Braking Energy in Electric Rail Transit Systems,” 2019. [CrossRef]
- J. Zhang, Y. Li, B. Li, and Y. Liang, “Research on Energy-saving Operation Optimization of Urban Rail Transit Trains,” in Journal of Physics: Conference Series, Institute of Physics Publishing, Jun. 2020. [CrossRef]
- M. Popescu and A. Bitoleanu, “A Review of the Energy Efficiency Improvement in DC Railway Systems,” Energies (Basel), vol. 12, no. 6, p. 1092, 2019. [CrossRef]
- P. Arboleya, B. Mohamed, and I. El-Sayed, “Off-board and on-board energy storage versus reversible substations in DC railway traction systems,” IET Electrical Systems in Transportation, vol. 10, no. 2, pp. 185–195, 2020. [CrossRef]
- D. Ramsey, T. Letrouve, A. Bouscayrol, and P. Delarue, “Comparison of Energy Recovery Solutions on a Suburban DC Railway System,” IEEE Transactions on Transportation Electrification, vol. 7, no. 3, pp. 1849–1857, 2021. [CrossRef]
- A. González-Gil, R. Palacin, and P. Batty, “Sustainable urban rail systems: Strategies and technologies for optimal management of regenerative braking energy,” Energy Convers Manag, vol. 75, pp. 374–388, 2013. [CrossRef]
- Y. Lu, Y. Zhao, X. Zhao, G. Li, and C. Zhang, “Status analysis of regenerative braking energy utilization equipments in urban rail transit,” 2017 IEEE Transportation Electrification Conference and Expo, Asia-Pacific, ITEC Asia-Pacific 2017. [CrossRef]
- S. S. Fazel, S. Firouzian, and B. K. Shandiz, “Energy-Efficient Emplacement of Reversible DC Traction Power Substations in Urban Rail Transport through Regenerative Energy Recovery,” International Journal of Railway Research, vol. 1, pp. 11–22, 2014.
- P. Drozdowski and A. Duda, “Modernised DC traction substation recuperating energy of braking,” E3S Web of Conferences, vol. 10, pp. 1–4, 2016. [CrossRef]
- P. Lukasiak, P. Antoniewicz, D. Swierczynski, and W. Kolomyjski, “Technology comparison of energy recuperation systems for DC rail transportation,” International Conference on Power Engineering, Energy and Electrical Drives, vol. 2015-Septe, pp. 372–376, 2015. [CrossRef]
- F. Fan and B. G. Stewart, “Power Flow Simulation of DC Railway Power Supply Systems with Regenerative Braking,” pp. 87–92, 2020. [CrossRef]
- Institute of Electrical and Electronics Engineers, 2019 21st European Conference on Power Electronics and Applications (EPE ’19 ECCE Europe).
- University of Nottingham, Institute of Electrical and Electronics Engineers, and E. International Transportation Electrification Conference (2018: Nottingham, 2018 IEEE International Conference on Electrical Systems for Aircraft, Railway, Ship Propulsion and Road Vehicles & International Transportation Electrification Conference (ESARS-ITEC): 7-9 Nov. 2018.
- W. Li, Q. Peng, C. Wen, S. Li, X. Yan, and X. Xu, “Integrated Optimization on Energy Saving and Quality of Service of Urban Rail Transit System,” J Adv Transp, vol. 2020. [CrossRef]
- X. Xu, K. Li, and X. Li, “A multi-objective subway timetable optimization approach with minimum passenger time and energy consumption,” J Adv Transp, vol. 50, no. 1, pp. 69–95, Jan 2016. [CrossRef]
- X. Li and H. K. Lo, “An energy-efficient scheduling and speed control approach for metro rail operations,” Transportation Research Part B: Methodological, vol. 64, pp. 73–89, 2014. [CrossRef]
- T. K. Ho, C. W. Tsang, K. H. Ip, and K. S. Kwan, “Train service timetabling in railway open markets by particle swarm optimisation,” Expert Syst Appl, vol. 39, no. 1, pp. 861–868, Jan 2012. [CrossRef]
- K. Kim, K. Kim, and M. Han, “Challenge A: A more and more energy efficient railway A Model and Approaches for Synchronized Energy Saving in Timetabling.”.
- K. K. Wong and T. K. Ho, “Coast control for mass rapid transit railways with searching methods,” IEE Proceedings: Electric Power Applications, vol. 151, no. 3, pp. 365–375, May 2004.
- Y. Zhou, Y. Bai, J. Li, B. Mao, and T. Li, “Integrated Optimization on Train Control and Timetable to Minimize Net Energy Consumption of Metro Lines,” J Adv Transp, vol. 2018, Apr 2018. [CrossRef]
- M. Wang, L. Wang, X. Xu, Y. Qin, and L. Qin, “Genetic Algorithm-Based Particle Swarm Optimization Approach to Reschedule High-Speed Railway Timetables: A Case Study in China,” J Adv Transp, vol. 2019, pp. 1–12, 2019. [CrossRef]
- M. Peña-Alcaraz, A. Fernández, A. P. Cucala, A. Ramos, and R. R. Pecharromán, “Optimal underground timetable design based on power flow for maximizing the use of regenerative-braking energy,” Proc Inst Mech Eng F J Rail Rapid Transit, vol. 226, no. 4, pp. 397–408, 2011. [CrossRef]
- X. LI and X. YANG, “A STOCHASTIC TIMETABLE OPTIMIZATION MODEL IN SUBWAY SYSTEMS,” International Journal of Uncertainty, Fuzziness and Knowledge-Based Systems, vol. 21, no. supp01, pp. 1–15, 2013. [CrossRef]
- G. Navarro, J. Torres, M. Blanco, J. Nájera, M. Santos-Herran, and M. Lafoz, “Present and Future of Supercapacitor Technology Applied to Powertrains, Renewable Generation and Grid Connection Applications,” Energies (Basel), vol. 14, no. 11, p. 3060, 2021. [CrossRef]
- N. Ghaviha, J. Campillo, M. Bohlin, and E. Dahlquist, “Review of Application of Energy Storage Devices in Railway Transportation,” Energy Procedia, vol. 105, pp. 4561–4568, 2017. [CrossRef]
- S. Koohi-Fayegh and M. A. Rosen, “A review of energy storage types, applications and recent developments,” J Energy Storage, vol. 27, no. November 2019, p. 101047, 2020. [CrossRef]
- A. Cunillera, A. Fernández-Rodríguez, A. P. Cucala, A. Fernández-Cardador, and M. C. Falvo, “Assessment of the worthwhileness of efficient driving in railway systems with high-receptivity power supplies,” Energies (Basel), vol. 13, no. 7, pp. 1–24, 2020. [CrossRef]
- M. Domínguez, A. Fernández-Cardador, A. P. Cucala, and R. R. Pecharromán, “Energy savings in metropolitan railway substations through regenerative energy recovery and optimal design of ATO speed profiles,” IEEE Transactions on Automation Science and Engineering, vol. 9, no. 3, pp. 496–504, 2012. [CrossRef]
- M. Saleh, O. Dutta, Y. Esa, and A. Mohamed, “Quantitative analysis of regenerative energy in electric rail traction systems,” 2017 IEEE Industry Applications Society Annual Meeting, IAS 2017, vol. 2017-Janua, pp. 1–7, 2017. [CrossRef]
- A. Kara, K. Mardikyan, and S. Baran, “Application of regenerative braking energy to Istanbul metro operation system,” Electrical Systems for Aircraft, Railway and Ship Propulsion, ESARS, pp. 6–8, 2012. [CrossRef]
- A. Belay Kebede and G. B. Worku, “A research on regenerative braking energy recovery: A case of Addis Ababa light rail transit,” eTransportation, vol. 8, p. 100117, 2021. [CrossRef]
|
Disclaimer/Publisher’s Note: The statements, opinions and data contained in all publications are solely those of the individual author(s) and contributor(s) and not of MDPI and/or the editor(s). MDPI and/or the editor(s) disclaim responsibility for any injury to people or property resulting from any ideas, methods, instructions or products referred to in the content. |
© 2023 by the authors. Licensee MDPI, Basel, Switzerland. This article is an open access article distributed under the terms and conditions of the Creative Commons Attribution (CC BY) license (http://creativecommons.org/licenses/by/4.0/).
