Preprint
Article

Puebla City Water Supply from the Perspective of Urban Water Metabolism

Altmetrics

Downloads

354

Views

94

Comments

0

A peer-reviewed article of this preprint also exists.

Submitted:

03 July 2023

Posted:

05 July 2023

You are already at the latest version

Alerts
Abstract
Abstract: Urban population growth and the expansion of the built environment, pollution, overexploitation of water, inequality in water distribution, and the impacts of climate change in future availability of water, are all elements that jeopardize urban water security. Due to the complexity of urban water systems and their relevance for urban life, a holistic and integrative perspective is therefore needed to address such challenges. In this paper, Urban Water Metabolism (UWM) has been used for comprehensively understanding water (in)security in the City of Puebla (Mexico) and its metropolitan area. Water inflows and outflows have been estimated using a Material Flow Analysis (MFA) method with data either obtained from official sources or simulated with the Monte Carlo method. Our findings show that the UWM configuration in the City of Puebla and its metropolitan area is effective for generating profits to service providers and water related business, yet ineffective to guarantee citizens’ Human Right to Water and Sanitation (HRWS), a right recognized in the Constitution of Mexico. We conclude that to advance towards an inclusive and sustainable provision of water, economic interests must be reconsidered and therefore adjusted so they can be in line with such aspirational socioecological goals. UWM accounting can therefore inform new water governance arrangements, those based on both the best available knowledge and a vibrant participation of all relevant stakeholders.
Keywords: 
Subject: Environmental and Earth Sciences  -   Environmental Science

1. Introduction

More than half of the world's population currently lives in cities [1]. By 2050 urban population is expected to reach 68.4% of total population due to the addition of 2.43 billion urban inhabitants [2]. By the same year, urban population in Latin America and the Caribbean is projected to reach 90% of total population [3]. Under a tendential scenario, population growth will translate into a higher demand of resources, including water [4]. Water availability is however already compromised as a consequence of overexploitation, pollution and the impacts of climate change such as a reduction of precipitation in mid-latitudes where the City of Puebla is located [5,6].
Part of the Megalopolis Central Region, the City of Puebla and its metropolitan area (which comprise Tlaxcala) is the fourth largest metropolitan area in Mexico after those of Mexico City, Monterrey and Guadalajara [7]. Its population has grown consistently from 1.76 million inhabitants in 1990, 2.27 million in 2000, and 2.72 million in 2010, up to 2.94 million inhabitants in 2018 (of whom 1.67 million resided in the “central city” or the municipality of Puebla) [8]. Due to population growth and the advancement of industrial activities, water sources have been increasingly exploited, quickly reducing the average annual water availability of the local aquifer from 44.64 Mm3/yr in 2015 to 20.66 Mm3/yr in 2020 [9,10].
To move towards a long-term sustainable use of water, and certainly to address urban sustainability, a comprehensive perspective is required to grasp the complexity of the challenge [11]. Urban Metabolism (UM) is an appropriate approach that has its historical origins in the concept of “social metabolism” of Marx's economic theory [12,13]. This concept regained relevance applied to cities due to Abel Wolman's article "the metabolism of cities" [14]. The UM metaphor implies understand a city analogously to a living organism that feeds, accumulates, and excretes energy and matter, involving the use of certain information for decision making (scare and poor information presupposes limited capacities for decision making) and, in some cases, considering mechanisms for “closing cycles” which are at the base of urban circularity [15]. This holistic approach of urban metabolism accounting helps to interweave into a central model urban energy and material inflows, distribution, outflows and the potentiality for circularity, allowing to understand much better the regulating functions that shape such metabolic processes and the associated multidimensional impacts, synergies and trade-offs. According to Kennedy et al., UM is defined as “the total sum of the technical and socio-economic processes that occur in cities, resulting in growth, production of energy, and elimination of waste” [4]. Similarly, Urban Water Metabolism (UWM) refers to the UM metaphor applied only to water flows.
UM and UWM studies have been frequently associated to engineering notions of water management and thus to more traditional industrial ecology approaches, yet a hybridization with other inter and transdisciplinary disciplines and fields of knowledge [16,17]. Studies vary from the assessment of multiscale institutional programs [18], the evaluation of city water (in)efficiency [19,20,21] or the integration of the urban nexuses approach to UM or UWM studies (e.g., Water-Energy-Carbon Nexus) [22,23,24,25], to the analysis of climate change implications and health impacts of pollution into UM and UWM [26,27,28]. Some UM and UWM studies have also analyzed economic, political, and sociocultural aspects that have triggered injustices and conflicts in different historical and spatial contexts [29,30,31,32,33].
In Latin America, the number of UM studies is noticeable lower compared to Europe, USA or Asia [34], and only a fraction of them specifically deals with water. Some works apply the concept without quantifying flows and stocks [35,36,37,38,39], others partially include quantitative elements [40,41] or information from internal system processes [42,43,44,45], while others offer a material balance of inputs and outputs of the entire urban system, including its subprocesses [46,47]. Some of them include returning flows, moving from linear to circular UM approaches [48,49,50,51]. Must of UM and UWM case studies revisit large cities, neglecting the analysis of small and medium cities despite that the latter are those expected to growth the most [34]. Fewer than half of the above studies include bottled and tanker truck water flows in their analysis.
In the City of Puebla, an environmental historical accounting of water appropriation framed withing the social metabolism theory [52,53]. No UWM studies have been identified for the case of the City of Puebla and its metropolitan area neither in Scopus, the Web of Science or Google Scholar. The nearest type of water accounting studies at the urban scale, besides those related to water availability and water quality [54,55,56,57,58,59,60,61,62,63,64,65,66,67,68,69], comprises the assessment of rainwater capture potential which has been evaluated using a system dynamic model [70].
This paper offers the first UWM accounting for the City of Puebla, a medium-sized city struggling with limited water availability, increasing exploitation of the Puebla Valley Aquifer (PVA) [67,68,69,71], inefficient and inequitable distribution of water [33,70], service cuts to dwellings due to non-payment, excessive charges for users [72], water contamination and prevalence of diseases in communities nearby contaminated water bodies [54,55,57,62,73,74], as well as with water related socio-environmental conflicts [31,75] within a context of privatization of the public water service (which legally took place in December 2013). All the above, and certainly the latter, has affected guaranteeing the Human Right to Water and Sanitation (HRWS).
The accounting model is based on a Material Flow Analysis (MFA) method to balance the flows, using the Monte Carlo simulation to estimate bottled and tankered water consumption flows for which there are no official records. Rainfall and runoff over the urbanized surface have been estimated in accordance with the standard NOM-011-CONAGUA-2015. The UWM approach described and applied below to the City of Puebla has allowed us to assess the diversity and complexity of urban water issues from a systemic perspective, relating the magnitudes found by the model to the water problems mentioned above and the associated expressions of social contestation, but also recognizing the potential of the model for social empowerment and thus, for ultimately enabling the advancement of a more sustainable, inclusive and just urban water governance.

2. Materials and Methods

MFA method was applied to estimate the UWM of the City of Puebla and its metropolitan area [76], with the support of the software STofflussANalyse (STAN) version 2.6 developed by the Vienna University of Technology (https://www.stan2web.net/). Water loss by electrolysis was considered negligible. Energy flows and CO2e emissions, the distribution and drainage networks' weight, and materials related to drinking and wastewater treatment, which were estimated only for the water utility's processes, were calculated. The consumption of virtual water and indirect energy consumption associated to the UWM of the City of Puebla and its metropolitan area were not estimated.

2.1. UWM conceptual model and its energy and carbon nexus

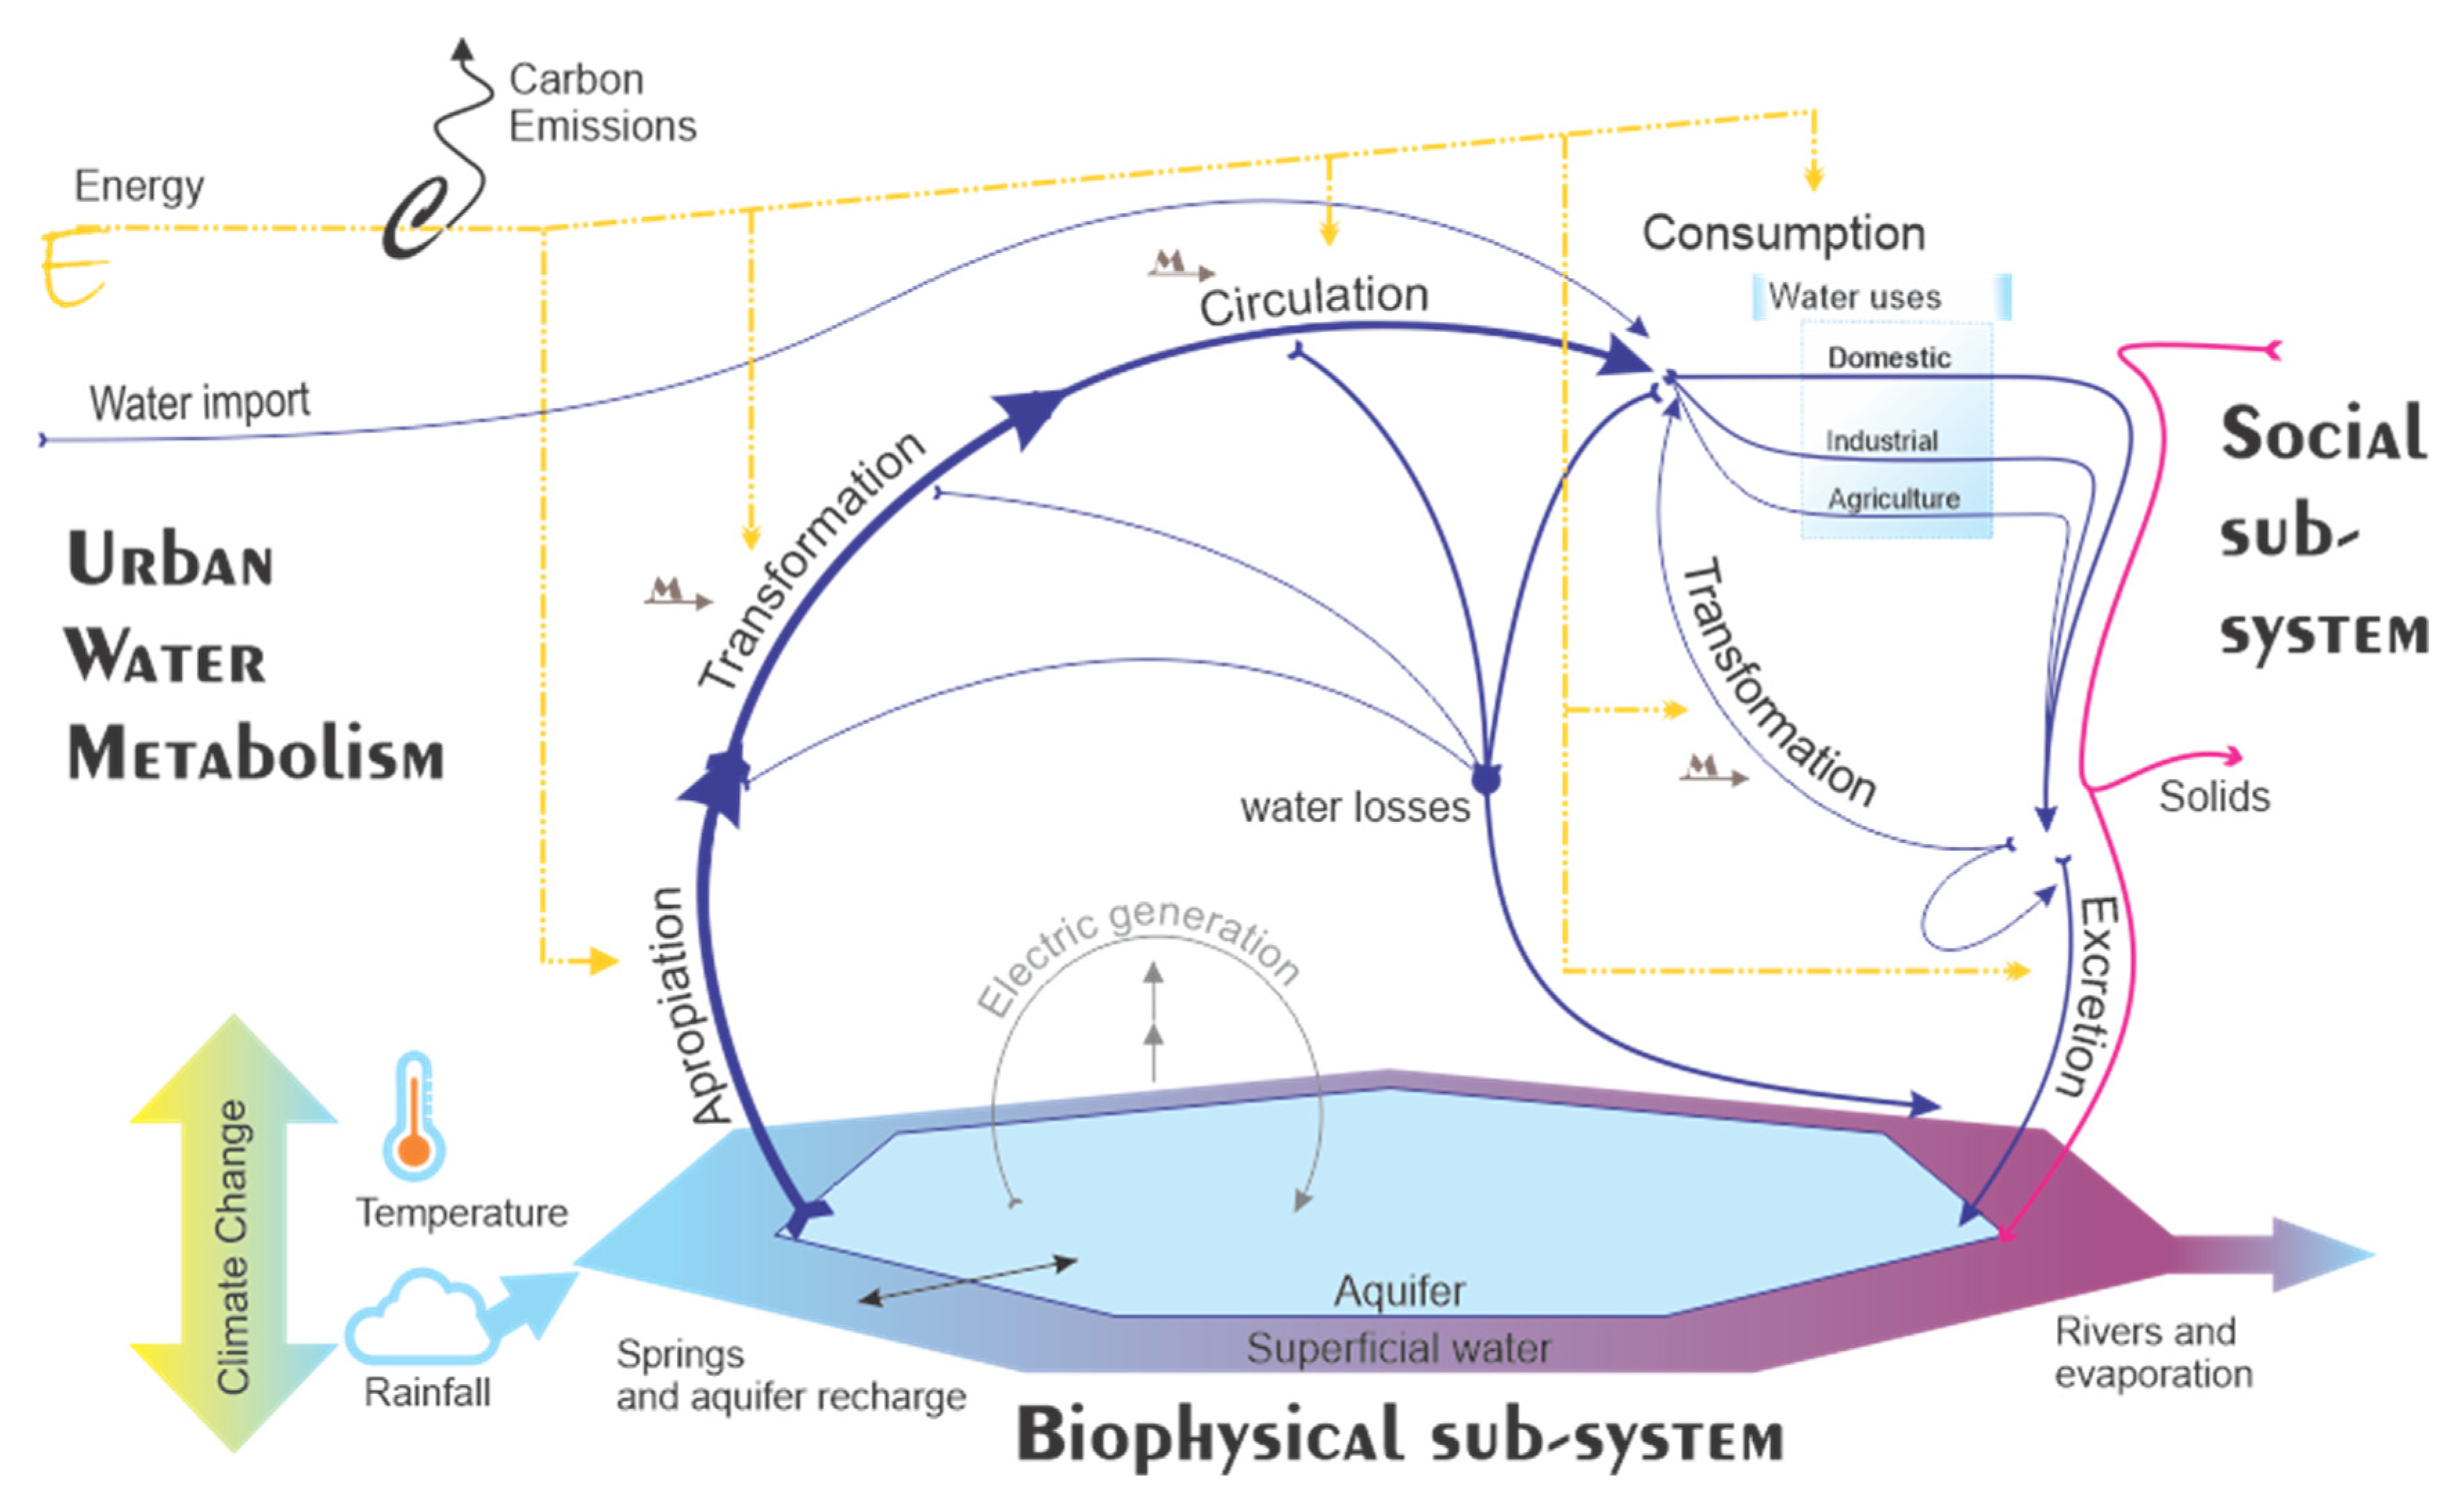
Our water system model is composed by two subsystems: a biophysical and a social subsystem. The first one corresponds to the natural water dynamics, i.e., the hydrological cycle. The second one relates to the social dynamics that shape and reshape our first subsystem and the system as a whole. Those dynamics, following González de Molina and Toledo [77]: appropriation, transformation, circulation, consumption, and excretion.
Appropriation refers to withdrawals from the surface, groundwater, and rainwater harvesting. Importation refers to water appropriated from outside the spatial limits of the study and consumed within the city. Transformation refers to the water utility's potable and wastewater treatment processes and the Local Purified Water Companies (LPWC). Circulation refers to water distribution, either through pipe networks, water trucks or bottled, from its sources to consumption and excretion. Is in this stage that the Human Right to Water may or may not be guaranteed to all urban inhabitants. Consumption refers to the multiple uses of water, being the process that drives the rest of the UWM processes. The Excretion process alludes to the return of treated or untreated water to the biophysical subsystem, evaporation, leakages and losses along the distribution network or within dwellings. In this last stage the Human Right to Sanitation is in play. See Figure 1.
It is to be pointed out that due to the complex dynamics of the natural water cycle, the spatial unit of analysis do not correspond or is not limited to the urbanized area, it is rather the local aquifer area as explained further in the following section.

2.2. Study area delimitation

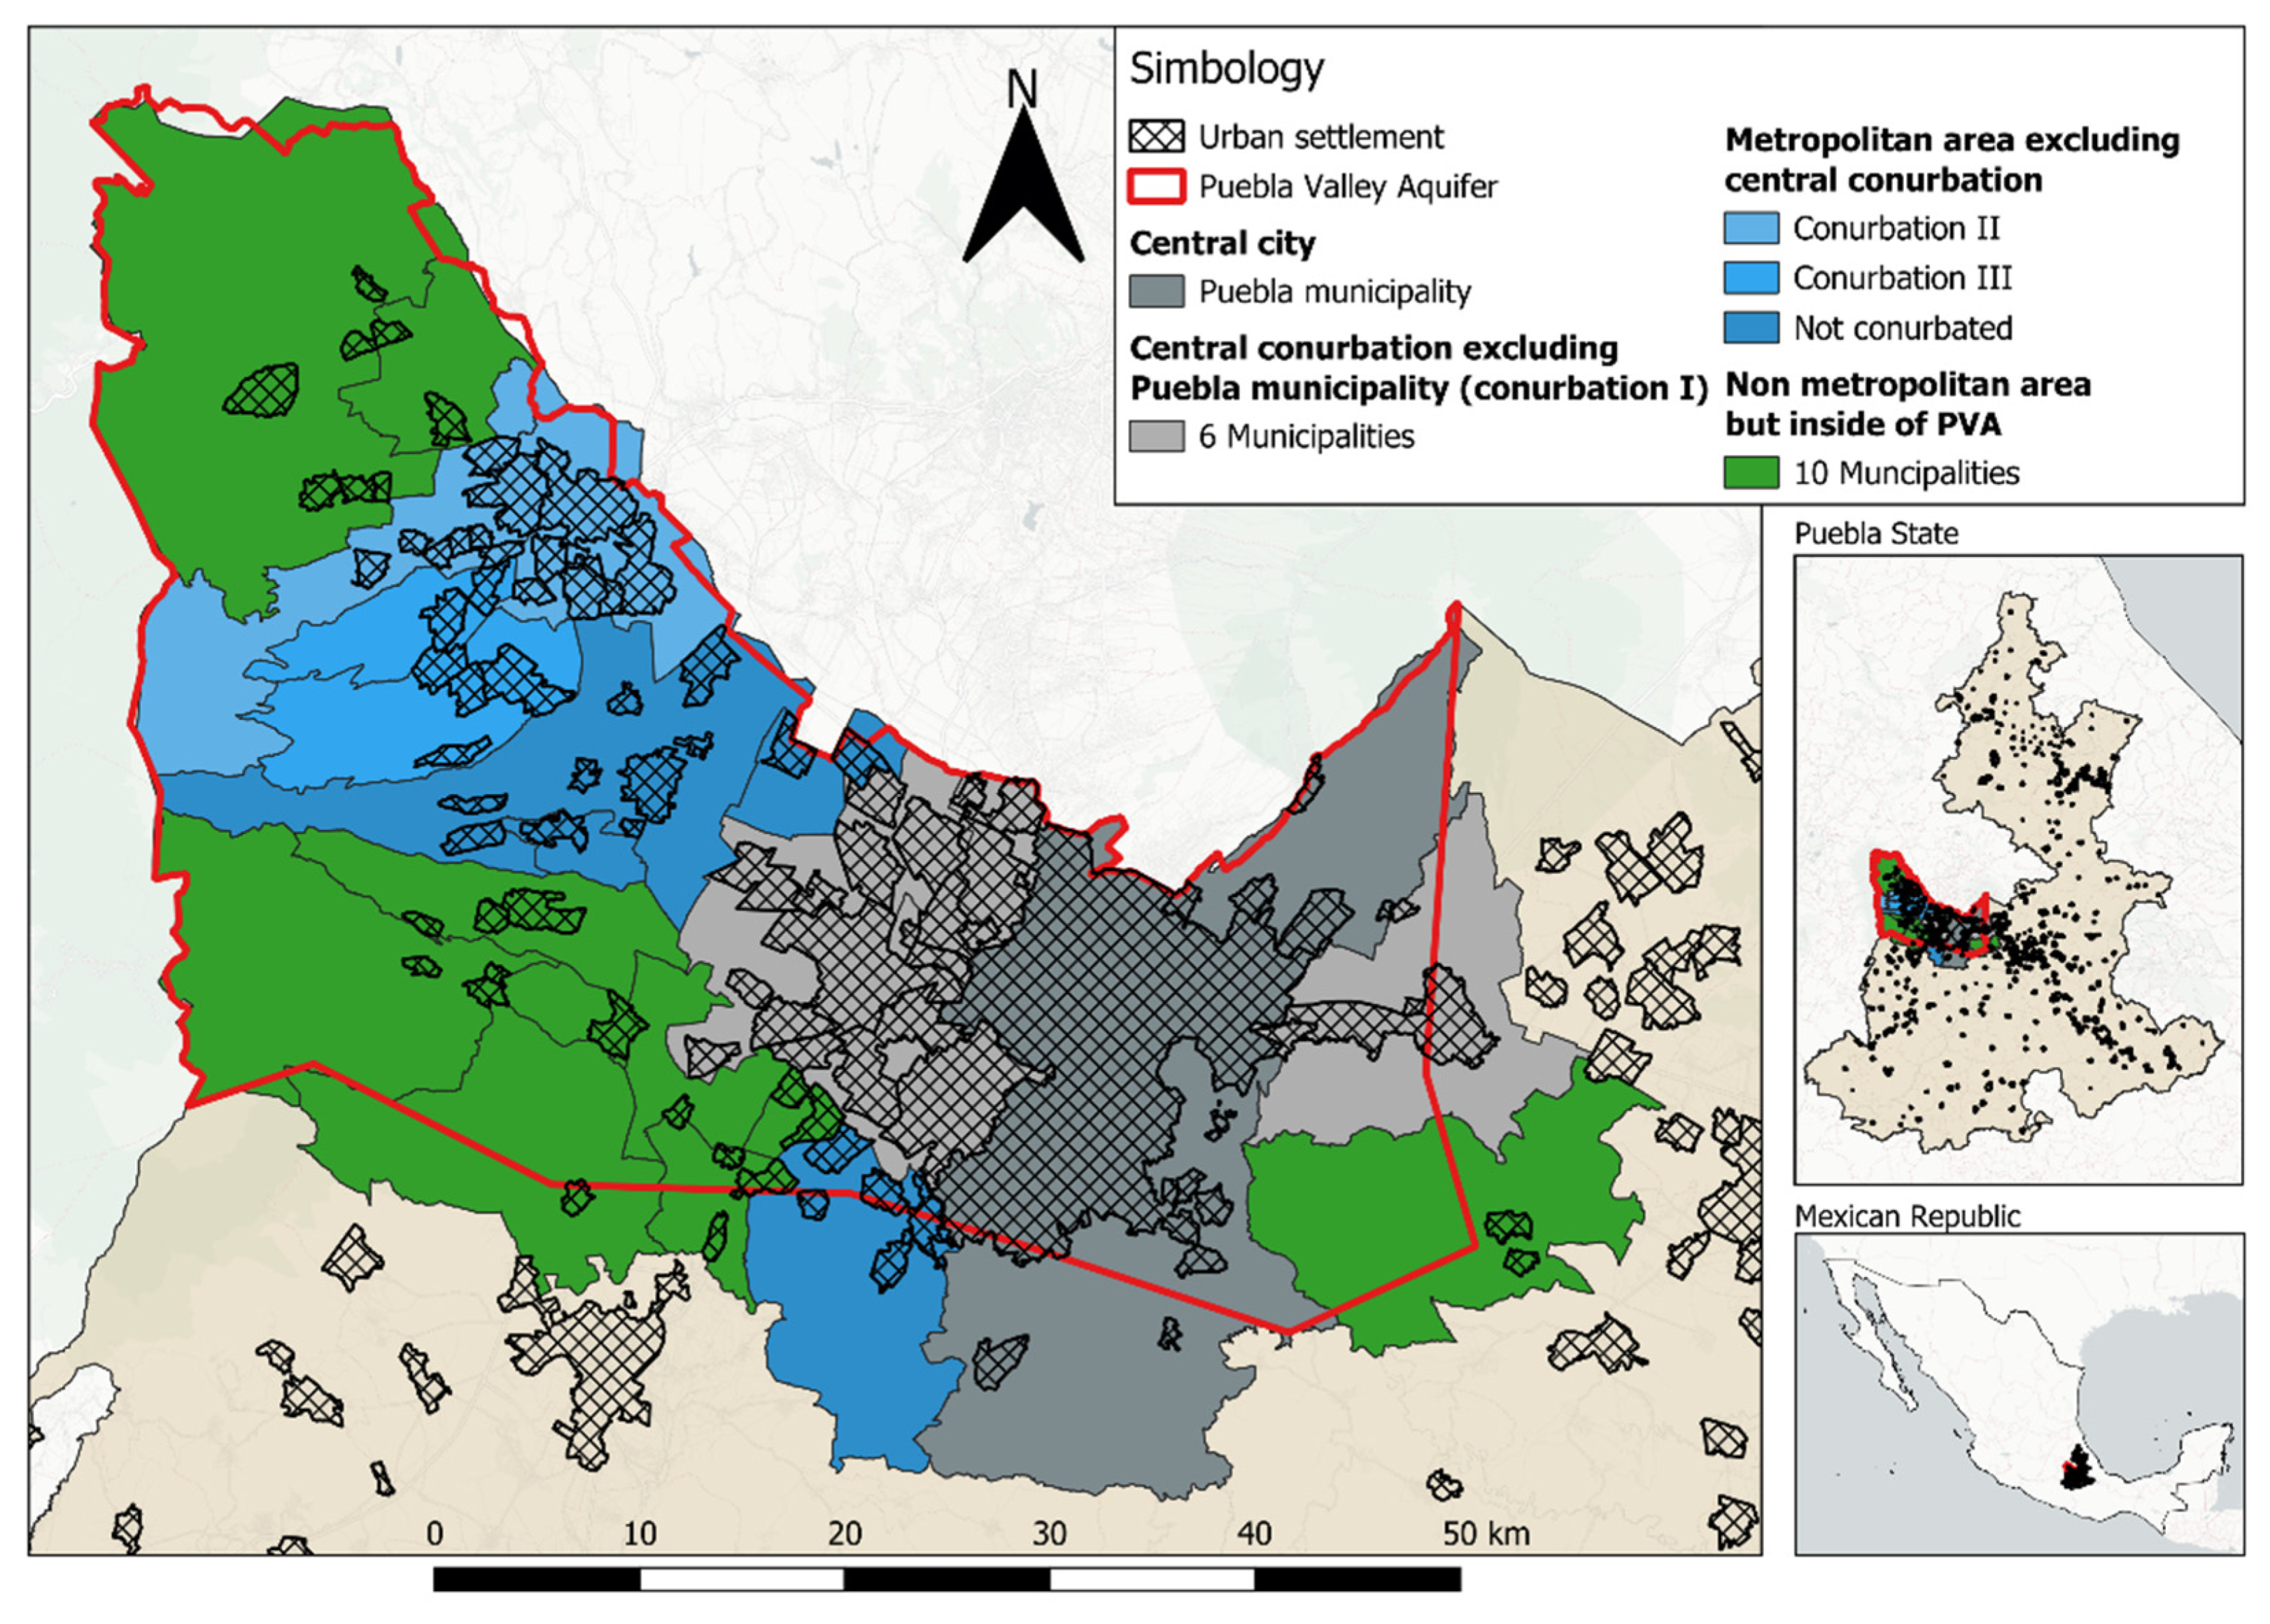
The model was built in two resolutions due to the irregular quality of the available data: the first, with lower resolution, corresponds to the 25 municipalities outside the central city but within the Puebla Valley Aquifer (PVA) area; the second with higher resolution corresponds to the Municipality of Puebla or the central area of the City of Puebla; see Figure 2.
The PVA extends approximately 2,025 km2 and intersects with 26 municipalities; 20 of them are within the model’s delimitation, and six are partially within [10]. The considered area was subdivided into zones according to their degree of urbanization:
  • Non-metropolitan area within PVA
    Ten municipalities outside the metropolitan area of the City of Puebla: Calpan, Cuautinchan, Nealtican, San Gregorio Atzompa, San Jerónimo Tecuanipan, San Matías Tlalancaneca, San Nicolás de Los Ranchos, Santa Isabel Cholula, Tianguismanalco, Santa Rita Tlahuapan.
  • Metropolitan area outside of the central conurbation
    Ten municipalities in the metropolitan area of Puebla that have urban settlements with no adjacency to the central conurbation.
    • Conurbation II: San Martín Texmelucan, San Salvador el Verde.
    • Conurbation III: Chiautzingo, San Felipe Teotlalcingo.
    • Non-conurbated: Domingo Arenas, Huejotzingo, Ocoyucan, San Miguel Xoxtla, Tlaltenango.
  • Central conurbation
    Five municipalities contiguous to Puebla central city that comprise our conurbation I: Amozoc, Coronango, Cuautlancingo, Juan C. Bonilla, San Andrés Cholula, and San Pedro Cholula.
  • Puebla central city
    Puebla "historical” city located in the municipality of Puebla. Its surface area is approximately the same as the one covered by the water utility system called “Sistema Operador de Agua Potable y Alcantarillado de Puebla” (SOAPAP). This decentralized agency regulates the private concessionaire company that provides potable water service in Puebla city.

2.2.1. Estimation of the Hydrological Cycle in PVA

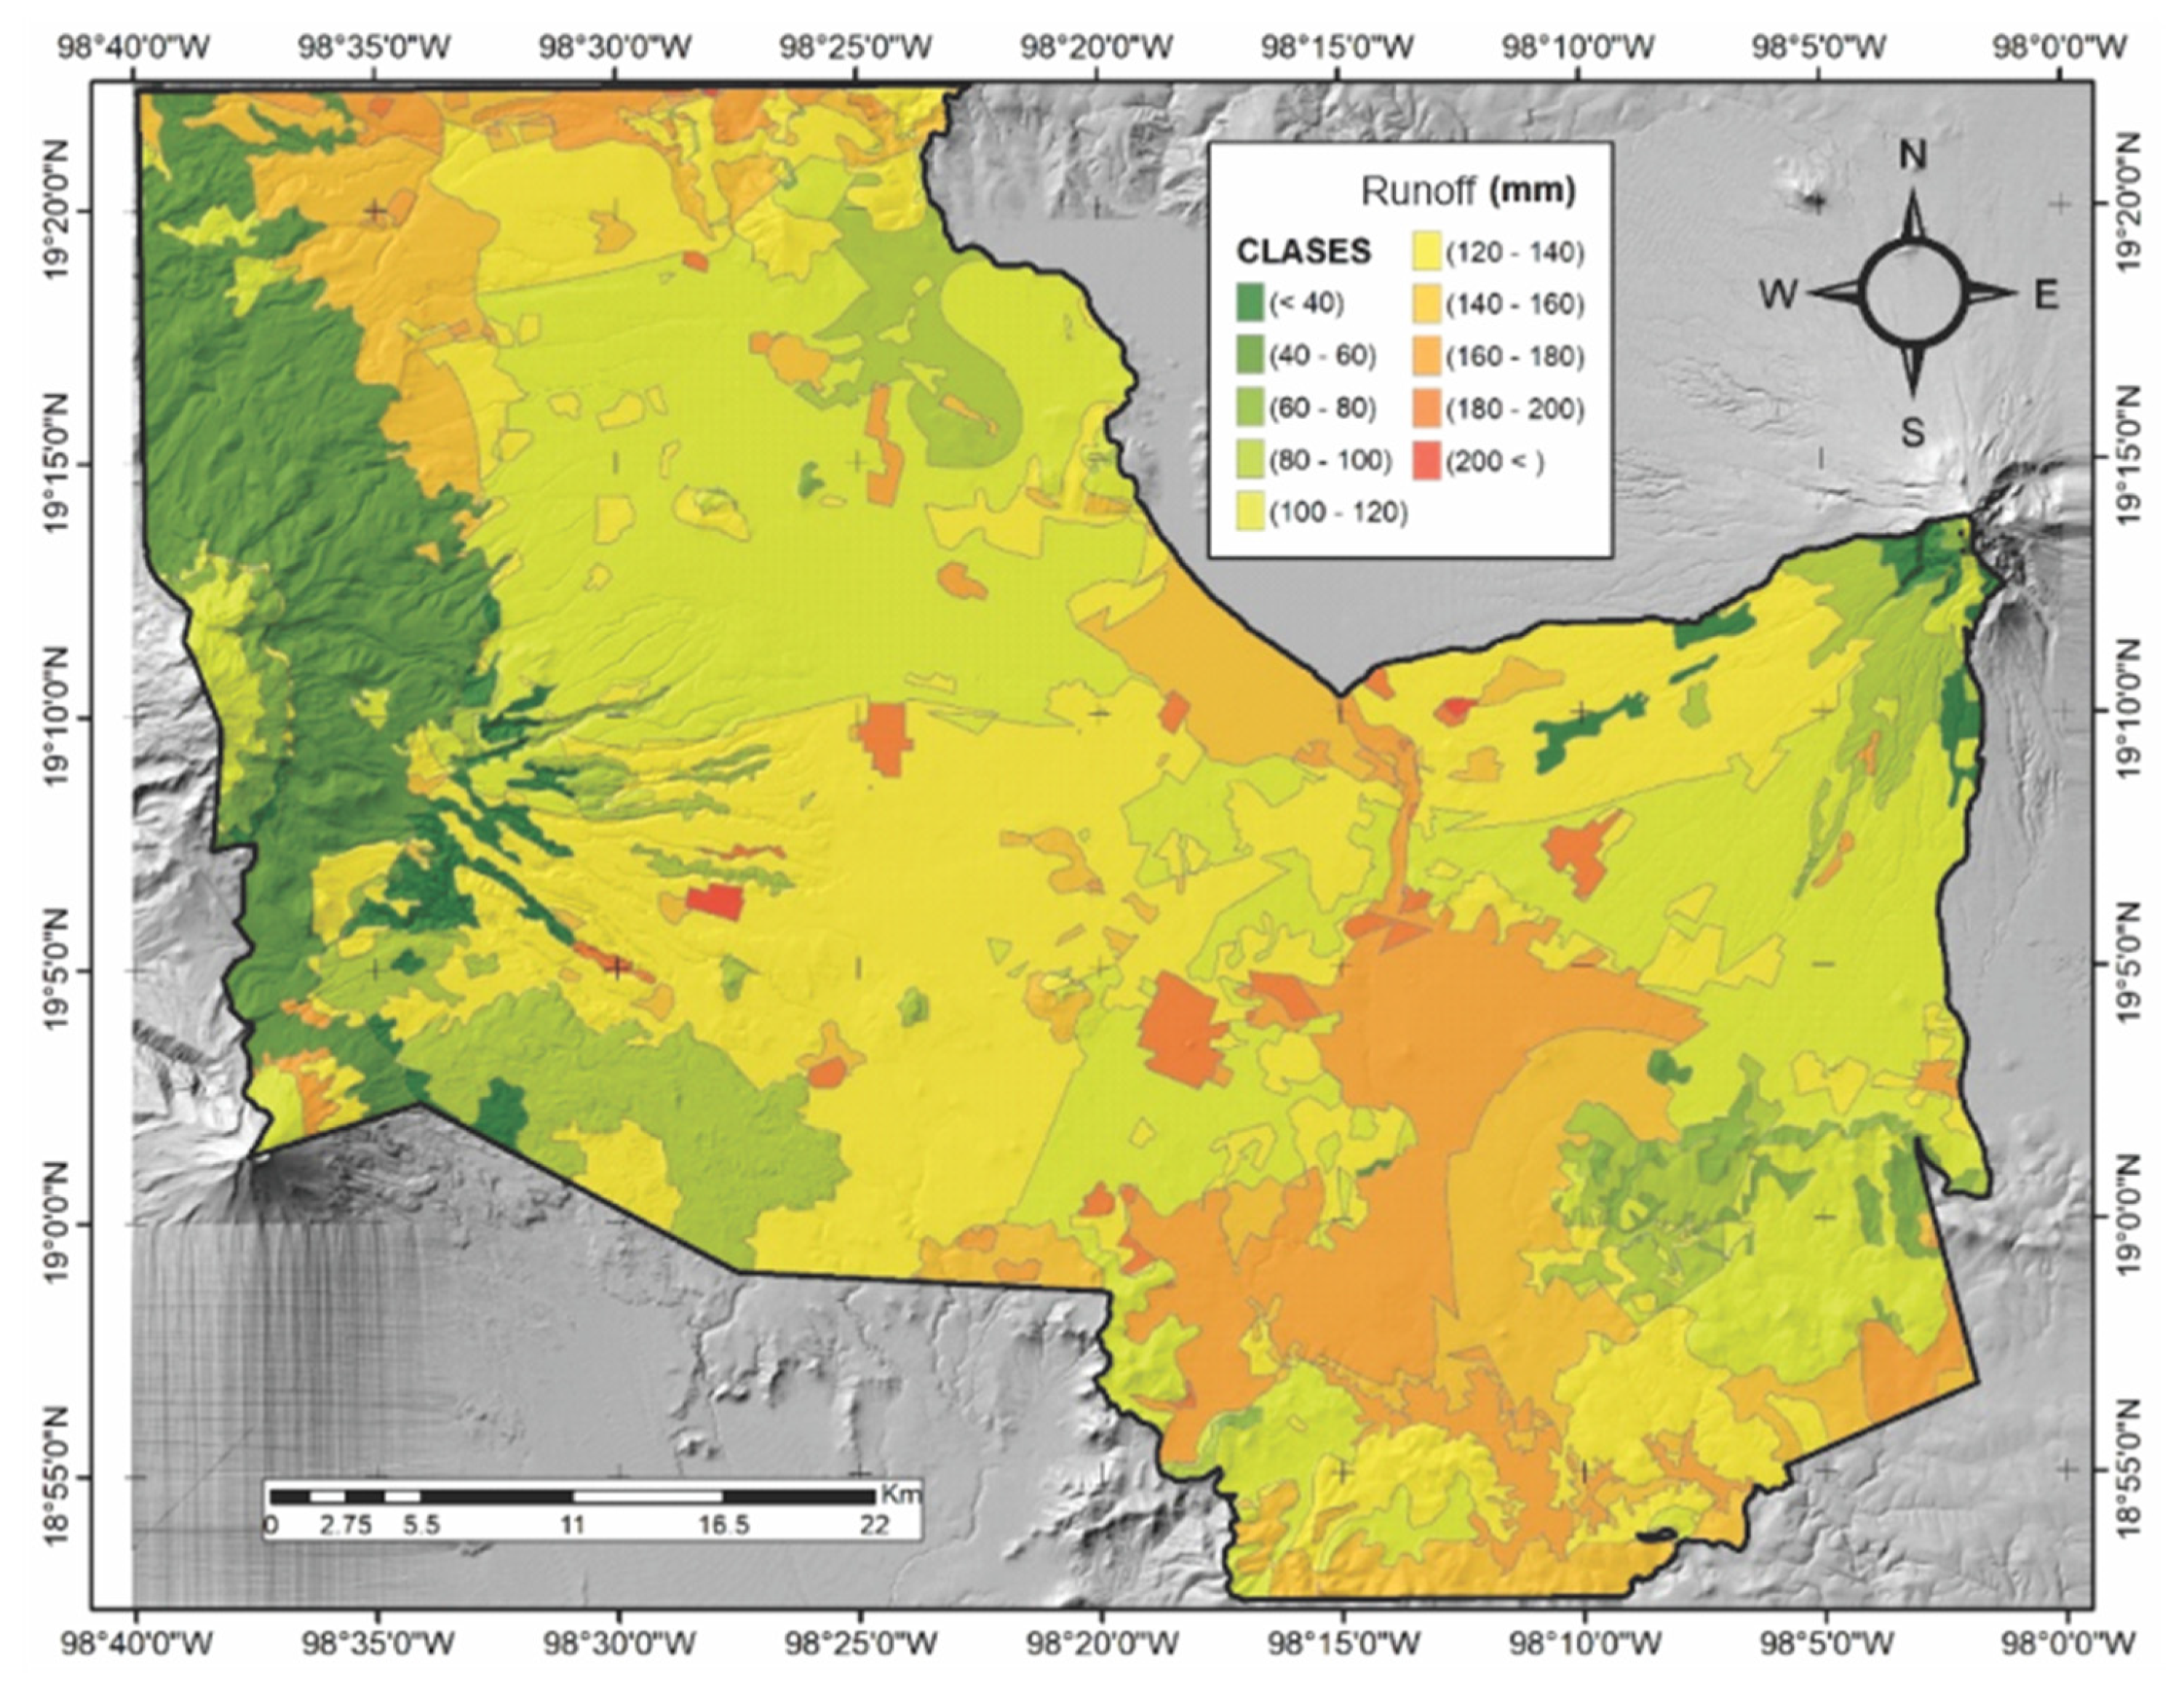
Groundwater use data for 2020 was obtained from the National Water Commission – CONAGUA. [10], and was balanced with precipitation and surface runoff water flows which was calculated according to the Mexican official standard NOM-011-CONAGUA-2015 with precipitation historical data from 14 meteorological stations (21065, 21248, 21120, 21163, 29170, 21101, 21247, 21034, 21249, 21016, 21046, 21167, 21223, 21214) of Mexico’s National Metrological Service and soil type information for the region. Data was processed using Geographic Information Systems (GIS); see Figure 3. In the PVA region, surface runoff entering from surrounding regions was not integrated due to a lack of information.

2.2.2. Estimating UWM in the PVA excluding the Central City of Puebla

A balance of water inflows and outflows was carried out. Water use and discharge data for 2019 was obtained from CONAGUA’s Registry of Water Rights (Registro Público de Derechos de Agua – REPDA) available at https://app.conagua.gob.mx/ConsultaRepda.aspx. Due to the absence of empirical data, the harvesting and discharge concessions were considered a proxy for actual flows.

2.2.3. UWM estimation for Puebla Central City

A balance of water inflows and outflows was made with 2018 and 2019 data obtained from SOAPAP thru both, direct contact with the institution's personnel and public solicitations of information (www.plataformadetransparencia.org.mx). Due to the lack of official records on bottled water consumption and water distributed by tanker trucks, such data was estimated using a Monte Carlo simulation.

2.3. Estimation of water flows without official records with Monte Carlo simulation

Figure 4 summarizes the induction method for bottled water and tanker truck flows.

2.3.1. Data collection

Two surveys were designed to collect quantitative and qualitative information:
  • The first survey comprised 30 questions addressed to the general public with the objective of collecting information on water service and consumption in dwellings. It was distributed online using Google Forms to informants selected using a snowball method. The survey was written in a colloquial language with multiple-choice answers accompanied by images to facilitate understanding by non-specialized public. It was structured according to different thematic axes referring to information on dwelling infrastructure, water storage habits, and the intensity of water consumption obtained through tanker trucks and bottled. This survey was applied in 2021 to 256 dwelling residents in the city.
  • The second survey consisted of 7 questions applied on-site to five LPWCs in 2021 to gather information on their purification process and water supply areas.

2.3.2. Monte Carlo simulation for water flow induction

The Monte Carlo simulation was performed using the 64-bit Crystal Ball version 11.1.2.4.900 in Excel [76]. The following postulates and assumptions were established for information processing.
Postulates: The maximum possible amount of water distributed by a tanker truck to a dwelling is equal to the maximum water storage capacity of the dwelling; a fraction of the total dwellings require water service by tanker truck and bottled water; hence, we must approximate that fraction to approximate tanker truck water consumed.
Assumptions: We add 500 liters of storage capacity to city’s dwellings that store extra water in sinks, floor-level water tanks (tinacos), barrels, jars or buckets; The average capacity of a tanker truck is 10,000 liters; The capacity of carboys is 20 liters, the average capacity of a carafe is 5 liters, and that of a bottle is 1.5 liters. Sugared and carbonated beverages were not considered; The average price in 2021 of a big brand water carboy (Bonafont, Epura, Ciel, etc.) was USD$1.90 while the one of other carboy brands was USD$1.70. The average price of a bottle of water and that of LPWC carboys was US$ 0.60. In 2021 the exchange rate was around 20 Mexican pesos for every 1 USD.
The Monte Carlo simulated operations followed the next procedure. First, the maximum, minimum, mode, and correlation between variables’ statistical parameters were estimated for the data collected in the survey, which were used to parameterize the probability distributions of each variable shown in Table 1b. Two probability distributions were used, where the selection criterion was that for the Beta PERT distribution. It is considered more confident that the values are concentrated around the mode, while with the triangular distribution, it is considered more dispersion in the data. Subsequently, 20,000 simulations were applied.

2.3.3. Estimated flow rates distributed by tanker truck in the central city

The total water storage capacity for each dwelling is the sum of the water tank capacity plus the water cistern capacity ( C w t + c i s ) and the extra storage capacity per dwelling ( C e x t r a ) (Equation (3)).
C d w e l l i n g = C w t + c i s + C e x t r a
The dwellings were classified into two groups according to how they accumulate water. The first group refers to multifamily dwellings that usually store water in water tanks or elevated cisterns (commonly multifamily apartments). The second group relates to dwellings with a cistern (commonly single-family dwellings).
Equations (4)–(6) were then operated with Monte Carlo simulation (Table 1a).
Q t a n k e r t , w t = A c P a R c M c p V / 10 9
Q t a n k e r t , c i s = A t P t R t M t p V / 10 9
Q t a n k e r t = Q t a n k e r t , w t + Q t a n k e r t , c i s

2.3.4. Estimation of the accumulation capacity in city dwellings

To estimate the accumulation capacity in the dwellings with a water tank (Awt) and with- a cistern (Acis), we suppressed the terms for the number of tankers (Pa, Pt) from the Equations (4) and (5), resulting in Equations (7) and (9).
A w t = A c R c M c p V / 10 9
A c i s = A t R t M t p V / 10 9
A v = A w t + A c i s

2.3.5. Bottled water flow estimation

The flow rate of bottled water consumed in each dwelling surveyed (Lv) was estimated by multiplying the number of containers purchased in each dwelling. (E) by the storage capacity of each type of container (cap). The resolution of the information allowed us to differentiate between containers (carboys, carafes, and bottles from big brand purifiers). Equations with subscripts 1 to 3 refer to water from big brand purifiers, and equations with subscript 4 to carboys from LPWCs (Equations (10)–(13)). A distinction was made between the magnitudes of big brands and LPWC bottled water to estimate and compare their costs.
l v 1 = E 1 c a p 1
l v 2 = E 2 c a p 2
l v 3 = E 3 c a p 3
l v 4 = E 4 c a p 4
For each dwelling surveyed, the liters consumed (lv), were calculated, followed by a Monte Carlo simulation to estimate the total flow rate (Q) for each type of container (Equations (14) a (17)). The total flow of bottled water supplied in the city is equal to big brand bottled water plus bottled water from LPWCs (Equations (18) and (19), and Table 2a).
Q e m 1 = L v 1 R b a V 365 / 10 9
Q e m 2 = L v 2 R b a V 365 / 10 9
Q e m 3 = L v 3 R b a V 365 / 10 9
Q e r = L v 4 R b a V 365 / 10 9
Q e m = Q e m 1 + Q e m 2 + Q e m 3
Q e = Q e m + Q e r

2.3.6. Approximation to the costs of water flows distributed in tanker trucks and bottled water

Under the assumption that tanker and bottled water is distributed in containers of known capacities (C), then it is possible to approximate the number of containers needed (R) to move the water flow (Q) (Equations (20)–(24)). Monte Carlo simulation was not applied in this procedure.
R t a n k e r t = Q t a n k e r t / C t a n k e r t
R e m 1 = Q e m 1 / C e m 1
R e m 2 = Q e m 2 / C e m 2
R e m 3 = Q e m 3 / C e m 3
R e r = Q e 4 / C e m 4
The total costs for water distributed by tanker truck and bottled water resulted from multiplying the total number of containers by the unit price of each container (Equations (25)–(31), and Table 3a).
P t t a n k e r t = P u t a n k e r t * R t a n k e r t
P t e m 1 = P u e m 1 * R e m 1
P t e m 2 = P u e m 2 * R e m 2
P t e m 3 = P u e m 3 * R e m 3
P t e r = P u e r * R e r
P t e m = P t e m 1 + P t e m 2 + P t e m 3
P t e = P u e m + P u e r

2.4. Consumo energético y emisiones de carbono de la empresa de agua

Energy intensity data for each process was obtained from SOAPAP’s energy consumption and flow rates [78]. Carbon emissions were estimated by multiplying the amount of water consumed by the coefficient of CO2e emissions per unit of energy [79]. Due to a lack of information, energy consumption beyond SOAPAP processes was not estimated.

3. Results and discussion

In the following section, UWM accounting for the City of Puebla and its metropolitan area is described, starting with the hydrological cycle of the PVA according to the delimitations illustrated in Figure 2.

3.1. The UWM as an embeded element of the PVA hydrological cycle: the biophysical subsistem

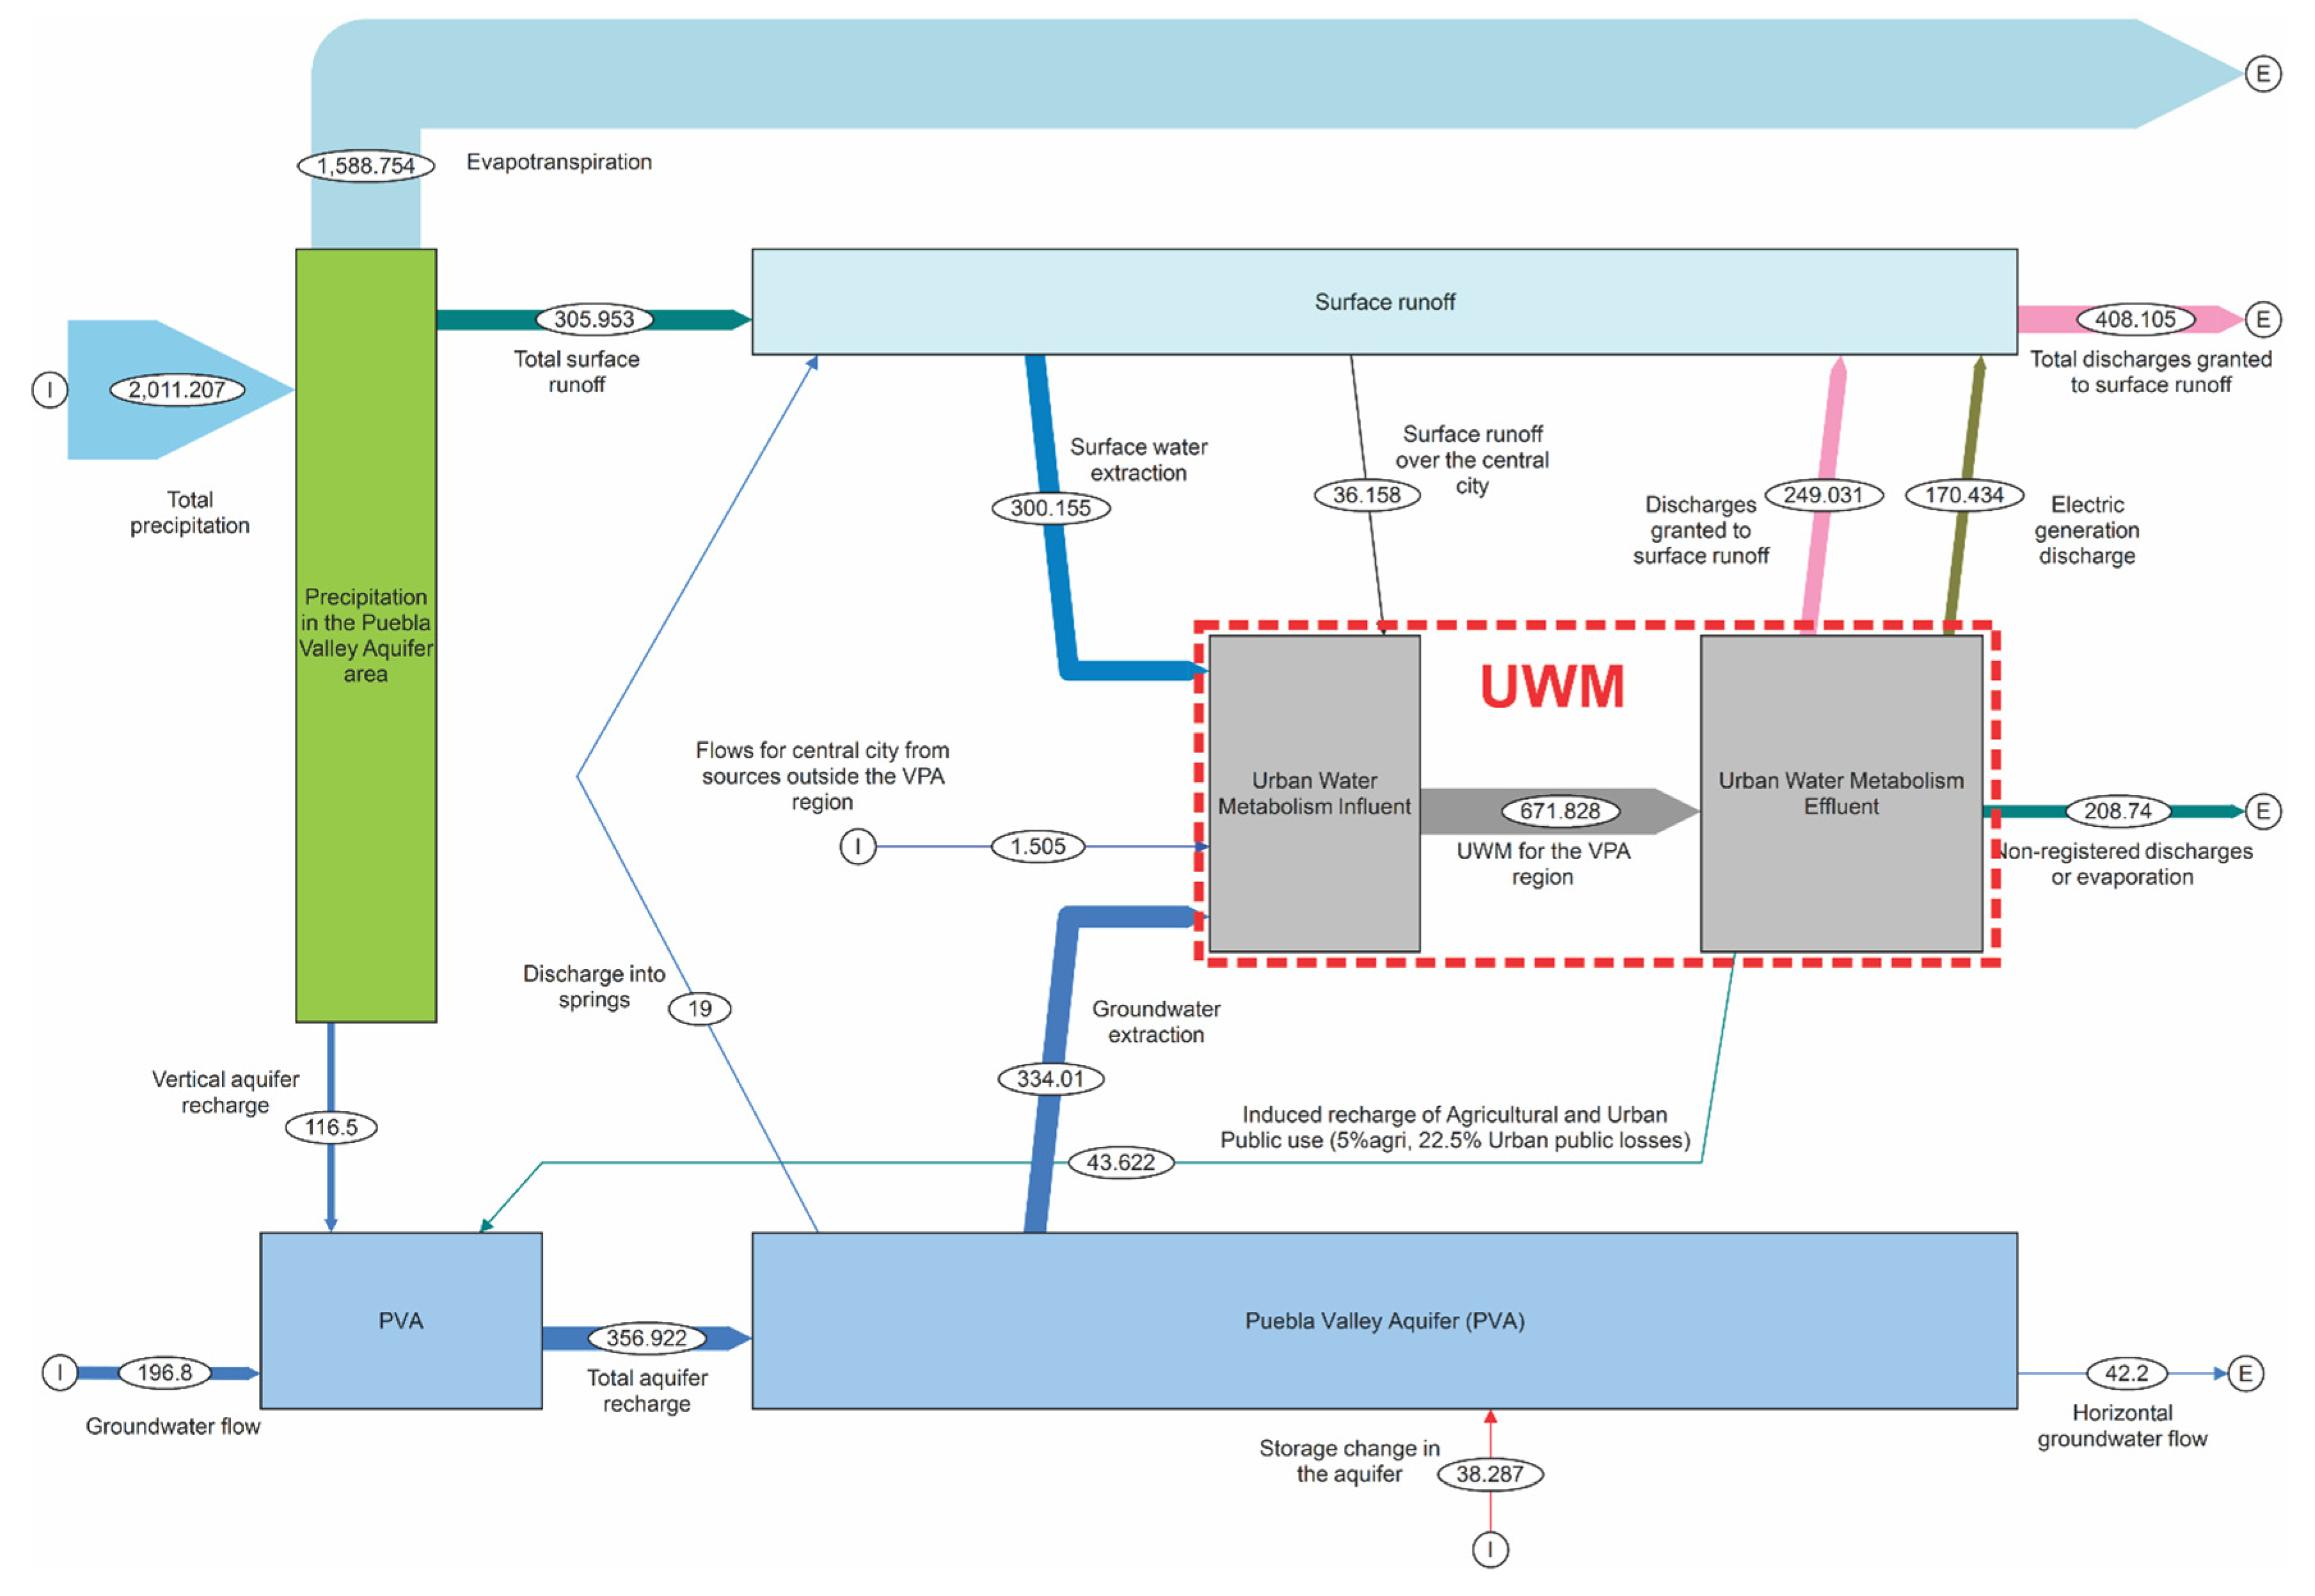
UWM of the City of Puebla and its metropolitan area operates within the hydrological cycle of the PVA region. This region receives 2,011.21 Mm3/yr of precipitation, which feeds the surface runoff of the region with 305.95 Mm3/yr, while 1,588.75 Mm3/yr is evapotranspired.
The PVA receives 116.5 Mm3/yr as vertical recharge, plus 196.8 Mm3/yr that enters as a horizontal flow into groundwater from the surrounding aquifers; 43.62 Mm3/yr have an anthropogenic origin produced by leaks in the distribution or drainage networks and irrigation. The above three flows sum 356.92 Mm3/yr of total PVA water recharge.
The aquifer's water storage decreases by 38.29 Mm3/yr, causing a decrement of the annual average static water level of 2 meters. In some areas in the south of Puebla central city, the static water level has decreased by up to 80m between 1973 and 2002 or an average annual decrease of 2.75 meters [10,68]. Current decline in water levels should be more severe, compromising regional water security. [65,66]. Overexploitation of the aquifer implies risks in soil mechanics, which can generate soil subsidence and mega-sinkholes such as the one that appeared in 2021 in Santa María Zacatepec [80].
It is to highlight that University Center for the Prevention for Natural Disasters (Cupreder) found inconsistent data in the PVA official information update documents. Such document, which informs policy officials if new water permits can be release, reported an increment in the PVA recharge by 20 Mm3/yr between 2013 and 2016 (from 339 Mm3/yr to 360 Mm3/yr) [81,82,83,84]. Such increment has once again been reported in CONAGUA’s 2020 update [10], which concludes that 20.6 Mm3/yr are available for new concessions, yet no details on the estimation model are given. CONAGUA’s data would imply the occurrence of improbable factors such as an increase in annual precipitation, a decrease in urban sprawl, and/or changes in the geophysical conditions of the aquifer. If the recharge of the PVA were based on what was indicated for the year 2013, our analysis indicates that there would no longer be available water for new concessions which would be highly problematic for keeping pace with the real estate market dynamism, mostly residential housing and industrial parks [85,86,87,88,89].
The total surface water and groundwater inflows to the PVA region is 662.88 Mm3/yr.

3.2. Urban Water Metabolism in the PVA Region

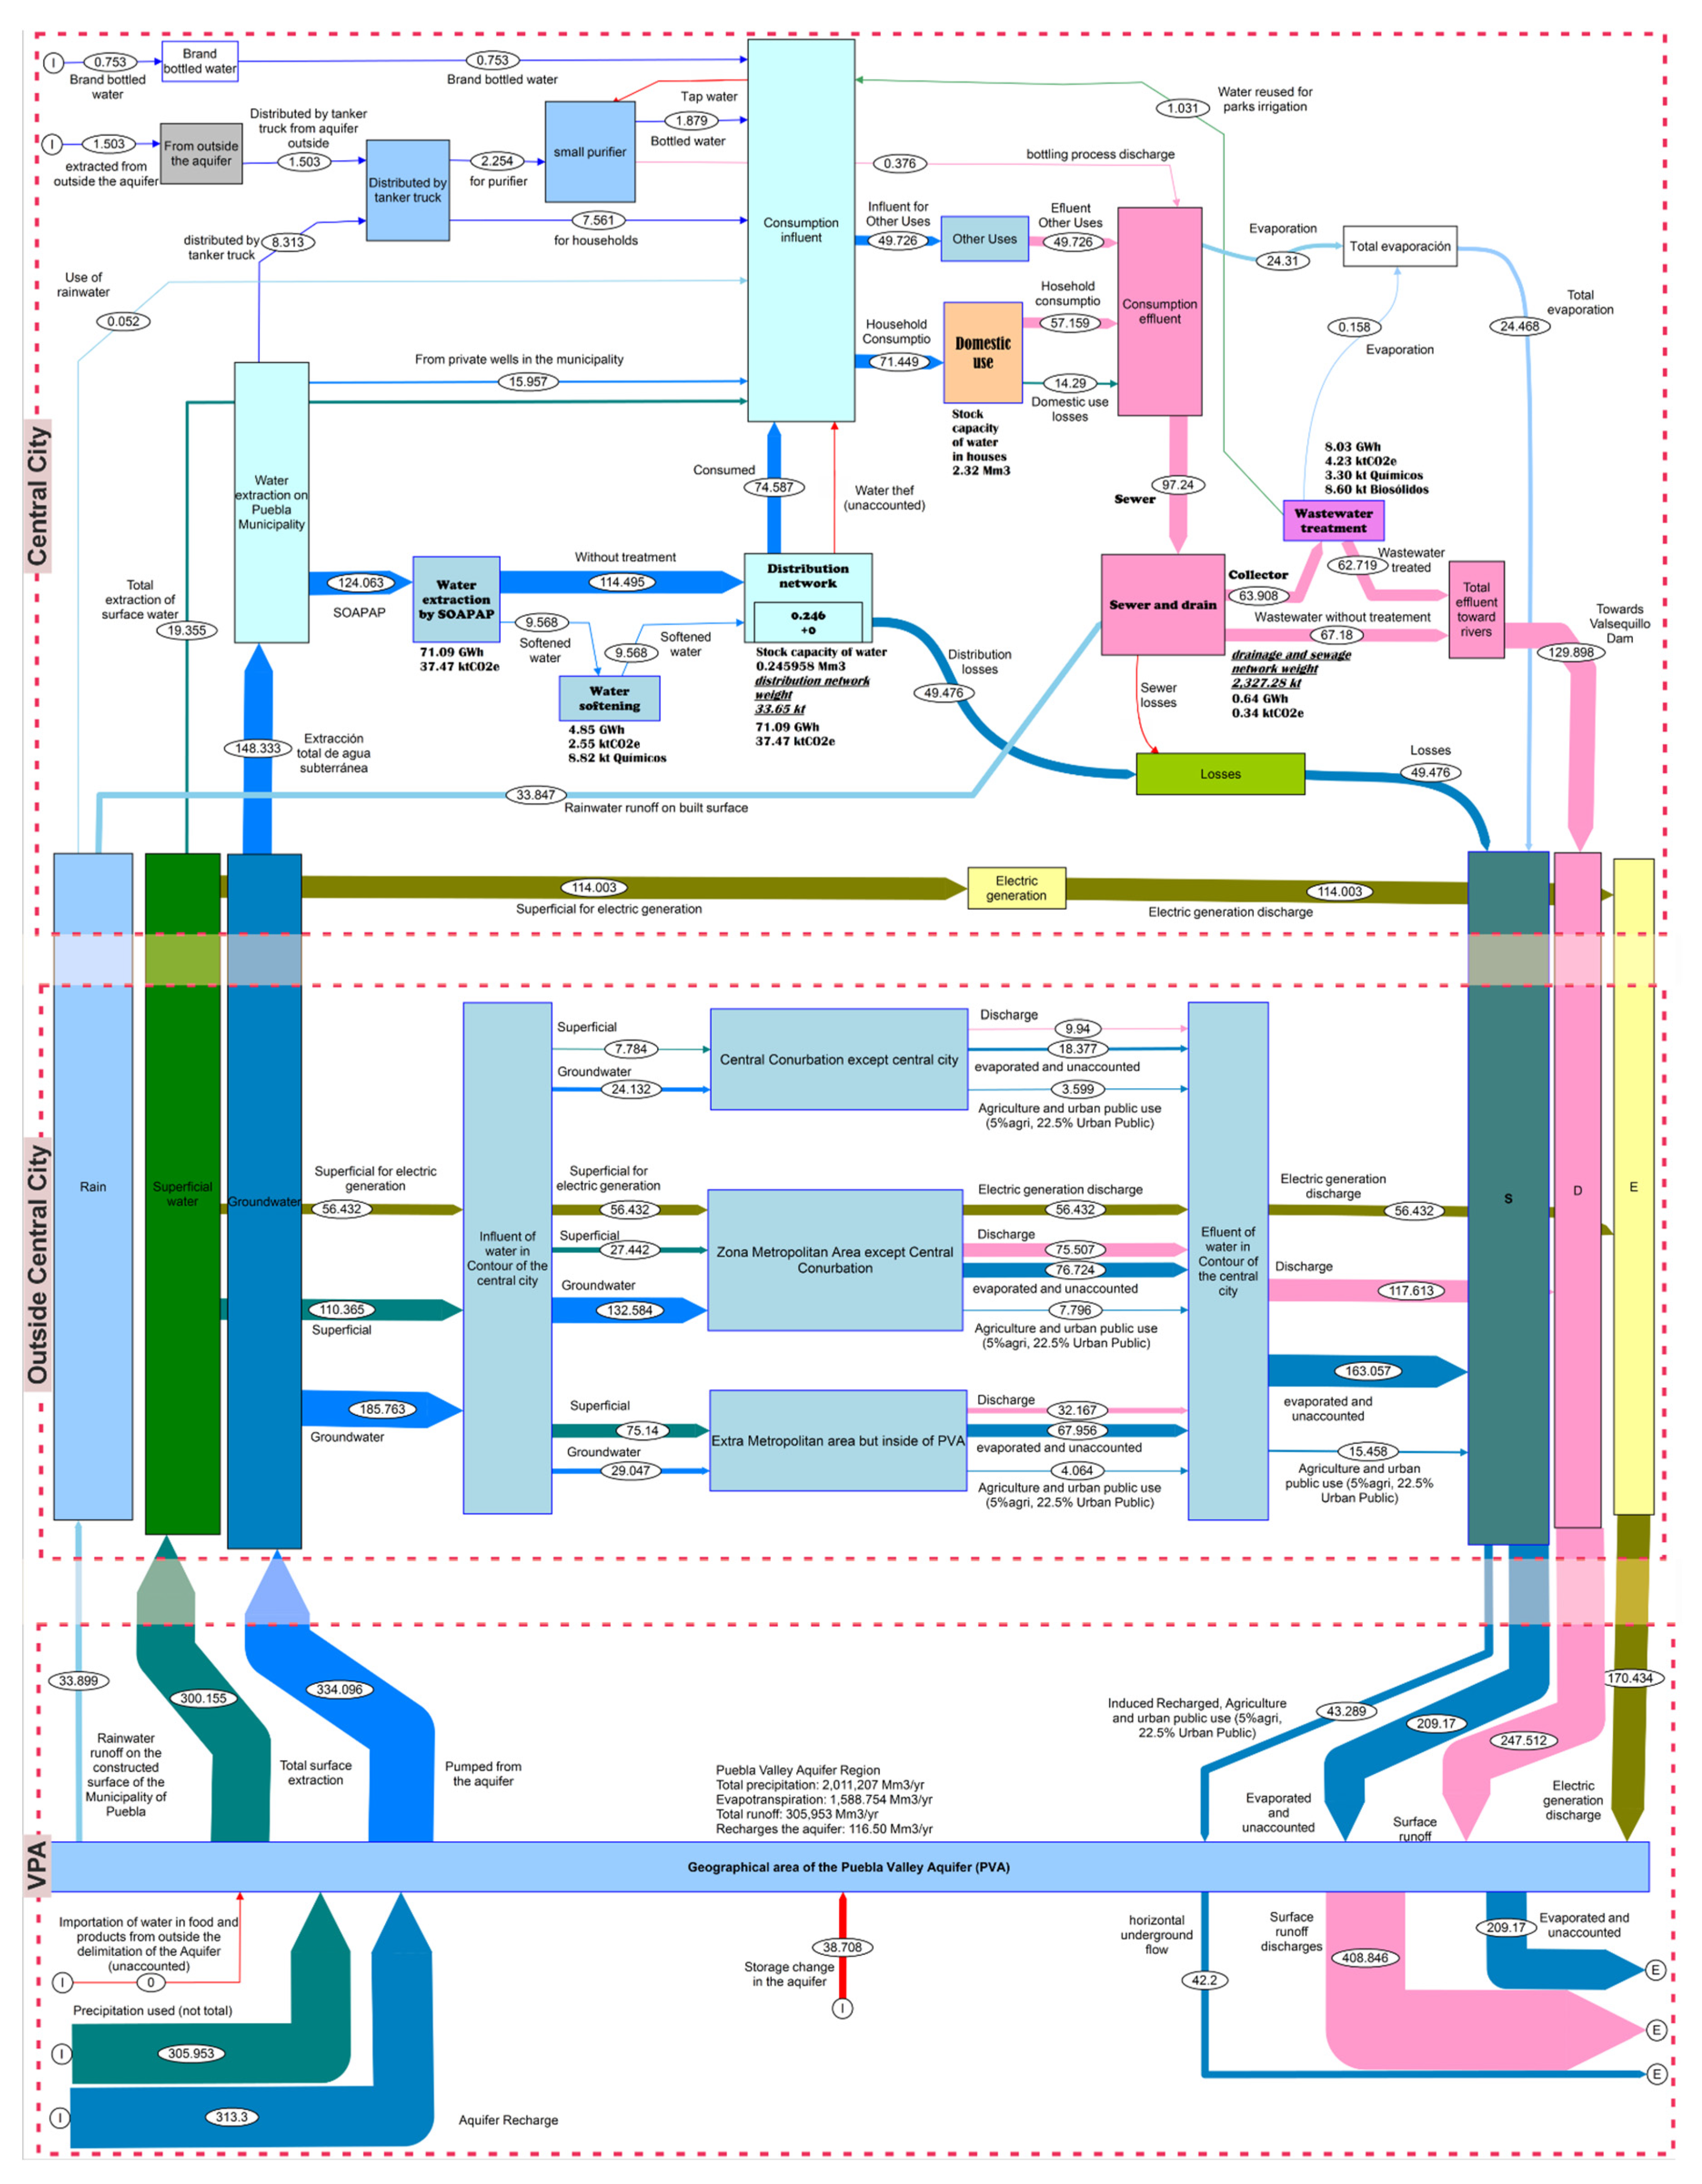
As shown in Figure 5, water extracted from the environment totalize 671.83 Mm3/yr, comprising 300.16 Mm3/yr of surface water and 334.01 Mm3/yr of groundwater. Of withdrawn water, 35.2% is excreted as concession discharges, 8.4% as flows related to induced recharge, and 56.5% are undefined discharges between evaporation, electricity generation discharges, or non-concession discharges. Flows with a magnitude of 1.505 Mm3/yr and 36.156 Mm3/yr correspond respectively to imported water from outside the aquifer, plus the aboveground rainfall runoff estimated for the central city.

3.2.1. UWM outside the central city of Puebla

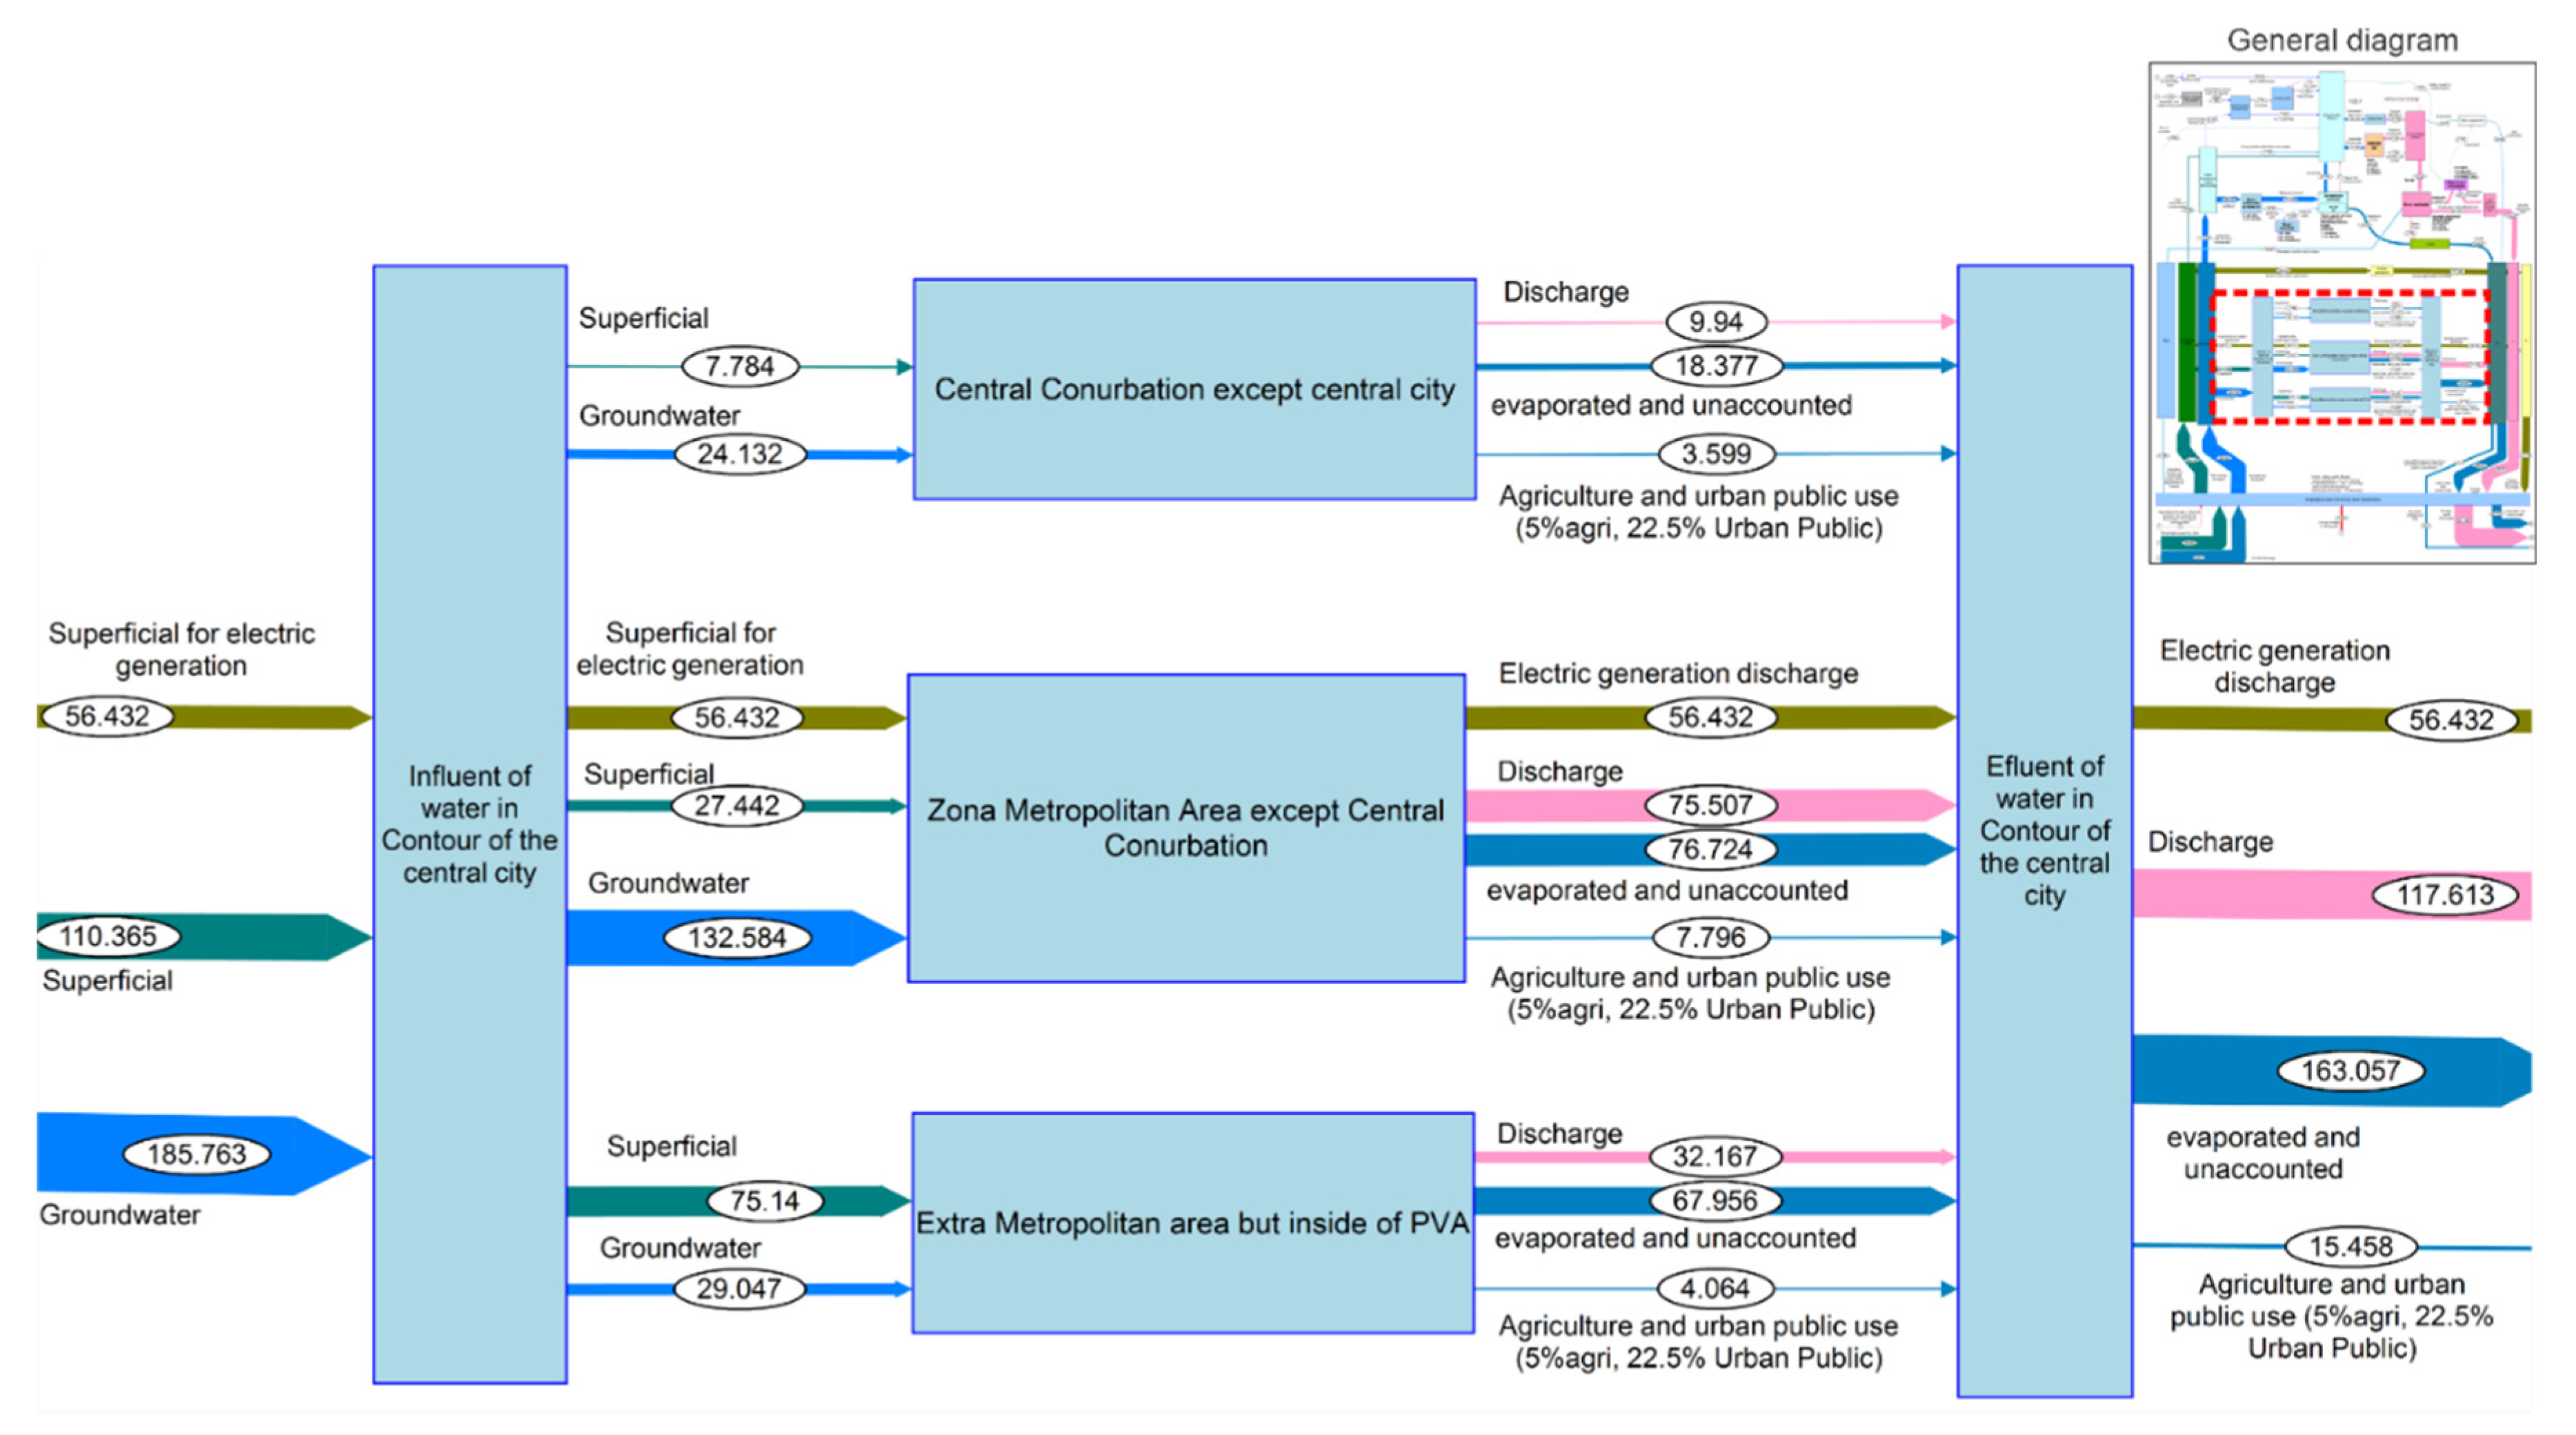
Total appropriated water in settlements outside the central city was 352.56 Mm3/yr of water, composed of 110.37 Mm3/yr of surface water, 185.76 Mm3/yr of groundwater, and 56.43 Mm3/yr of surface water for power generation. Of the total water withdrawn, an then used, is discharged as follows: 33% of the discharges are concessioned (discharged permits); 4% correspond to induced vertical recharge because of agriculture and leakages in distribution networks; 16% are related to electricity generation; and the remaining 46% correspond to undefined discharges (which can vary between evaporated water, water that makes up the food harvested in the area, or informal discharges). See Figure 6.
The use of surface water gradually decreases as settlements become more urbanized, because of its progressive contamination due to lack of sanitation [90]. The Atoyac River is the primary runoff in the basin, concentrating the water region's pollution. It is considered an "environmental hell" by the Environment and Natural Resources Secretariat of the federal government (SEMARNAT) [91] as it has markedly affected the health of population living nearby, including a greater prevalence of leukemia and cancer [54,55,62].

3.2.2. Water appropriation for the central city of Puebla

A total of 167.74 Mm3/yr of water is extracted from the environment, distributed as follows: 148.33 Mm3/yr of groundwater; 19.36 Mm3/yr of surface water; 0.052 Mm3/yr of rainwater harvested in dwellings; and 33.85 Mm3/yr of rainwater runoff over the built surface discharged into the Atoyac and Alseseca rivers. Water imports –considered to be from outside the aquifer– were estimated for of big-brand bottled water totalizing 0.75 Mm3/yr. In the same way, groundwater extracted outside the PVA and distributed by tanker trucks within the PVA, was estimated in 1.50 Mm3/yr. According to the survey such water supplies 70% to 80% of local LPWCs.
The LPWCs are mainly supplied with groundwater from the area of San Pablo del Monte (Tlaxcala) and surroundings (located in the vicinity of the Malinche volcano) because it’s low hardness water that contrasts with the high hardness of the groundwater of the City of Puebla [65,68]. Using low hardness water helps them to reduce maintenance operating costs. Water quality in the surroundings of La Malinche therefore relates to public health in the central city due to the consumption of water distributed by LPWC. Water deterioration and thus ecosystems’ deterioration in La Malinche could eventually imply importing water from farther away, leading to higher energy costs linked to greater carbon emissions, not to say higher LPWCs water prices.
In 2019 the local water utility extracted 124.06 Mm3/yr from the PVA, of which 63% came from the jurisdiction of the Municipality of Puebla and 37% was extracted in the surrounding municipalities (Table 4). Alternative flows to the water utility, add a flow of 8.31 Mm3/yr of groundwater, for the most part privately distributed by tanker trucks. Of this flow 7.57 Mm3/yr was for domestic consumption and 0.66 Mm3/yr distributed to LPWCs. Finally, another flow of 15.96 Mm3/yr was extracted in private wells.

3.2.3. Water treatment of the water utility in the central city of Puebla

Contamination and overexploitation of the PVA have deteriorated its water quality with heavy metals such as Boron and Manganese, which in moderate to high concentrations cause problems for human health. The presence of boron originates naturally from the weathering of rocks that contain it, but it also comes from cleaning products, industrial waste from paints and varnishes, textiles, leather tanning, and electronic devices, all of which are pollutants discharged by industries into rivers such as the Alseseca and the Atoyac [62,67]. Hardness is another water quality problem in the PVA, ranging from 286 mg/L to 1,894 mg/L [71].
The water treatment applied by the water utility are chlorination and water softening. The first is applied to all the water extracted and is helpful in eliminating microorganisms, but ineffective for other contaminants such as heavy metals. The second is applied to 7.56% of the water withdrawn (9.57 Mm3/yr), with the operation of 3 out of 4 softening plants in 2018. However, former water utility workers imputed that the softening method is performed only with lime, pointing it out as a lax method [92]. Inconsistencies were found in the water softening information, such as consuming chemicals without reporting water softening and vice versa (Table 5).

3.2.4. LPWCs drinking water treatment in the central City of Puebla

Based on the surveys carried out, 90% of respondents informed they consume bottled water due to mistrust of tap water quality. Of such consumption, 70% corresponded to water supplied by LPWCs who argue to apply ultrafiltration processes. LPWCs water price is less than half the price of big brand carboys, and this fact is attractive to residents who are unable to afford big brand bottled water. This means that access to drinkable water is stratified as result of its price versus the households’ income, a situation that unevenly affects guaranteeing the human right to water.
LPWCs are supplied with 2.25 Mm3/yr of water transported by tanker trucks of which 1.88 Mm3/yr is bottled for sale and 0.38 Mm3/yr is used for purification process such as washing of containers, filters, etcetera. LPWCs respondents consider that more than half of these businesses are clandestine, whose product is even more affordable than the regularized ones because they do not perform the entire purification process, neither pay taxes. Some of the worst practices carried out by these purifiers are filling carboys with tap water or filling carboys directly from the tanker truck without treatment.

3.2.5. Water distribution in central City of Puebla

In the distribution network 40.66% of water withdrawn, or 49.476 Mm3/yr, is lost due to leakages. Only 74.59 Mm3/yr is thus actually delivered to final consumers. The amount of leaked water in the distribution process is equivalent to that imported from neighboring municipalities (37%). This suggests that improving physical efficiency would reduce the dispossession of water in settlements surrounding the city of Puebla, which in turn would avoid socio-environmental conflicts such as those that occurred in Nealtican or Coronango [31,33]. On the other hand, losses in the distribution network are 4.8 times greater than water distributed in tanker trucks, therefore, if losses were reduced to 20% and distributed equitably to users, the need for tanker truck service could be minimized.

3.2.6. Tanker trucked transported and bottled water flows in central City of Puebla

Input parameters for the Monte Carlo simulation are shown in Table 1b. The big brand bottled water flow (0.75 Mm3/yr) and the LPWCs purified water flow (1.88 Mm3/yr) are mainly consumed in dwellings and food businesses (Table 6).
The water flow distributed by tanker truck has been estimated in 7.56 Mm3/yr. This consumption is due to: i) water inaccessibility of inhabitants that live outside the coverage of the water utility network; ii) non-compliance with water supply frequency (which in some cases exceeds a month without water service) [93]; iii) water service cut-offs either due to the economic incapacity of users to pay for the service and /or the exorbitant tariffs imposed by the water utility. Some users have informed the purchase of tankered water collectively to divide the costs among their neighbors. This situation affects guaranteeing human right to water.

3.2.7. Water consumption in the central City of Puebla

After the distribution water losses, the sum of all flows consumed in the city is 121.17 Mm3/yr (Table 7), of which only 0.85% is treated water which is mostly reused for irrigating green public areas by the Municipality of Puebla, i.e., the circularity of the UWM is practically nil. Besides that, rainwater harvesting in dwellings corresponds to 0.04% of the total amount of water appropriated from the environment, which according to Martínez Austria's proposal, it would increase up to 0.6 Mm3/yr [70], representing 0.5% of the total water consumed in Puebla city, so this alternative would not compensate city’s water deficit.
Licensed surface water flow for electricity generation in the Municipality of Puebla is 114.00 Mm3/yr. This flow was included in the UWM model but was not included in Table 7 due to two inconsistencies: the first is that power generation processes require a higher quality of water than drinking water, which is improbable in a place where surface water is highly polluted; secondly, it is also unlikely that the amount of water licensed for power generation exceeds the amount of water withdrawn by the water utility each year. The only power generation plant of the Comisión Federal de Electricidad (CFE) in the municipality of Puebla is San Lorenzo Potencia plant, and consumes 0.021 Mm3/yr of water, because its zero-discharge technology design. The electricity generation plant is located one kilometer from the Jint Softening Plant, which is operated by the water company, so it is more probable the use of softened water instead of surface water for energy generation.

3.2.8. Water uses in the central city of Puebla

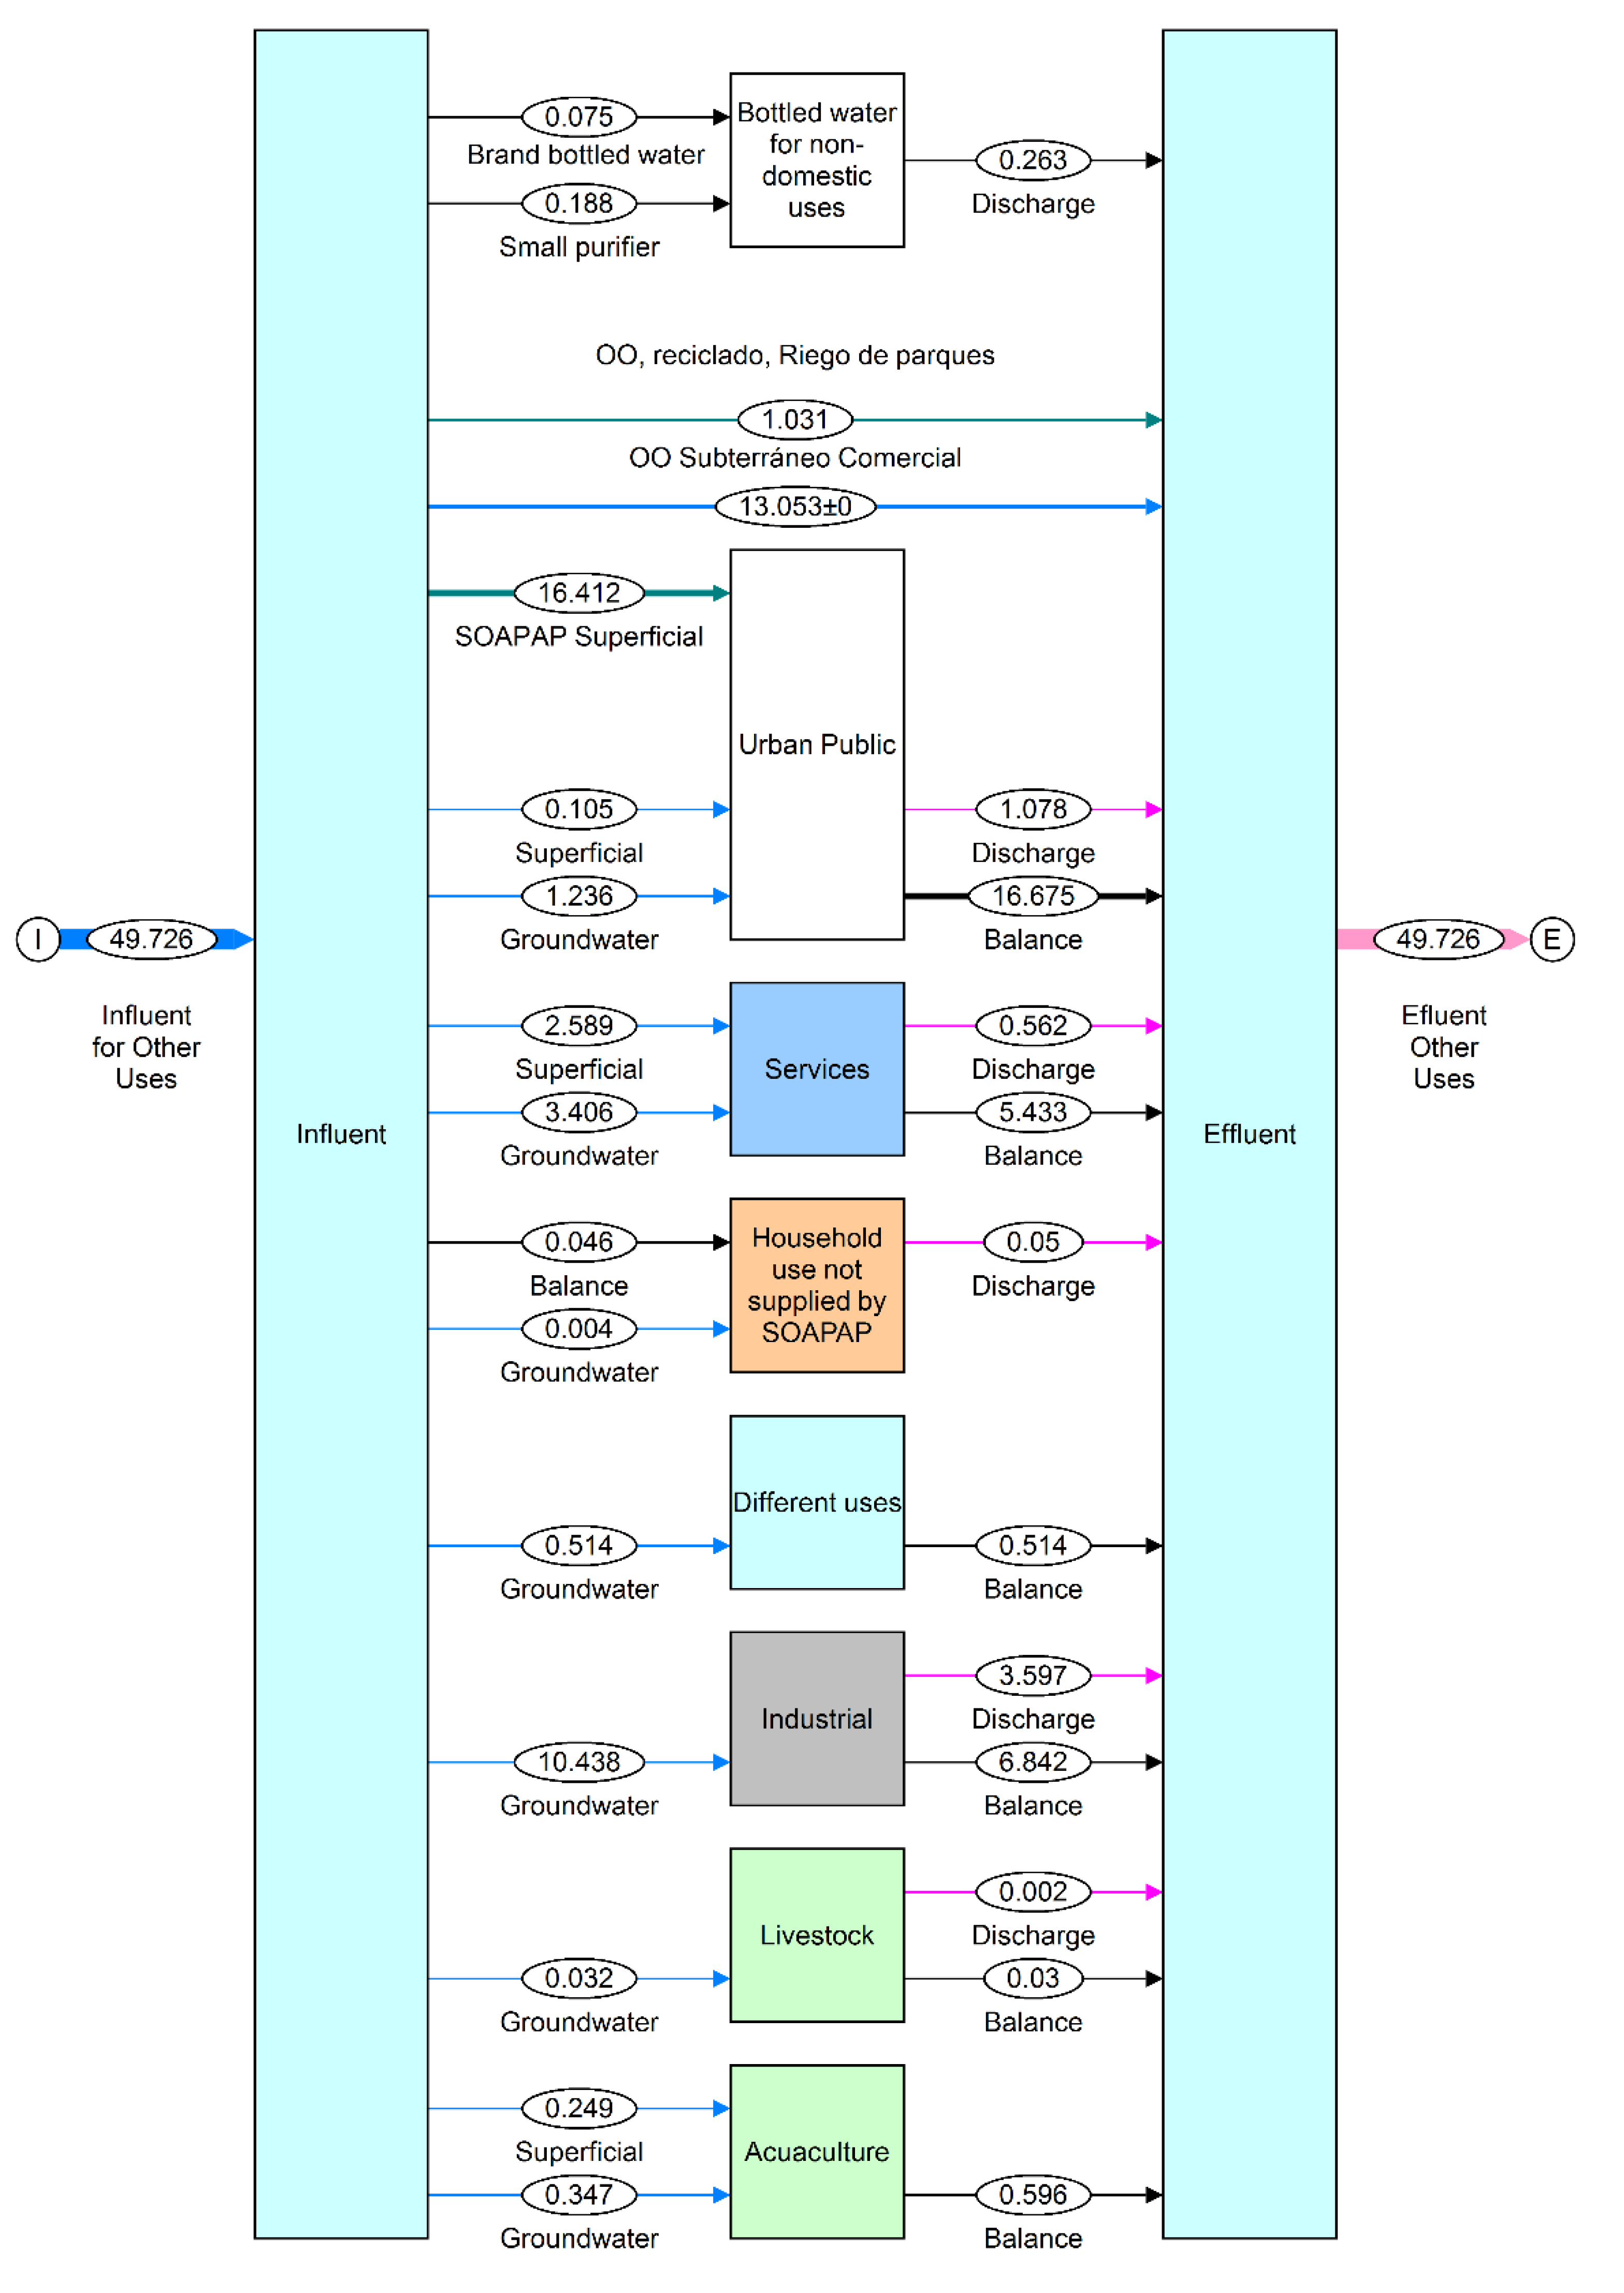
Of the total central city water withdrawn, 42% is for domestic use, 29% for other uses, and losses in the network are 29%. If the comparison excludes distribution losses, domestic use represents 58.96%, and the remaining 41.04% is distributed for other uses as detailed in Table 8 and Figure 7.
The imbalance between the inputs and discharge, as presented in Figure 7, was compensated with a flow called balance (data from REPDA). For example, industrial discharges corresponded to 34.46% of the water consumed for such use. The remaining 65.54% of such industrial water inflow has as a counterpart an unidentified outflow to the environment. In the context of the serious contamination problems in the study area, “balance” flows in discharges could be a challenging issue due to the lack of adequate monitoring and the existence of informal discharges.
The micrometering percentage reported by the water utility is 19.18%of the total users in the central city [94], and this is a measurement issue that implies potential deficiencies in the estimation of water consumption and losses. A higher percentage of micro-metering would increase the certainty of the lost volume of water and its location. However, users reject micro-meters installation due to the associated costs and the distrust towards the water utility which is related to current excessive rates of water. Measurement is thus seen as a mechanism that will turn the water service even more expensive than what it already is [95,96,97].
Excessive water bills have caused non-payment of service leading to water cut-offs for delinquent users [98,99,100]. Water cut-offs causes social conflicts as it challenges guaranteeing HRWS as it has been pointed out by organizations such as the “Asamblea Social del Agua”, “Colectiva por el Bienestar Social”, independent activists (i.e., Omar Jimenez Castro), former officials (i.e., Francisco Castillo Montemayor) and a diversity of scholars [101,102,103,104,105,106].
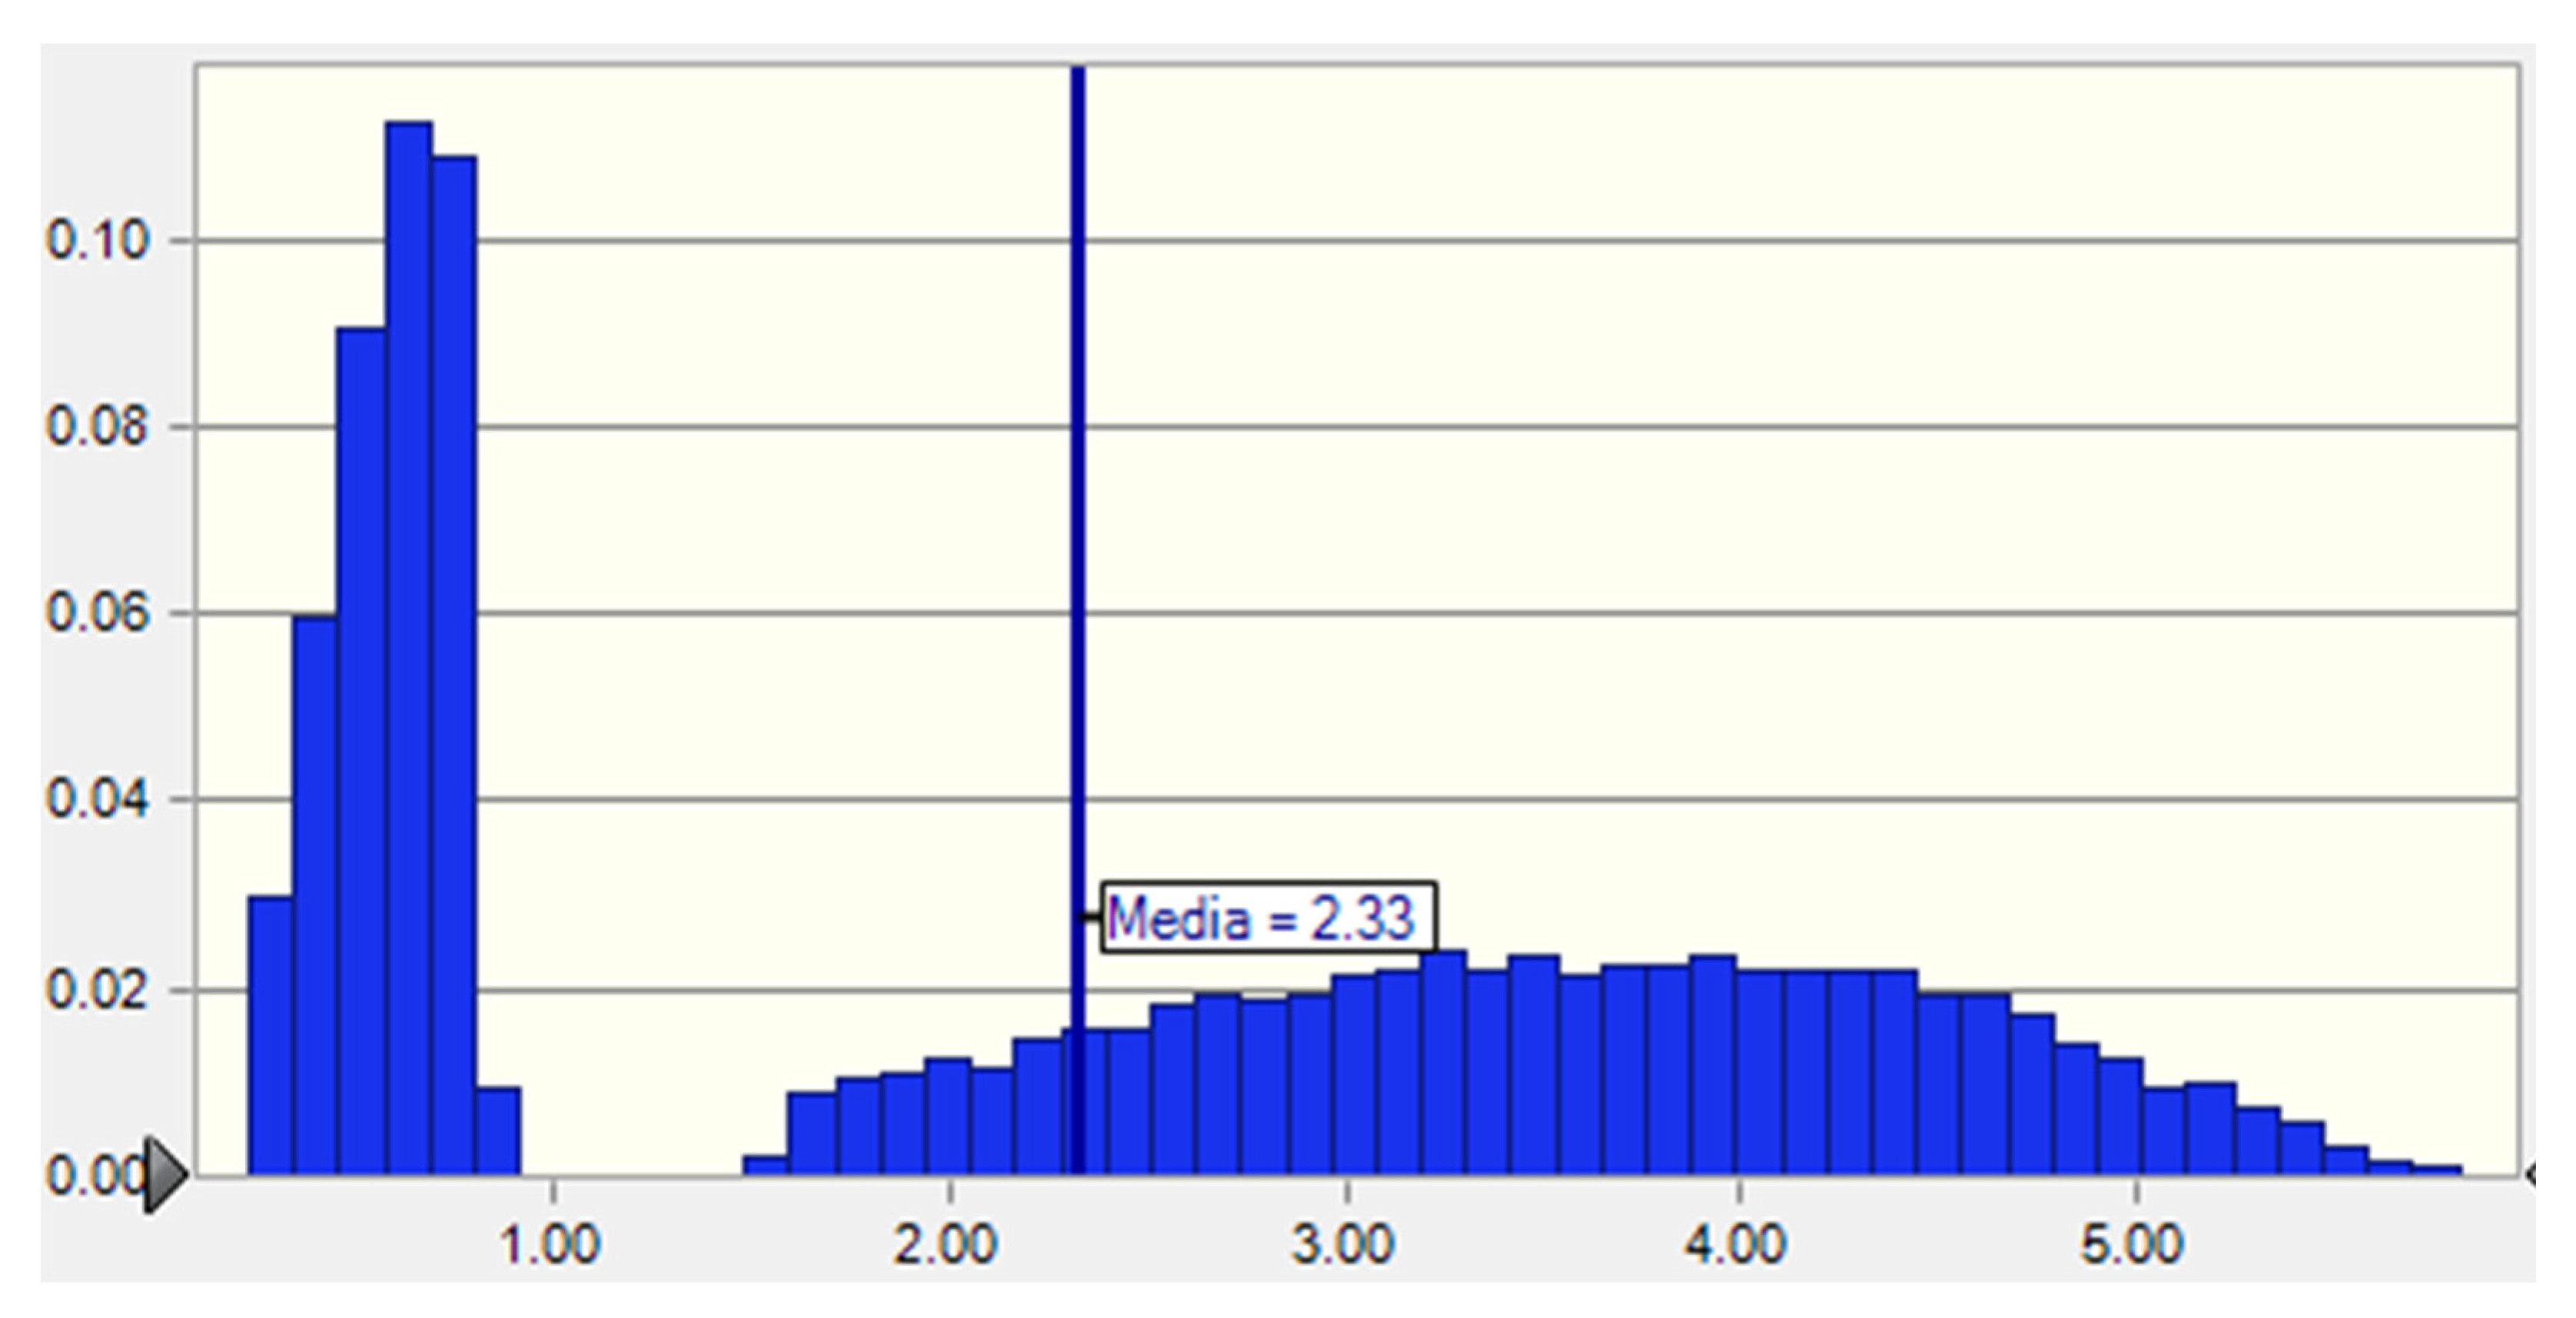
The total storage capacity in the water utility's water tanks is 0.246 Mm3, and the total water accumulation capacity in the dwellings was estimated at 2.33 Mm3 (Figure 8). The sum of the water storage capacity of the water utility plus the total dwelling’s storage capacity totalize 2.57 Mm3. Figure 8 shows two probability distributions, the first on the left refers to the dwellings without a cistern that stores water in tanks plus barrels or buckets, and the distribution on the right relates to the dwellings with a cistern.

3.2.9. Water excretion in the central City of Puebla

In Puebla city, drainage and sewerage share the same infrastructure, where rainwater runoff, domestic and industrial discharges confluence. In that water, pollutants found include pharmaceuticals [107], microplastics [60,108], other emerging contaminants [108], and heavy metals [55]. Their confluence allows them to mix and produce chemical reactions that might result in new pollutants mixtures, which may not be treated by WWTPs [109].
A maximum of 97.24 Mm3/yr of wastewater flowed into the drainage-sewerage network, plus 33.85 Mm3/yr of rainwater runoff, totaling 131.09 Mm3/yr. The utility's WWTP's treated 63.91 Mm3/yr and 67.18 Mm3/yr flowed untreated into the environment. The amount of treated water in the industrial sector is unknown. The sum of treated and untreated discharges was estimated at 129.90 Mm3/yr.
The drainage-sewerage network exchanges water with its surroundings through the phenomena of infiltration and exfiltration [110], their magnitude in the City of Puebla is unknown, however, it is essential to be aware of them since the quality of the aquifer water is transcendental for the City of Puebla water sustainability.

3.2.10. Wastewater treatment in the central City of Puebla

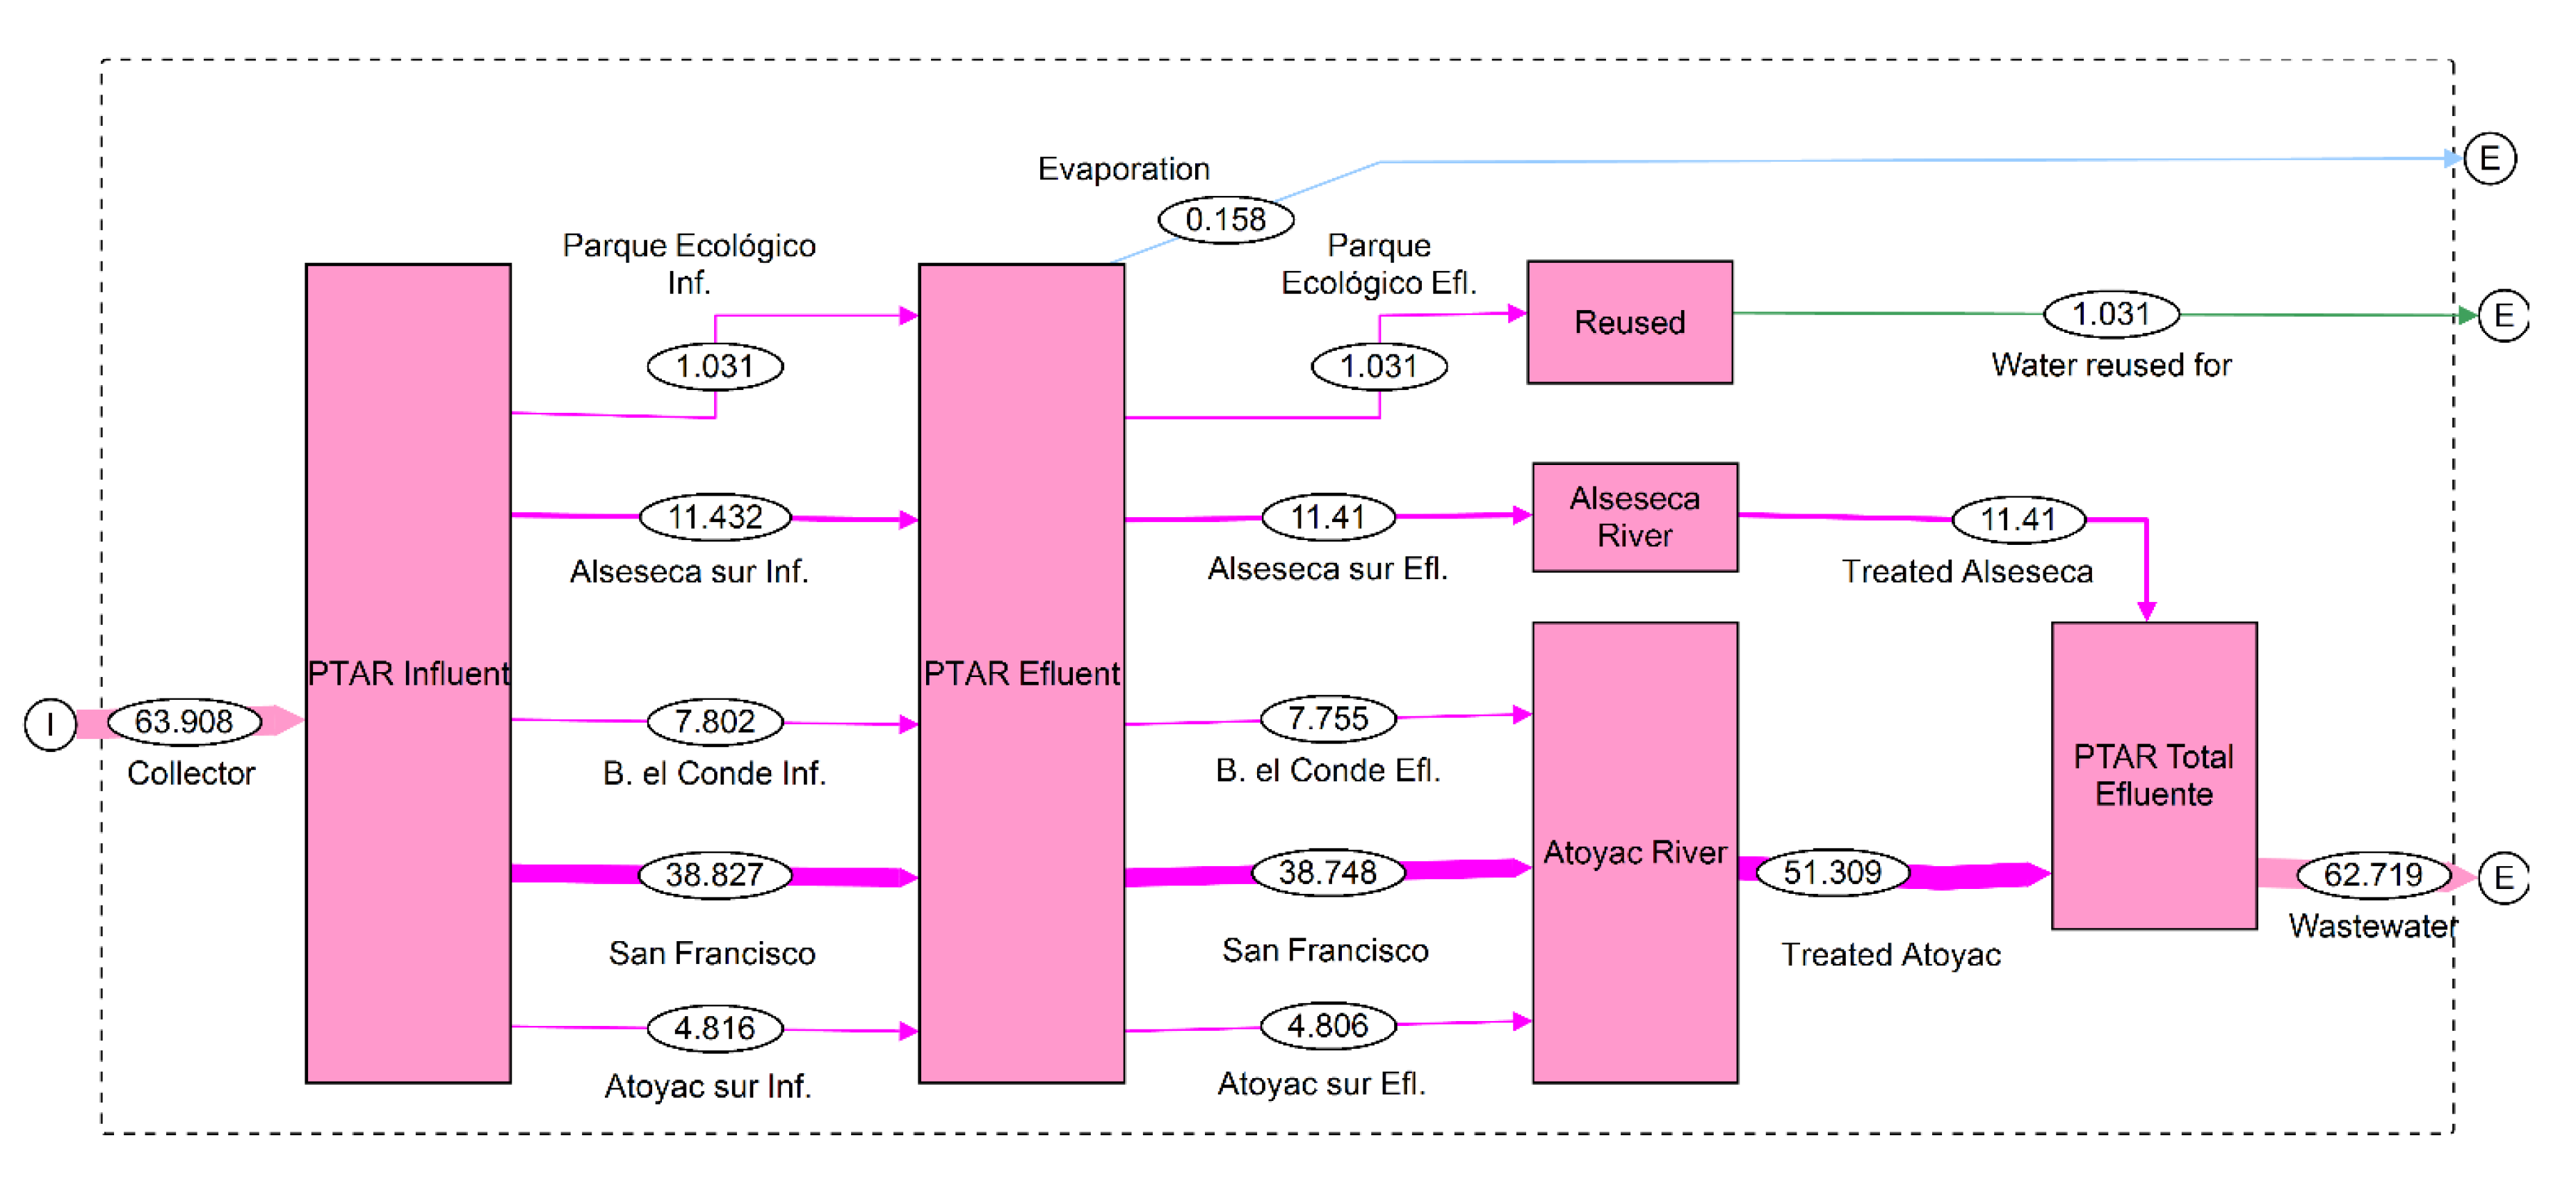
Total installed capacity of the five WWTPs is 116 Mm3/yr. In 2018 WWTPs operated at 55% of their total capacity (63.91 Mm3/yr). 1.03 Mm3/yr of the total wastewater was treated in the only WWTP with secondary treatment, and that water was reused to irrigation of public green areas at the municipality’s expense. The other four WWTPs treated 62.72 Mm3/yr with primary treatment; 51.31 Mm3/yr were discharged to the Atoyac River and 11.41 Mm3/yr to the Alseseca River (Figure 9).
Despite the above, it can be argued that UWM in the City of Puebla city is mostly linear, because only 1.6% of treated wastewater is used for irrigation of green areas. It is however possible that the WWTP "Parque Ecológico" is not operating and this would translate into 0% circularity. In Mexico City the circularity is slightly higher, where 5.26% (94.61 Mm3/yr) of the total water discharged is treated, of which 83% is used for green spaces irrigation, which represents a circularity of 4.37% (78.52 Mm3/yr) of the total water discharged in the city [46].
The Alseseca and Atoyac rivers are already highly polluted before they reach the City of Puebla. Once they flow through the city, they drain into the Manuel Ávila Camacho Dam, which in 2018 had a storage capacity of 303.1 hm3 [73,111]. The dam acts as a sedimentation vessel, a metal scrubber due to the decrease in flow velocity and as a biofilter due the effect of water lily [63]. The dam's water is used for irrigation to produce food consumed in the City of Puebla, its metropolitan area, and other places[112,113].

3.2.11. Water evaporation in the central city

Rainwater evaporated on the central city surface was estimated at 177.85 Mm3/yr, and evaporation in the consumption process was estimated at 24.31 Mm3/yr. Water pollution discharged into rivers also volatilizes into the air forming Volatile Organic Compounds (VOCs), some of them potentially carcinogenic and linked to diseases such as leukemia or cancer in children and young people in the metropolitan area [56,114].

3.3. Approximation to the Water-Energy-Carbon nexus in the central city of Puebla’s Utility System

The water utility’s energy consumption in 2018 was 103.36 GWh, representing 4.31% of the total energy consumed by the municipality of Puebla for the same year. Of that energy, 87.11% was consumed for water pumping, and 12.46% for potable and wastewater treatment, generating total emissions of 54.47 KtCO2e of which 47.45 KtCO2 are related to water pumping, and 6.79 KtCO2e to potable and wastewater treatment. The estimated per capita energy consumption related to water was 55.15 kWh/p/yr which translates into a per capita carbon footprint of 29.06 kgCO2e/p/yr (Table 9).
The estimated energy intensity to treat wastewater flows was 0.1257 KWh/m3, which is lower than the average energy intensity verified fort sanitation in the state of Puebla (0.60 KWh/m3) [78]. It is also lower than the energy consumed in the city of San Purisima del Rincón (0.38 KWh/m3) [27], and lower than of that of other foreign cities such as Oslo (1.32 KWh/m3), Nantes (0.87 KWh/m3), Toronto (1.44 KWh/m3) and Turin (0.94 KWh/m3) [25].
Assuming that energy intensity to treat wastewater is the same as the average intensity of Puebla state (0.60 kWh/m3), a recalculation of the treated wastewater flow would result in 13.39 Mm3/yr, which is equivalent to 10% of the total excreted water of the central city. This differs from data reported by the water utility (63.91 Mm3/yr). It is therefore possible that 90% of the excreted wastewater is actually discharged untreated. This anomaly in data resonates in the face of complaints expressed by social activists who accuse the water utility of fraud, because they assure that sanitation is not performed while users are charged for it [115]. The above is a social problem on top of the environmental one derived from discharging untreated water into Alseseca and Atoyac rivers [116]. The Ministry of the Environment and Natural Resources (SEMARNAT) has even described the current condition of the Atoyac river as an “environmental inferno”; second most polluted river in the country [117].
Water losses in the network imply the waste of 42.09 GWh of energy, contributing to climate change due to the emission of 22.18 Kt of CO2e. This generates operating costs that the water utility at the end transfer to users through tariffs, affecting water affordability [118].

3.4. Other material flows related to Urban Water Metabolism in the central city of Puebla

The UWM is linked to other flows, the chemicals for treatment, and the materials dissolved or transported from the consumption process to sanitation and excretion. In what follows we only pay attention to the use of water treatment chemicals.

3.4.2. Water treatment chemicals in the central city of Puebla water utility

Water softening required 8,824.7 kg/yr of chemicals comprising sodium chloride, sulfuric acid, calcium hydroxide, anionic polymer, cationic polymer, sodium hypochlorite, antifouling, genefloc, sodium hydroxide, metabisulfite. Wastewater treatment required 3,298.06 kg/yr of chemicals including ferric chloride, anionic polymer, and cationic polymer. The increasing need for drinking and wastewater treatment will generate higher requirements for water treatment chemicals.

3.5. Elements of the Human Right to Water from the UWM model in the central city of Puebla

According to SOAPAP data in 2019, the water utility supplied 506,024 dwellings, housing approximately 1,874,084 inhabitants. The amount of water withdrawn was estimated at 181.37 liters per capita per day (LPCD), a data usually published in official reports; however, it implies the inexistence of losses in the networks and the absence of non-domestic uses. If non-domestic uses and network losses are subtracted from the calculation, it results in the delivery of 105.53 LPCD for domestic use, composed of 90.71 LPCD (86%) provided by the utility and 14.83 LPCD (14%) distributed in tanker trucks and bottled water.
Under the scenario of recovering the water lost in the network and distributing water equitably among the population, an extra 72.33 LPCD could be available for distribution. It is to notice that current per capita amount of water lost is greater than the average amount of water received by the inhabitants of several towns in Kenya, Tanzania, andSenegal [119,120].

3.5.1. Accessibility, affordability, and accessibility of water in the central city of Puebla

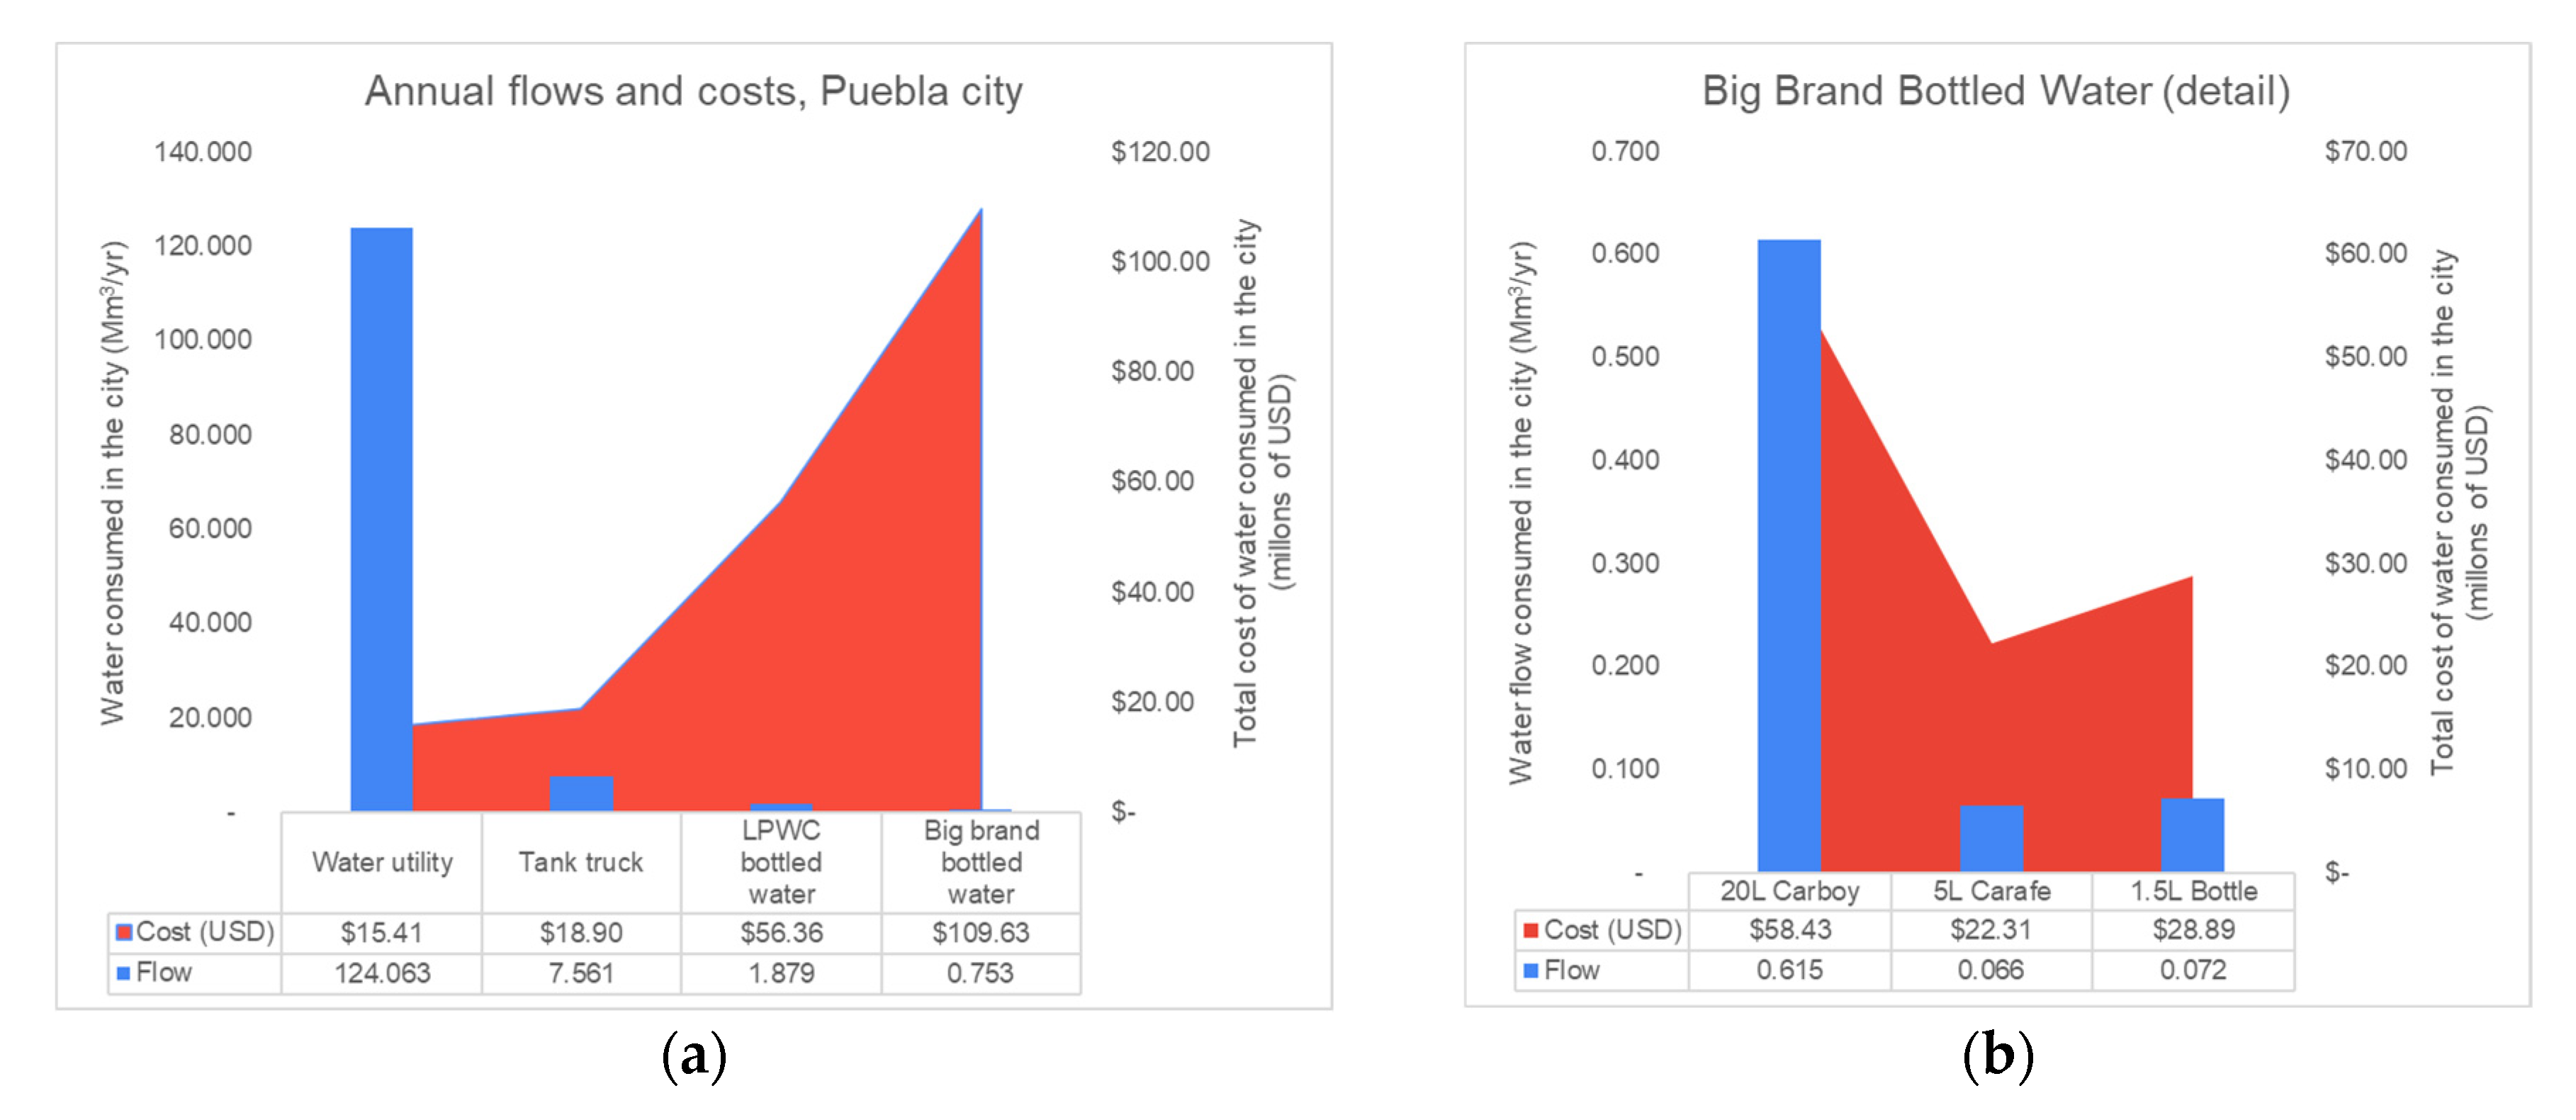
The annual costs paid by users for water distributed by tanker and bottled water was estimated at USD 200.31 million, which is 1,285% higher than what the water utility collected by annual prepayment in 2019 which reached USD$15.41 million (payment collection efficiency was reported to be at around 30% of the total collectable income).
The big brand bottled water, LPWCs, and tanker trucks flows are respectively equal to 0.67%, 1.52%, and 6.10% of the total water volume extracted by the water utility. The amount paid for these flows compared to the amount collected by prepayment in 2019 was: 8 times higher for big brand bottled water; between 3 to 4 times higher for LPWC service; and for tanker truck service it was equivalent (Figure 10). This is without omitting that water shortage enables the proper conditions for increasing water tanker truck rates [121].
The above reveals that the cost paid for alternative water acquisition compared to the collected by the water utility is several times higher, and it indicates that the service quality directly affects water affordability, therefore, the lack of accessibility and acceptability of the water service in the City of Puebla generates water affordability problems, and consequently a lack of compliance of HRWS. At the same time, that situation generates profits for some private parties related to alternative water services, aggravating prevailing income inequalities.
Bottled water consumption in three UWM studies in Mexican cities was inversely proportional to city size. For example, bottled water consumption in Mexico City ranged from 0.65 LPCD [46], for the City of Puebla 3.85 LPCD, and for Tepic 7.09 LPCD [47]. The differences between the three magnitudes refer to the lack of precision in the estimates of bottled water consumption. To corroborate any trend, it is necessary that more UWM studies include the estimation of this flow.

3.6. Data collection

Absences and inconsistencies in the data collected for the UWM model are common in UWM and UM studies [12]. In the case of the City of Puebla, data limitations coincide with water management challenges, for example: the increase in VPA water availability between 2013 and 2016 is incongruent [10,81,82], but is conducive to the concession of larger volumes of water and consequently aggravating the overexploitation of the VPA; the incongruent data related to wastewater treatment is consistent with water pollution [56,63,112,113,114] and related socio-environmental conflicts [31,32]; the absence of information on the consumption of bottled water and water transported by tanker truck conceals the negative consequences of their consumption for water affordability (and thus to the compliance of HRWS). Other information and data limitations hide water issues, masking potential water mismanagement, including informality and illegality.
In the era of information and communication technologies, an automatic and transparent water information monitoring system is possible and should be implemented. This will allow all stakeholders to generate knowledge, awareness and agile decision making on the city's water issues. At this point the UWM approach is useful to integrate water variables and reduce the complexity of these magnitudes to make them more understandable to all stakeholders and to the general public.

5. Conclusions

UWM accounting and helped us to assess the Puebla of City’s main water issues holistically, revealing challenges and opportunities for improving the sustainability of the city’s water metabolism while addressing the HRWS.
The UWM model allowed us to relate the macro processes of the hydrological cycle in the Puebla city with others small-scale sub-processes such as domestic consumption of bottled water, among others. The static model can help us as a basis for future predictive models where effects at different scales can be simulated. And the refinement of the data would help us to disaggregate flows in geographic space to observe asymmetries related to HRWS in the city.
The coincidence between the inconsistencies with the official water data and the water problems, leads us to think that there is a relationship between the quality of the information and unsustainable water management. Therefore, the generation of better quality and transparent information could help to improve the management of water processes, and thus improve the sustainability of the UWM.
Although the accounting of bottled and tankered water flows require further validation, approaching water flows from information taken from consumers offers the opportunity to estimate urban water flows that are not officially recorded, and thus highlight hidden flows and their related implications for complying with HRWS. Furthermore, our findings suggest that the lack of compliance of HRWS goes hand in hand with private profit generation, a plausible reason that may explain why most contestation movements in defense of HWRS are against any water privatization model.
We recognize that UWM accounting for holistically addressing the complexity of urban water systems is a valuable decision-making tool. Moreover, we consider that data generated by UWM accounting exercises and the analyses they enable, can play a key role informing but also empowering non-specialized stakeholders and inhabitants in general. Informed social awareness of prevailing water challenges may in turn generate the adequate environment for further mobilizing key stakeholders, building consensuses and alliances, and promoting the cogeneration of solutions, all of which we expect to be part of normative participatory governance model for a more sustainable, just and inclusive UWM profile for the City of Puebla.
Author Contributions

Conceptualization, D.P.G. and G.C.D.R.; methodology, D.P.G., R.D.P.M., and G.C.D.R.; data mining, validation and curation D.P.G.; software modelling D.P.G.; writing-original draft preparation, D.P.G., G.C.D.R.; writing-review and editing D.P.G., G.C.D.R., R.D.P.M, R.L.L., L.C.R., M.E.R.C., J.V.R.R.F.; visualization, D.P.G. and R.D.P.M.; project administration D.P.G. and R.D.P.M. All authors have read and agreed to the published version of the manuscript.

Funding

This paper presents the main findings of a research project funded by a CONAHCYT’s PhD scholarship, number 749432 through the postgraduate program on Environmental Sciences of the Institute of Sciences at the Autonomous University of Puebla.

Institutional Review Board Statement

Not applicable.

Informed Consent Statement

Not applicable.

Data Availability Statement

Not applicable.

Acknowledgments

Special thanks to CONAHCYT for granting the first author a PhD scholarship (number 749432). Authors also want to express their gratitude to the Postgraduate Program in Environmental Sciences of the Benemérita Universidad Autónoma de Puebla as well as to the SOAPAP and the Agua de Puebla personnel for the information shared, to all those that participated in the online survey and all the anonymous informants who responded the survey or provided information for this study.

Conflicts of Interest

The authors declare no conflict of interest.

Appendix A

Table A1. Description of the terms of the equations for calculating the water flow supplied by tanker truck.
Symbol Variable Unit Source
Qtanker-t Flow distributed by tanker truck. Mm3/yr Result
Qtanker-t,wt Flow distributed by tanker trucks in households with water tank. Mm3/yr Result
Qtanker-t,cis Flow distributed by tanker trucks in households with cisterns. Mm3/yr Result
Awt Total accumulation capacity in dwellings with water tank Mm3 Result
Acis Total accumulation capacity in dwellings with cistern Mm3 Result
Av Total accumulation capacity in all dwellings Mm3 Result
Ac Accumulation capacity in individual homes with cistern. (Lt/hh) Survey*
Pa The number of tanker trucks per year supplied to tanker homes. (tt/yr) Survey *
Rc The ratio of households with a cistern to total households. (adimensional) 2020 census
Mcp The ratio of households with cisterns using tanker trucks to total number of households with cisterns. (adimensional) Survey
At Accumulation capacity in individual homes without a cistern. (Lt/hh) Survey
Pt The number of annual pipelines supplied to homes without a cistern. (tt/yr) Survey *
Rt The ratio of households without a cistern to total households. (adimensional) 2020 census
Mtp The ratio of households without a cistern using a tanker truck to the total number of households without a cistern. (adimensional) Survey
V Total housing in SOAPAP coverage. (dwellings) SOAPAP
*Random values based on probability distribution derived from survey data. Note: tanker truck (tt), household (hh), liters (Lt).
Table A2. Description of the terms of the equations for calculating the flow of water supplied by tanker trucks.
Symbol Variable Unit Source
Qe Bottled water flow rate. Mm3/yr Result
Qem The flow rate of gran-de brand bottled water Mm3/yr Result
Qer The flow rate of bottled water at LPWCs Mm3/yr Result
Qem1 Big Brand bottled water in carboy’s Mm3/yr Result
Qem2 Big Brand bottled water in 5L carafes Mm3/yr Result
Qem3 Big Brand bottled water in 1.5 bottles Mm3/yr Result
Lv1 Liters of water distributed in Big Brand carboys (Lt/d/hh) Survey*
Lv2 Liters of water distributed in Big Brand 5L carafes (Lt/d/hh) Survey *
Lv3 Liters of water distributed in Big Brand 1.5L bottles (Lt/d/hh) Survey *
Lv4 Liters of water distributed in LPWC carboys. (Lt/d/hh) Survey *
Rba The ratio of households consuming bottled water to total households. (adimensional) Survey *
*Random values based on probability distribution derived from survey data. Note: tanker truck (tt), household (hh), liters (Lt).
Table A3. Description of the equations for calculating the water cost distributed by tanker trucks and bottled water.
Symbols Variable Unit Source of information
Ctanker-t, Cem1, Cem2, Cem3, Cem4 Capacity of each type of container Mm3/yr Market
Rtanker-t, Rem1, Rem2, Rem3, Rer Number of each type of container Container’s Equation result
Putanker-t, Puem1, Puem2, Puem3, Puer The unit price of each type of container $/container Price (2021)
Pttanker-t, Ptem1, Ptem2, Ptem3, Pter The total cost of each type of container (Lt/day/hh) Equation result
Note: AE for bottled water. Tanker truck (tt), household (hh), liters (Lt). *Tomado de tiendas comerciales en 2021. El costo suele ser más elevado en tiendas particulares.

Appendix B

A survey was applied to 264 inhabitants of the City of Puebla, excluding 8 that did not correspond to the proposed delimitation. 256 valid responses were processed obtaining the statistical data presented in Table 9. Those parameters simulated with the Monte Carlo method applied to Equations (4), (5) and (14)–(17).
Table A4. Parameters to estimate water supplied by tanker truck and bottled water with Monte Carlo simulation.
Symbol Minimum Mode Maximum Single value Correlation With the variable Assumed distribution
Water supplied by tanker truck
Ac 3,100 7,203 11,600 - 0.95 Atm Beta PERT
Pa 1 2.537 24 - - Beta PERT
Rc - - - 0.590 -1 Rc Yes-No
Mcp Carboy - - - 0.307 - Yes-No
At 450 1,346 1600 - 0.95 Acm Beta PERT
Ptm 1 3.322 24 - - Beta PERT
Rt - - 0.410 -1 Rt Yes-No
Mtp - - - 0.230 - Yes-No
Vt - - - 506,019 - Unique value
Bottled water supply
Ladr 0 2.389 31.429 - -0.562 Qem Triangular
Lad1 0 0.570 20 - 0.106 Lad3 Beta PERT
Lad2 0 0.008 2.143 - -0.000 Lad1 Beta PERT
Lad3 0 0.059 2.357 - 0.290 Lad2 Beta PERT
Rba - - - 0.902 Yes-No

Appendix C

Figure A1. General diagram of the UWM model for the City of Puebla and its metropolitan area.
Preprints 78467 g0a1

References

  1. Ferrao, P.; Fernández, J.E. Sustainable Urban Metabolism; Cambridge, M., Ed.; The Massachusetts Institute of Technology Press: London, England, 2013; ISBN 978-0-262-01936-1. [Google Scholar]
  2. UN World Urbanization Prospects: The 2018 Revision; New York, 2018; Vol. 12.
  3. PNUMA El Peso de Las Ciudades En América Latina y El Caribe: Requerimientos Futuros de Recursos y Potenciales Rutas de Actuación; 2021; ISBN 9789280739022.
  4. Kennedy, C.; Cuddihy, J.; Engel-yan, J. The Changing Metabolism of Cities. J Ind Ecol 2007, 11. [Google Scholar] [CrossRef]
  5. Mankin, J.S.; Seager, R.; Smerdon, J.E.; Cook, B.I.; Williams, A.P. Mid-Latitude Freshwater Availability Reduced by Projected Vegetation Responses to Climate Change. Nat Geosci 2019, 12, 983–988. [Google Scholar] [CrossRef]
  6. IPCC Climate Change 2022 - Impacts, Adaptation and Vulnerability - Summary for Policymakers; Hans-Otto, P., Roberts, D., M. B. Tignor, M., Poloczanska, E., Mintenbelck, K., Alegría, A., Craig, M., Langsdorf, S., Löschke, S., Möller, V., Okem, A., Rama, B., Eds.; Switzerland, 2022.
  7. INECC Programa de Gestión Federal Para Mejorar La Calidad Del Aire de La Megalópolis. 2016, 15, 1–23.
  8. SEDATU; SEGIB; CONAPO Sistema Urbano Nacional 2018; 2018; ISBN 978-607-427-315-1.
  9. CONAGUA Actualización de La Disponibilidad Media Anual de Agua En El Acuífero Vallde De Puebla (2104), Estado de Puebla; 2015.
  10. CONAGUA Actualización de La Disponibilidad Media Anual de Agua En El Acuífero Valle de Puebla (2104), Estado de Puebla; 2020.
  11. Delgado-Ramos, G.C.; Maryke van, S.; Franco Villaseñor, E. Dialogo Mexicano de Talanoa; Primera ed.; Colección Alternativas, 2018; Vol. 39; ISBN 9786073009461.
  12. Zhang, Y. Urban Metabolism: A Review of Research Methodologies. Environ Pollut 2013, 178, 463–473. [Google Scholar] [CrossRef] [PubMed]
  13. Kenway, S.J. The Water-Energy Nexus and Urban Metabolism - Connections in Cities. 2013, 1–62.
  14. Wolman, A. The Metabolism of Cities. Sci Am 1965, 213, 178–193. [Google Scholar] [CrossRef]
  15. Un-Habitat Global Environment for Cities-GEO for Cities: Towards Green and Just Cities; Nairobi, 2021.
  16. Delgado-Ramos, G.C. Complejidad e Interdisciplina En Las Nuevas Perspectivas Socio-Ecológicas: El Caso de La Ecología Política Urbana Anclada En Nociones Metabólicas. Letras Verdes. Revista Latinoamericana de Estudios Socioambientales 2015, 17, 108–130. [Google Scholar] [CrossRef]
  17. Broto, V.C.; Allen, A.; Rapoport, E. Interdisciplinary Perspectives on Urban Metabolism. J Ind Ecol 2012. [Google Scholar] [CrossRef]
  18. Renouf, M.A.; Serrao-Neumann, S.; Kenway, S.J.; Morgan, E.A.; Low Choy, D. Urban Water Metabolism Indicators Derived from a Water Mass Balance – Bridging the Gap between Visions and Performance Assessment of Urban Water Resource Management. Water Res 2017, 122. [Google Scholar] [CrossRef]
  19. Kenway, S.; Gregory, A.; McMahon, J. Urban Water Mass Balance Analysis. J Ind Ecol 2011, 15, 693–706. [Google Scholar] [CrossRef]
  20. Paul, R.; Kenway, S.; McIntosh, B.; Mukheibir, P. Urban Metabolism of Bangalore City: A Water Mass Balance Analysis. J Ind Ecol 2018, 22, 1413–1424. [Google Scholar] [CrossRef]
  21. Huang, C.L.; Vause, J.; Ma, H.W.; Yu, C.P. Urban Water Metabolism Efficiency Assessment: Integrated Analysis of Available and Virtual Water. Science of the Total Environment 2013, 452–453, 19–27. [Google Scholar] [CrossRef]
  22. Fan, J.-L.; Kong, L.-S.; Wang, H.; Zhang, X. A Water-Energy Nexus Review from the Perspective of Urban Metabolism. Ecol Modell 2019, 392, 128–136. [Google Scholar] [CrossRef]
  23. Meng, F.; Liu, G.; Liang, S.; Su, M.; Yang, Z. Critical Review of the Energy-Water-Carbon Nexus in Cities. Energy 2019, 171, 1017–1032. [Google Scholar] [CrossRef]
  24. Lee, M.; Keller, A.A.; Chiang, P.C.; Den, W.; Wang, H.; Hou, C.H.; Wu, J.; Wang, X.; Yan, J. Water-Energy Nexus for Urban Water Systems: A Comparative Review on Energy Intensity and Environmental Impacts in Relation to Global Water Risks. Appl Energy 2017, 205, 589–601. [Google Scholar] [CrossRef]
  25. Venkatesh, G.; Chan, A.; Brattebø, H. Understanding the Water-Energy-Carbon Nexus in Urban Water Utilities: Comparison of Four City Case Studies and the Relevant Influencing Factors. Energy 2014, 75, 153–166. [Google Scholar] [CrossRef]
  26. Kumar, P.; Saroj, D.P. Water-Energy-Pollution Nexus for Growing Cities. Urban Clim 2014, 10, 846–853. [Google Scholar] [CrossRef]
  27. Landa-Cansigno, O.; Behzadian, K.; Davila-Cano, D.I.; Campos, L.C. Performance Assessment of Water Reuse Strategies Using Integrated Framework of Urban Water Metabolism and Water-Energy-Pollution Nexus. Environmental Science and Pollution Research 2020, 27, 4582–4597. [Google Scholar] [CrossRef]
  28. Scott, C.A. The Water-Energy-Climate Nexus: Resources and Policy Outlook for Aquifers in Mexico. Water Resour Res 2011, 47. [Google Scholar] [CrossRef]
  29. Gandy, M. Rethinking Urban Metabolism: Water, Space and the Modern City. City 2004. [Google Scholar] [CrossRef]
  30. Ernstson, H.; Swyngedouw, E. Urban Political, Ecology in the Anthropo-Obscene: Interruptions and Possibilities. Urban Political Ecology in the Anthropo-obscene: Interruptions and Possibilities 2018, 1–272. [Google Scholar] [CrossRef]
  31. López Zamora, R. de J. La Privatización de Los Servicios de Agua Potable y Saneamiento En La Ciudad de Puebla y Zona Conurbada: Gestión y Movimiento Social Por El Agua En México; Montiel & Soriano, 2022; Vol. 21; ISBN 9789896540821.
  32. López Zamora, R. de J. Sujetos Sociales, Conflictos y Gestión de Los Servicios de Agua Potable, Alcantarillado y Saneamiento En El “Espacio Social-Natural” de La Ciudad de Puebla 1984-2010, 2013.
  33. López Zamora, R. de J. Gestión Del Agua Urbana e Industrialización En La Ciudad de Puebla. Desarrollo Local Sostenible 2013, 1–14. [Google Scholar]
  34. Delgado-Ramos Gian Carlo Sobre La Ecología Política Urbana: Una Revisión Panorámica. In Ecología política urbana ante el cambio climático; Ecuador, 2021; pp. 23–36.
  35. Napoletano, B.M.; Paneque-Gálvez, J.; Méndez-Lemus, Y.; Vieyra, A. Geographic Rift in the Urban Periphery, and Its Concrete Manifestations in Morelia, Mexico. Journal of Latin American Geography 2019, 18, 38–64. [Google Scholar] [CrossRef]
  36. Rojas-Ramírez, J.J.P. Periurbanity in Metropolitan Zones of Guadalajara and Ocotlan, Jalisco. Bitacora Urbano Territorial 2019, 29, 23–32. [Google Scholar] [CrossRef]
  37. McCulligh, C.; Fregoso, G.V. Defiance from Down River: Deflection and Dispute in the Urban-Industrial Metabolism of Pollution in Guadalajara. Sustainability 2019, 11. [Google Scholar] [CrossRef]
  38. Luna-Nemecio, J. Sustentabilidad y Economía Política Del Agua En Morelos: Relaciones de Poder, Problemas e Incosistencias En La Contabilidad Hídrica Oficial Por Parte Del Estado Mexicano; 2021; ISBN 9788490225370.
  39. Delgado-Ramos, G.C. Real Estate Industry as an Urban Growth Machine: A Review of the Political Economy and Political Ecology of Urban Space Production in Mexico City. Sustainability 2019, 11, 1980. [Google Scholar] [CrossRef]
  40. Delgado-Ramos, G.C.; Blanco, H. La Transformación de La Infraestructura de Agua Ante El Cambio Climático. In Ciudades sensibles al cambio climático; Mexico, 2018; pp. 265–320.
  41. Salazar, R.; Rojano, A.; López, I. Energy and Environmental Costs Related to Water Supply in Mexico City. Water Sci Technol Water Supply 2012, 12, 768–772. [Google Scholar] [CrossRef]
  42. García-Serna, M.; Morales-Pinzón, T.; Guerrero Erazo, J. Análisis de Flujos de Agua En Áreas Metropolitanas Desde La Perspectiva Del Metabolismo Urbano. Luna Azul 2014, 234–249. [Google Scholar] [CrossRef]
  43. Delgado-Ramos, G.C. Climate-Environmental Governance in the Mexico Valley Metropolitan Area: Assessing Local Institutional Capacities in the Face of Current and Future Urban Metabolic Dynamics. World 2021, 2, 32–48. [Google Scholar] [CrossRef]
  44. Landa-cansigno, O.; Behzadian, K.; Cano, D.D. Water-Energy-Pollutant Nexus Assessment of Water Reuse Strategies in Urban Water Systems Using Metabolism Based Approach.; 2018; Vol. 44.
  45. Townsend, D.A.; Sušnik, J.; van der Zaag, P. Domestic Water Supply Vulnerability to Climate Change and the Role of Alternative Water Sources in Kingston, Jamaica. Atmosphere (Basel) 2020, 11, 1–21. [Google Scholar] [CrossRef]
  46. Delgado-Ramos, G.C. Water and the Political Ecology of Urban Metabolism: The Case of Mexico City. J Polit Ecol 2015, 22, 98–114. [Google Scholar] [CrossRef]
  47. Gutiérrez-Espinosa, G.M. Material Flow Analysis of the Urban Water System in Tepic Mexico: Integral Evaluation and Improvement Options, 2016.
  48. Arora, M.; Yeow, L.W.; Cheah, L.; Derrible, S. Assessing Water Circularity in Cities: Methodological Framework with a Case Study. Resour Conserv Recycl 2022, 178, 106042. [Google Scholar] [CrossRef]
  49. Baldassarre, B.; Schepers, M.; Bocken, N.; Cuppen, E.; Korevaar, G.; Calabretta, G. Industrial Symbiosis: Towards a Design Process for Eco-Industrial Clusters by Integrating Circular Economy and Industrial Ecology Perspectives. J Clean Prod 2019, 216, 446–460. [Google Scholar] [CrossRef]
  50. Hong, Y.; Park, J. Exploring Circular Water Options for a Water-Stressed City: Water Metabolism Analysis for Paju City, South Korea. Sustain Cities Soc 2023, 89, 104355. [Google Scholar] [CrossRef]
  51. Chigeza, P. Water-Energy-Carbon Systems: Transitioning Fron Linear to Circular Economy; First Edit.; Austing Maculey Publishers LLC: New York, NY, 2019; ISBN 9781645360155. [Google Scholar]
  52. Loreto-López, R. Escasez, Guerras y Desigualdad Social. El Proyecto Modernizador Del Sistema de Abasto Hídrico de Una Ciudad Mexicana: Puebla, Siglos XVII-XX. Agua y Territorio 2016, 75. [Google Scholar] [CrossRef]
  53. Juárez Flores, J.J. Entre Fulgores de Ángeles y Máculas de Tizne: Energía, Metabolismo y Degradación Ecológica En El Valle de Puebla-Tlaxcala, 1530-1820. Historia Caribe 2015, 10, 175–210. [Google Scholar] [CrossRef]
  54. Castresana, G.P.; Flores, V.T.; Reyes, L.L.; Aldana, F.H.; Vega, R.C.; Perales, J.L.M.; Suastegui, W.A.G.; Fonseca, A.D.; Silva, A.H. Atoyac River Pollution in the Metropolitan Area of Puebla, México. Water (Switzerland) 2018, 10. [Google Scholar] [CrossRef]
  55. Castresana, G.P.; Roldán, E.C.; Suastegui, W.A.G.; Perales, J.L.M.; Montalvo, A.C.; Silva, A.H. Evaluation of Health Risks Due to Heavy Metals in a Rural Population Exposed to Atoyac River Pollution in Puebla, Mexico. Water (Switzerland) 2019, 11, 1–14. [Google Scholar] [CrossRef]
  56. Estrada, A.; García, W.A.; Chavez, E.; Castelan, R.; Zayas, M.T.; Treviño, S.; Diaz, A.; Handal, A. Mixture of Toxic Metals and Volatile Organic Compounds in a River Induces Cytotoxicity. J Chem 2022, 2022, 1285826. [Google Scholar] [CrossRef]
  57. Estrada-Rivera, A.; Díaz Fonseca, A.; Treviño Mora, S.; García Suastegui, W.A.; Chávez Bravo, E.; Castelán Vega, R.; Morán Perales, J.L.; Handal-Silva, A. The Impact of Urbanization on Water Quality: Case Study on the Alto Atoyac Basin in Puebla, Mexico. Sustainability (Switzerland) 2022, 14, 1–15. [Google Scholar] [CrossRef]
  58. Hernández, J.H.C. Historical Origin of Water Pollution and Legal Analysis of the Atoyac River. Tecnologia y Ciencias del Agua 2021, 12, 133–191. [Google Scholar] [CrossRef]
  59. Ibarrán, M.E.; Saldaña-Vázquez, R.A.; Pérez-García, T. The Cost of Pollution in the Upper Atoyac River Basin: A Systematic Review. arXiv preprint arXiv 2021. [Google Scholar] [CrossRef]
  60. Shruti, V.C.; Jonathan, M.P.; Rodriguez-Espinosa, P.F.; Rodríguez-González, F. Microplastics in Freshwater Sediments of Atoyac River Basin, Puebla City, Mexico. Science of the Total Environment 2019, 654, 154–163. [Google Scholar] [CrossRef]
  61. Martinez-Tavera, E.; Rodriguez-Espinosa, P.F.; Shruti, V.C.; Sujitha, S.B.; Morales-Garcia, S.S.; Muñoz-Sevilla, N.P. Monitoring the Seasonal Dynamics of Physicochemical Parameters from Atoyac River Basin (Puebla), Central Mexico: Multivariate Approach. Environ Earth Sci 2017, 76. [Google Scholar] [CrossRef]
  62. Mora, A.; García-Gamboa, M.; Sánchez-Luna, M.S.; Gloria-García, L.; Cervantes-Avilés, P.; Mahlknecht, J. A Review of the Current Environmental Status and Human Health Implications of One of the Most Polluted Rivers of Mexico: The Atoyac River, Puebla. Science of the Total Environment 2021, 782, 146788. [Google Scholar] [CrossRef] [PubMed]
  63. Rodríguez-Espinoza, P.F.; Morales-García, S.S.; Jonathan, M.P.; Navarrete-Lopez, M.; Bernal-Campos, A.A.; Gonzales, C.; Muñoz-Sevilla, N.P. Servicio Ambiental de La Presa Valsequillo Para Las Cuencas de Los Ríos Del Atoyac-Sahuapan y Alseseca , Puebla , Tlaxcala , México. Instituto Nacional de Ecología y Cambio Climatico (INECC). Secretaria de medio Ambiente y Recursos Naturales (SEMARNAT) 2011, 1–10. [Google Scholar]
  64. Salcedo-Sánchez, E.R.; Esteller, M.V.; Garrido Hoyos, S.E.; Martínez-Morales, M. Groundwater Optimization Model for Sustainable Management of the Valley of Puebla Aquifer, Mexico. Environ Earth Sci 2013, 70, 337–351. [Google Scholar] [CrossRef]
  65. Salcedo-Sánchez, E.R.; Ocampo-Astudillo, A.; Garrido-Hoyos, S.E.; Otazo-Sánchez, E.M. Effects on Groundwater Quality of the Urban Area of Puebla Aquifer. In Water Availability and Management in Meico; Otazo-Sánchez, E.M., Ed.; Springer, 2020; pp. 201–214 ISBN 978-3-030-24962-5.
  66. Gárfias, J.; Arroyo, N.; Aravena, R. Hydrochemistry and Origins of Mineralized Waters in the Puebla Aquifer System, Mexico. Environ Earth Sci 2010, 59, 1789–1805. [Google Scholar] [CrossRef]
  67. Salcedo Sánchez, E.R.; Garrido Hoyos, S.E.; Esteller, M.V.; Martínez Morales, M.; Ocampo Astudillo, A. Hydrogeochemistry and Water-Rock Interactions in the Urban Area of Puebla Valley Aquifer (Mexico). J Geochem Explor 2017, 181, 219–235. [Google Scholar] [CrossRef]
  68. Flores-Márquez, E.L.; Jiménez-Suárez, G.; Matínez-Serrano, R.G.; Chávez, R.E.; Silva-Pérez, D. Study of Geothermal Water Intrusion Due to Groundwater Exploitation in the Puebla Valley Aquifer System, Mexico. Hydrogeology Journal (2006) 2006, 1216–1230. [Google Scholar] [CrossRef]
  69. Martinez Morales, M.; Salcedo, E.R.; Hoyos, S.G.; Esteller, M.V. Simulación de Diferentes Alternativas de Gestión de Los Recursos Hídricos Del Acuífero de Puebla-Atoyac Simulation of Alternatives for Water Management Resources of the Aquifer Puebla-Atoyac. Ingeniería: Revista Académica de la Facultad de IngenieríaUniversidad Autónoma de Yucatán 2015, 19, 62–72. [Google Scholar]
  70. Martínez-Austria, P.F.; Vargas-Hidalgo, A. Modelo Dinámico Adaptativo Para La Gestión Del Agua En El Medio Urbano. Tecnologia y Ciencias del Agua 2016, VII, 139–154. [Google Scholar]
  71. Astudillo Ocampo, A. Impactos En La Calidad Del Agua Que Abastece a La Ciudad de Puebla Por Efecto de La Explotación Del Acuífero, Instituto Mexicano de Tecnología del Agua, 2017.
  72. Vargas Castro, D.A.; López Romero, A.; Domínguez Cuanal, D. del C.; López Vargas, L.V.C. Discriminación de Precios En Las Tarifas de Agua Potable En La Ciudad de Puebla. Aqua-LAC 2021, 13, 58–80. [Google Scholar] [CrossRef]
  73. Morales-García, S.S.; Rodríguez-Espinosa, P.F.; Shruti, V.C.; Jonathan, M.P.; Martínez-Tavera, E. Metal Concentrations in Aquatic Environments of Puebla River Basin, Mexico: Natural and Industrial Influences. Environmental Science and Pollution Research 2017, 24, 2589–2604. [Google Scholar] [CrossRef] [PubMed]
  74. Brenes, R.; Cadena, A.; Ruiz-Guerrero, R. Monitoreo de La Concentración de Nitrato En El Acuífero Del Valle de Puebla. Revista internacional de contaminación ambiental 2011, 27, 323–332. [Google Scholar]
  75. Vargas Castro, D.A. Gestión y Análisis de Conflictos Por Agua En Puebla, BUAP, 2017.
  76. Brunner, P.H.; Helmut, R. Practical Handbook of Material Flow Analysis; Lewis publishers: Florida, 2005; ISBN 00203507207. [Google Scholar]
  77. González de Molina, M.; Toledo, V.M. The Social Metabolism: A Socio-Ecological Theory of Historical Change; Springer: Firenze, Italy, 2014; Volume 3, ISBN 978-3-319-06357-7. [Google Scholar]
  78. CONAGUA; SEMARNAT. Manual de Agua Potable, Alcantarillado y Saneamiento: Eficiencia Energética, Uso Eficiente y Ahorro de La Energía; 2016; ISBN 9786076260159. [Google Scholar]
  79. SENER Factor de Emisión Del Sistema Eléctrico Nacional, 2018; 2019.
  80. Rodríguez-Espinosa, P.F.; Ochoa-Guerrero, K.M.; Milan-Valdes, S.; Teran-Cuevas, A.R.; Hernandez-Silva, M.G.; San Miguel-Gutierrez, J.C.; Diaz, S.C. Origin of a Recent Sinkhole (Socavón) in an Agricultural Field Central Mexico. Concurrence of Natural and Anthropogenic Conditions. SSRN Electronic Journal 2022, 1–15. [Google Scholar] [CrossRef]
  81. CONAGUA Actualización de La Disponibilidad Media Anual de Agua En El Acuífero Valle De Puebla (2104) Estado de Puebla.; 2018; Vol. 3.
  82. CONAGUA Actualización de La Disponibilidad Media Anual de Agua En El Acuífero Valle De Puebla (2104), Estado de Puebla; México, D. F., 2015.
  83. Núñez, E. Urge Una Nueva Ley Del Agua; Con La Actual Legislación Las Empresas Privadas Tienen El Control Del Líquido: Conagua. La Jornada de Oriente 2022, 6–7. [Google Scholar]
  84. Villaseñor, A. Veredicto de Conagua No Permite Tener Ideas Conclusivas Del Origen Del Socavón: Cupreder. La Jornada de Oriente 2021.
  85. Tinsaresearch Reporte Industrial Puebla 2016; 2016.
  86. Cabrera Montiel, L.; Delgado, J. Sector Inmobiliario y Estructura Urbana En La Ciudad de Puebla 1900-2010. Secuencia 2019. [Google Scholar] [CrossRef]
  87. Martínez Olivarez, P.; Espacios Urbanos, A. DE; Diseño, C.Y. La Política de Suelo Del Megaproyecto Urbano Angelópolis y Sus Efectos En La Periferia Poniente de Puebla. Anuario de Espacios Urbanos 2015. [Google Scholar] [CrossRef]
  88. Lamundi Reporte de Bienes Raíces Puebla; Puebla, 2023.
  89. Rangel, J. Canadevi y Autoridades Construirán Más de Tres Mil Viviendas En Puebla.
  90. McDonald, R.I.; Weber, K.F.; Padowskic, J.; Boucher, T.; Shemie, D. Estimating Watershed Degradation over the Last Century and Its Impact on Water-Treatment Costs for the World’s Large Cities. Proc Natl Acad Sci U S A 2016, 113, 9117–9122. [Google Scholar] [CrossRef]
  91. IBERO Puebla, N. Los Otros Costos Del Deterioro En El Atoyac. Available online: https://www.iberopuebla.mx/noticias_y_eventos/noticias/los-otros-costos-del-deterioro-en-el-atoyac.
  92. Rivera González, B. Sarro En Suministro de Agua de Puebla Tapa Tuberías de Santa Catarina, Acusan. Ángulo7 2020.
  93. Núñez, E. 15 Mil Habitantes de Cuatro Colonias No Tienen Servicio de Agua, Señalan Que Concesiones Integrales Les Ha Cortado El Servicio. La Jornada de Oriente 2022.
  94. CONAGUA; SEMARNAT; IMTA Programa de Indicadores de Gestión de Organismo Operadores. Available online: http://www.pigoo.gob.mx/organismosoperadores.jsp.
  95. Valeria, G. Medidores de Agua de Puebla Significan Otro Sangrado Más a La Población: ASA. Diario Cambio de Puebla 2019.
  96. Castillo Jorge Agua de Puebla Pretende Imponer Medidores; Promete Servicio 24 Horas al Día. Intolerancia diario 2022.
  97. Castillo Jorge Pierde Agua de Puebla Amparo Por Cobros Excesivos. Intolerancia diario 2022.
  98. Macuitl Paola Agua de Puebla Manda a Buró de Crédito Por No Pagar Servicio, Acusan. Ángulo 7 2022.
  99. Vera Cortés, S. Se Niega Agua de Puebla a Levantar Reportes Tras Crecientes Cortes de Agua En San Manuel. Megalópolis 2019.
  100. Martha Cuaya Siete Colonias de Puebla Han Reportado Mas de Mil Cortes de Agua: Activista. El Sol de Puebla 2023.
  101. ASA Asamblea Social Del Agua. Available online: http://asambleasocialdelagua.org/.
  102. Staff Admiten Demanda Colectiva Contra Agua de Puebla Por Falta de Saneamiento 2023.
  103. Camacho Mónica Reforma de Merino y Biestro No Frenó Cortes de Agua; Suman 2 Mil Esde Su Aprobación: Omar Jiménez. La Jornada de Oriente 2021.
  104. Camacho Mónica Autorizar Aumento a Las Tarifas Del Agua Sería Solapar El Fracaso de Agua de Puebla: Francisco Castillo. La Jornada de Oriente 2022.
  105. Hernández Gabriela Puebla: Permiten a Concesionaria Que Aumente La Tarifa Del Agua Sin Pasar Por El Congreso. Proceso 2022.
  106. Martínez Berenice Integrantes de La ASA Exigen Desprivatizar El Agua En Puebla. Retodiario 2023.
  107. Castro-Pastrana, L.I.; Cerro-López, M.; Toledo-Wall, M.L.; Gómez-Oliván, L.M.; Saldívar-Santiago, M.D. Análisis de Fármacos En Aguas Residuales de Tres Hospitales de La Ciudad de Puebla, México. Ingeniería del agua 2021, 25, 59. [Google Scholar] [CrossRef]
  108. Paulo Henrique Prado Stefano; Roisenberg, A.; Santos, M.R.; Dias, M.A.; Montagner, C.C. Unraveling the Occurrence of Contaminants of Emerging Concern in Groundwater from Urban Setting: A Combined Multidisciplinary Approach and Self-Organizing Maps. Chemosphere 2022, 299. [CrossRef]
  109. WWAP (Programa Mundial de Evaluación de los Recursos Hídricos de las Naciones Unidas) Informe Mundial de Las Naciones Unidas Sobre El Desarrollo de Los Recursos Hídricos 2017. Agua Residuales: El Recurso Desaprovechado.; París, 2017.
  110. Ellis, J.B.; Revitt, D.M. Sewer Losses and Interactions with Groundwater Quality. Water Science and Technology 2002, 45, 195–202. [Google Scholar] [CrossRef] [PubMed]
  111. CONAGUA.SEMARNAT Estadisticas Del Agua En México 2018. 2018.
  112. Domínguez-Mariani, E.; Carrillo-Chávez, A.; Ortega, A.; Orozco-Esquivel, M.T. Wastewater Reuse in Valsequillo Agricultural Area, Mexico: Environmental Impact on Groundwater. Water Air Soil Pollut 2004, 155, 251–267. [Google Scholar] [CrossRef]
  113. Mancilla-Villa, Ó.R.; Ortega-Escobar, H.M.; Ramírez-Ayala, C.; Uscanga-Mortera, E.; Ramos-Bello, R.; Reyes-Ortigoza, A.L. Metales Pesados Totales y Arsénico En El Agua Para Riego de Puebla y Veracruz, México. Revista Internacional de Contaminacion Ambiental 2011, 28, 39–48. [Google Scholar]
  114. López-Vargas, R.; Méndez-Serrano, A.; Albores-Medina, A.; Oropeza-Hernández, F.; Hernández-Cadena, L.; Mercado-Calderón, F.; Alvarado-Toledo, E.; Herrera-Morales, S.; Arellano-Aguilar, O.; García-Vargas, G.; et al. Oxidative Stress Index Is Increased in Children Exposed to Industrial Discharges and Is Inversely Correlated with Metabolite Excretion of Voc. Environ Mol Mutagen 2018, 59, 639–652. [Google Scholar] [CrossRef] [PubMed]
  115. Castillo Kara Saneamiento de Agua de Puebla, Fraude; Daño Alcanzaría a Los 6 Mmdp: Activista. e-consulta 2023.
  116. Daniela, H. Activistas Buscan Demanda Colectiva Contra Agua de Puebla Por Servicio de Mala Calidad. El Sol de Puebla 2022.
  117. EJAtlas Río Atoyac (Tlaxcala-Puebla), Infierno Ambiental. México.
  118. CONAGUA; SEMARNAT Manual de Agua Potable, Alcantarillado y Saneamiento: Estructuras Tarifarias; 2016; ISBN 9786076260159.
  119. Hall, R.P.; Van Koppen, B.; Van Houweling, E. The Human Right to Water: The Importance of Domestic and Productive Water Rights. Sci Eng Ethics 2014, 20, 849–868. [Google Scholar] [CrossRef]
  120. Dessu, S.B.; Melesse, A.M.; Bhat, M.G.; McClain, M.E. Assessment of Water Resources Availability and Demand in the Mara River Basin. Catena (Amst) 2014, 115, 104–114. [Google Scholar] [CrossRef]
  121. Díaz Paulina Colonias En Puebla, Con Desabasto de Agua y Piperos Se Aprovechan. Ángulo 7 2023.
Figure 1. Urban Water Metabolism and its nexus with energy and carbon conceptual model. Authors’ own elaboration.
Preprints 78467 g001
Figure 2. Delimitations of the study area. Authors’ own elaboration.
Preprints 78467 g002
Figure 3. Water runoff in PVA. Authors’ own elaboration.
Preprints 78467 g003
Figure 4. Summary of induction method for tanker truck and bottled water flows. Authors’ own elaboration.
Preprints 78467 g004
Figure 5. UWM of the City of Puebla and its metropolitan area. Authors’ own elaboration.
Preprints 78467 g005
Figure 6. Urban Water Metabolism in the outskirts of the central city of Puebla. Authors’ own elaboration.
Preprints 78467 g006
Figure 7. Water uses in the central city. Authors’ own elaboration.
Preprints 78467 g007
Figure 8. Probability of water accumulation capacity in city dwellings. Authors’ own elaboration. Note: Units on the abscissa axis are Mm3, and the ordinate axis refers to probability.
Preprints 78467 g008
Figure 9. The wastewater treatment process at the water utility. Authors’ own elaboration.
Preprints 78467 g009
Figure 10. Flows and their total annual costs in Puebla city. Authors’ own elaboration
Preprints 78467 g010
Table 4. Flows extracted by the City of Puebla’s water utility, subdivided by municipality of water origin.
Municipality where water was extracted Annual Flow extracted by the water utility (Mm3/yr) Percentage (%)
Puebla 78.657 63.4 %
Cuautlancingo 11.622 9.4 %
Coronango 9.988 8.1 %
Nealtican 9.472 7.6 %
San Pedro Cholula 4.944 4.0 %
San Andrés Cholula 4.605 3.7%
Tlaltenango 4.222 3.4 %
Juan C. Bonilla 0.339 0.3 %
Amozoc 0.214 0.2 %
Source: Authors’ own elaboration based on SOAPAP’s 2019 data.
Table 5. Flows softened by the water company in Puebla central city.
Water softener plant Annual softened flow (Mm3/a) Percentage (%) Amount of chemicals (Kton/a) Consumption of chemicals (Kg/m3)
Quetzatcoatl 5.77 60.3 % 2.77 0.481
Sulfurosa 2.51 26.2 % 5.99 2.388
Jint 1.29 13.5 % 0 Inconsistent data
Paseo del Río 0 0 % 0.07 Inconsistent data
Source: Authors’ own elaboration based on data from SOAPAP 2018.
Table 6. Magnitude of water flows distributed by tanker trucks and bottled water.
Flow Calculated magnitude Total
Distributed by tanker truck 7.561 Mm3/yr
 In homes with a water tank 0.526 Mm3/yr
 In homes with a water tank and cistern 7.035 Mm3/yr
Big Brand bottled water 0.753 Mm3/yr
 20L carboys 0.687 Mm3/yr
 5L carafes 0.066 Mm3/yr
 1.5L bottle 0.072 Mm3/yr
LPWC bottled water 1.879 Mm3/yr
Source: Authors’ own elaboration.
Table 7. Influent disaggregated for consumption process in the UWM of the central city of Puebla.
Influent source Flow Mm3/a Percentage of total (%)
Water Utility 74.59 61.55
Surface water not withdrawn by the water utility 19.36 15.97
Groundwater not withdrawn by water utility 15.96 13.17
Water distributed by tanker truck to households 7.56 6.25
LPWC bottled water 1.88 1.56
Big Brand bottled water 0.75 0.69
Recycled water from WWTPs 1.03 0.85
Rainwater harvesting in homes 0.05 0.04
Total 121.17
Discharges to sewers or water bodies 97.24 0.25
Evaporation in water uses 24.31 20.06
Discharge of the water treatment process at LPWC - 0.38* -0.31
Total 121.17
Source: Authors’ own elaboration. * Negative sign because it is wastewater that does not enter the uses.
Table 8. Water Flow consumed in the central city of Puebla by uses.
Consumption Annual flow (Mm3/yr) Percentage of total
Domestic 71.45 (58.96%)
Public 17.75 (14.65%)
Commercial 13.05 (10.77%)
Industrial** 10.44 (8.61%)
Services 5.99 (4.92%)
Aquaculture 0.596 (0.49%)
Different Uses 0.514 (0.42%)
Domestic not supplied by SOAPAP 0.050 (0.04%)
Livestock 0.032 (0.03%)
Bottled water in non-domestic uses 0.263 (0.22%)
Recycled water for irrigation of municipal gardens 1.03 (0.85%)
Electric power generation 114.00 *
Source: CONAGUA 2019 and SOAPAP 2019. * Electricity generation was not included in the percentage of uses. ** In the information obtained from SOAPAP, we noticed some industrial consumption accounted as domestic, so the industrial consumption is probably higher than the one indicated.
Table 9. Urban Water Metabolism energy consumption and carbon emissions in the water utility.
Processes Percentage Consumption of energyGWh Mm3/a (hm3/yr) KWh/m3 KtCO2e KgCO2e/m3
Extraction 68.78% 71.09 124.06 0.5730 37.47 0.3020
Water treatment 4.69% 4.85 9.57 0.5066 2.55 0.2670
Pumping 17.71% 18.31 124.06 0.1476 9.65 0.0778
Sewage 0.62% 0.64 97.25 0.0065 0.34 0.0034
Wastewater treatment 7.77% 8.03 63.91 0.1257 4.23 0.0662
General services 0.43% 0.44 124.06 0.0036 0.23 0.0019
Water Utility 103.36 124.06 0.8331 54.47 0.4391
Source: Authors’ own elaboration.
Disclaimer/Publisher’s Note: The statements, opinions and data contained in all publications are solely those of the individual author(s) and contributor(s) and not of MDPI and/or the editor(s). MDPI and/or the editor(s) disclaim responsibility for any injury to people or property resulting from any ideas, methods, instructions or products referred to in the content.
Copyright: This open access article is published under a Creative Commons CC BY 4.0 license, which permit the free download, distribution, and reuse, provided that the author and preprint are cited in any reuse.
Prerpints.org logo

Preprints.org is a free preprint server supported by MDPI in Basel, Switzerland.

Subscribe

© 2024 MDPI (Basel, Switzerland) unless otherwise stated