Submitted:
04 July 2023
Posted:
05 July 2023
You are already at the latest version
Abstract

Keywords:
1. Introduction
2. Experimental
2.1. Materials
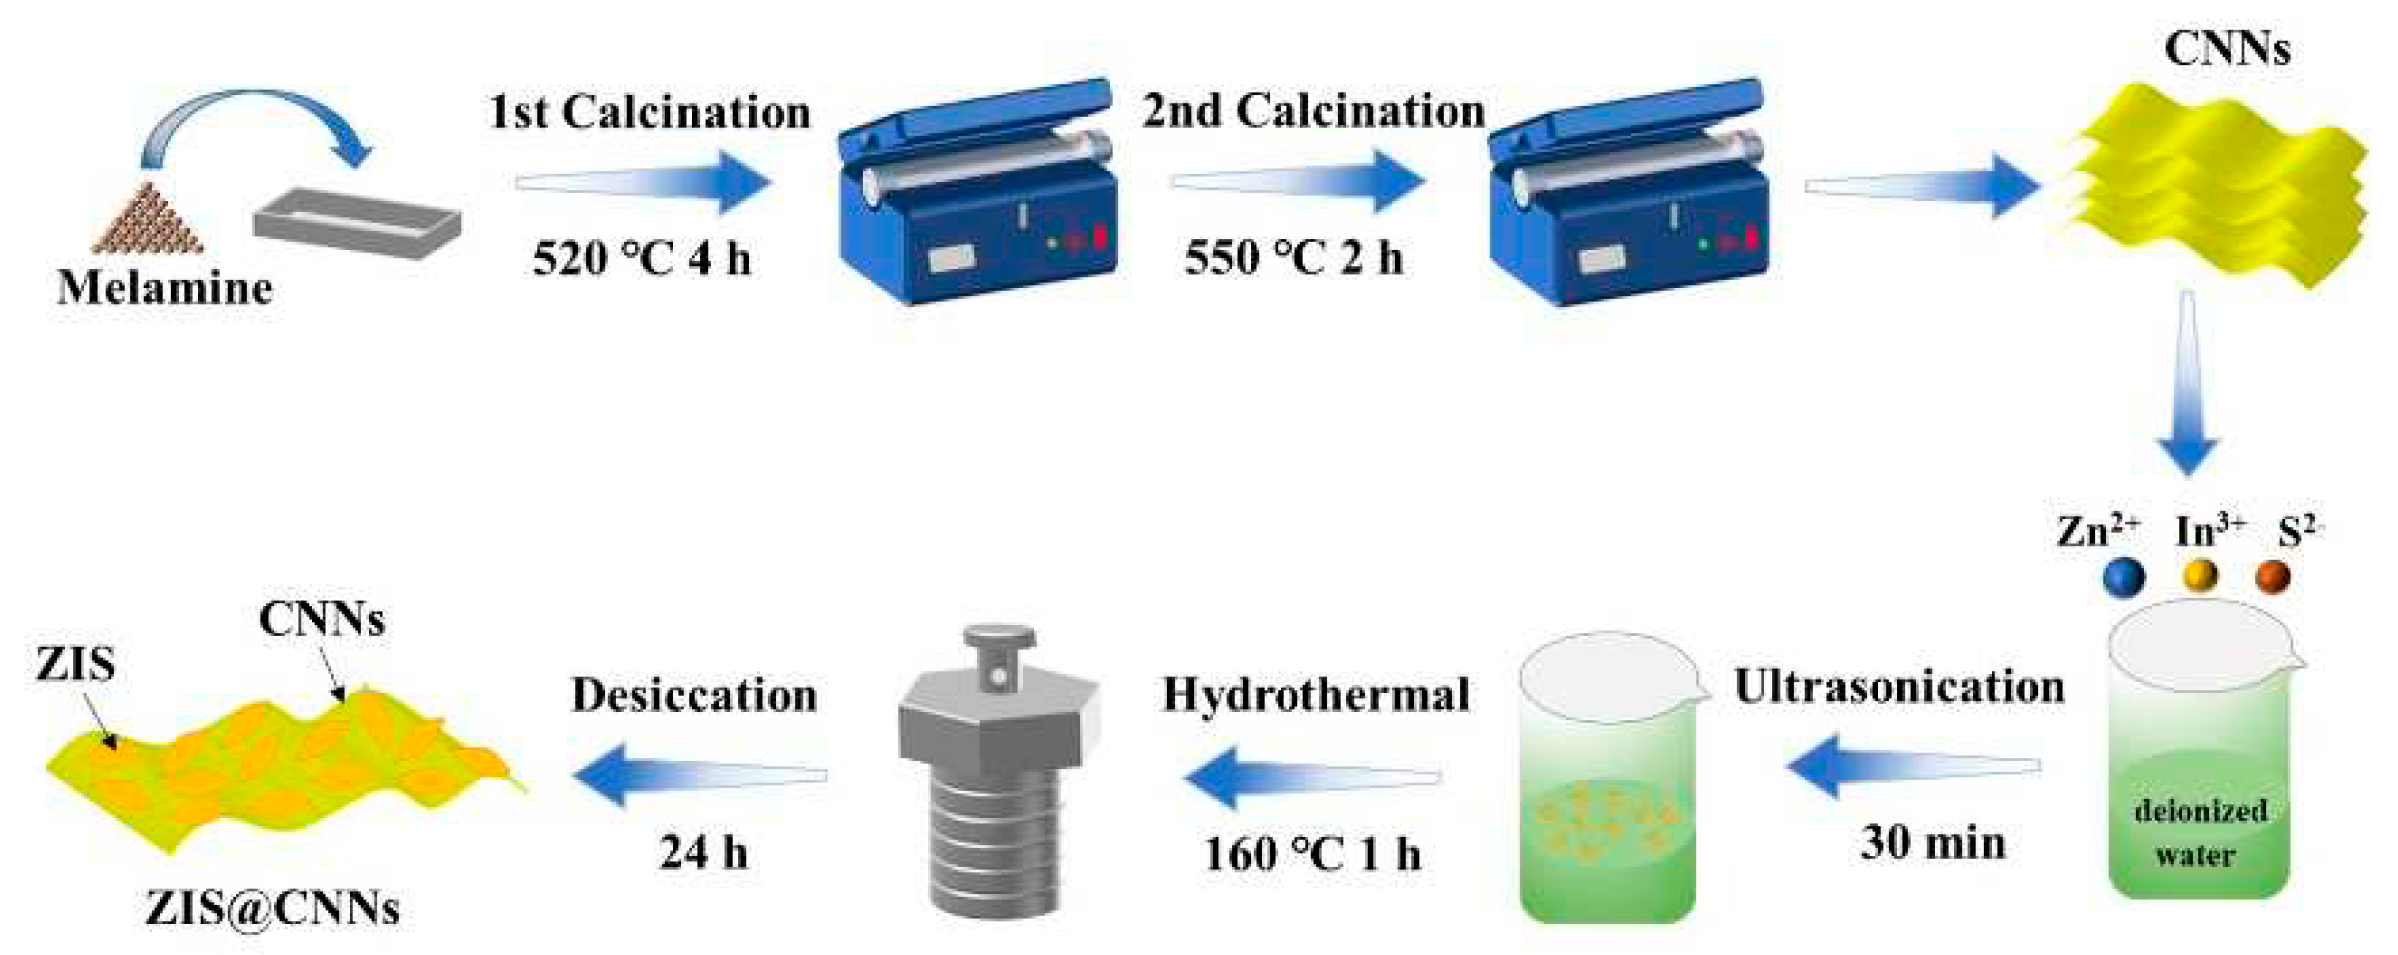
2.2. Synthesis of CNNs
2.3. Fabrication of ZIS@CNNs photoelectrodes
2.4. Characterization
2.5. Electrochemical tests
3. Results and discussion
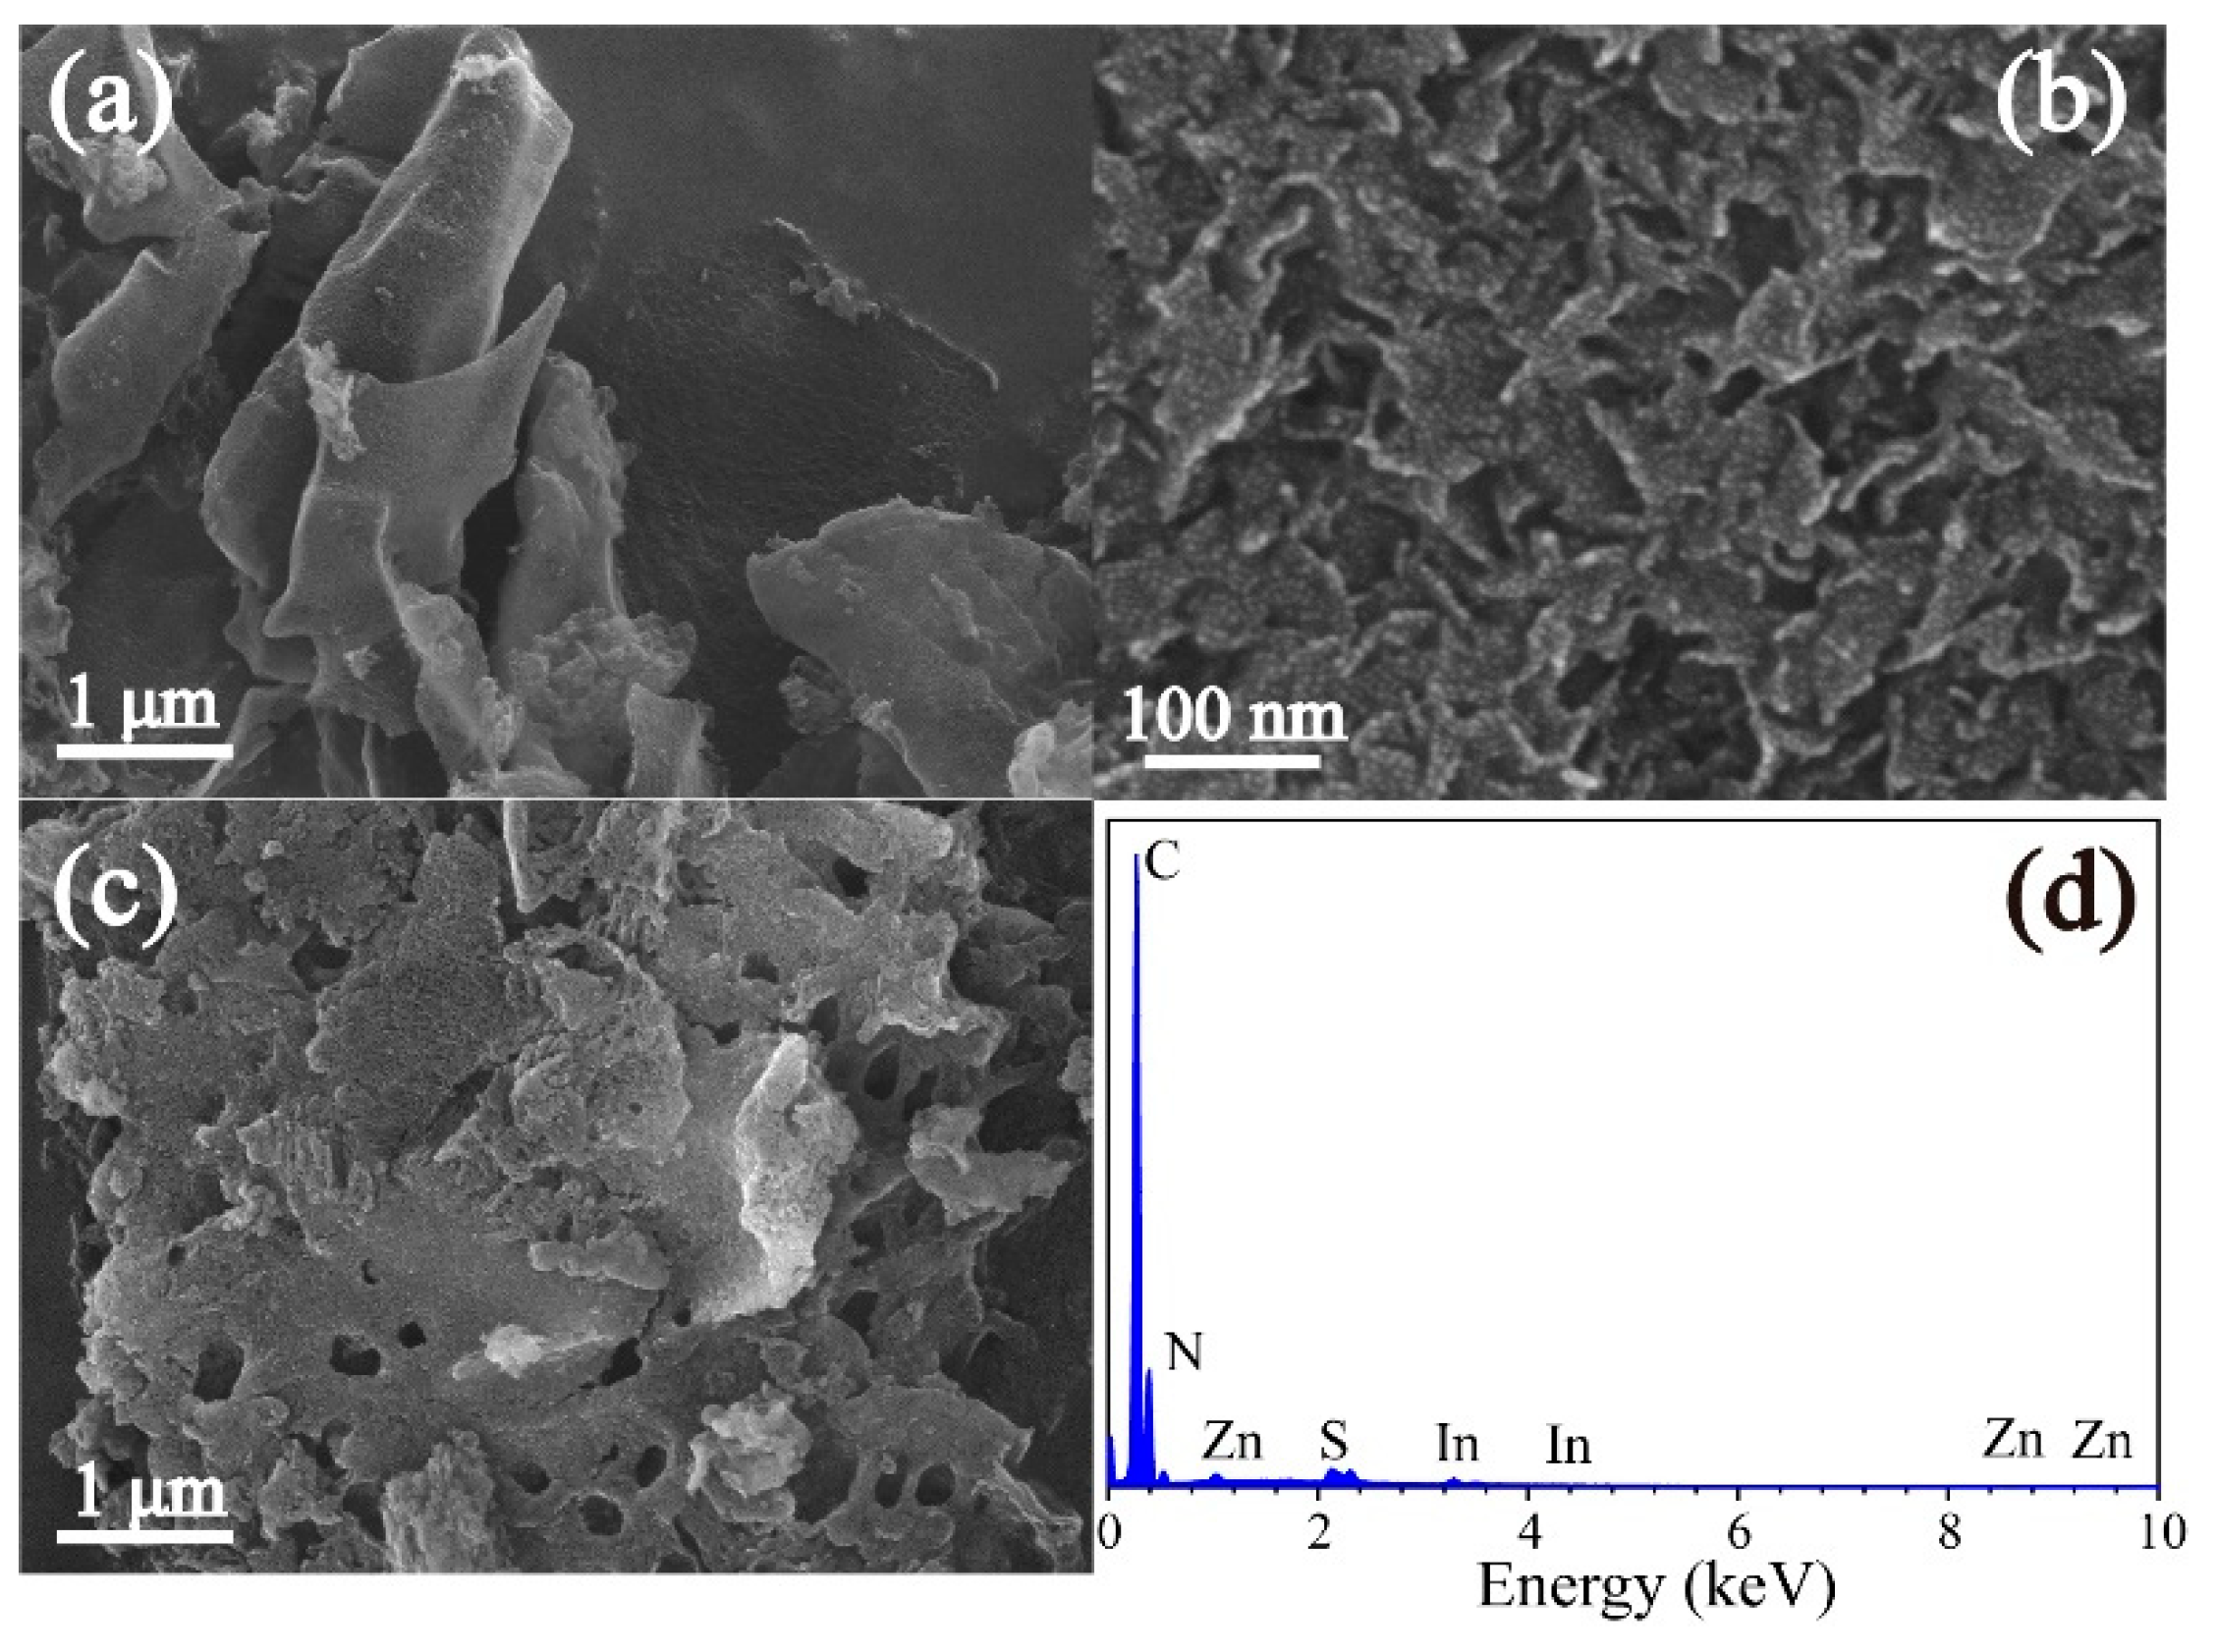
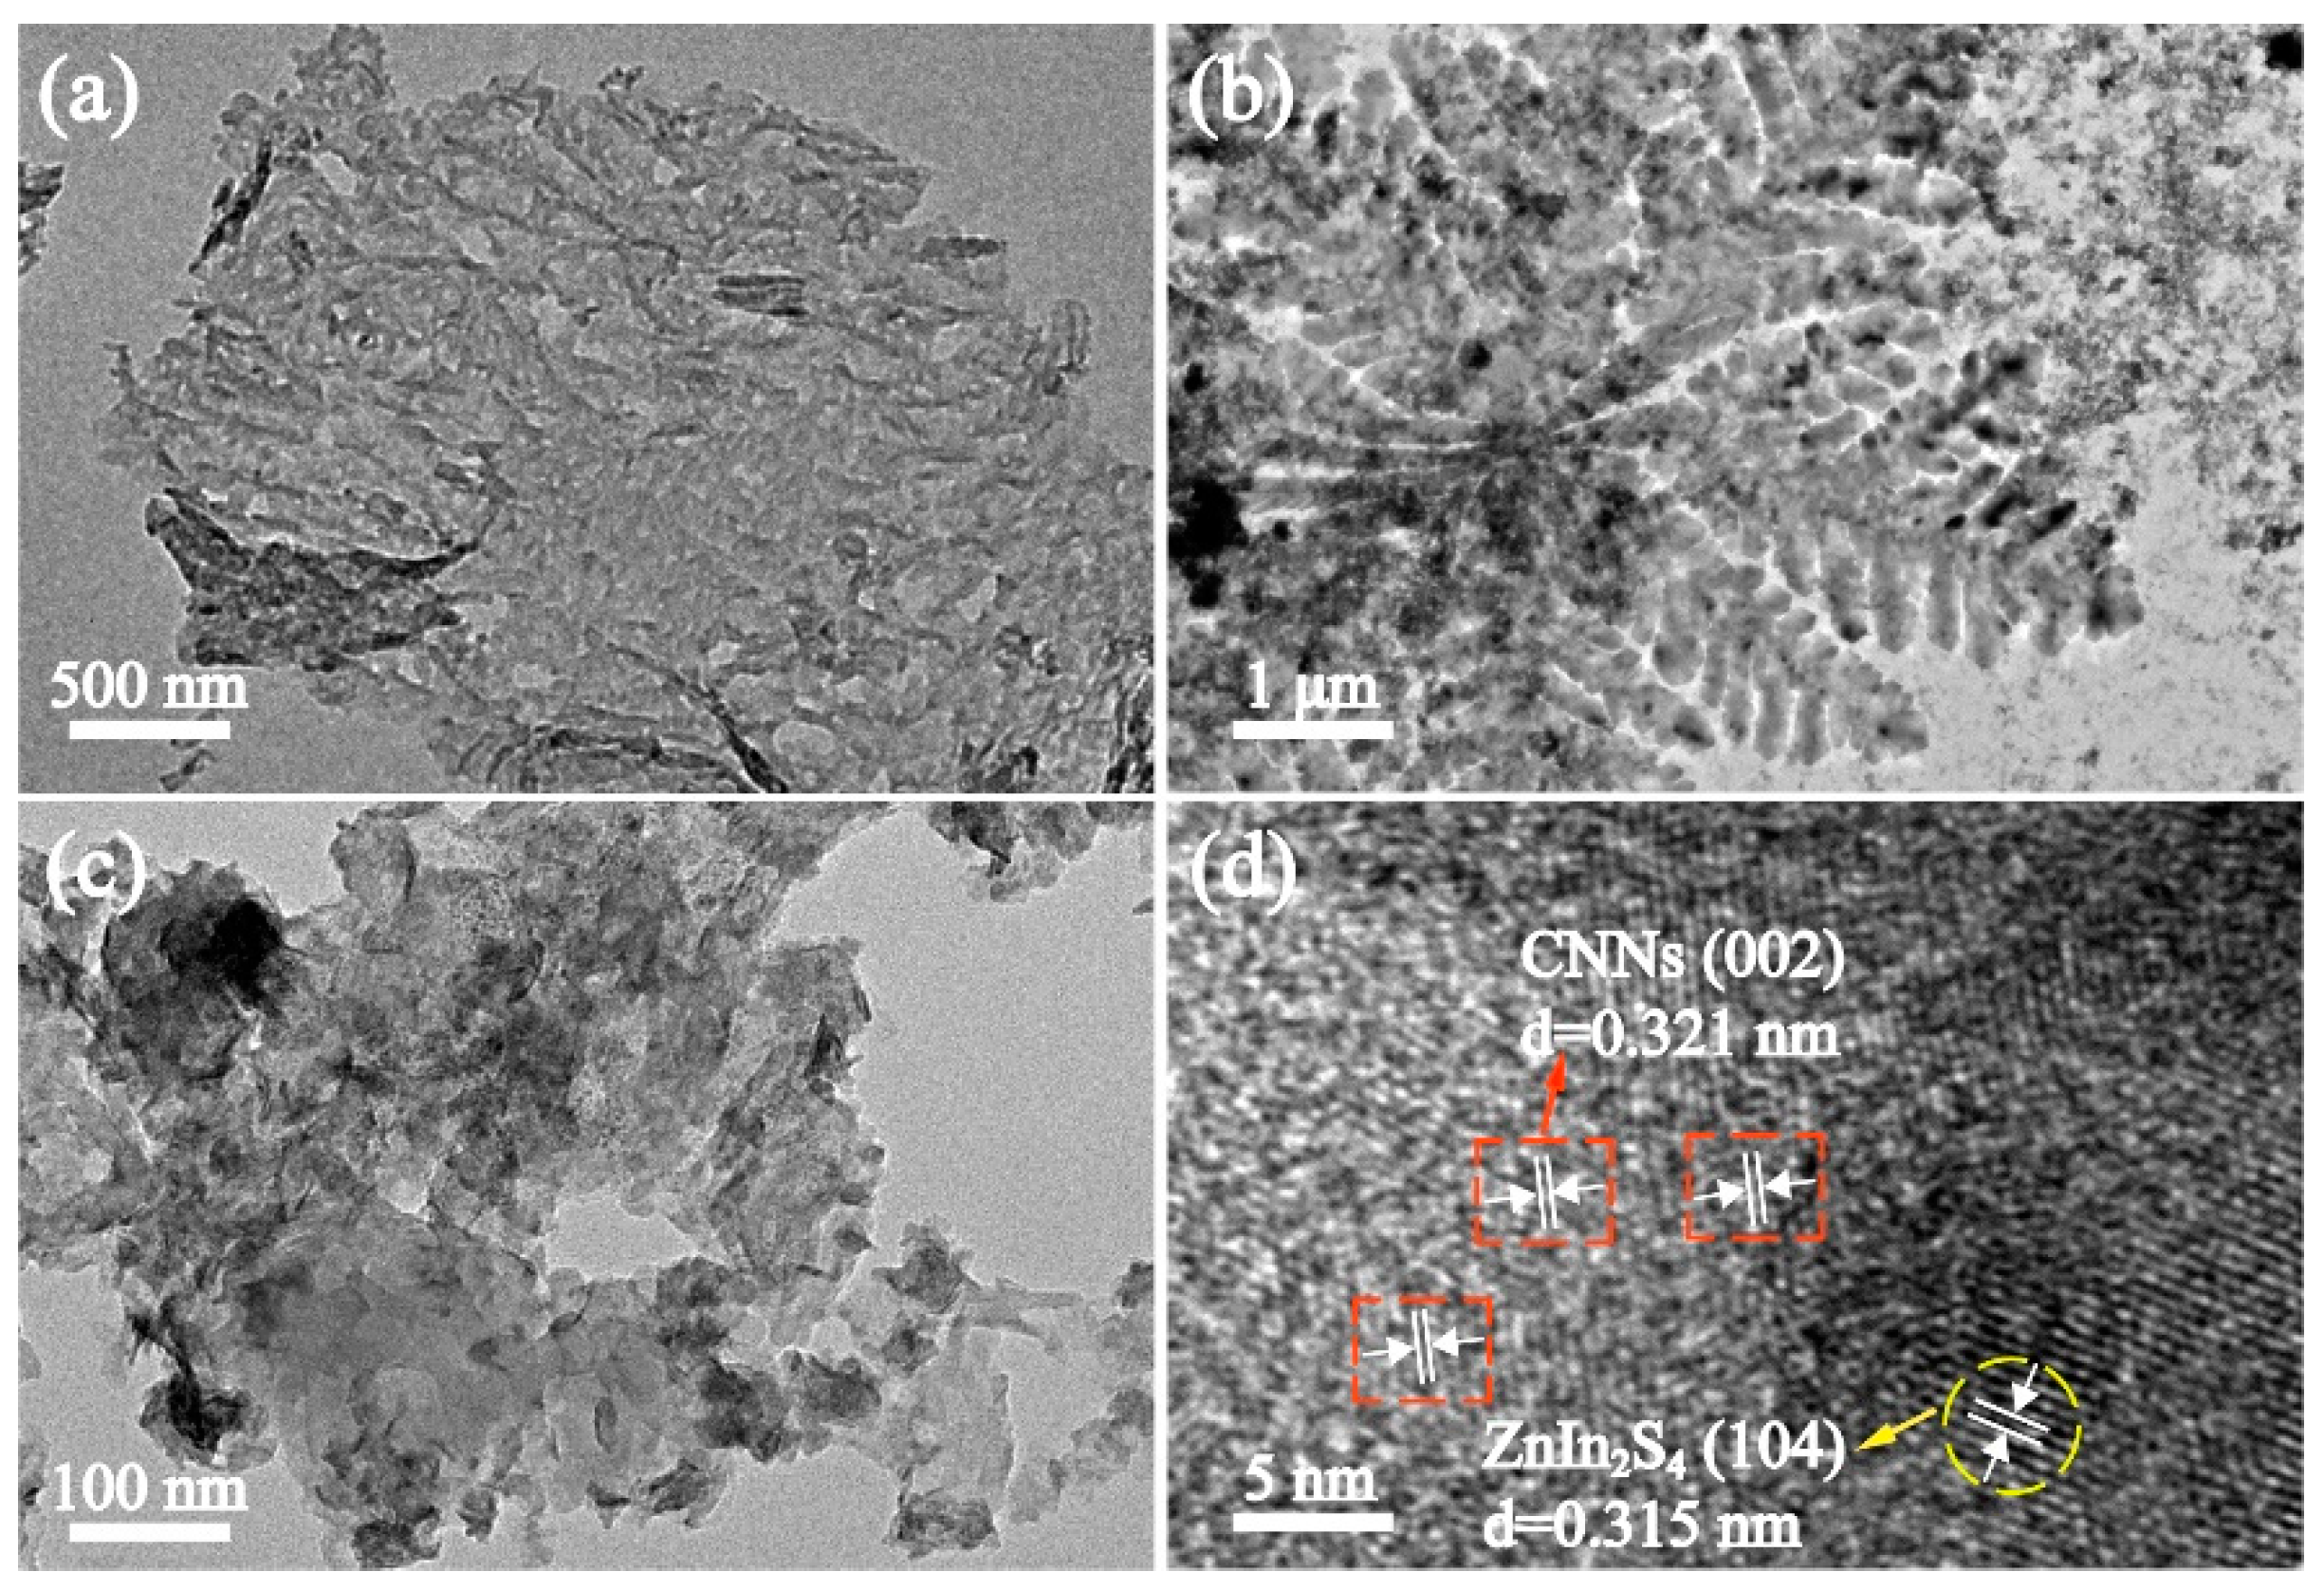
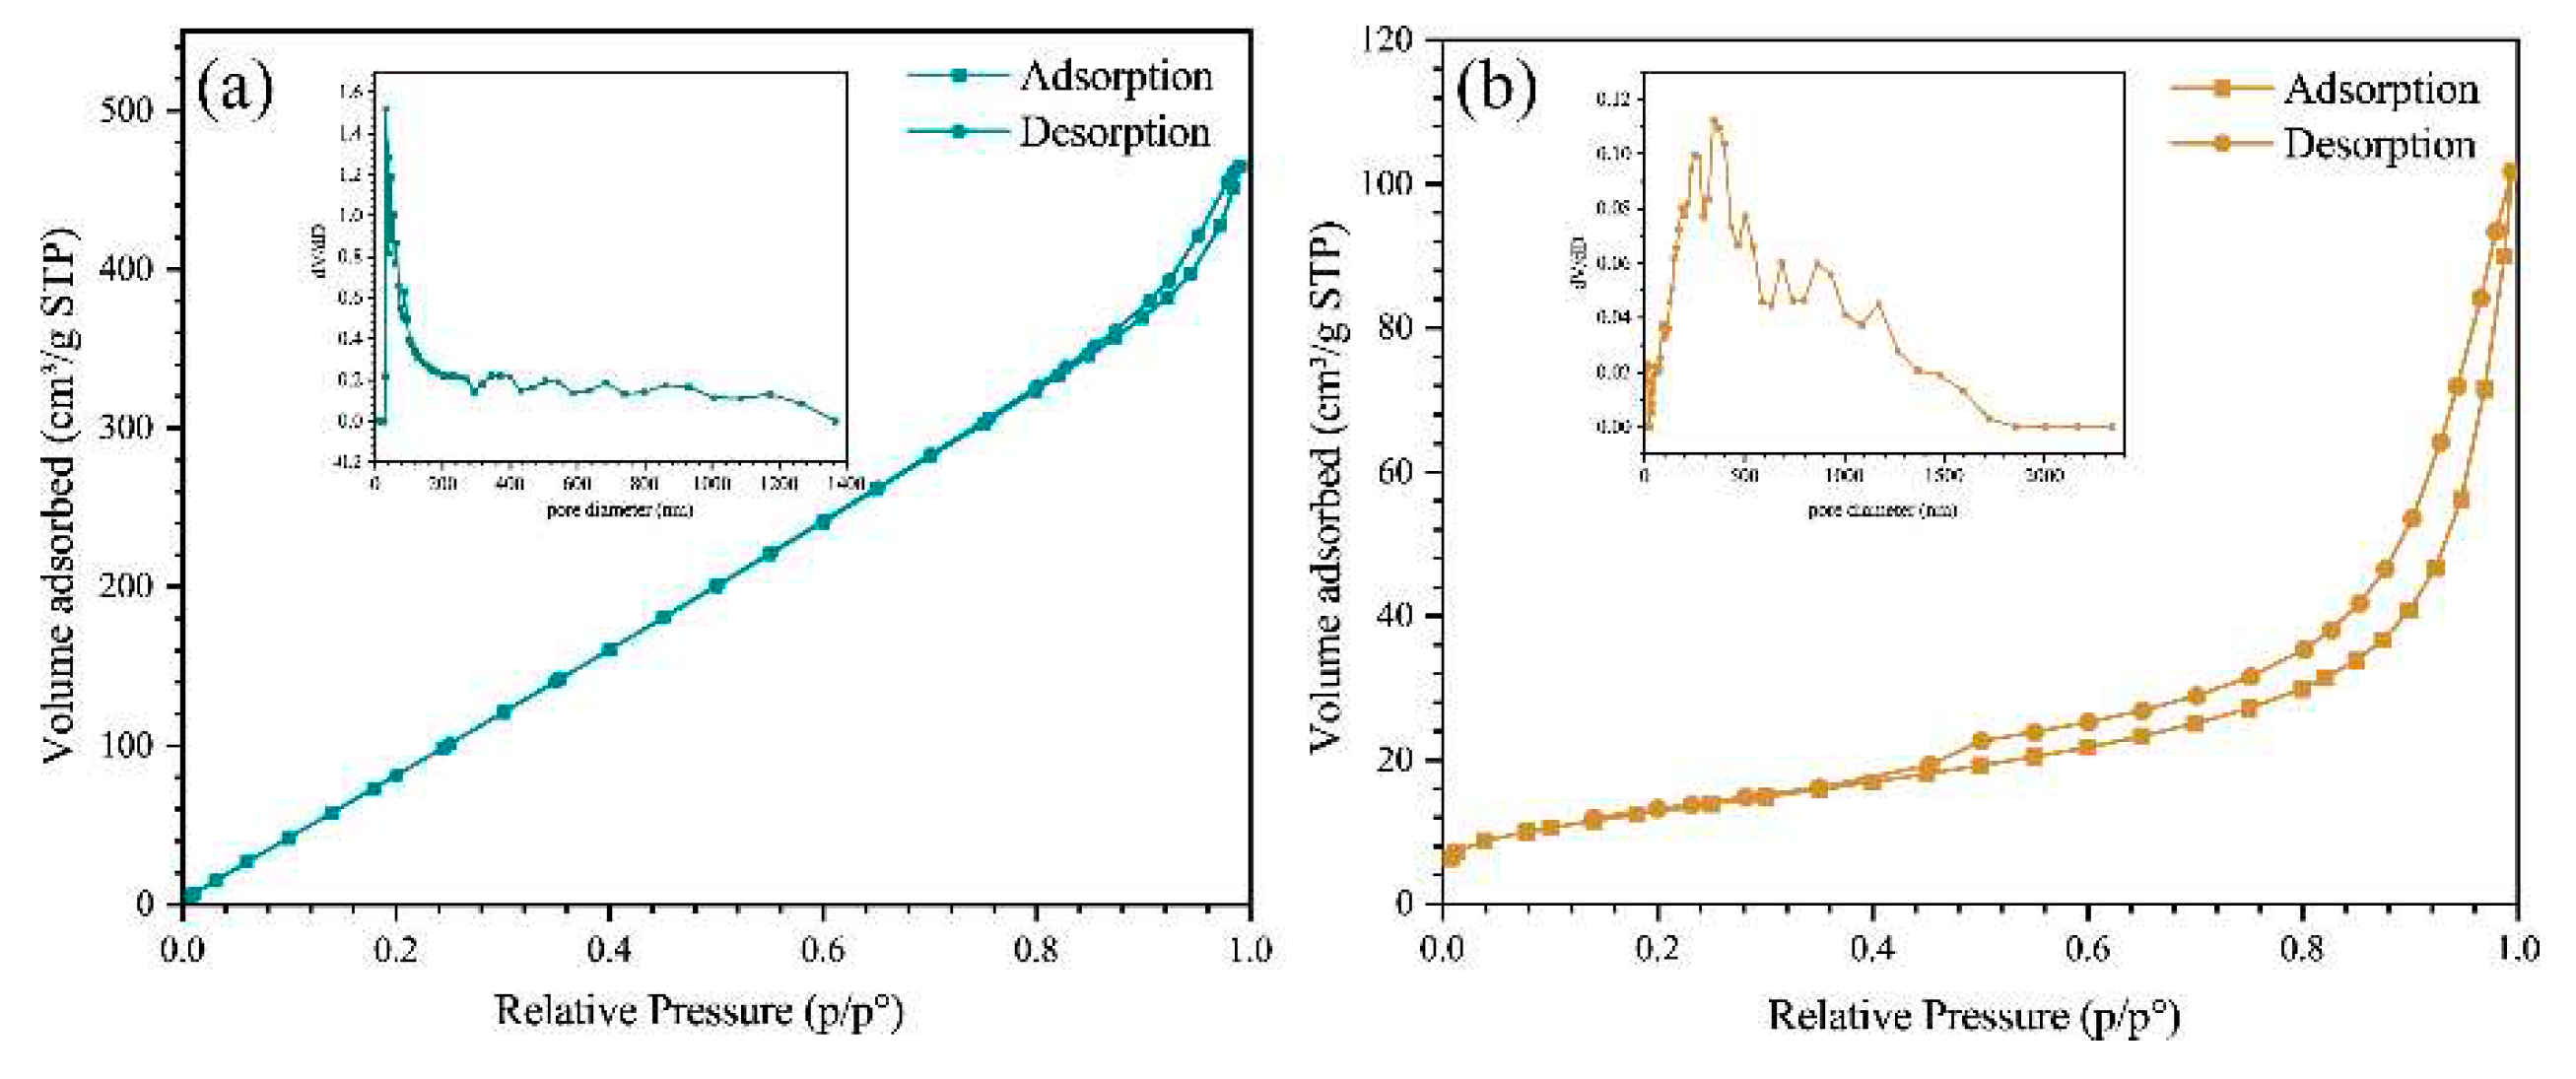
3.1. Characterization of ZIS@CNNs composites
3.2. Light absorption properties
3.3. PCP effects
3.4. Mechanism analysis
4. Conclusions
Supplementary Materials
Author Contributions
Funding
Data Availability Statement
Conflicts of Interest
References
- Guo, H.; Zhang, Y.; Wang, S.; Li, L.; Wang, W.; Sun, Q. In-situ generation of Bi2S3 to construct WO3/BiVO4/Bi2S3 heterojunction for photocathodic protection of 304 SS. J Electroanal Chem. 2022, 907, 116033. [Google Scholar] [CrossRef]
- Wang, X.; Pu, J.; Liu, J.; Ren, M.; Nan, Y.; Liu, M.; Xu, H.; Yang, L.; Huang, Y.; Hou, B. PDA decorated spaced TiO2 nanotube array photoanode material for photocathodic protection of 304 stainless steels. J Electroanal Chem. 2022, 914, 116319. [Google Scholar]
- Wang, X.; Xu, H.; Nan, Y.; Sun, X.; Duan, J.; Huang, Y.; Hou, B. Research progress of TiO2 photocathodic protection to metals in marine environment. J Oceanol Limnol 2020, 38, 1018–1044. [Google Scholar] [CrossRef] [PubMed]
- Zhang, J.; Yang, H.; Wang, Y.; Cui, X.; Wen, Z.; Liu, Y.; Fan, L.; Feng, J. Facile fabrication of SnO2 modified TiO2 nanorods film for efficient photocathodic protection of 304 stainless steel under simulated solar light. Corros Sci. 2020, 176, 108927. [Google Scholar] [CrossRef]
- Qiu, J.; Wei, S.; Pan, J.; Liang, Z.; Ma, J.; Liang, Q.; Li, C. g-C3N4-loaded carbon nanofiber for efficient photocatalytic hydrogen production. Integr Ferroelectr. 2023, 231, 70–77. [Google Scholar] [CrossRef]
- Zhang, X.; Liang, H.; Li, C.; Bai, J. 1D CeO2/g-C3N4 type II heterojunction for visible-light-driven photocatalytic hydrogen evolution. Inorg Chem Commun 2022, 144, 109838. [Google Scholar] [CrossRef]
- Ren, T.; Dang, Y.; Xiao, Y.; Hu, Q.; Deng, D.; Chen, J.; He, P. Depositing Ag nanoparticles on g-C3N4 by facile silver mirror reaction for enhanced photocatalytic hydrogen production. Inorg Chem Commun 2021, 123, 108367. [Google Scholar] [CrossRef]
- Li, X.; Liu, T.; Tian, F.; Tao, X.; Wu, Z.S. Enhanced carrier transport and visible light response in CA-β-CD/g-C3N4/Ag2O 2D/0D heterostructures functionalized with cyclodextrin for effective organic degradation. Korean J Chem Eng 2022, 39, 2972–2982. [Google Scholar] [CrossRef]
- Yu, X.; Zhang, X.; Zhao, J.; Xu, L.; Yan, J. Flower-like shaped Bi12TiO20/g-C3N4 heterojunction for effective elimination of organic pollutants: preparation, characterization, and mechanism study. Appl Organomet Chem. 2020, 34, 0268–2605. [Google Scholar] [CrossRef]
- Mao, N.; Jiao, Y.; Duan, X. g-C3N4/ZnO heterojunction as Fenton-like catalyst for degradation of organic pollution. Mater Res Bull 2022, 151, 111818. [Google Scholar] [CrossRef]
- Zhu, X.; Deng, H.; Cheng, G. Facile construction of g-C3N4-W18O49 heterojunction with improved charge transfer for solar-driven CO2 photoreduction. Inorg Chem Commun. 2021, 132, 108814. [Google Scholar] [CrossRef]
- Huang, M.; Chen, C.; Wang, T.; Sui, Q.; Zhang, K.; Li, B. Cadmium-sulfide/gold/graphitic-carbon-nitride sandwich heterojunction photocatalyst with regulated electron transfer for boosting carbon-dioxide reduction to hydrocarbon. J Colloid Interf Sci. 2022, 613, 575–586. [Google Scholar] [CrossRef] [PubMed]
- Zhang, R.; Cao, Y.; Doronkin, D.; Ma, M.; Dong, F.; Zhou, Y. Single-atom dispersed Zn-N3 active sites bridging the interlayer of g-C3N4 to tune NO oxidation pathway for the inhibition of toxic by-product generation. Chem Eng J 2023, 454, 140084. [Google Scholar] [CrossRef]
- Liang, Y.; Zeng, Z.; Yang, J.; Yang, G.; Han, Y. Designing heterointerface in BiOBr/ g-C3N4 photocatalyst to enhance visible-light-driven photocatalytic performance in water purification. Colloid Surface A 2021, 624, 126796. [Google Scholar] [CrossRef]
- Ni, Y.; Wang, M.; Liu, L.; Li, M.; Hu, S.; Lin, J.; Sun, J.; Yue, T.; Zhu, M.; Wang, J. Efficient and reusable photocatalytic river water disinfection by addictive graphitic carbon nitride/magnesium oxide nano-onions with particular “nano-magnifying glass effect”. J Hazard Mater 2022, 439, 129533. [Google Scholar] [CrossRef]
- Rao, F.; Zhong, J.; Li, J. Improved visible light responsive photocatalytic hydrogen production over g-C3N4 with rich carbon vacancies. Ceram Int 2022, 48, 1439–1445. [Google Scholar] [CrossRef]
- Shi, Z.; Rao, L.; Wang, P.; Zhang, L. The photocatalytic activity and purification performance of g-C3N4/carbon nanotubes composite photocatalyst in underwater environment. Environ Sci Pollut R 2022, 29, 83981–83992. [Google Scholar] [CrossRef]
- Cao, J.; Cai, J.; Li, R.; Han, J.; Liu, J.; Huang, M. A novel 3D yolk-double-shell Au@CdS/ g-C3N4 nanostructure with enhanced photoelectrochemical and photocatalytic properties. J Phys Chem C 2022, 126, 4939–4947. [Google Scholar] [CrossRef]
- Saeidpour, S.; Khoshnevisan, B.; Boroumand, Z. Synthesis and characterization of a g-C3N4/TiO2-ZnO nanostructure for photocatalytic degradation of methylene blue. Nano Futures 2022, 6, 035001. [Google Scholar] [CrossRef]
- Liu, F.; Bi, S.; Wang, W.; Duan, Q.; Feng, Y.; Chen, J.; Luo, R.; Huang, Y.; Lee, J. Preparation of a modified g-C3N4 catalyst library and realization of a two-dimensional screening reaction. New J Chem 2021, 45, 2582–2588. [Google Scholar] [CrossRef]
- Deng, L.; Sun, J.; Sun, J.; Wang, X.; Shen, T.; Zhao, R.; Zhang, Y.; Wang, B. Improved performance of photosynthetic H2O2 and photodegradation by K-, P-, O-, and S-co-doped g-C3N4 with enhanced charge transfer ability under visible light. Appl Surf Sci 2022, 597, 153586. [Google Scholar] [CrossRef]
- Ge, Y.; Guo, X.; Zhou, D.; Liu, J. Construction and excellent photoelectric synergistic anticorrosion performance of Z-scheme carbon nitride/tungsten oxide heterojunctions. Nanoscale 2022, 14, 12358–12376. [Google Scholar] [CrossRef] [PubMed]
- Zhou, W.; Lu, S.; Chen, X. Anionic donor-acceptor conjugated polymer dots/g-C3N4 nanosheets heterojunction: High efficiency and excellent stability for co-catalyst-free photocatalytic hydrogen evolution. J Colloid Interf Sci. 2022, 608, 912–921. [Google Scholar] [CrossRef] [PubMed]
- Yan, X.; Xie, M.; Pan, L.; Ai, T.; Li, Z.; Niu, Y. Piezo-photocatalytic activity of NaNbO3/g-C3N4 heterojunction for dye wastewater degradation. Journal of Materials Science: Materials in Electronics 2023, 34, 0957-4522. [Google Scholar] [CrossRef]
- Vavilapalli, D.; Peri, R.; B, M.; Sridharan, K.; Rao, M.; Singh, S. Enhanced photocatalytic and photoelectrochemical performance of KBiFe2O5/g-C3N4 heterojunction photocatalyst under visible light. Physica B: Condensed Matter 2023, 648, 414411. [Google Scholar] [CrossRef]
- Huang, Y.; Li, B.; Wu, F.; Yang, B. Fabrication of novel flower-like Co3O4/g-C3N4 heterojunction for tetracycline degradation under visible light irradiation. Materials Letters 2022, 311, 131538. [Google Scholar] [CrossRef]
- Wang, Z.; Zhang, J.; Ji, X.; Wu, H.; Xu, X.; Zhan, J.; Shi, H.; Liu, W.; Tang, T. Construction of CdSe/ZnIn2S4 Z-Scheme heterojunction for enhanced photocatalytic degradation of tetracycline. Mater Sci Eng B-Adv 2022, 286, 116065. [Google Scholar] [CrossRef]
- Yang, N.; Li, J. Construction of a 0D/2D heterojunction based on ZnO nanoparticles and ZnIn2S4 nanosheets to improve photocatalytic degradation efficiency. Opt Mater 2021, 115, 111040. [Google Scholar] [CrossRef]
- Wang, Z.; Su, B.; Xu, J.; Hou, Y.; Ding, Z. Direct Z-scheme ZnIn2S4/LaNiO3 nanohybrid with enhanced photocatalytic performance for H2 evolution. Int J Hydrogen Energ 2020, 45, 4113–4121. [Google Scholar] [CrossRef]
- Zhu, J.; Li, H.; Cui, X.; Yang, Z.; Chen, B.; Li, Y.; Zhang, P.; Li, J. Efficient photocathodic protection performance of ZnIn2S4 nanosheets/SnO2 quantum dots/TiO2 nanotubes composite for 316 SS under visible light. J Alloy Compd 2022, 926, 166901. [Google Scholar] [CrossRef]
- Cao, S.; Yu, J.; Wageh, S.; Al-Ghamdi, A.; Mousavi, M.; Ghasemi, J.; Xu, F. H2-production and electron-transfer mechanism of a noble-metal-free WO3@ZnIn2S4 S-scheme heterojunction photocatalyst. Journal of Materials Chemistry A 2022, 10, 17174–17184. [Google Scholar] [CrossRef]
- Wang, K.; Shao, X.; Cheng, Q.; Li, K.; Le, X.; Wang, G.; Wang, H. In situ-Illuminated X-Ray photoelectron spectroscopy investigation of S-scheme Ta2O5/ZnIn2S4 core-shell hybrid nanofibers for highly efficient solar-driven CO2 overall splitting. Solar Rrl 2022, 6, 2367-198X. [Google Scholar] [CrossRef]
- Zhang, L.; Qiu, J.; Dai, D.; Zhou, Y.; Liu, X.; Yao, J. Cr-metal-organic framework coordination with ZnIn2S4 nanosheets for photocatalytic reduction of Cr(VI). Journal of Cleaner Production 2022, 341, 130891. [Google Scholar] [CrossRef]
- Dang, X.; Xie, M.; Dai, F.; Guo, J.; Liu, J.; Lu, X. Ultrathin 2D/2D ZnIn2S4/g-C3N4 nanosheet heterojunction with atomic-level intimate interface for photocatalytic hydrogen evolution under visible light. Adv Mater Interfaces 2021, 8, 2196-7350. [Google Scholar] [CrossRef]
- Hou, L.; Li, W.; Wu, Z.; Wei, Q.; Yang, H.; Jiang, Y.; Wang, T.; Wang, Y.; He, Q. Embedding ZnCdS@ZnIn2S4 into thiazole-modified g-C3N4 by electrostatic self-assembly to build dual Z-scheme heterojunction with spatially separated active centers for photocatalytic H2 evolution and ofloxacin degradation. Separation and Purification Technology 2022, 290, 120858. [Google Scholar] [CrossRef]
- Li, Y.; Lu, Y.; Wang, Y.; Dong, L.; Chao, M.; Sun, J.; Zhao, Z.; Zhang, J. One-step synthesis of high photocatalytic graphitic carbon nitride porous nanosheets. Nanotechnology 2020, 31, 0957-4484. [Google Scholar] [CrossRef] [PubMed]
- Ai, L.; Fan, H. CTAB-melamine molecular crystals as precursor for synthesis of layered carbon nitride porous nanostructures with enhanced photocatalytic activity for hydrogen production. Mater Today Commun 2021, 29, 102780. [Google Scholar] [CrossRef]
- Zhu, K.; Luan, X.; Matras-Postolek, K.; Yang, P. 2D/2D MoS2/g-C3N4 layered heterojunctions with enhanced interfacial electron coupling effect. J Electroanal Chem 2021, 893, 115350. [Google Scholar] [CrossRef]
- Kesir, M.; Yildiz, I.; Bilgen, S.; Sokmen, M. Role of a novel cationic gemini surfactant (CGS) on a one-step sol-gel process and photocatalytic properties of TiO2 powders. J Water Health 2022, 20, 1629–1643. [Google Scholar] [CrossRef]
- Wang, X.; Chen, X.; Thomas, A.; Fu, X.; Antonietti, M. Metal-containing carbon nitride compounds: A new functional organic-metal hybrid material. Adv Mater 2009, 21, 1609-+. [Google Scholar] [CrossRef]
- Wang, X.; Maeda, K.; Thomas, A.; Takanabe, K.; Xin, G.; Carlsson, J.; Domen, K.; Antonietti, M. A metal-free polymeric photocatalyst for hydrogen production from water under visible light. Nature Materials 2009, 8, 76–80. [Google Scholar] [CrossRef] [PubMed]
- Jo, W.; Natarajan, T. Influence of TiO2 morphology on the photocatalytic efficiency of direct Z-scheme g-C3N4/TiO2 photocatalysts for isoniazid degradation. Chem Eng J 2015, 281, 549–565. [Google Scholar] [CrossRef]
- Guo, F.; Huang, X.; Chen, Z.; Cao, L.; Cheng, X.; Chen, L.; Shi, W. Construction of Cu3P-ZnSnO3-g-C3N4 p-n-n heterojunction with multiple built-in electric fields for effectively boosting visible-light photocatalytic degradation of broad-spectrum antibiotics. Sep Purif Technol 2021, 265, 118477. [Google Scholar] [CrossRef]
- Zhang, W.; Shi, W.; Sun, H.; Shi, Y.; Luo, H.; Jing, S.; Fan, Y.; Guo, F.; Lu, C. Fabrication of ternary CoO/g-C3N4/Co3O4 nanocomposite with p-n-p type heterojunction for boosted visible-light photocatalytic performance. J Chem Technol Biot 2021, 96, 1854–1863. [Google Scholar] [CrossRef]
- Ni, T.; Yang, Z.; Cao, Y.; Lv, H.; Liu, Y. Rational design of MoS2/g-C3N4/ZnIn2S4 hierarchical heterostructures with efficient charge transfer for significantly enhanced photocatalytic H2 production. Ceram Int 2021, 47, 22985–22993. [Google Scholar] [CrossRef]
- Ye, X.; Zhu, T.; Hui, Z.; Wang, X.; Wei, J.; Chen, S. Revealing the transfer mechanisms of photogenerated charge carriers over g-C3N4/ZnIn2S4 composite: A model study for photocatalytic oxidation of aromatic alcohols with visible light. J Catal 2021, 401, 149–159. [Google Scholar] [CrossRef]
- Fu, D.; Han, G.; Liu, F.; Xiao, Y.; Wang, H.; Liu, R.; Liu, C. Visible-light enhancement of methylene blue photodegradation by graphitic carbon nitride-titania composites. Materials Science in Semiconductor Processing 2014, 27, 966–974. [Google Scholar] [CrossRef]
- Wang, F.; Zhao, Y.; Zhang, M.; Wu, J.; Liu, G.; He, P.; Qi, Y.; Li, X.; Zhou, Y.; Li, J. Bimetallic sulfides ZnIn2S4 modified g-C3N4 adsorbent with wide temperature range for rapid elemental mercury uptake from coal-fired flue gas. Chem Eng J 2021, 426, 131343. [Google Scholar] [CrossRef]
- Yang, L.; Zhao, J.; Wang, Z.; Wang, L.; Zhao, Z.; Li, S.; Li, G.; Cai, Z. Facile construction of g-C3N4/ZnIn2S4 nanocomposites for enhance Cr(VI) photocatalytic reduction. Spectrochim Acta A 2022, 276, 121184. [Google Scholar] [CrossRef]
- Zheng, H.; Liu, Y.; Zhou, Y.; Zhao, D.; Wang, D.; Yun, L.; Zhang, D.; Zhang, L. Improved photocathodic protection performance of g-C3N4/rGO/ZnS for 304 stainless steel. J Phys Chem Solids 2021, 148, 109672. [Google Scholar] [CrossRef]
- Mishra, N.; Kuila, A.; Saravanan, P.; Bahnemann, D.; Jang, M.; Routu, S. Simultaneous S-scheme promoted Ag@AgVO3/g-C3N4/CeVO4 heterojunction with enhanced charge separation and photo redox ability towards solar photocatalysis. Chemosphere 2023, 326, 138496. [Google Scholar] [CrossRef] [PubMed]
- Rajendran, R.; Vignesh, S.; Sasireka, A.; Priya, P.; Suganthi, S.; Raj, V.; Sundar, J.K.; Srinivasan, M.; Shkir, M.; AlFaify, S. Investigation on novel Cu2O modified g-C3N4/ZnO heterostructures for efficient photocatalytic dye degradation performance under visible-light exposure. Colloid Interfac Sci. 2021, 44, 100480. [Google Scholar] [CrossRef]
- Wu, B.; Shan, C.; Zhang, X.; Zhao, H.; Ma, S.; Shi, Y.; Yang, J.; Bai, H.; Liu, Q. CeO2/Co3O4 porous nanosheet prepared using rose petal as biotemplate for photo-catalytic degradation of organic contaminants. Appl Surf Sci. 2021, 543, 148677. [Google Scholar] [CrossRef]
- Sivanandan, V.; Prasad, A. Lactose monohydrate (C12H22O11 center dot H2O) mediated synthesis and spectral analysis of nanocrystalline Ni0.5Cu0.5Fe2O4. International Journal of Materials Research 2021, 112, 980–984. [Google Scholar]
- Huang, X.; Xu, X.; Yang, R.; Fu, X. Synergetic adsorption and photocatalysis performance of g-C3N4/Ce-doped MgAl-LDH in degradation of organic dye under LED visible light. Colloid Surface A 2022, 643, 12873. [Google Scholar] [CrossRef]
- Hoang, T.; Nguyen, P.; Shin, E. Effect of morphological modification over g-C3N4 on photocatalytic hydrogen evolution performance of g-C3N4-Pt photocatalysts. Catalysts 2023, 13, 10092. [Google Scholar] [CrossRef]
- Zhang, T.; Liu, Y.; Liang, J.; Wang, D. Enhancement of photoelectrochemical and photocathodic protection properties of TiO2 nanotube arrays by simple surface UV treatment. Appl Surf Sci. 2017, 394, 440–445. [Google Scholar] [CrossRef]
- Tian, J.; Chen, Z.; Ma, L.; Hou, J.; Feng, C.; Jing, J.; Sun, M.; Chen, D. Fabrication of flower-like WO3/ZnIn2S4 composite with special electronic transmission channels to improve carrier separation for photoinduced cathodic protection and electron storage. Appl Surf Sci. 2023, 607, 155019. [Google Scholar] [CrossRef]
- Gong, D.; Xu, S.; Zhang, K.; Du, L.; Qiu, P. Enhancing photoelectrochemical cathodic protection performance by facile tuning sulfur redox state in sacrificial agents. Chem Eng J 2023, 451, 138552. [Google Scholar] [CrossRef]
- Yang, Z.; Li, H.; Cui, X.; Zhu, J.; Li, Y.; Zhang, P.; Li, J. Direct Z-scheme nanoporous BiVO4/CdS quantum dots heterojunction composites as photoanodes for photocathodic protection of 316 stainless steel under visible light. Appl Surf Sci. 2022, 603, 154394. [Google Scholar] [CrossRef]
- Kathiravan, S.; Kaliaraj, G.; Kumar, R.; Kirubaharan, A. A novel experimental setup for in situ oxidation behavior study of Nb/Hf/Ti (C-103) alloy for high temperature environments. Materials Letters 2021, 302, 130336. [Google Scholar] [CrossRef]
- Igbari, F.; Essien, E.; Abdulwahab, K.; Nejo, A.; Adetona, A.; Adams, L.A. Bipolar conductivity in amorphous Cu-Al-O thin films prepared by r.f. magnetron sputtering. Materials Science in Semiconductor Processing 2021, 123, 105557. [Google Scholar] [CrossRef]
- Duan, Z.; Zhao, X.; Chen, L. BiVO4/Cu0.4V2O5 composites as a novel Z-scheme photocatalyst for visible-light-driven CO2 conversion. J Environ Chem Eng 2021, 9, 104628. [Google Scholar] [CrossRef]
- Wang, W.; Feng, X.; Chen, L.; Zhang, F. Z-Scheme Cu2O/Bi/BiVO4 nanocomposite photocatalysts: synthesis, characterization, and application for CO2 photoreduction. Ind Eng Chem Res 2021, 60, 18384–18396. [Google Scholar] [CrossRef]
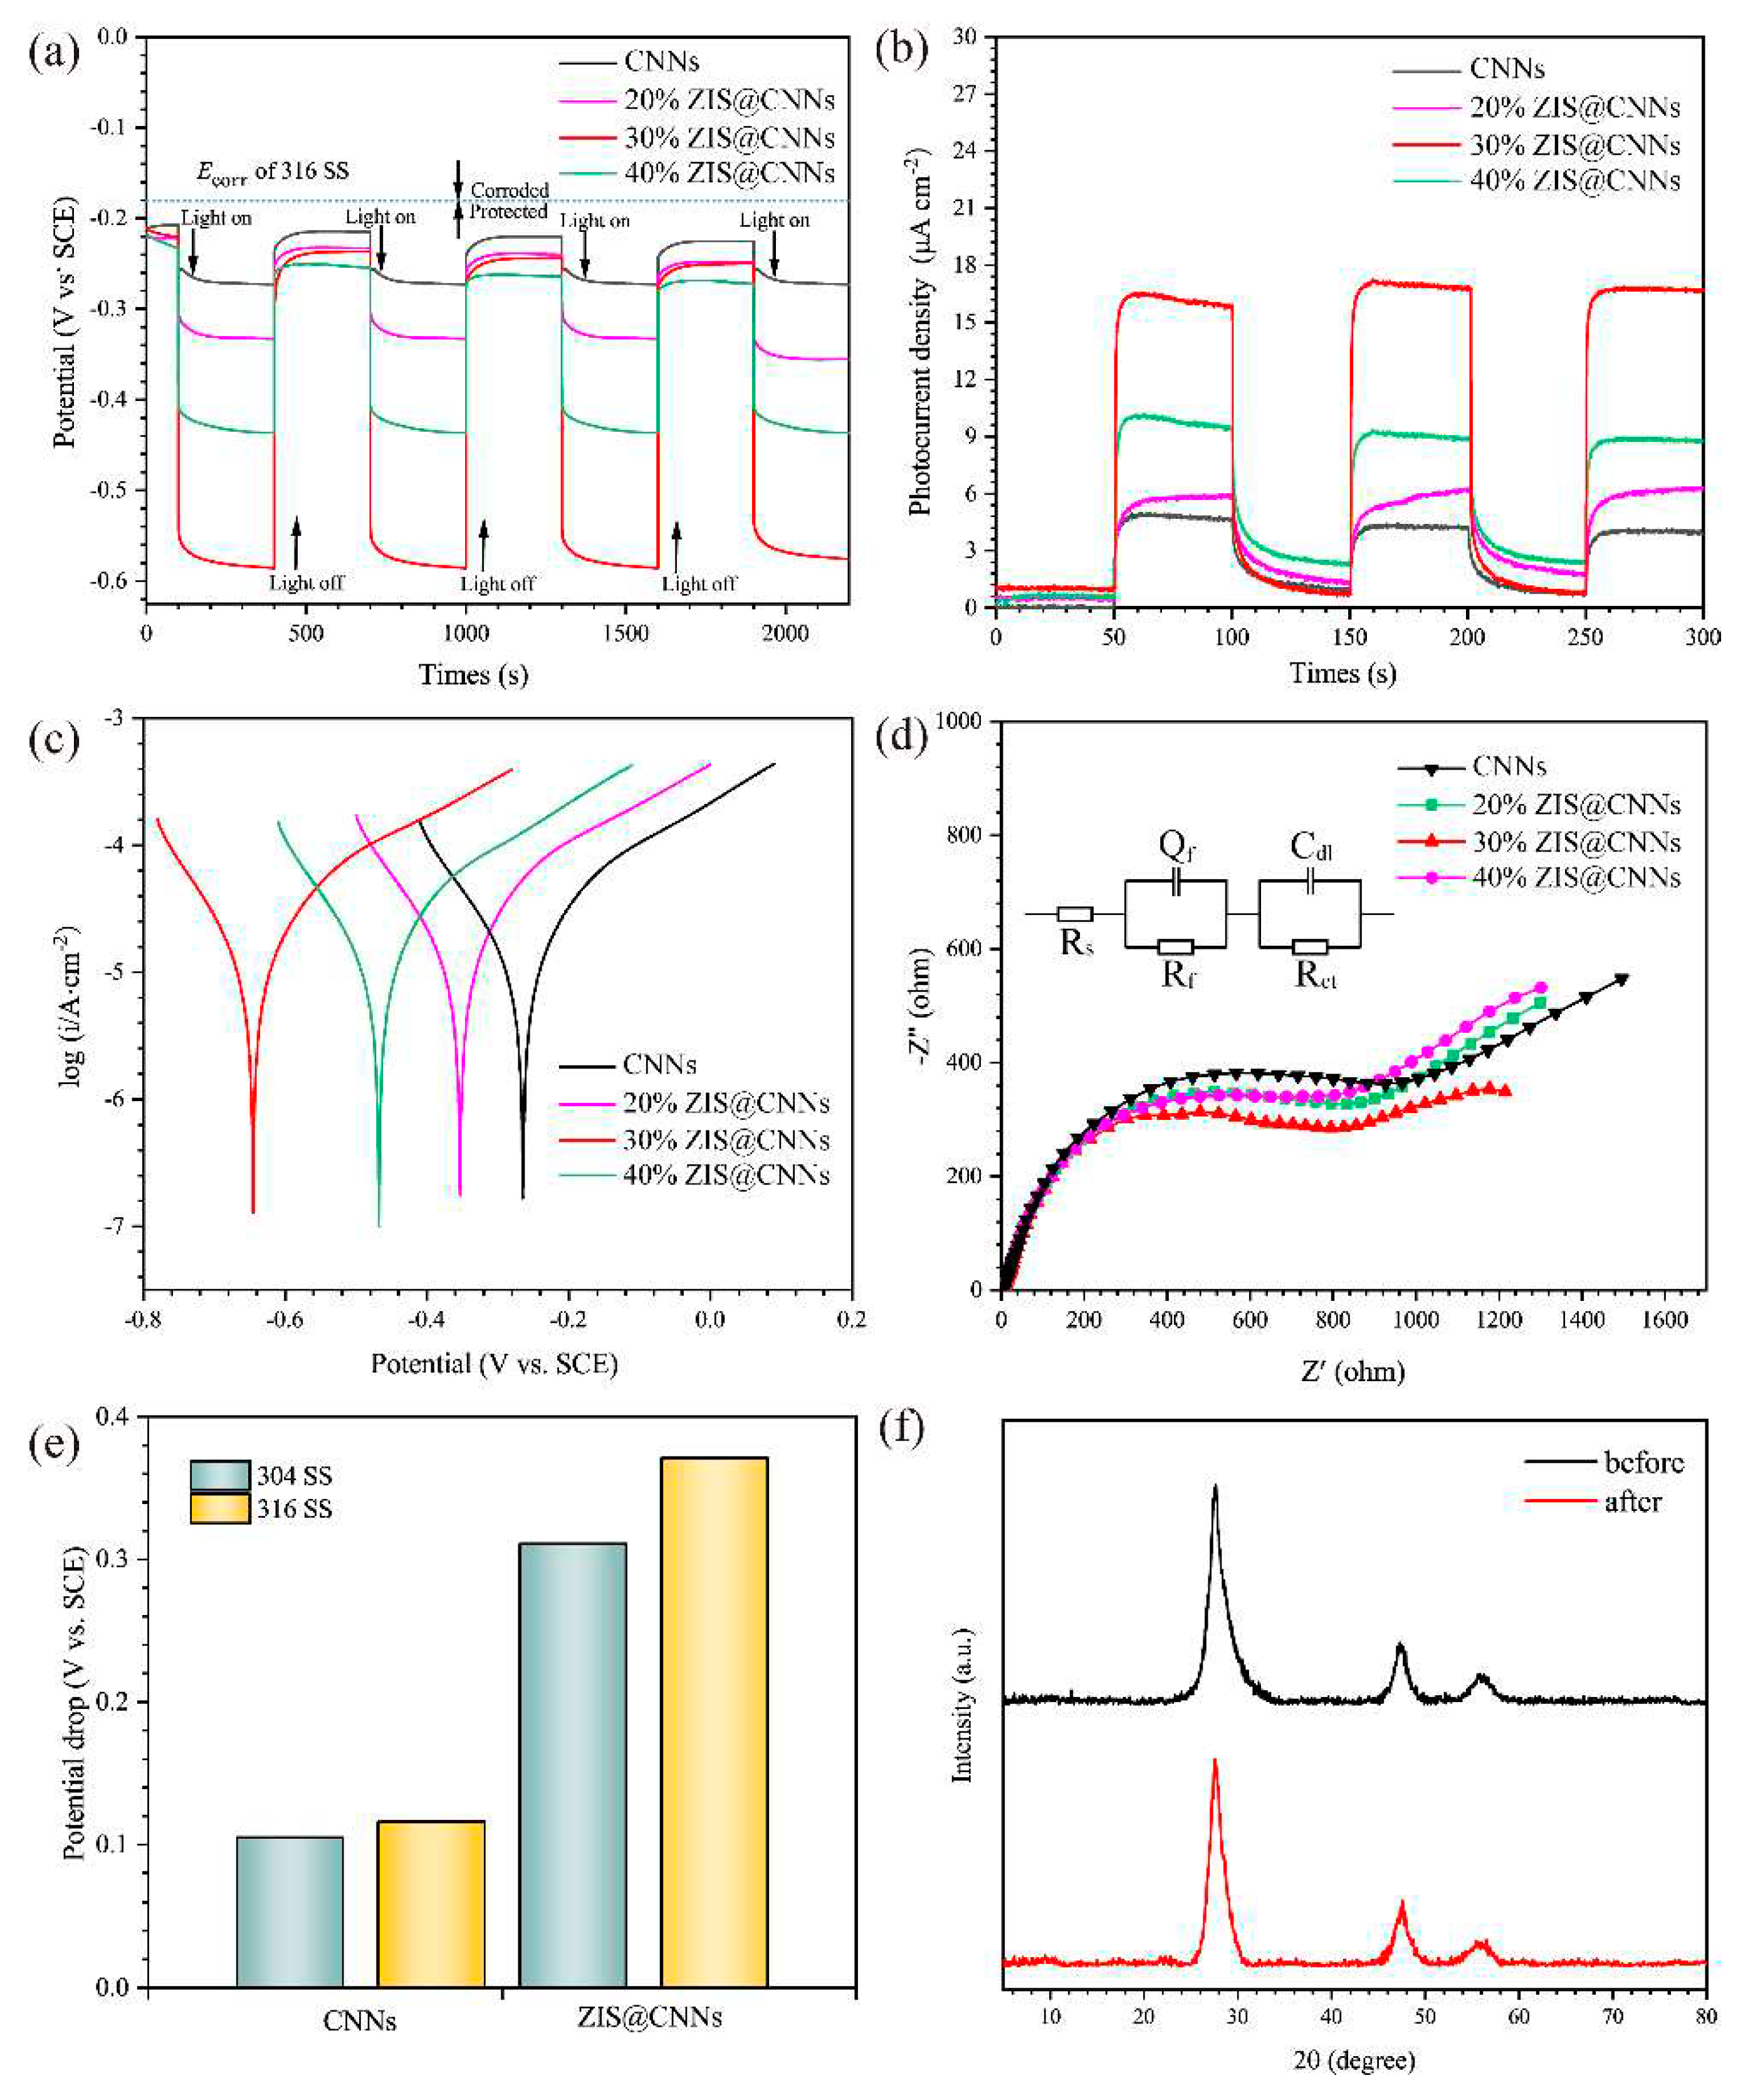
| Samples | Ecorr (V vs. SCE) | icorr (μA cm−2) |
|---|---|---|
| CNNs | −0.271 | 4.08 |
| 20% ZIS@CNNs | −0.332 | 6.46 |
| 30% ZIS@CNNs | −0.62 | 13.54 |
| 40% ZIS@CNNs | −0.434 | 10.93 |
| Rs (Ω cm−2) | Qf (F·cm−2·10−2) | Rf (Ω cm−2) | Cdl (F·cm−2·10−2) | Rct (Ω cm−2) |
|
|---|---|---|---|---|---|
| CNNs | 4.605 | 5.411×10⁻² | 948.7 | 0.01807 | 934.1 |
| 20% ZIS@ CNNs | 4.574 | 4.983×10⁻² | 976.3 | 0.02 | 874.2 |
| 30% ZIS@ CNNs | 4.278 | 1.803×10⁻³ | 1590 | 3.916×10⁻⁴ | 426.5 |
| 40% ZIS@ CNNs | 2.709 | 4.235×10⁻³ | 1135.3 | 2.721×10⁻⁴ | 556.6 |
Disclaimer/Publisher’s Note: The statements, opinions and data contained in all publications are solely those of the individual author(s) and contributor(s) and not of MDPI and/or the editor(s). MDPI and/or the editor(s) disclaim responsibility for any injury to people or property resulting from any ideas, methods, instructions or products referred to in the content. |
© 2023 by the authors. Licensee MDPI, Basel, Switzerland. This article is an open access article distributed under the terms and conditions of the Creative Commons Attribution (CC BY) license (http://creativecommons.org/licenses/by/4.0/).


